 Anna M. Lewandowska-Sabat
 Siri Fjellheim
 Jorunn E. Olsen
 Odd A. Rognli
- Department of Plant Sciences, Faculty of Biosciences, Norwegian University of Life Sciences, Ås, Norway
Adaptation of plants to local conditions that vary substantially within their geographic range is essential for seasonal timing of flowering, a major determinant of plant reproductive success. This study investigates photoperiodic responses in natural populations of Arabidopsis thaliana from high northern latitudes and their significance for local adaptation. Thirty lineages from ten local A. thaliana populations, representing different locations across an altitudinal gradient (2–850 m a.s.l.) in Norway, were grown under uniform controlled conditions, and used to screen for responses to five different photoperiods. We studied relationships between variation in photoperiodic sensitivity of flowering time, altitude, and climatic factors associated with the sites of origin. We found that variation in response to photoperiod is significantly correlated with altitude and climatic variables associated with the sites of origin of the populations. Populations originating from lower altitudes showed stronger photoperiodic sensitivity than populations from higher altitudes. Our results indicate that the altitudinal climatic gradient generates clinal variation in adaptive traits in A. thaliana.
Introduction
Photoperiod is an environmental cue that many organisms use to regulate seasonal changes in behavior, migration, and reproduction (Kardailsky et al., 1999; Yano et al., 2000; Bradshaw and Holzapfel, 2001; O’Malley and Banks, 2008; Zhang et al., 2008). At temperate and subarctic latitudes, photoperiod, light quality, and temperature are major environmental signals that plants sense in order to synchronize their flowering time with the changing seasons (Bradshaw et al., 2004; Putterill et al., 2004; Andres and Coupland, 2012; Song et al., 2013). Variation in flowering time of plants contributes to local adaptation to different growth conditions, and hence clinal variation in flowering time is believed to be a sign of adaptive evolution (Endler, 1977).
Arabidopsis thaliana is a facultative long-day plant and flowering time in response to photoperiod has been studied extensively (Lee and Amasino, 1995; Onouchi and Coupland, 1998; Simpson and Dean, 2002; El-Assal et al., 2003; Shindo et al., 2005; Balasubramanian et al., 2006; Schwartz et al., 2009; Giakountis et al., 2010). Since it is crucial for populations originating from higher northern latitudes to reproduce at a proper time of the year, one would expect that they are more sensitive to changes in photoperiod than populations from lower latitudes. However, contradictory findings have been reported. Banta et al. (2007) observed that the fitness (individual reproductive success) of accessions from Northern and Southern Europe did not differ under different photoperiods. Moreover, Samis et al. (2008) observed that photoperiodic responses in Eurasian A. thaliana accessions correlated with longitude, and not with latitude. However, latitudinal clines in flowering time (Stinchcombe et al., 2004; Hopkins et al., 2008), hypocotyl length in response to red and far-red light (Stenøien et al., 2002), altitudinal clines in life history traits (Montesinos-Navarro et al., 2010), and flowering time in response to vernalization have been demonstrated (Lewandowska-Sabat et al., 2012).
On a continental-wide scale, essential climatic factors vary with latitude and therefore latitudinal coordinates may be a significant proxy for climatic factors such as temperature and photoperiod. However, on smaller geographic scales, transects are present at the same latitude, e.g., due to climatic gradients related to the distance from the ocean or altitude. In these cases, latitude is not a suitable proxy for ecologically important environmental cues. Furthermore, an earlier study in our group found that altitude, and not latitude, is a better proxy for environmental cues at the northernmost range of distribution of a species, like A. thaliana at higher northern latitudes (Lewandowska-Sabat et al., 2012). Due to the influence of the North Atlantic Current, the temperature fluctuates during the winter season in coastal and low-altitude regions of Norway and the precipitation comes not only in the form of snow but more often in the form of rain, sleet and hail. Moderate winter temperatures, and increased winter and yearly precipitation characterize these locations. On the contrary, in regions at higher altitudes, stable low temperatures during the winter season and moderate winter and yearly precipitation result in a long lasting snow cover. In the same way as environmental cues, varying across broad geographic regions, will impose natural selection on flowering time (Engelmann and Purugganan, 2006; Hall and Willis, 2006; Verhoeven et al., 2008); we expect populations originating from restricted geographical regions, that experience extensive variation in environmental cues but also share a common demographic history, to be under selection and thus be ideal for detecting signs of local adaptation.
The photoperiod that plants experience during the growing season at higher northern latitudes depends not only on latitude of origin but also on the duration of the snow cover, determined by temperature and precipitation during autumn and winter. In the present study, we used lineages derived from high and low altitude local populations of A. thaliana from Norway, which represent the northernmost distribution (59–68°N) of the species. We determined photoperiodic flowering time responses by exposing plants to five different photoperiodic treatments under controlled growth conditions and scored flowering time responses, i.e., days to bolting, days to flowering, rosette leaf numbers at bolting, and flower stem length. The aim of this study was to test for relationships between variation in these flowering time responses and altitude at the site of origin of the populations, and characterize the relationship between climatic factors and variation in photoperiodic sensitivity.
Materials and Methods
Plant Material and Photoperiodic Response Experiment
Ten local populations of Arabidopsis thaliana (L.) Heyhn, collected from high and low altitude locations in Norway, were used in this study (Table 1 and Figure 1). From each site, 8–20 individuals were collected as adult plants with siliques to represent the local populations. Seeds from these individuals were propagated through a previous vernalization experiment (Lewandowska-Sabat et al., 2012). Lineages were established from the populations by single seeds picked from separate plants. Individual plants within the lineages were obtained by selfing.
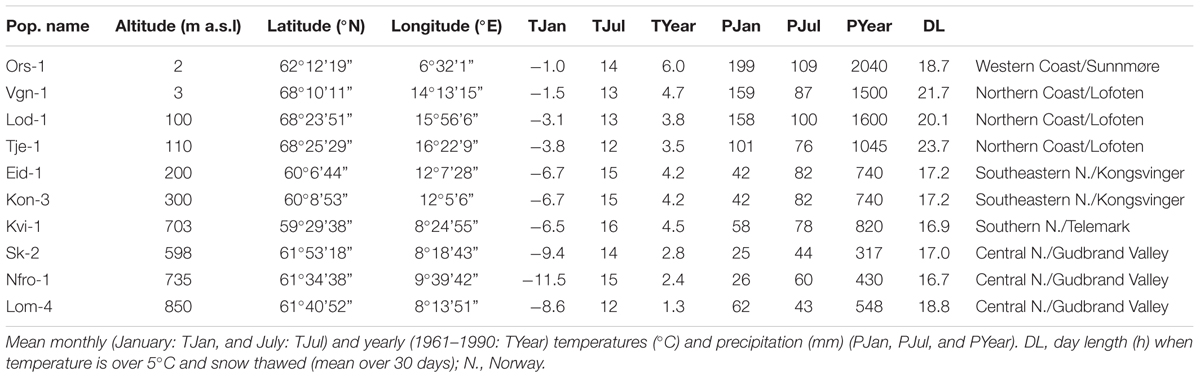
TABLE 1. Collection and climate data for Norwegian populations of Arabidopsis thaliana used in the study.
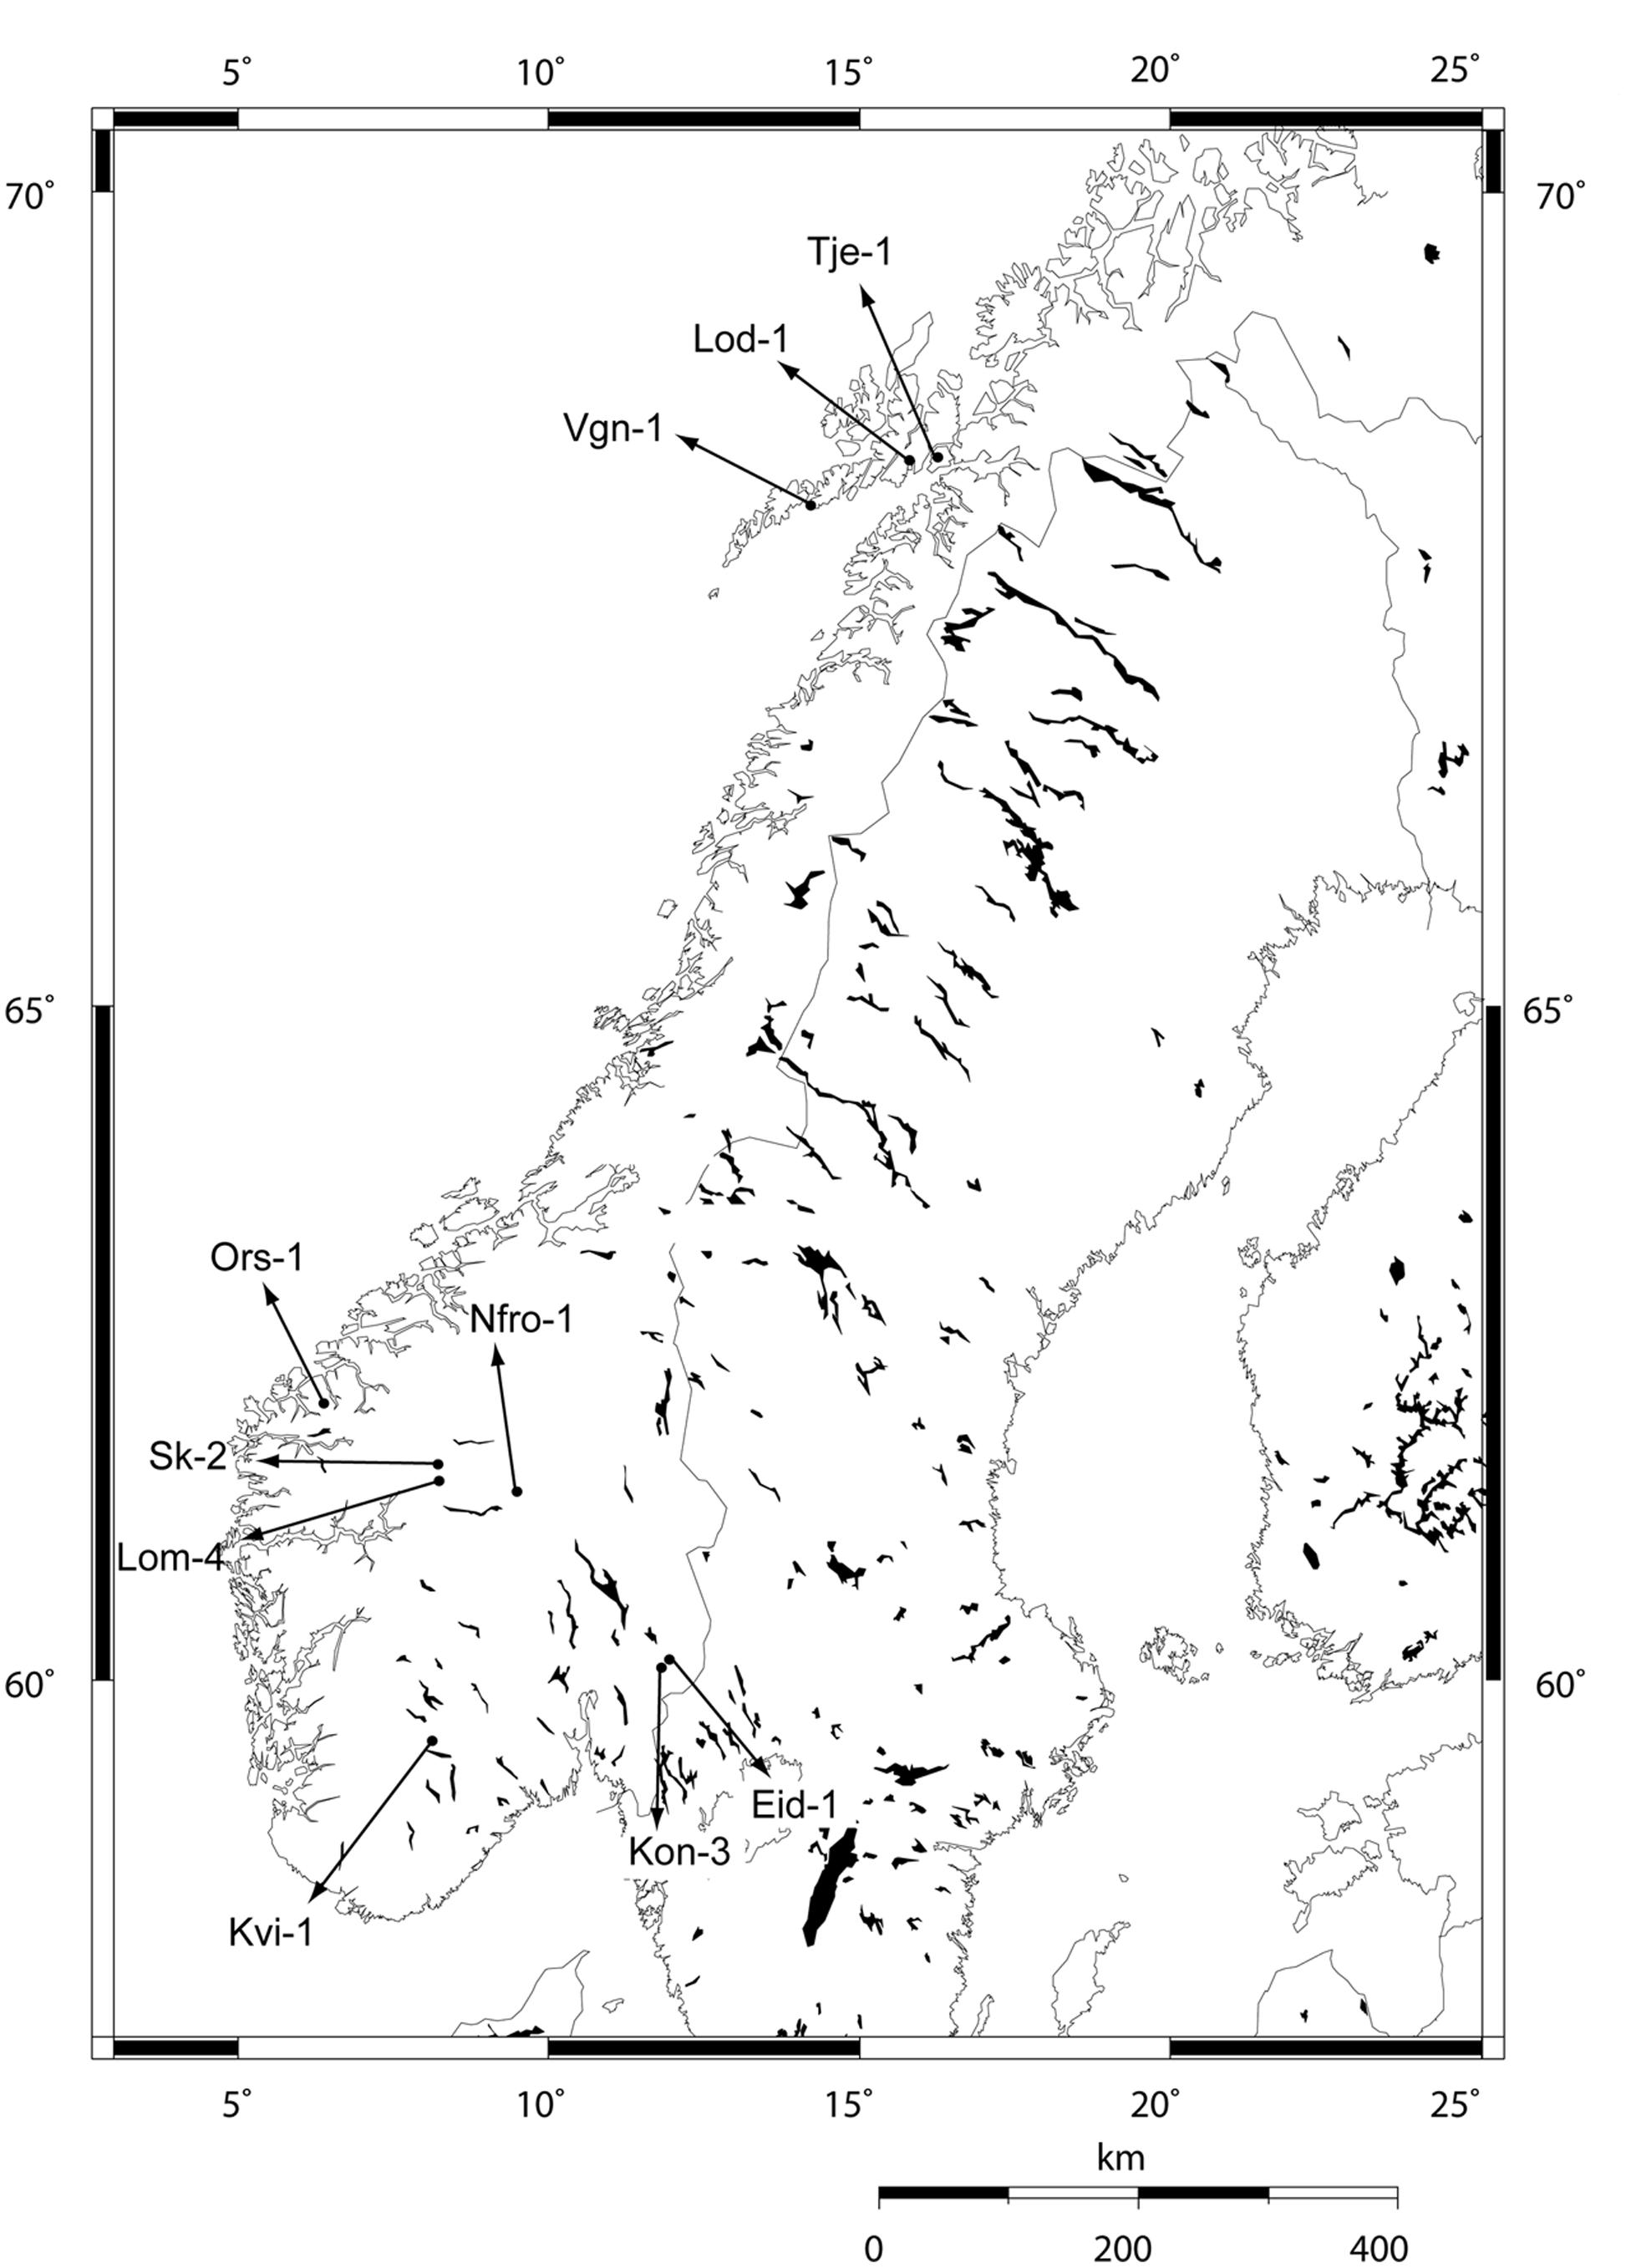
FIGURE 1. Collection sites of Norwegian Arabidopsis thaliana populations investigated in the study.
Screening of response to five different photoperiods (8, 16, 19, 21, and 24 h) was performed using three lineages per population and five individual plants (replicates) per lineage in each treatment. The specific photoperiods (16–24 h) were used in order to cover the full spectrum of photoperiods that the populations experience in their geographic areas of origin. The 8 h photoperiod was included as a reference short day (SD) treatment. Seeds were sown in soil (Hasselfors Garden AB, Örebro, Sweden) in pots of 6.5 cm diameter, and stratified at 4°C for 4 days in darkness to equalize the germination time. After stratification the plants were placed in a growth chamber at 23°C/8 h photoperiod with a photon flux density of 150 ± 10 μmol m-2 s-1 at 400–700 nm for 13 days in order to initiate the germination. SD was used during germination to avoid possible long-day induction of flowering already during or shortly after germination. Plants were then vernalized at 4°C under an 8 h photoperiod with a photon flux density of 50 ± 5 μmol m-2 s-1 for 14 weeks in order to saturate the vernalization requirement for all lineages completely (Lewandowska-Sabat et al., 2012) and avoid confounding effects of variation in vernalization requirement on flowering time. The light was provided by HQI lighting systems (LU400/XO/T/40 Philips General Electric, Hungary). After vernalization, the plants were transferred to five growth chambers at 16°C with the following five different day/night regimes (Supplementary Figure S1), i.e., (1) SD of 8 h PAR light (Photosynthetically Active Radiation)/16 h dark; (2) 16 h PAR light/8 h dark; (3) 19 h light [16 h PAR light and 1.5 h incandescent light (IL) before and after the PAR light period]/5 h dark; (4) 21 h light (16 h PAR light and 2.5 h IL before and after the PAR light period)/3 h dark; and (5) 24 h light (16 h PAR light followed by 8 h IL). The irradiance of the PAR and IL was 150 ± 10 μmol m-2 s-1 and 10 ± 2 μmol m-2 s-1, respectively, and light was provided by HQI lighting systems and incandescent bulbs (LU400/XO/T/40 Philips General Electric, Hungary and Osram, Munich, Germany, respectively). Day extension with low-intensity IL was used to avoid confounding effects due to differences in total light sum in addition to differences in day length (DL). This would have been the situation if the main day light source (HQI lamps) was also used to obtain day extensions. Furthermore, the low-intensity and lower red:far-red ratio of IL as compared to the light from HQI lamps, are more similar to the dusk and dawn conditions in nature. Flowering time was scored daily as days to bolting (DTB, date when the length of the bolting stem was approximately 1 cm), days to flowering (DTF, date of first flower to open), rosette leaf number at bolting (RLN) and flower stem length (FSL). Plants were watered every week during vernalization and twice a week during germination and exposure to the different photoperiods.
Climate Data
Climate data for the collection sites were obtained from The Norwegian Meteorological Institute1,2 using data from the meteorological stations closest to the site of origin of the populations. The climate data are mean January, July, and yearly temperatures (°C) and precipitation (mm) for the period 1961–1990 (Table 1). Mean January and July temperatures and precipitations are the best proxies for climatic conditions in Norway, i.e., winter and summer temperature and precipitation fluctuations. Large amounts of precipitation and relatively moderate winter temperatures are characteristic for mild coastal and low-altitude sites, while moderate amounts of precipitation and low winter temperatures are associated with long winters with long lasting snow cover typical for inland and high-altitude sites. DL was calculated as the mean DL for 30 days in the spring with temperature above 5°C and no snow cover.
Statistical Analyses
Days to bolting, days to flowering, rosette leaf number, and flower stem length data from the 8, 16, 19, 21, and 24 h photoperiod treatments were used to determine whether the 30 lineages (five individual plants of each) from 10 populations responded differently to the different photoperiods. ANOVA was used to test the main effects of photoperiod treatment and population, and the population × photoperiod treatment interaction. Significant population × photoperiod treatment interactions for days to bolting, days to flowering, rosette leaf number, and flower stem length indicate that the populations differed in their photoperiod responses. The analyses were performed using PROC ANOVA in SAS version 9.2 (SAS Institute Inc., Cary, NC, United States).
Photoperiodic sensitivity was estimated as responses to increasing photoperiods by dividing the mean values of days to bolting, days to flowering, rosette leaf number, and flower stem length at 8 h photoperiod with the respective mean values recorded at 16, 19, 21, and 24 h yielding the P16, P19, P21, and P24 photoperiodic responses (Supplementary Table S1). Large values indicate large photoperiodic responses, and reciprocal values were used for flower stem length for easier interpretation of the results, i.e., larger values indicating larger responses.
The overall clinal phenotypic variation associated with altitude was tested using a multivariate regression of photoperiodic responses (n = 16) as dependent variables, and altitude as an independent variable. The analyses were performed using the ‘MANOVA’ statement of PROC GLM in SAS version 9.2 (SAS Institute Inc., Cary, NC, United States).
We performed a canonical correlation analysis (CCA) to test the independent contribution of the traits (P16, P19, P21, and P24 for days to bolting, days to flowering, rosette leaf number, and flower stem length, respectively; n = 16) to the multivariate correlation with altitude, and climatic factors, respectively. We used structure correlation coefficients instead of standardized canonical coefficients because standardized canonical coefficients may be subject to multicollinearity and thus lead to incorrect interpretations (Levine, 1977). Structure correlation coefficients were used in order to compare the relative magnitudes of the effects of each trait. The magnitude of a trait’s coefficient shows the extent to which a trait correlates with a climatic gradient after accounting for a relationship between all traits (Scheiner and Gurevitch, 2001). We also used the squared canonical correlation coefficient to assess the proportion of the total variation explained by each variate. The number of variates produced in CCA is equal to the number of variables contained in the smallest matrix. Therefore, only one canonical variate was produced in the analysis with altitude, and seven in the analysis with climatic factors. The analyses were performed using PROC CANCORR in SAS version 9.2 (SAS Institute Inc., Cary, NC, United States). Correlation analyses of the structure correlation coefficients from CCA on altitude and on climatic factors were performed in Microsoft Excel. The association analyses were performed according to Montesinos-Navarro et al. (2010). Log transformed lineages means (n = 30) were used in the analyses.
An earlier study of Norwegian A. thaliana populations showed that latitude was not a good proxy for ecologically important environmental cues and geographical gradients was mainly explained by altitude in the study region (Lewandowska-Sabat et al., 2012). Moreover, the photoperiod that plants are exposed to in the growing season depends on the duration of the snow cover, which is associated with the winter temperatures and precipitation. Therefore, latitude was not included in the present analyses.
Results
Variation in Flowering Time
Reaction norms of days to bolting of the ten local populations are shown in Figure 2. In all lineages flowering was induced in SD of 8 h photoperiod. However, flowering was delayed by 2.7–12.2 days as compared to longer photoperiods and the flowering time under SD was later in low altitude compared to high altitude populations (Figure 2). Days to bolting, days to flowering, rosette leaf number and flower stem length were correlated with each other (data not shown). The reaction norms of days to flowering, rosette leaf number, and flower stem length are presented in the Supplementary Figure S2.
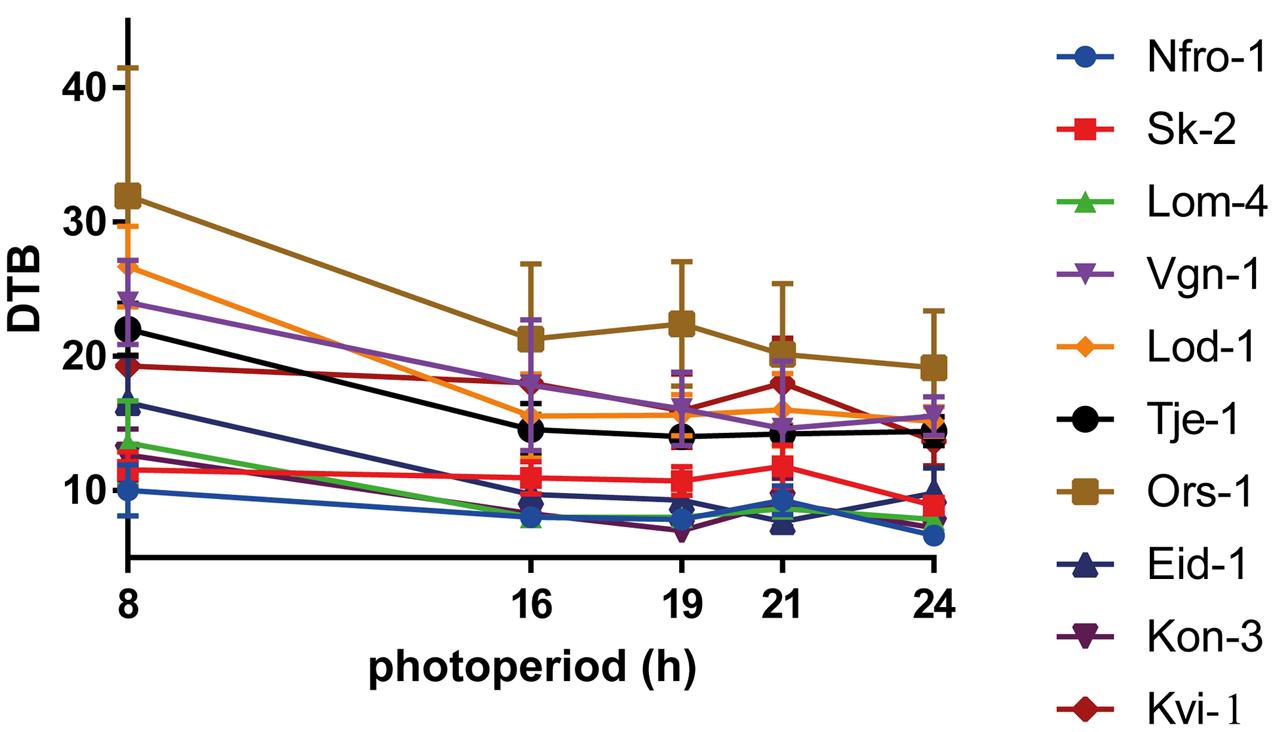
FIGURE 2. Population reaction norms of days to bolting (DTB) in response to 8, 16, 19, 21, and 24 h of photoperiod. Data are presented as population mean values ± SD (n = 15).
Significant variation in days to bolting, days to flowering, rosette leaf number, and flower stem length was found between populations in all treatments (Figure 2 and Supplementary Table S2). Variance analyses showed that the effects of population, photoperiod treatment and population × photoperiod treatment interaction on days to bolting, days to flowering, rosette leaf number, and flower stem length were highly significant (P ≤ 0.0001; Supplementary Table S2). These differential responses indicate that there is genetic variation in responses to photoperiod among local populations.
Phenotypic Variation in Photoperiod Responses Are Associated with Altitude
Multivariate regression analyses of photoperiodic response traits (n = 16) combined with altitude revealed that variation in photoperiod response is significantly associated with altitude (P ≤ 0.001). As revealed by CCA, altitude explained 87% of the multivariate trait variation (CCA; squared canonical correlation = 0.87, P = 0.003). CCA using climatic factors generated two significant variates that explained 98 and 94% of the multivariate trait variation, respectively (squared canonical correlation = 0.98, P ≤ 0.0001 for the first variate, and 0.94 and 0.007 for the second variate). We discuss only the first significant variate. The significant variate describes a climatic gradient mainly characterized by mean January temperature (-0.88), mean January (-0.91), and yearly (-0.86) precipitation, compared to mean July (0.51) and yearly (-0.69) temperatures and mean July precipitation (-0.71) and mean DL at the sites of origin in the spring with temperature above 5°C and no snow cover (-0.46; Table 2). Characterization of the climatic gradient is indicated by higher absolute values of the structure correlation coefficients for January temperature, and January and yearly precipitation, rather than the remaining climatic factors. Along this axis mean winter temperature, as well as mean January and yearly precipitation decreases, which is consistent with the characterization of the climatic gradient associated with altitude in our study area.
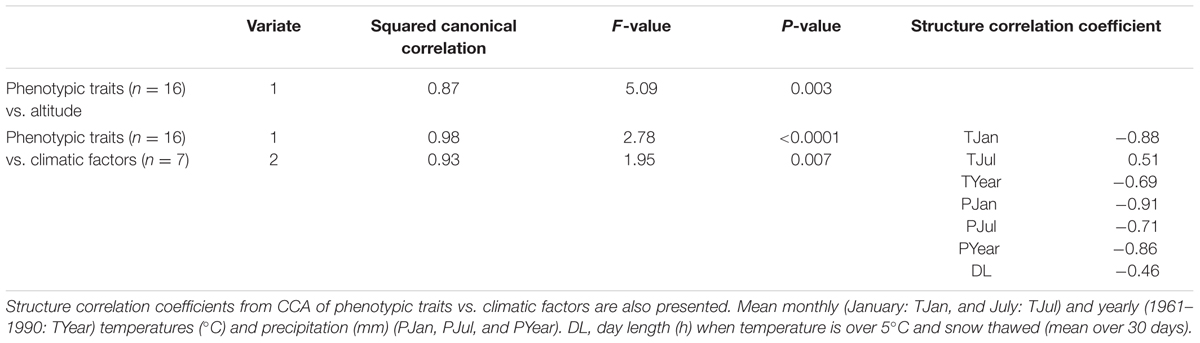
TABLE 2. Canonical correlation analyses (CCA) of phenotypic traits vs. altitude, and phenotypic traits vs. climatic factors.
Table 3 presents the structure correlation coefficients for CCA of traits versus altitude and traits versus seven climatic factors. The magnitude and signs of the structure correlation coefficients for each trait are similar for all CCAs. Coefficients from CCA on altitude and on climatic factors are highly correlated (0.87). Bolting and flowering time (days to bolting and days to flowering) in response to longer photoperiods (16, 19, 21, and 24 h, compared to 8 h) were negatively correlated with altitude (Table 3; except for P24_DTF), i.e., bolting and flowering in response to long photoperiods were more rapid in populations from lower altitudes. Responses of rosette leaf number and flower stem length to longer photoperiods were positively correlated with altitude (Table 3; except for P24_FSL), i.e., in populations from higher altitudes there were fewer rosette leaves and longer flower stem produced in response to longer photoperiods compared to 8 h photoperiod. The highest absolute values of the structure correlation coefficients were found for the responses to 21 h photoperiod versus altitude (Table 3). Flowering in response to 21 h photoperiod (P21_DTF) versus altitude are presented in Supplementary Figure S3 (structure correlation coefficient = -0.47). These analyses confirm that climatic gradients associated with altitude explain a large proportion of variation in photoperiodic response.
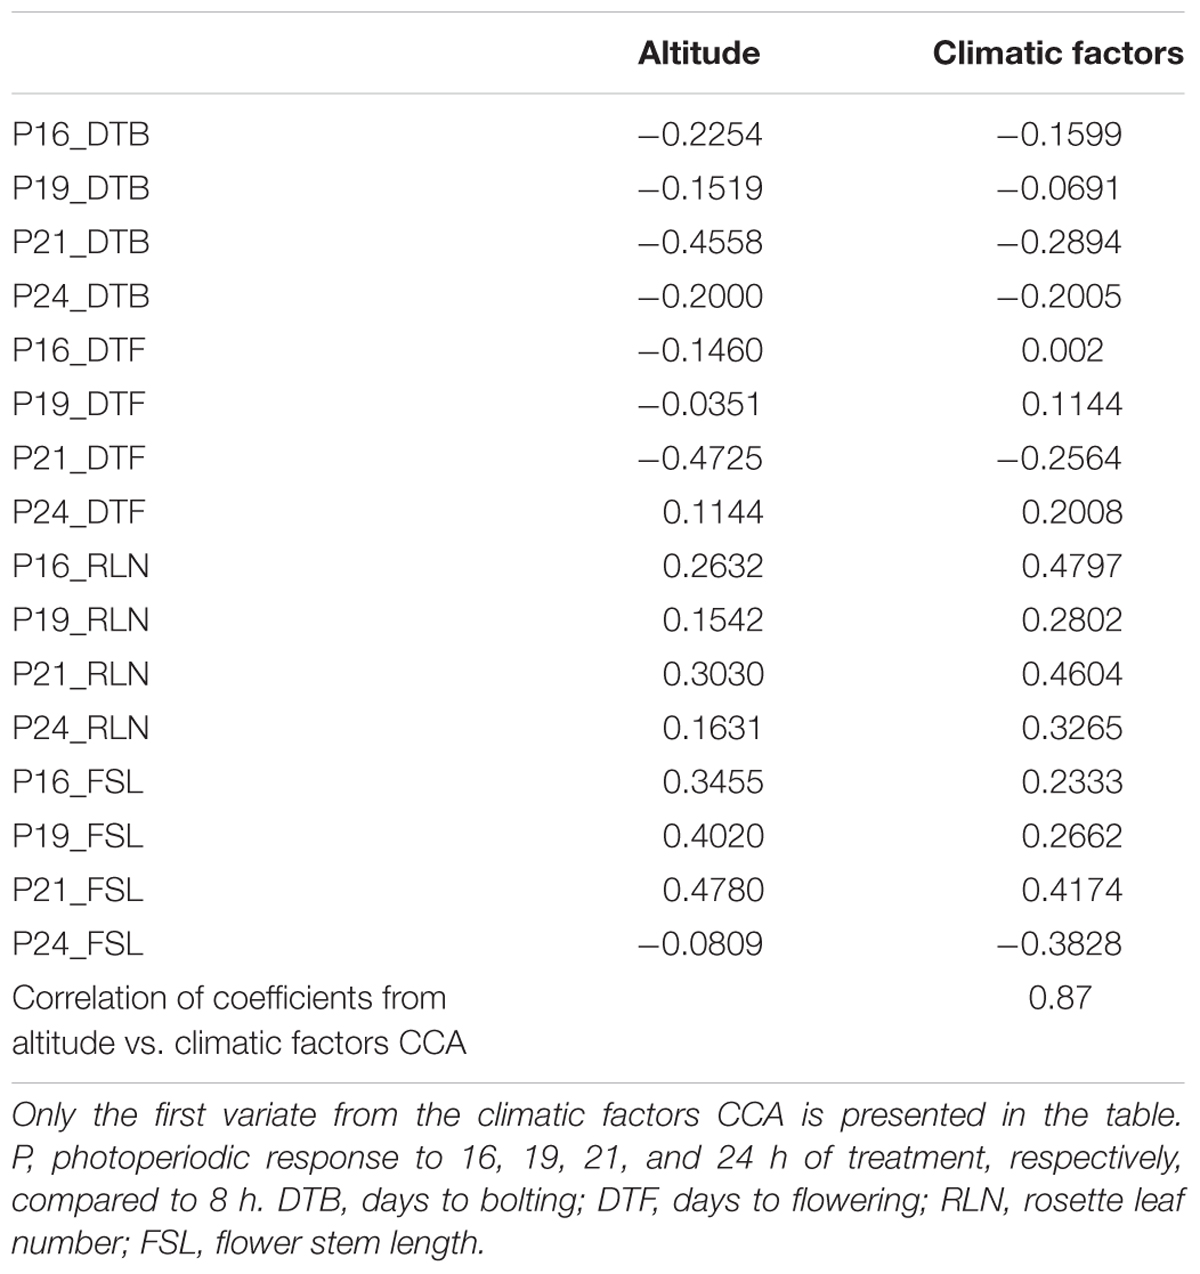
TABLE 3. Structure correlation coefficients for canonical correlation analyses (CCA) of traits vs. altitude and traits vs. seven climatic factors.
Discussion
We have demonstrated that photoperiodic responses in Norwegian populations of A. thaliana originating from its northernmost distribution range were associated with altitude and several climatic factors (Table 3 and Supplementary Figure S3). It is therefore highly likely that climatic factors that are changing with altitude, e.g., winter mean temperatures and precipitation, can impose selection pressures on photoperiodic responses in A. thaliana. All of the populations flowered in SD, which is due to the vernalization treatment they were subjected to prior the exposure to five different photoperiodic treatments. The vernalization treatment of the populations were applied in order to fully saturate their vernalization requirements, as the large majority of the populations did not flower without a prolonged cold treatment requiring 6–9 weeks to fully saturate their vernalization requirement (Lewandowska-Sabat et al., 2012). Despite the fact that the vernalization requirement was fully saturated for all populations, flowering was markedly promoted by increasing the photoperiod from 8 to 16 h (i.e., earlier flowering at 16 compared to 8 h; Figure 2), which indicates that the critical photoperiod for flowering in these populations is between 8 and 16 h (Roberts and Summerfield, 1987; Pouteau et al., 2008; Giakountis et al., 2010).
Although photoperiod is highly associated with latitude of origin, many other environmental factors, not associated with latitude also affect flowering time, survival, and seed production. Consequently, differences in temperature, precipitation, and duration of snow cover during the winter season may create different selective pressure on photoperiodic control of flowering. Longer photoperiods enhanced flowering in populations from lower altitudes (Table 3), and these populations demonstrated lower vernalization requirements in our previous study (Lewandowska-Sabat et al., 2012). Thus, it seems likely that natural selection at low altitude locations are creating populations which are more photoperiodic sensitive than at higher altitudes since, at lower altitudes, photoperiod is a more reliable indicator of the changing seasons than temperature. Populations from low altitudes might perceive longer periods with increasing photoperiod as signal for the onset of spring. This gives insurance against damages to floral organs caused by sudden frost in early spring (Tonsor and Scheiner, 2007).
Furthermore, the highest absolute values of the structure correlation coefficients were found for responses of all populations to 21 h photoperiod (Table 3). This indicates the highest association of responses to this photoperiod with altitude, which may indicate that these populations are adapted to photoperiods of approximately 21 h.
In low altitude regions, where winters are relatively mild and short, and with unpredictable temperature fluctuations, it is likely that plants respond rapidly to increasing photoperiod in spring, the crucial signal for these populations to flower at the right time. On the contrary, in high altitude locations, where winters are harsh with long lasting snow cover, rapidly increasing temperatures in the spring are more reliable signals than changing photoperiod, for these populations to flower.
In high altitude populations, the enhanced rosette leaf number responses to photoperiod were observed (Table 3). The greater rosette leaf number responses indicate reduction in the leaf number, i.e., fewer rosette leaves were produced in response to longer photoperiods compared to 8 h. This may suggest that at higher altitudes plants with fewer rosette leaves are favored by natural selection because they likely overwinter under snow cover as rosettes and are adapted to water loss during winter months. These is consistent with previous findings of a genetic correlation between water use efficiency and ecological traits (e.g., rosette leaf number) in A. thaliana (McKay et al., 2003; Stinchcombe et al., 2004). Furthermore, trends of smaller plant size (fewer leaves) at high altitudes were observed in A. thaliana (Luo et al., 2015), and it has been suggested that this may be a mechanism that allow plants to benefit from higher temperatures closer to the soil (Körner, 1999).
We have observed that in low altitude populations, flower stem length responses to longer photoperiods were decreased (Table 3), i.e., these populations developed shorter flower stem in response to longer photoperiods compared to high altitude populations. Flower stem elongation in A. thaliana is regulated by gibberellin, an endogenous regulator of plant growth and development (Richards et al., 2001). It has been shown that treatment with inhibitors of gibberellin biosynthesis suppresses stem elongation under long day conditions in spinach (Zeevaart et al., 1993). Also, in A. thaliana and pea (Pisum sativum), lower day temperature was shown to decrease gibberellin levels through enhanced gibberellin inactivation, as compared to higher temperature (Stavang et al., 2005, 2009). Thus, it is likely that endogenous gibberellin regulation play an important role in inhibition of stem elongation in low altitude populations, preventing them from too rapid growth in unfavorable environmental conditions, such as in cold period of early spring.
In order to reflect the natural growth conditions in Norway, we used a much lower ambient temperature (16°C) than the standard temperature (21°C) used in most of the A. thaliana studies (Hoffmann, 2002). Therefore, interacting effects of photoperiod and lower ambient temperature (Halliday et al., 2003), as being used in our study, have the potential to reveal phenotypic responses involving genetic regulations that so far has gone undetected in A. thaliana. On the other hand, these conditions may still be artificial, especially in the autumn when SDs are often accompanied by very cold weather. Furthermore, in order to test whether the genetic differences in photoperiod sensitivity observed in our study are under natural selection, a comparison of results from common garden experiments at low- versus high altitude locations could provide further evidences.
Conclusion
We have shown that photoperiodic sensitivity of A. thaliana populations originating from its northernmost species boundary is associated with altitude. Populations from lower altitudes were more responsive toward changes in photoperiod than populations from higher altitudes. Therefore, it is highly likely that climatic factors such as length of the winter and duration of snow cover may impose natural selection that creates clinal variation in photoperiodic sensitivity in A. thaliana. These results indicate that higher photoperiodic sensitivity in lower altitude populations might be essential for sensing the onset of spring in regions with relatively mild and unpredictable winter climates as opposed to higher altitude climates with more stable winters. However, this needs to be verified by further studies. Nevertheless, this study contributes to the current knowledge on diversity and dynamics of photoperiodic responses in natural populations of A. thaliana.
Author Contributions
AL-S participated in the design of the study, carried out the experiments, collected and analyzed the data, and drafted the manuscript. SF, JO, and OR participated in the design of the study, discussion and interpretation of the results, and manuscript drafting. All authors read and approved the final version of the manuscript.
Funding
This study was supported by a grant from the Research Council of Norway: The Norwegian Arabidopsis Research Centre, project no. 151991/150, and a Ph.D. scholarship to AL-S from the Norwegian University of Life Sciences.
Conflict of Interest Statement
The authors declare that the research was conducted in the absence of any commercial or financial relationships that could be construed as a potential conflict of interest.
Acknowledgment
We thank Ragnhild Nestestog for technical assistance and Simen Rød Sandve for discussion and comments on the results.
Supplementary Material
The Supplementary Material for this article can be found online at: http://journal.frontiersin.org/article/10.3389/fpls.2017.01046/full#supplementary-material
FIGURE S1 | Set up of the day and night regimes during the experiment. Populations of Arabidopsis thaliana were screened for responses to 8, 16, 19, 21, and 24 h of photoperiod.
FIGURE S2 | Population reaction norms of (A) days to flowering (DTF), (B) rosette leaf numbers at bolting (RLN), and (C) flower stem length (FSL) in response to 8, 16, 19, 21, and 24 h of photoperiod. Data are presented as population mean values ± SD (n = 15).
FIGURE S3 | Scatter plot of the mean lineage values (three lineages per population were used with five replicates per lineage) for response to 21 h of photoperiod (days to flowering DTF) vs. altitude of origin.
TABLE S1 | Phenotypic data for lineages from 10 populations of Arabidopsis thaliana used in the study. P, photoperiodic response to 16, 19, 21, and 24 h of treatment, respectively, compared to 8 h. DTB, days to bolting; DTF, days to flowering; RLN, rosette leave number; FSL, flower stem length.
TABLE S2 | ANOVA of population, photoperiod treatment and population × photoperiod treatment interaction effects on days to bolting (DTB), days to flowering (DTF), rosette leaves number (RLN), and flower stem length (FSL). Population and photoperiod treatment effects were tested against the population × photoperiod treatment interaction effect.
Footnotes
References
Andres, F., and Coupland, G. (2012). The genetic basis of flowering responses to seasonal cues. Nat. Rev. Genet. 13, 627–639. doi: 10.1038/nrg3291
Balasubramanian, S., Sureshkumar, S., Agrawal, M., Michael, T. P., Wessinger, C., Maloof, J. N., et al. (2006). The PHYTOCHROME C photoreceptor gene mediates natural variation in flowering and growth responses of Arabidopsis thaliana. Nat. Genet. 38, 711–715. doi: 10.1038/ng1818
Banta, J. A., Dole, J., Cruzan, M. B., and Pigliucci, M. (2007). Evidence of local adaptation to coarse-grained environmental variation in Arabidopsis thaliana. Evolution 61, 2419–2432. doi: 10.1111/j.1558-5646.2007.00189.x
Bradshaw, W. E., and Holzapfel, C. M. (2001). Phenotypic evolution and the genetic architecture underlying photoperiodic time measurement. J. Insect. Physiol. 47, 809–820. doi: 10.1016/S0022-1910(01)00054-3
Bradshaw, W. E., Zani, P. A., and Holzapfel, C. M. (2004). Adaptation to temperate climates. Evolution 58, 1748–1762. doi: 10.1111/j.0014-3820.2004.tb00458.x
El-Assal, S. E., Alonso-Blanco, C., Peeters, A. J. M., Wagemaker, C., Weller, J. L., and Koornneef, M. (2003). The role of CRYPTOCHROME 2 in flowering in Arabidopsis. Plant Physiol. 133, 1504–1516. doi: 10.1104/pp.103.029819
Endler, J. A. (1977). Geographic Variation, Speciation, and Clines. Princeton, NJ: Princeton University Press.
Engelmann, K., and Purugganan, M. D. (2006). The molecular evolutionary ecology of plant development: flowering time in Arabidopsis thaliana. Adv. Bot. Res. 44, 507–526. doi: 10.1016/S0065-2296(06)44013-1
Giakountis, A., Cremer, F., Sim, S., Reymond, M., Schmitt, J., and Coupland, G. (2010). Distinct patterns of genetic variation alter flowering responses of Arabidopsis accessions to different daylengths. Plant Physiol. 152, 177–191. doi: 10.1104/pp.109.140772
Hall, M. C., and Willis, J. H. (2006). Divergent selection on flowering time contributes to local adaptation in Mimulus guttatus populations. Evolution 60, 2466–2477. doi: 10.1111/j.0014-3820.2006.tb01882.x
Halliday, K. L., Salter, M. G., Thingnæs, E., and Whitelam, G. C. (2003). Phytochrome control of flowering is temperature sensitive and correlates with expression of the floral integrator FT. Plant J. 33, 875–885. doi: 10.1046/j.1365-313X.2003.01674.x
Hoffmann, M. H. (2002). Biogeography of Arabidopsis thaliana (L.) Heynh. (Brassicaceae). J. Biogeogr. 29, 125–134. doi: 10.1046/j.1365-2699.2002.00647.x
Hopkins, R., Schmitt, J., and Stinchcombe, J. R. (2008). A latitudinal cline and response to vernalization in leaf angle and morphology in Arabidopsis thaliana (Brassicaceae). New Phytol. 179, 155–164. doi: 10.1111/j.1469-8137.2008.02447.x
Kardailsky, I., Shukla, V. K., Ahn, J. H., Dagenais, N., Christensen, S. K., Nguyen, J. T., et al. (1999). Activation tagging of the floral inducer FT. Science 286, 1962–1965. doi: 10.1126/science.286.5446.1962
Körner, C. (1999). “Alpine plants: stressed or adapted?,” in Physiological Plant Ecology, eds M. C. Press, J. D. Scholes, and M. G. Barker (Oxford: Blackwell), 297–312.
Lee, I., and Amasino, R. M. (1995). Effect of vernalization, photoperiod, and light quality on the flowering phenotype of Arabidopsis plants containing the FRIGIDA gene. Plant Physiol. 108, 157–162. doi: 10.1104/pp.108.1.157
Levine, M. S. (1977). Canonical Analysis and Factor Comparison. Thousand Oaks CA: Sage Publications.
Lewandowska-Sabat, A. M., Fjellheim, S., and Rognli, O. A. (2012). The continental-oceanic climatic gradient impose clinal variation in vernalization response in Arabidopsis thaliana. Environ. Exp. Bot. 78, 109–116. doi: 10.1016/j.envexpbot.2011.12.033
Luo, Y., Widmer, A., and Karrenberg, S. (2015). The roles of genetic drift and natural selection in quantitative trait divergence along an altitudinal gradient in Arabidopsis thaliana. Heredity 114, 220–228. doi: 10.1038/hdy.2014.89
McKay, J. K., Richards, J. H., and Mitchell-Olds, T. (2003). Genetics of drought adaptation in Arabidopsis thaliana: I. Pleiotropy contributes to genetic correlations among ecological traits. Mol. Ecol. 12, 1137–1151. doi: 10.1046/j.1365-294X.2003.01833.x
Montesinos-Navarro, A., Wig, J., Pico, F. X., and Tonsor, S. J. (2010). Arabidopsis thaliana populations show clinal variation in a climatic gradient associated with altitude. New Phytol. 189, 282–294. doi: 10.1111/j.1469-8137.2010.03479.x
O’Malley, K. G., and Banks, M. A. (2008). A latitudinal cline in the Chinook salmon (Oncorhynchus tshawytscha) clock gene: evidence for selection on PolyQ length variants. Proc. Biol. Sci. 275, 2813–2821. doi: 10.1098/rspb.2008.0524
Onouchi, H., and Coupland, G. (1998). The regulation of flowering time of Arabidopsis in response to daylength. J. Plant Res. 111, 271–275. doi: 10.1007/BF02512183
Pouteau, S., Carré, I., Gaudin, V., Ferret, V., Lefebvre, D., and Wilson, M. (2008). Diversification of photoperiodic response patterns in a collection of early-flowering mutants of Arabidopsis. Plant Physiol. 148, 1465–1473. doi: 10.1104/pp.108.127639
Putterill, J., Laurie, R., and Macknight, R. (2004). It’s time to flower: the genetic control of flowering time. Bioessays 26, 363–373. doi: 10.1002/bies.20021
Richards, D. E., King, K. E., Ait-ali, T., and Harberd, N. P. (2001). How gibberellin regulates plant growth and development: a molecular genetic analysis of gibberellin signaling. Annu. Rev. Plant Physiol. Plant Mol. Biol. 52, 67–88. doi: 10.1146/annurev.arplant.52.1.67
Roberts, E. H., and Summerfield, R. J. (1987). “Measurement and prediction of flowering in annual crops,” in Manipulation of Flowering, ed. J. G. Atherton (London: Butterworths), 17–50.
Samis, K. E., Heath, K. D., and Stinchcombe, J. R. (2008). Discordant longitudinal clines in flowering time and PHYTOCHROME C in Arabidopsis thaliana. Evolution 62, 2971–2983. doi: 10.1111/j.1558-5646.2008.00484.x
Scheiner, S. M., and Gurevitch, J. (2001). Design and Analysis of Ecological Experiments, 2nd Edn. Oxford: Oxford University Press.
Schwartz, C., Balasubramanian, S., Warthmann, N., Michael, T. P., Lempe, J., Sureshkumar, S., et al. (2009). Cis-regulatory changes at FLOWERING LOCUS T mediate natural variation in flowering responses of Arabidopsis thaliana. Genetics 183, 723–732. doi: 10.1534/genetics.109.104984
Shindo, C., Aranzana, M. J., Lister, C., Baxter, C., Nicholls, C., Nordborg, M., et al. (2005). Role of FRIGIDA and FLOWERING LOCUS C in determining variation in flowering time of Arabidopsis. Plant Physiol. 138, 1163–1173. doi: 10.1104/pp.105.061309
Simpson, G. G., and Dean, C. (2002). Arabidopsis, the rosetta stone of flowering time? Science 296, 285–289.
Song, Y. H., Ito, S., and Imaizumi, T. (2013). Flowering time regulation: photoperiod- and temperature-sensing in leaves. Trends Plant Sci. 18, 575–583. doi: 10.1016/j.tplants.2013.05.003
Stavang, J. A., Ernsten, A., Lindgård, B., Lid, S., Moe, R., and Olsen, J. E. (2005). Thermoperiodic regulation of shoot elongation is mediated by transcriptional regulation of GA inactivation in pea. Plant Physiol. 158, 2344–2353. doi: 10.1104/pp.105.063149
Stavang, J. A., Gallego-Bartolomé, J., Yoshida, S., Asami, T., Olsen, J. E., Garcia-Martinez, J. L., et al. (2009). Hormonal regulation of temperature-induced growth in Arabidopsis. Plant J. 60, 589–601. doi: 10.1111/j.1365-313X.2009.03983.x
Stenøien, H. K., Fenster, C. B., Kuittinen, H., and Savolainen, O. (2002). Quantifying latitudinal clines to light responses in natural populations of Arabidopsis thaliana (Brassicaceae). Am. J. Bot. 89, 1604–1608. doi: 10.3732/ajb.89.10.1604
Stinchcombe, J. R., Weinig, C., Ungerer, M., Olsen, K. M., Mays, C., Halldorsdottir, S. S., et al. (2004). A latitudinal cline in flowering time in Arabidopsis thaliana modulated by the flowering time gene FRIGIDA. Proc. Natl. Acad. Sci. U.S.A. 101, 4712–4717. doi: 10.1073/pnas.0306401101
Tonsor, S. J., and Scheiner, S. M. (2007). Plastic trait integration across a CO2 gradient in Arabidopsis thaliana. Am. Nat. 169, E119–E140.
Verhoeven, K. J. F., Poorter, H., Nevo, E., and Biere, A. (2008). Habitat-specific natural selection at a flowering-time QTL is a main driver of local adaptation in two wild barley populations. Mol. Ecol. 17, 3416–3424. doi: 10.1111/j.1365-294X.2008.03847.x
Yano, M., Katayose, Y., Ashikari, M., Yamanouchi, U., Monna, L., Fuse, T., et al. (2000). Hd1, a major photoperiod sensitivity quantitative trait locus in rice, is closely related to the Arabidopsis flowering time gene CONSTANS. Plant Cell 12, 2473–2484. doi: 10.1105/tpc.12.12.2473
Zeevaart, J. A. D., Gage, D. A., and Talon, M. (1993). Gibberellin A, is required for stem elongation in spinach. Proc. Natl. Acad. Sci. U.S.A. 90, 7401–7405. doi: 10.1073/pnas.90.15.7401
Keywords: altitude, Arabidopsis thaliana, flowering time, local populations, photoperiodic sensitivity
Citation: Lewandowska-Sabat AM, Fjellheim S, Olsen JE and Rognli OA (2017) Local Populations of Arabidopsis thaliana Show Clear Relationship between Photoperiodic Sensitivity of Flowering Time and Altitude. Front. Plant Sci. 8:1046. doi: 10.3389/fpls.2017.01046
Received: 13 March 2017; Accepted: 31 May 2017;
Published: 14 June 2017.
Edited by:
Sergio Rossi, Université du Québec à Chicoutimi, CanadaReviewed by:
Kathleen Gray Ferris, University of California, Davis, United StatesEryuan Liang, Institute of Tibetan Plateau Research, Chinese Academy of Sciences, China
Peter Prislan, Slovenian Forestry Institute, Slovenia
Copyright © 2017 Lewandowska-Sabat, Fjellheim, Olsen and Rognli. This is an open-access article distributed under the terms of the Creative Commons Attribution License (CC BY). The use, distribution or reproduction in other forums is permitted, provided the original author(s) or licensor are credited and that the original publication in this journal is cited, in accordance with accepted academic practice. No use, distribution or reproduction is permitted which does not comply with these terms.
*Correspondence: Odd A. Rognli, b2RkLWFybmUucm9nbmxpQG5tYnUubm8=
†Present address: Anna M. Lewandowska-Sabat, Department of Basic Sciences and Aquatic Medicine, Faculty of Veterinary Medicine, Norwegian University of Life Sciences, Oslo, Norway