 Rowena C. Downie1,2*
 Laura Bouvet1,2Eiko Furuki3
 Nick Gosman1†
 Keith A. Gardner1
 Ian J. Mackay1
 Camila Campos Mantello1
 Greg Mellers1
 Huyen T. T. Phan3Gemma A. Rose1
 Kar-Chun Tan3
 Richard P. Oliver3
 James Cockram1*
- 1Genetics and Breeding Department, National Institute of Agricultural Botany, Cambridge, United Kingdom
- 2Plant Sciences Department, University of Cambridge, Cambridge, United Kingdom
- 3Centre for Crop and Disease Management, Curtin University, Perth, WA, Australia
Parastagonospora nodorum is a necrotrophic fungal pathogen of wheat (Triticum aestivum L.), one of the world’s most important crops. P. nodorum mediates host cell death using proteinaceous necrotrophic effectors, presumably liberating nutrients that allow the infection process to continue. The identification of pathogen effectors has allowed host genetic resistance mechanisms to be separated into their constituent parts. In P. nodorum, three proteinaceous effectors have been cloned: SnToxA, SnTox1, and SnTox3. Here, we survey sensitivity to all three effectors in a panel of 480 European wheat varieties, and fine-map the wheat SnTox3 sensitivity locus Snn3-B1 using genome-wide association scans (GWAS) and an eight-founder wheat multi-parent advanced generation inter-cross (MAGIC) population. Using a Bonferroni corrected P ≤ 0.05 significance threshold, GWAS identified 10 significant markers defining a single locus, Snn3-B1, located on the short arm of chromosome 5B explaining 32% of the phenotypic variation [peak single nucleotide polymorphisms (SNPs), Excalibur_c47452_183 and GENE-3324_338, -log10P = 20.44]. Single marker analysis of SnTox3 sensitivity in the MAGIC population located Snn3-B1 via five significant SNPs, defining a 6.2-kb region that included the two peak SNPs identified in the association mapping panel. Accordingly, SNP Excalibur_c47452_183 was converted to the KASP genotyping system, and validated by screening a subset of 95 wheat varieties, providing a valuable resource for marker assisted breeding and for further genetic investigation. In addition, composite interval mapping in the MAGIC population identified six minor SnTox3 sensitivity quantitative trait loci, on chromosomes 2A (QTox3.niab-2A.1, P-value = 9.17-7), 2B (QTox3.niab-2B.1, P = 0.018), 3B (QTox3.niab-3B.1, P = 48.51-4), 4D (QTox3.niab-4D.1, P = 0.028), 6A (QTox3.niab-6A.1, P = 8.51-4), and 7B (QTox3.niab-7B.1, P = 0.020), each accounting for between 3.1 and 6.0 % of the phenotypic variance. Collectively, the outcomes of this study provides breeders with knowledge and resources regarding the sensitivity of European wheat germplasm to P. nodorum effectors, as well as simple diagnostic markers for determining allelic state at Snn3-B1.
Introduction
The necrotrophic pathogen Parastagonospora (synonyms: Septoria, Stagonospora, Phaeosphaeria) nodorum (Berk.) Quaedvlieg, Verkley, and Crous is the causal agent of the disease SNB and glume blotch in wheat (Triticum aestivum L.), a disease of significant economic importance in Australia, Europe, North America, and Northern Africa (Friesen et al., 2005; Oliver et al., 2012; Quaedvlieg et al., 2013). The visual symptoms of SNB are chlorosis and necrosis of the leaf tissue, as well as discoloration of the glumes, often in the form of lesions (Solomon et al., 2006). These symptoms reduce the leaf surface area capable of photosynthesis, limiting overall crop growth, with SNB shown to result in grain yield losses of up to 31% (Bhathal and Loughman, 2003). P. nodorum is thought to derive nutrients from dead plant tissue, utilizing fungal effector proteins, previously known as host-specific (or selective) toxins, to induce a hypersensitive response in the host, which takes the form of programmed cell death (Friesen et al., 2007; Liu et al., 2009; Oliver et al., 2012). The necrotic response in the sensitive host is hypothesized to facilitate pathogen colonization, promoting infection and ultimately providing a rich nutrient source, via cell death (Oliver and Solomon, 2010; Vincent et al., 2012). This is known as effector-triggered susceptibility and is genetically induced via an “inverse gene for gene system” (Friesen et al., 2007). The identification of effector proteins has led to a paradigm shift in the approach to tackle these types of pathogens, as the host–pathogen interactions can be broken down into their constituent parts. Consequently, targeted breeding could then be used to eliminate host sensitivity on an effector by effector basis.
Effector proteins were described for the first time with regards to a host–pathogen interaction between Alternaria alternata (a necrotroph) and Pirus serotine (Tanaka, 1933). However, the first protein effector described in a necrotrophic pathogen was PtrToxA from the wheat tan spot pathogen, Pyrenophora tritici-repentis, which triggers necrosis in wheat lines carrying susceptible alleles at the Tsn1 locus (Ballance et al., 1989; Tomas et al., 1990; Faris et al., 1996). A near identical effector, SnToxA, was discovered in P. nodorum, with the corresponding host sensitivity locus also being Tsn1 (Liu et al., 2006). Tsn1, located on the long arm of chromosome 5B, has been cloned and encodes an intracellular protein with a serine/threonine protein kinase (S/TPK) domain, a nucleotide-binding site (NBS), and leucine-rich repeats (LRRs), with deletion of Tsn1 resulting in SnToxA insensitivity (Faris et al., 2010). Similarly, the purification and subsequent isolation of the P. nodorum effector, SnTox1, allowed identification of the corresponding wheat sensitivity locus, Snn1, on the short arm of chromosome 1B (Liu et al., 2004, 2012; Cockram et al., 2015). Map-based cloning found Snn1 to encode a wall-associated kinase (WAK), with yeast two-hybrid analysis showing the Snn1 and SnTox1 proteins interact directly in vitro (Shi et al., 2016b), unlike Tsn1 and SnToxA (Faris et al., 2010). Given the nature of their corresponding wheat sensitivity loci, it is hypothesized that SnToxA and SnTox1 activate the wheat pathogen-associated molecular pattern (PAMP)-triggered immunity (PTI) and effector-triggered immunity (ETI) pathways, which for biotrophic pathogens protect against pathogen infection. However, as P. nodorum is a necrotrophic pathogen, the triggering of these pathways, which induce necrosis and cell death, promotes P. nodorum growth and propagation (Shi et al., 2016b). Wheat varieties carrying both Tsn1 and Snn1 show higher levels of necrosis than those varieties carrying either Tsn1 or Snn1 alone (Chu et al., 2010), indicating that the hijacking of both the PTI and ETI pathways for necrotrophic effector triggered susceptibility supports pathogen survival and reproduction (Shi et al., 2016b).
Characterization of a third P. nodorum effector, SnTox3, led to the identification of its corresponding wheat sensitivity locus, Snn3 (more recently termed Snn3-B1), located on the short arm of chromosome 5B. Culture filtrate containing SnTox3 was produced using a wildtype pathogen isolate, SN15, and host sensitivity was mapped using the BR34 × Grandin wheat population, accounting for 17% of the phenotypic variation (Friesen et al., 2008). This agrees with data from the doubled haploid mapping population, Calingiri × Wyalkatchem, which identified the SnTox3 sensitivity locus QSnb.fcu-5BS, as well as a minor SnTox3 sensitivity QTL on the long arm of chromosome 4B, Qsnb.cur-4BL (Phan et al., 2016).
Understanding the effector sensitivities of wheat varieties, and the genetic determinants controlling wheat sensitivity, allows informed manipulation of alleles and germplasm within wheat breeding programs. Here, we survey a panel of 480 predominantly British winter wheat varieties for sensitivity to SnToxA, SnTox1, and SnTox3, and use this AM panel in concert with a MAGIC population to fine-map Snn3-B1, and to identify additional minor QTL for SnTox3 sensitivity.
Materials and Methods
Wheat Germplasm and High-Density Genotyping
Two bread wheat (T. aestivum L.) populations were used for effector sensitivity screening and genetic mapping. The first was an AM panel, representing a diverse collection of 480 elite, predominantly British, wheat varieties drawn from historic collections and National Lists, encompassing varieties released between 1916 and 2007 (Supplementary Table S1). Of these, 420 were released or marketed within the United Kingdom; however, many of these were bred for initial release outside of the United Kingdom (data not available). The remaining 60 varieties do not have a United Kingdom Application For Protection (AFP) number, and so where country of origin information was not available, were assumed to either be non-UK, or represent accessions that predate the application process (represented in Supplementary Table S1 as accessions beginning with the prefix “U”). The majority of the AM panel represent British varieties (330 lines, 68% of the total collection), followed by 51 French (10%), 37 German (8%), and 19 Dutch varieties. The remaining 17 varieties with country information come from Belgium, Canada, Denmark, Sweden, Switzerland, and United States. For 26 varieties, country of origin was not known. The population was previously genotyped using the Illumina iSelect 90,000 feature wheat SNP array (Wang et al., 2014), resulting in 26,018 polymorphic SNPs with a minor allele frequency ≥ 3% (available via http://www.niab.com/pages/id/326/Resources). The second was an eight-founder MAGIC population, termed the “NIAB Elite MAGIC” population (Mackay et al., 2014), the founders of which (cvs. Alchemy, Brompton, Claire, Hereward, Rialto, Robigus, Soissons, and Xi19) were selected for their high seed yield, disease resistance, and their range of end-use qualities. The founders were intercrossed in a simple replicated funnel crossing scheme over three generations, with individuals from the eight-way families subsequently selfed over four generations through single seed descent to produce >1,000 recombinant inbred lines. A subset of these F5 recombinant inbred lines were genotyped using the 90,000 feature SNP array detailed above, resulting in 20,643 polymorphic markers (Gardner et al., 2016). These data allowed the development of a high-resolution genetic map consisting of 18,601 markers mapped using 643 MAGIC lines (Gardner et al., 2016). The remaining 2,042 SNPs were not mappable, due largely to segregation distortion and/or dominance (Gardner et al., 2016).
Effector Protein Production, Wheat Phenotyping, and Pedigree Analysis
SnTox1 and SnTox3 were expressed in Pichia pastoris, as previously described (Tan et al., 2014). For SnToxA, heterologous expression was conducted in Escherichia coli BL21E using the pET21a expression vector as described in Tan et al. (2012). Protein preparations were desalted in 20 mM pH 7.0 sodium phosphate, freeze-dried for storage, and subsequently re-suspended in ultra-pure water and stored at 4°C prior to use. The AM and MAGIC lines were grown in 96-well trays with fine/medium compost (M3) in a heated and lit glasshouse at 20°C/17°C day/night with a 16-h photoperiod. Each line was represented by three to four replicates, and each MAGIC founder by eight replicates, with experimental design carried out using MATLAB (MATLAB, The MathWorks Inc., Natick, Massachusetts, United States) or R/blocksdesign1. For the AM panel, randomization was performed using a custom software routine written in the MATLAB programming environment, to include three biological replicates of each line. For the MAGIC population, the experimental design was split into four blocks, each block containing one replicate of each line and two replicates of each of the parents, with line positions randomized within each block. Therefore, a total of four biological replicates of each line and eight biological replicates of each parent were included. Infiltration on the AM and MAGIC populations was undertaken on seedlings at Zadoks growth stage (GS) 12 (Zadoks et al., 1974), as previously described (Tan et al., 2012). Briefly, a 1-ml plastic syringe was used to infiltrate approximately 50 μl of either SnToxA, SnTox1, or SnTox3 suspension into the first leaf, with the extent of the leaf infiltration region marked with a non-toxic pen. Seven days following infiltration, the plants were visually evaluated for SnTox3 effector sensitivity on a scale of 0 (insensitivity, no symptoms) to 4 (extensive necrosis; Tan et al., 2012). A water control was also used to establish a symptom baseline to evaluate possible damage due to the infiltration process. Mean sensitivity scores were calculated per line for subsequent analysis. Wheat pedigree information was obtained from public sources, and displayed using the software Helium v.1.17.08.14 (Shaw et al., 2014).
Statistical Analyses and Bioinformatics
Effector phenotypic data were analyzed using R (R Core Team, 2013) to determine mean sensitivity scores for each variety and variance within variety. For each toxin, the heritability of line means (broad sense) was calculated by first estimating components of variation from ANOVA (in the AM panel) or REML (in MAGIC) while taking into account all features of the experimental designs. Heritability was then estimated as h2 = σ2G/(σ2G + σ2e) where σ2G is the genetic variation between line means and σ2e is the error variance appropriate to those means. Calculations were carried out in GenStat (VSN International, 2011) and the package lme4 (Bates et al., 2015) in R. GWAS using the AM panel was undertaken using the efficient mixed model association (EMMA) algorithm (Kang et al., 2008) using a compressed mixed linear model (CMLM; Zhang et al., 2010) which includes both fixed and random effects, implemented with the Genome Association and Prediction Integrated Tool (GAPIT) package (Lipka et al., 2012) in R. The genotyping and quality control of the 26,016 SNPs, and the generation of the kinship matrix, is previously described, with the majority of the population structure evident due to spring or winter seasonal growth habit (Gardner et al., submitted). For GWAS, Bonferroni corrected P = 0.05 and P = 0.01 significance thresholds were used, termed here “significant” and “highly significant,” respectively. For MAGIC, correction for multiple testing was carried out using R/qvalue using corrected threshold of 0.05. MAGIC genetic analyses were undertaken using two approaches.
(1) SMA: a simple linear model test in R/lme4 using all 20,643 SNPs. After finding of a major QTL, the analysis was repeated with the major QTL as a covariate.
(2) Haplotype analysis using a subset of 7,369 uniquely mapped SNPs from the MAGIC genetic map (Gardner et al., 2016).
Founder haplotype probabilities were computed with the “mpprob” function in R/mpMap (Huang and George, 2011), implemented in R/qtl (Broman et al., 2003), using a threshold of 0.5. QTL analysis with haplotypes was carried out (a) by linear mixed model using all mapped markers and (b) by CIM using the mpIM function in R/mpMap, with either 0, 5, or 10 covariates. The function sim.sigthr in R/mpMap was used to conduct 100 simulations using the dataset to obtain an empirical QTL significance threshold at a P threshold of 0.05. A full QTL model was then fitted with all QTL using R/fit.mpQTL. For the AM panel, the difference between homozygous marker classes was estimated as twice the linear regression coefficient from a regression of the trait on the marker classes (coded 0, 1, and 2 with 1 being the heterozygous genotype). The coefficient of determination (or r-squared) was used as a measure of the proportion of variance explained by the marker. Genetic markers were anchored using BLASTn (Altschul et al., 1990) against the wheat cv. Chinese Spring 42 IWGSC RefSeq v1.0 physical map (pre-publication data made available under the IWGSC General Data Access Agreement via https://wheat-urgi.versailles.inra.fr/), and where explicitly stated in the text, against the TGACv1 cv. Chinese Spring 42 physical map (Clavijo et al., 2017). In the case of hits of equal match on multiple homoeologs, chromosome allocation followed that assigned by the genetic map (Gardner et al., 2016), where possible. Nomenclature for the QTL discovered in this study follows that recommended by the Catalog of Gene Symbols for Wheat (McIntosh et al., 2008). Protein domains were identified using Pfam 31.0 (Finn et al., 2016).
KASP Marker Development
Single nucleotide polymorphisms were converted to the Kompetitive Allele-Specific PCR (KASP) genotyping platform (LGC Genomics, United Kingdom). SNP flanking DNA sequences were used to design KASP primers using the software PolyMarker (Ramirez-Gonzalez et al., 2015). Genomic DNA was extracted from seedling leaves harvested from a subset of the AM panel using a modified Tanksley protocol (Fulton et al., 1995), DNA concentrations determined using a Nanodrop 200 spectrophotometer (Thermo Scientific), and diluted to a final concentration of 10 ng/μl using sterile PCR-grade water. KASP genotyping was undertaken by a service provider following the manufacturer’s guidelines (LGC Genomics), returned as .csv files, analyzed with SNP Viewer v.1.992, and compared against the corresponding SNP calls from the Illumina 90k SNP array.
Results
P. nodorum Effector Sensitivity Phenotyping
The AM panel, consisting of 480 varieties and breeding lines released between 1916 and 2007, was phenotyped for sensitivity to SnToxA, SnTox1, and SnTox3 via leaf infiltration, and the severity of host response scored using a 0 (insensitive) to 4 (extensive necrosis) scale (Figure 1 and Supplementary Table S1). Broad sense heritability for effector sensitivity was found to be highest for SnTox3 (h2 = 0.92), followed by SnToxA (h2 = 0.83) and SnTox1 (h2 = 0.77). For SnToxA, a separation into insensitive/weakly sensitive (0 ≤ score < 1) and strongly sensitive (score ≥ 3) was observed, accounting for 73% (338/460 varieties) and 10% (47/460 varieties) of all lines successfully screened, respectively (Figure 1A). While spring cultivars represent just 6% of the complete AM panel, 23% (11/47 cultivars) of all SnToxA sensitive lines are spring cultivars, as is the oldest SnToxA sensitive variety, Garnet (released in 1926). Analysis of the wheat pedigree (Figure 2) shows the SnToxA sensitive varieties Axona (released in 1984) and Tonic (released in 1983) to be the most prominent in the transmission of strong sensitivity (due to the prominence of their offspring Cadenza in the wheat pedigree), accounting for 23% of varieties with a sensitivity score ≥ 3. Indeed, the four most recent SnToxA sensitive varieties (Duxford, KWS Curlew, Limerick, and Velocity, released in 2006) all have Cadenza in their pedigree. Response to SnTox1 is more evenly spread across sensitivity classes, with 24% insensitive (111/461 varieties), 28% sensitive (130/461), and 48% (220/461) showing intermediate sensitivity (1 ≥ score < 3; Figure 1B). No pedigree relationships of note were observed for SnTox1 and SnTox3 sensitivity. The most common effector sensitivity identified in the AM population was to SnTox3, with 42% of varieties found to be strongly sensitive (192/457), including the recent varieties Cocoon, KWS Santiago, Orator, Rainbow, and Tuxedo, all released in 2007. Insensitivity to SnTox3 was found in 25% (114/457) of lines, including six released in 2007, while intermediate sensitivity was observed in 33% of varieties. All possible combinations of sensitivity between the three effectors were identified, with 18 varieties displaying high sensitivity (score ≥ 3) to all three effectors.
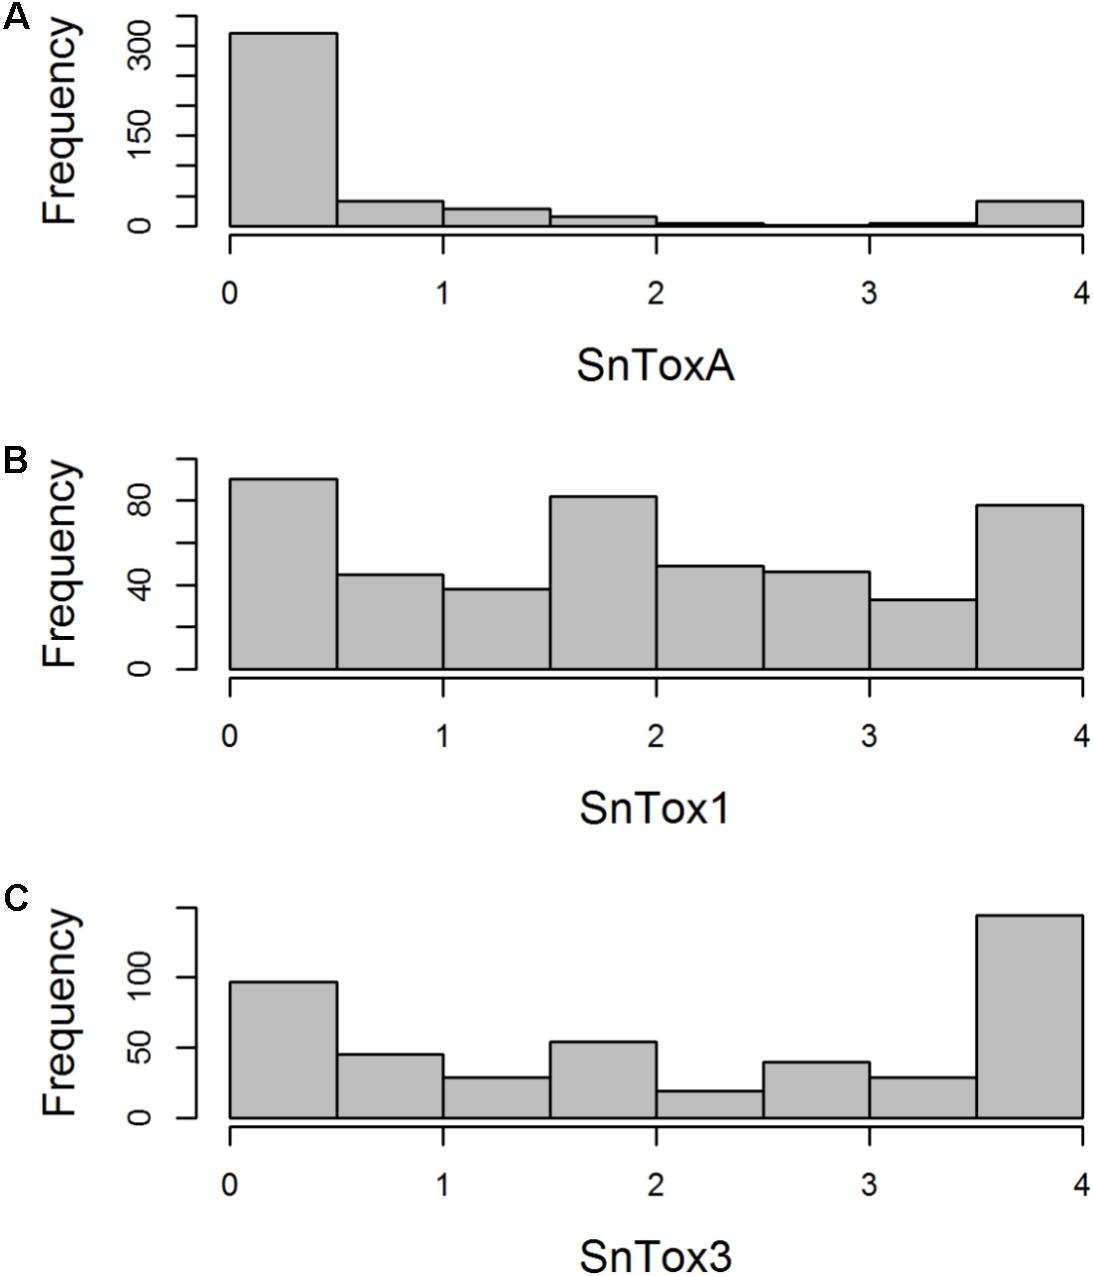
FIGURE 1. Histogram of host sensitivity to P. nodorum effectors (A) SnToxA, (B) SnTox1, and (C) SnTox3 in the AM panel of 480 northwest European wheat varieties. Sensitivity score (0 = insensitive, 4 = sensitive) for each accession represents a mean of four biological replicates.
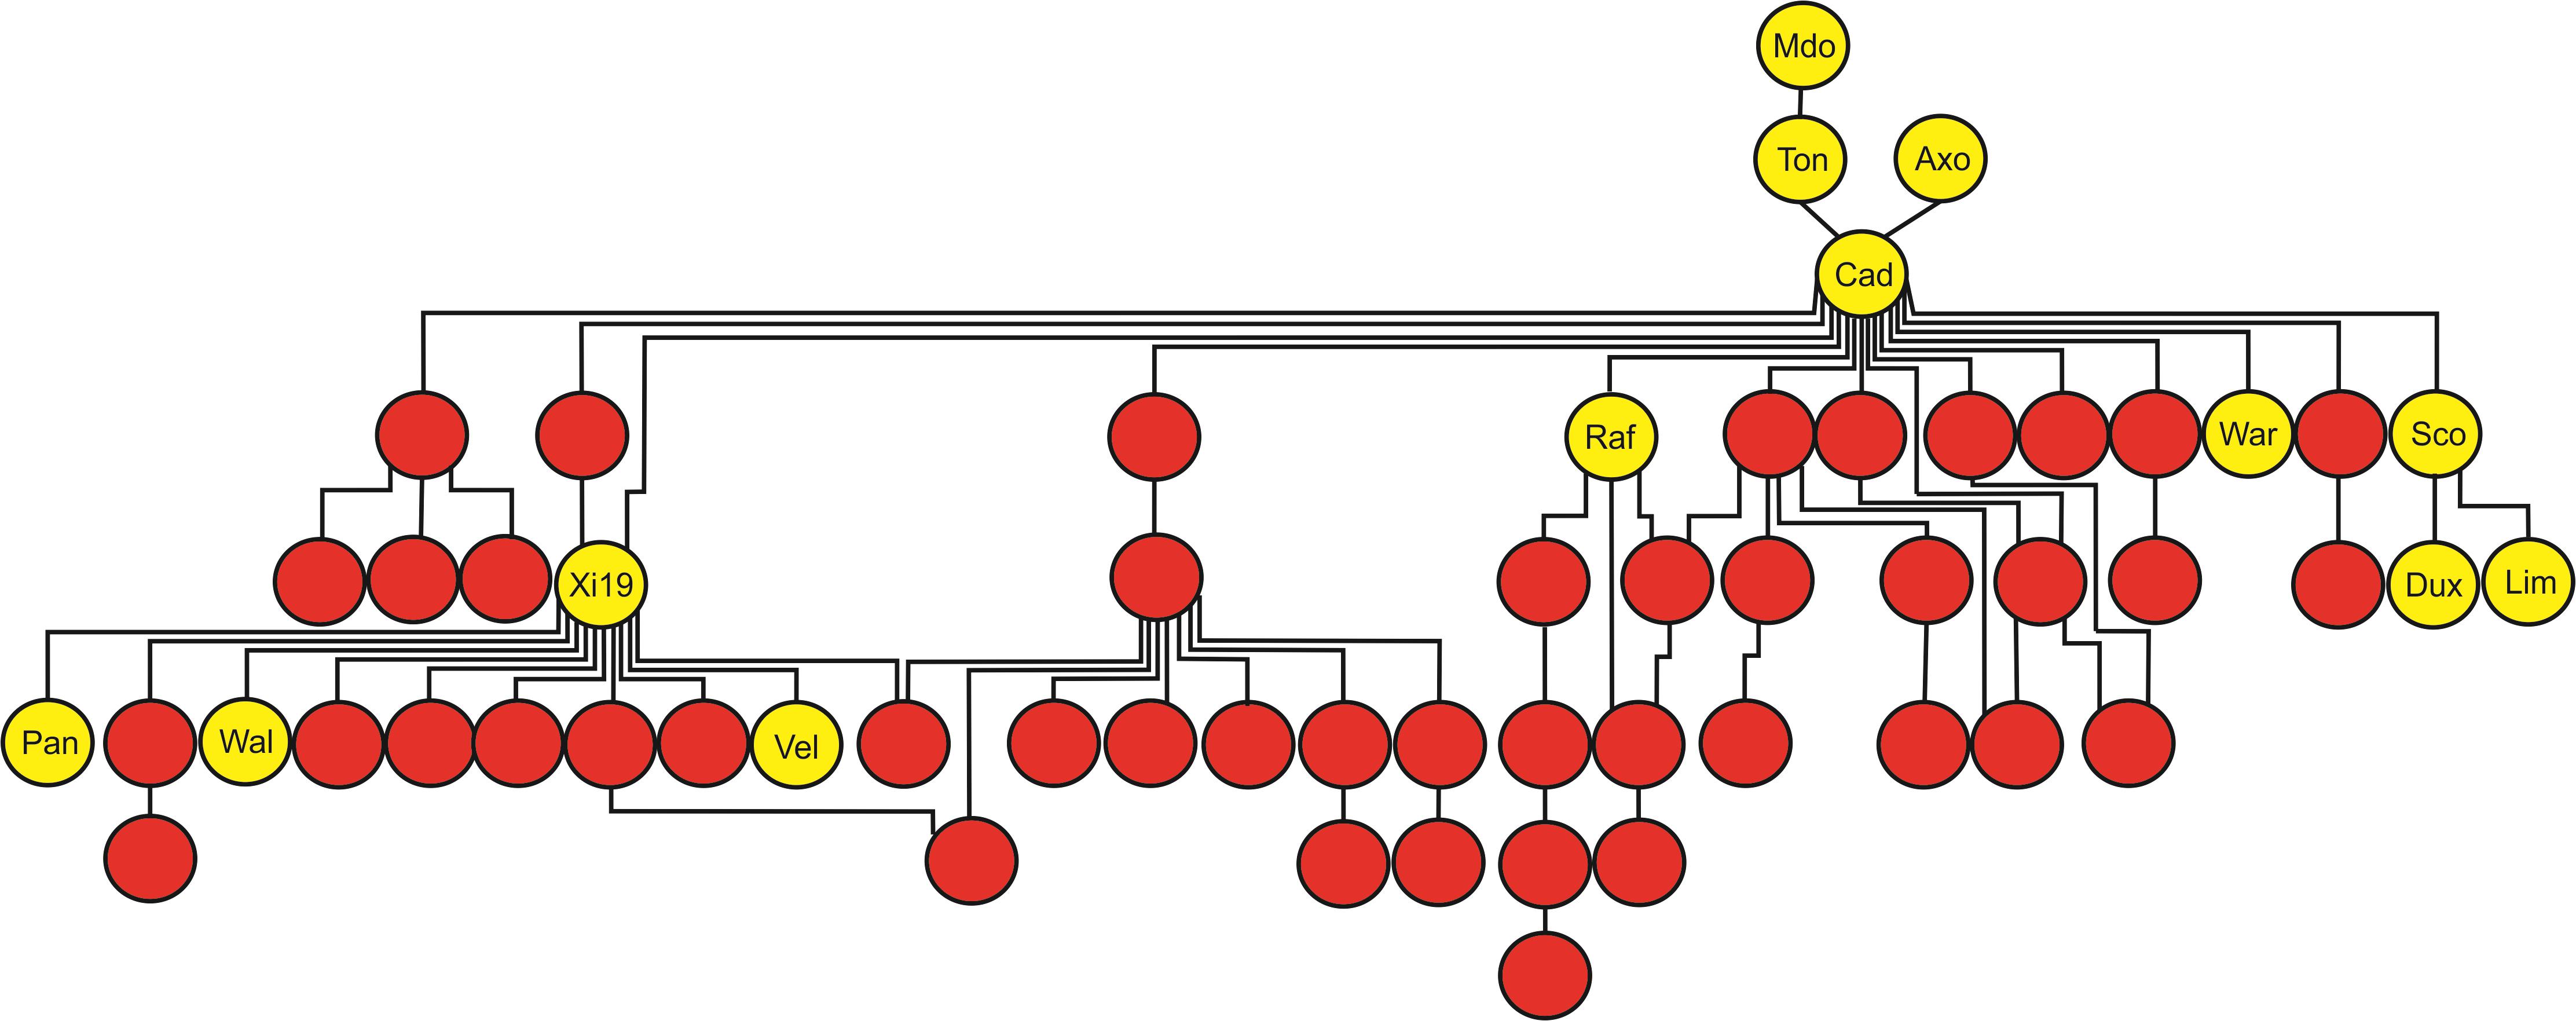
FIGURE 2. Tracking the transmission of SnToxA sensitivity in the wheat pedigree around the Axona × Tonic pedigree. SnToxA sensitive (score ≥ 3) = yellow. SnToxA insensitive (score < 1) = red. Variety names listed only for SnToxA sensitive varieties in the pedigree: Mdo = Maris Dove, Ton = Tonic, Axo = Axona, Cad = Cadenza, Raf = Raffles, War = Warlock_24, Sco = Scorpion_25, Dux = Duxford, Lim = Limerick, Pan = Panorama, Wal = Walpole, Vel = Velocity, and Cur = KWS Curlew.
Genetic Analysis of SnTox3 Sensitivity Using the AM Panel
Initially, the precision of the AM panel was assessed empirically by undertaking GWAS for SnToxA sensitivity, known to be due to allelic variation at the gene underlying Tsn1. Using a data matrix of 26,018 SNPs across 480 varieties, and a Bonferroni corrected P = 0.01 significance threshold (-log10P = 6.41), GWAS identified 30 highly significant markers associated with SnToxA sensitivity (Supplementary Table S2A). These accounted for between 25% and 60% of the total variation (average 38%) with differences in score between the two homozygous classes ranging from 1.5 to 3.1 (mean 2.5). Of the eight most significant markers (-log10P ≥ 31.34), six are located within a gene model encoding a potassium transporter (TraesCS5B01G368500), just two genes proximal to the S/TPK-NBS-LRR gene underlying Tsn1 (Faris et al., 2010). Similarly, GWAS of SnTox1 sensitivity identified seven highly significant (-log10P > 6.41) SNPs. These accounted for between 8.3% and 14.3% of the variation (average 11.6%) with differences in score between the two homozygous classes ranging from 0.9 to 1.6 (mean 1.4). All seven SNPs were located at the Snn1 locus, with SNP Excalibur_c21898_1423 located 25 genes distant from the WAK gene underlying Snn1 in cv. Chinese Spring (TraesCS1B01G004100; Supplementary Table S2B).
Having demonstrated the utility of the AM panel, we proceeded to use SnTox3 sensitivity phenotypic data to undertake GWAS, identifying 14 significant SNPs (Table 1A and Figure 3). Of these, seven were located within a single region on the short arm of chromosome 5B in the IWGSC RefSeq v1.0 physical map. While the remaining three SNPs (wsnp_Ex_c9301_15450818, IACX7443, and Ra_c68425_1406) returned hits on unallocated chromosomes in IWGSC RefSeq v1.0, all three were localized to chromosome 5B on the TGACv1 wheat reference sequence (Table 1A), and have been previously allocated to the short arm of chromosome 5B by treating the SNP as a trait, and locating its estimated position by trait mapping (Gardner et al., 2016). The most significant SNPs were Excalibur_c47452_183 and GENE-3324_338 (-log10P = 20.44) and explained 32% of the phenotypic variation, explaining a phenotypic difference between homozygous allele classes of 2.1. Anchoring previous markers identified as flanking Snn3-B1 to the IWGSC RefSeq v1.0 wheat genome reference sequence confirmed we had identified Snn3-B1 in the GWAS panel. Using our peak Snn3-B1 marker Excalibur_c47452_183 as a cofactor in GWAS found no additional significant genetic loci outside of the Snn3-B1 region (Supplementary Table S3).
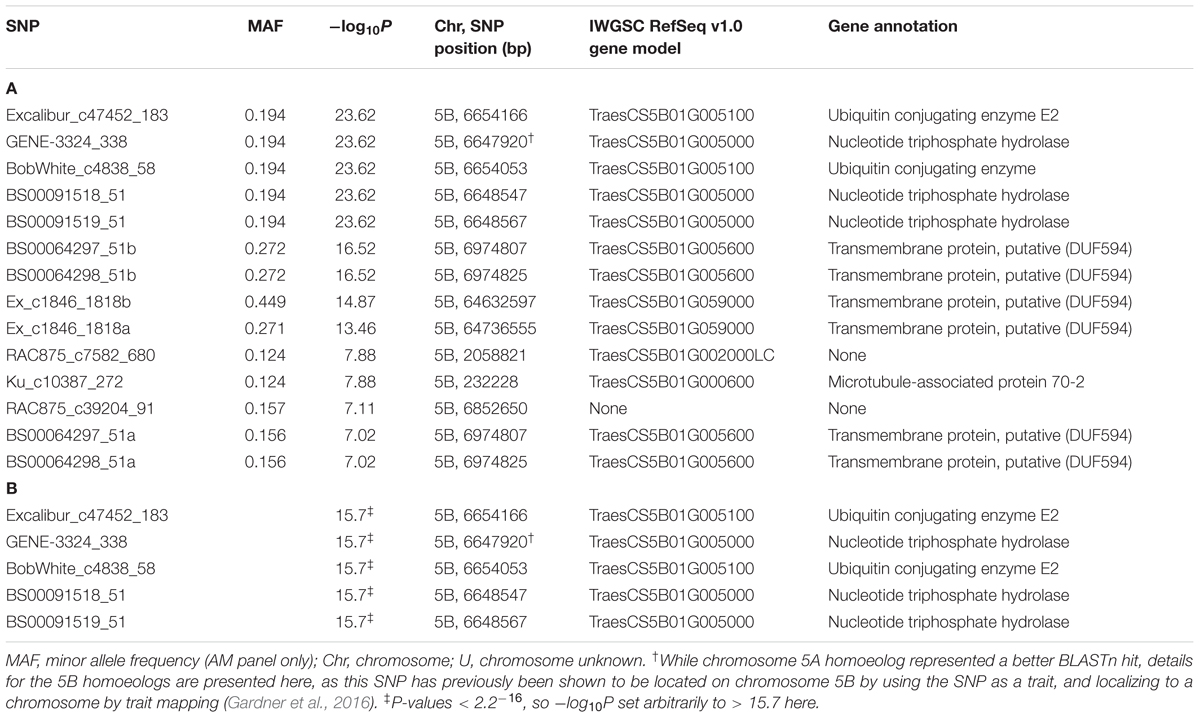
TABLE 1. Significant SNPs (P ≤ 0.05, Bonferroni corrected) for SnTox3 sensitivity identified in (A) the AM panel and (B) single marker analysis (SMA) on 20,643 SNPs in the MAGIC population, listing the SNPs with effect > 1.0 (see Supplementary Table S4 for details of all 114 significant SNPs).
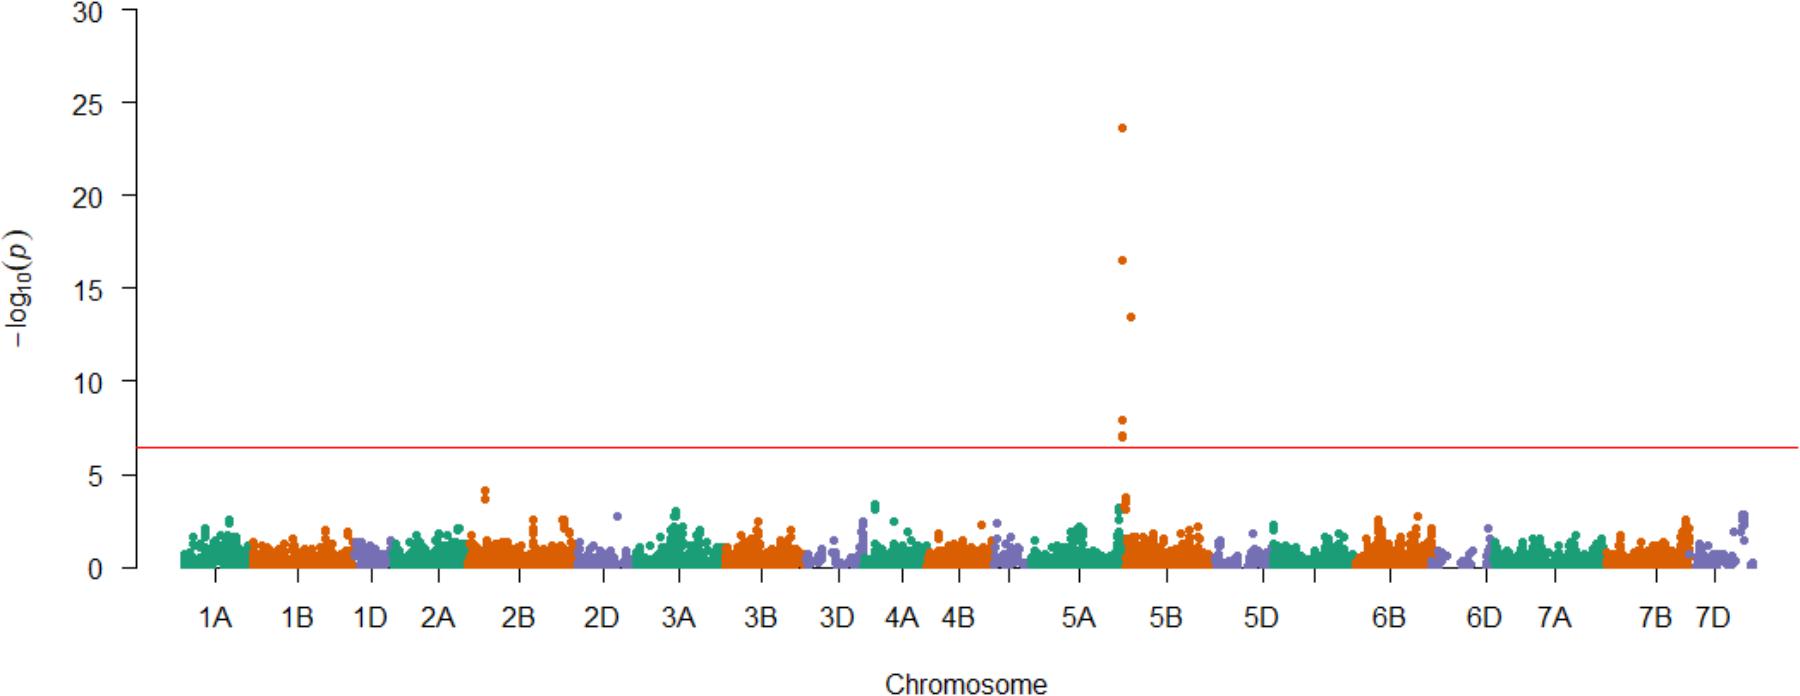
FIGURE 3. Genetic mapping of SnTox3 sensitivity in the AM panel. SNPs are ordered according to the genetic map (Gardner et al., 2016). Significant SNPs that were unmapped in the genetic map (Gardner et al., 2016) are included on the relevant chromosome (5B) via their physical map positions (IWGSC RefSeq v1.0), relative to those of the genetically mapped chromosome 5B SNPs. The Bonferroni corrected P = 0.01 significance threshold is indicated in red (–log10P = 6.41).
Genetic Analysis of SnTox3 Sensitivity Using MAGIC
While screening the AM panel for SnTox3 sensitivity, the eight founders of the NIAB Elite MAGIC population were found to contrast for SnTox3 sensitivity (Supplementary Table S1). Accordingly, 643 lines of the MAGIC population (3–4 reps/line), as well as the eight founders (8 reps/line), were subsequently phenotyped for SnTox3 sensitivity. The sensitivity scores of the parents ranged from 0 (Alchemy, Claire, Robigus) to 4 (Hereward, Rialto, Soissons, Xi19), with Brompton displaying intermediate sensitivity (1.93). SnTox3 sensitivity scores in the MAGIC progeny ranged from 0 to 4, with the majority of lines displaying high sensitivity (score ≥ 3.5, 42.5% lines) or no sensitivity (score ≤ 0.5, 27.5% lines; Supplementary Figure S1). Heritability for SnTox3 sensitivity in the MAGIC population was calculated to be h2 = 0.95. Initially, the 643 MAGIC lines along with the 20,643 mapped and unmapped SNPs were used for SMA using a simple linear model test, identifying 114 significant (P < 0.05) markers (Supplementary Table S4). Of these, the five most significant SNPs, with predicted allelic effects > 1, are the same as the five most significant markers identified in the AM panel (Excalibur_c47452_183, GENE-3324_338, BobWhite_c4838_58, BS00091518_51, and BS00091519_51; Table 1B). SMA identified four additional QTL. The first was on chromosomes 2B (termed here QTox3.niab-2B.1, P = 0.023), located at 356.66 cM by SNP Kukri_c9898_1766. The second, at 40.61 cM on chromosome 4D (QTox3.niab-4B.1, P = 0.037), was identified by SNP BS00036421_51, the third (QTox3.niab-6B.1) was identified by three SNPs on chromosome 6B, with wsnp_Ku_c2119_4098330 showing the highest significance (P = 0.003), and the fourth (QTox3.niab-7B.1) was identified by four chromosome 7B SNPs, with BS00022127_51 showing the highest significance (P = 0.038). Using the most significant peak SNP GENE_3324_338 as a covariate in SMA analysis did not identify any additional genetic loci, and resulted in the disappearance of all four minor QTL.
Additionally, CIM using 0, 5, and 10 covariates was undertaken, using the 7,369 uniquely mapped SNPs from the MAGIC genetic map (Gardner et al., 2016). As well as identifying Snn3-B1 on chromosome 5B (P-values for all analyses ≤ 2.2-16, accounting for ≥16.95% of the phenotypic variation), we again detected QTox3.niab-2B.1 (P = 0.047, 2.3% variation explained, detected with 0 covariates only) and QTox3.niab-7B.1 (P = 0.025, 1.6% variation explained, SNP detected with 0 covariates only). In addition, three further QTL were discovered, distinct to those identified by SMA (Table 2). The first, QTox3.niab-2A.1, mapped to chromosome 2A at 234.62 cM (SNPs BS00070979_51 and Excalibur_c20478_641, positioned at ∼758 Mb) with a P-value = 9.17-7, and explained 6.0% of the variation with 0 covariates. The second, QTox3.niab-3B.1, was located on 3B at 84.11 cM (P = 48.51-4, SNPs wsnp_Ex_c11246_18191331, wsnp_Ex_c22401_31592784, ∼68 Mb), and explained 3.1% of the variation (only found with 5 or 10 covariates). Finally, QTox3.niab-6A.1 at 65.6 cM on chromosome 6A explained 4.2% of the variation with 0 covariates (P = 8.51-4, SNPs BobWhite_c13839_135 and IACX7801, ∼22 Mb; Supplementary Table S7).
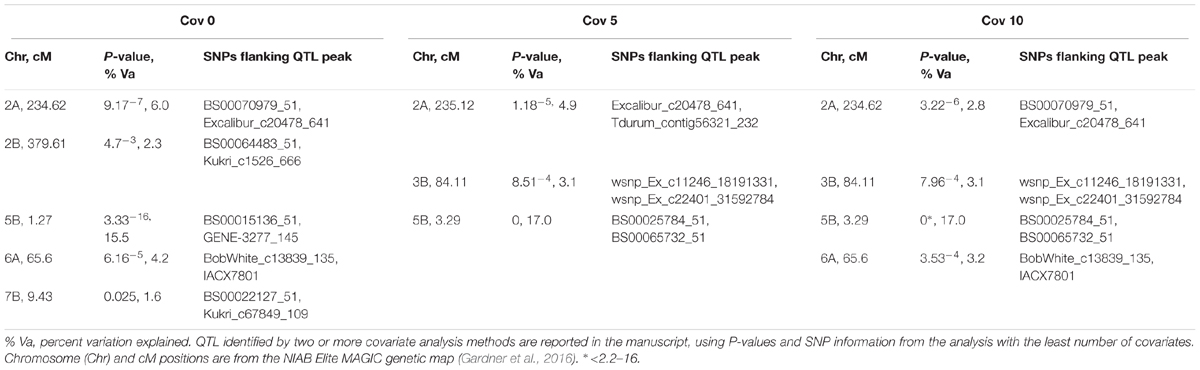
TABLE 2. Significant SnTox3 sensitivity QTL identified by CIM in the MAGIC population, incorporating 0, 5, and 10 covariates in the analysis (labeled below as cov 0, cov 5, and cov 10, respectively).
Development of KASP Genetic Markers for Snn3-B1
The peak SNP identified in both the AM panel by GWAS and MAGIC population by SMA was Excalibur_c47452_183. This marker was selected for conversion from the 90k SNP array to the KASP genotyping platform, a single-plex technology that allows flexible, low-cost use for marker-assisted breeding and research. Primers were designed and tested on a subset of 95 varieties from the AM panel (Figure 4 and Supplementary Table S5). Comparison of Excalibur_c47452_183 allele calls from KASP genotyping with those returned by the 90k array genotyping of the AM panel found perfect correspondence between the two, indicating robust conversion to the KASP platform (Supplementary Table S5). This SNP provides good, but not perfect, prediction of SnTox3 sensitivity phenotype in the AM panel (Table 3 and Supplementary Table S1).
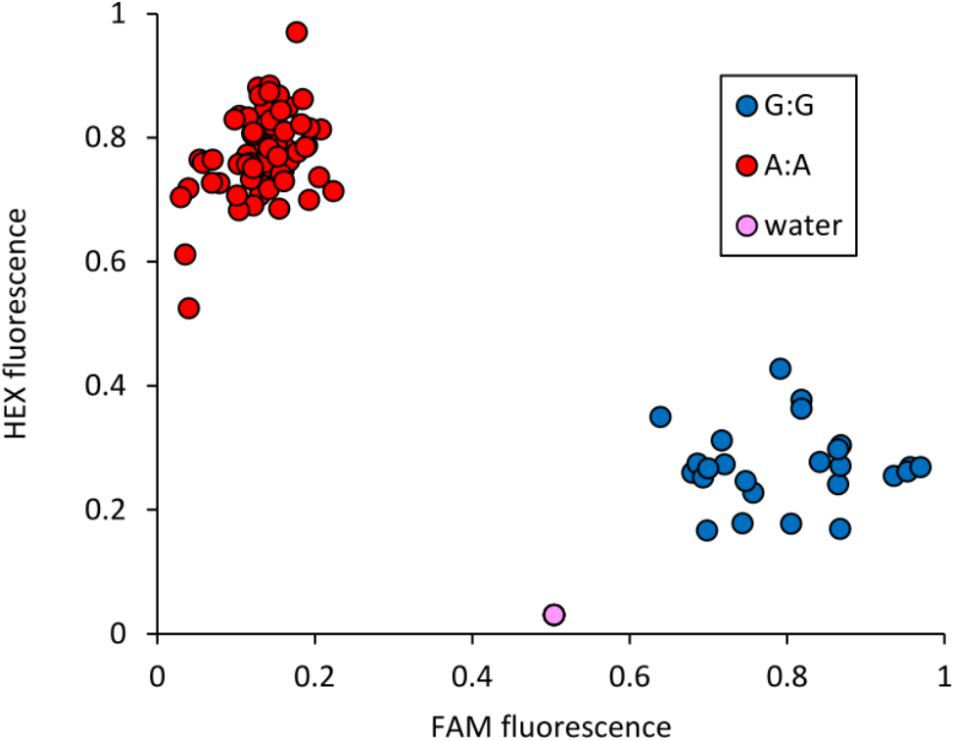
FIGURE 4. Validation of KASP marker Excalibur_c47452_183 (SNP assayed = A/G), closely linked to Snn3-B1. Allele-specific primer A: 5′-GAAGGTCGGAGTCAACGGATTaaggctggctggcgagtA-3′. Allele-specific primer B: 5′-GAAGGTGACCAAGTTCATGCTaaggctggctggcgagtG-3′. Common primer: 5′-tgagggggcatcgaatcG-3′. Tails for ligation of fluorophores are included in uppercase at the 5′ end of the allele-specific primers.
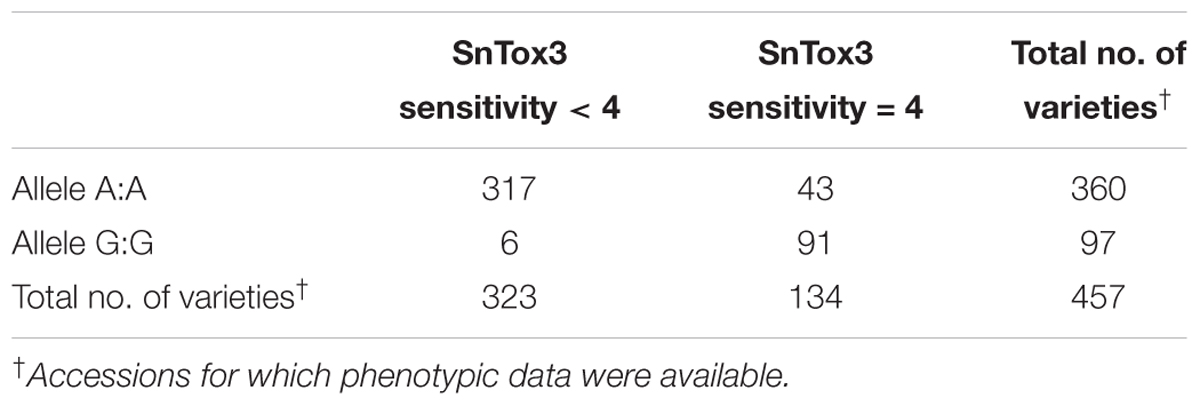
TABLE 3. Allele call for SNP marker Excalibur_c47452_183 versus SnTox3 sensitivity score in the AM panel.
Analysis of the Snn3-B1 Physical Region
To investigate gene content at the Snn3-B1 locus on chromosome 5B, the sequences containing the most significant SNPs identified in the AM panel (-log10P > 16, seven SNPs) and the MAGIC population by SAM (-log10P > 16, effect > 1, five SNPs) were aligned to the IWGSC RefSeq v1.0 wheat reference genome. The seven SNPs from the AM panel delineated a physical region of 326 kb (∼6.648–6.975 Mb), while the five MAGIC SNPs delineated physical regions of 6.2 kb (6.648–6.654 Mb), located within the physical interval as defined in the AM panel. The 326-kb region was predicted to contain seven gene models, representing three high-confidence and four low-confidence gene models (Supplementary Table S6). Two markers lie within a gene model encoding a ubiquitin-conjugating enzyme: Excalibur_c47452_183 is in the 5′ untranslated region, while BobWhite_c4838_58 is a synonymous SNP located within exon 6. Three SNPs lie within gene model TraesCS5B01G005000, a P-loop containing nucleoside triphosphate hydrolases superfamily protein: GENE-3324_338 is located in intron 2, BS00091518_51 results in a synonymous substitution in exon 3, and BS00091519_51 is predicted to result in a G→D substitution at amino acid residue 675 (G675/D), outside of the 50s ribosome-binding GTPase domain. Finally, two SNPs are located in gene model TraesCS5B01G005600, encoding a putative transmembrane protein: BS00064297_51b and BS00064298_51b both represent non-synonymous mutations (L474/P and Q480/R, respectively), neither of which are predicted to lie within a known protein domain.
Discussion
Effector Sensitivity in European Wheat Germplasm and Its Relevance to SNB
Septoria nodorum blotch is a major disease of wheat in many growing areas, with field resistance based on multiple minor effect genes. Identification of necrotrophic effectors in P. nodorum provided resources with which to dissect host resistance into its constituent parts (Cockram et al., 2015) and study their interactions (Phan et al., 2016). Here we used effector screening to determine sensitivities in 480 predominantly British winter wheat varieties. The frequency of SnTox1 sensitive varieties was 28%, broadly comparable to that found for Scandinavian varieties (12%, Ruud et al., 2017a) and global collections (16%, Shi et al., 2016a), but contrasts notably against a recent screen of Australian varieties (72%, Tan et al., 2014). SnTox3 sensitivity frequency here (42%) was similar to that reported in Scandinavian germplasm (55%, Ruud et al., 2017a). Sensitivity to SnToxA was 10% in the predominantly British winter wheat germplasm collection screened here, which is notably lower than that reported in other wheat germplasm collections, e.g., 45% in Scandinavian varieties (Ruud et al., 2017a) and 65% in Western Australian wheat (Waters et al., 2011). SnToxA sensitivity was found to be present at a relatively high frequency in the spring wheat varieties in our panel. The spring and winter wheat breeding pools are relatively separate, possibly explaining the observed frequency differences in SnToxA sensitive and insensitive alleles between the two groups. Indeed, where sensitive alleles appear in the winter genepool, this can often be tracked via the parentage of the genetically spring cultivar Cadenza, a prominent variety in the British pedigree. Tsn1 is located on the long arm of chromosome 5B, <30 Mb from the vernalization gene VRN-B1, a major gene influencing winter or spring growth habit (Cockram et al., 2007). Therefore, it is likely that the partitioning of Tsn1 alleles is influenced by linkage to winter or spring alleles at VRN-B1.
Genetic Mapping of SnTox3 Sensitivity
Previous studies have mapped Snn3-B1 to the short arm of chromosome 5B (Friesen et al., 2008; Phan et al., 2016; Shi et al., 2016a; Ruud et al., 2017b). Here, genetic analysis in the AM and MAGIC populations identified Snn3-B1 as representing the most significant genetic determinant of SnTox3 sensitivity in British germplasm, with the highly significant markers (-log10P > 10) delimiting a 327-kb interval containing seven genes. This was achieved without the need to develop populations specifically to investigate SnTox3 sensitivity, demonstrating the efficacy of using genetic resources such as AM panels and MAGIC populations for rapid genetic dissection of target traits (Cockram and Mackay, 2018). The relatively small genetic interval determined here will allow reverse genetic approaches such as genome editing and Targeting Induced Local Lesions IN Genomes (TILLING, McCallum et al., 2000) to be undertaken to help identify the gene underlying Snn3-B1. However, it should be noted that given we found the cultivar Chinese Spring from which the wheat reference genome sequence is derived to be insensitive to SnTox3, it is possible that the gene underlying Snn3-B1 is deleted or degraded to such an extent that it is not predicted as a gene model. Indeed, this was the case for the gene underlying the SnToxA sensitivity locus Tsn1, which was found to be absent in insensitive varieties, including Chinese Spring (Faris et al., 2010).
Minor QTL for SnTox3 sensitivity have only previously been reported on chromosome 4B (Phan et al., 2016). The six QTL identified here in the MAGIC population, on chromosomes 2A, 2B, 3B, 4D, 6A, and 7B, are therefore novel. When these are compared with known QTL for SNB field resistance and P. nodorum juvenile resistance studies, possible overlap can be identified for the 2A MAGIC QTL QTox3.niab-2A.1. This likely corresponds to Qsnb.cur-2AS.1 (Supplementary Table S7), controlling seedling SNB sensitivity using P. nodorum isolate SN15, as well as knock-out strains of this isolate lacking SnTox1 (tox1–6), a triple knock-out strain lacking SnToxA, SnTox1, and SnTox3 (toxa13), and seedling inoculation with culture filtrate from isolate toxa13 (Phan et al., 2016), and to the SNB QTL identified in the Arina × Forno population via common marker gwm372 (Abeysekara et al., 2009). Similarly, the SnTox3 sensitivity QTL identified here on chromosome 3B (QTox3.niab-3B.1) appears to correspond to a QTL for adult plant SNB resistance in the wheat SHA3/CBRD x Naxos grown under field conditions in Norway (Ruud et al., 2017b). The creation of near isogenic lines for such QTL would allow further characterization of their effects, and potentially, isolation of their underlying genes. The MAGIC population consists of inbred lines genotyped at the F5 generation, with each line expected to contain ∼2% heterozygosity, allowing development of heterogeneous inbred families (HIFs) to rapidly create near isogenic lines through selfing (Tuinstra et al., 1997). As MAGIC F5 lines heterozygous across each of the minor QTL are available, it should now be possible to rapidly create precise genetic materials with which to investigate their effects in isolation. We note that while MAGIC QTL analysis using CIM allowed minor QTL to be detected, in comparison to MAGIC SMA analyses (and GWAS analysis in the AM panel), it did not accurately locate Snn3-B1. This is due to a 5BS/7BS translocation (Badaeva et al., 2007) that is known to segregate in the MAGIC population, with the resulting segregation distortion preventing genetic mapping of markers close to the translocation breakpoint (Gardner et al., 2016). As Snn3-B1 is close to this breakpoint, the absence of the most closely linked SNPs in the genetic map prevents accurate mapping via CIM. In contrast, SMA analysis in the MAGIC population does not require markers to be genetically mapped, highlighting the importance of using both analysis methods when undertaking QTL analysis. Indeed, in addition to Snn3-B1, SMA and CIM both identified additional QTL, two of which were shared and two or three of which were private to each analysis method.
Analysis of the Snn3-B1 Physical Region
The physical region, as defined by the most significant SNPs identified in the AM panel and MAGIC population, was predicted to contain seven gene models. Gene model TraesCS5B01G005000 (containing SNPs GENE-3324_338, BS00091518_51, and BS00091519_51) is similar to YELLOW LEAF 1/BRASSINAZOLE INSENSITIVE PALE GREEN 2 (BPG2), involved in the accumulation of chloroplast proteins and the salt stress response pathway in Arabidopsis (Li et al., 2016; Qi et al., 2016). The SNP that had the largest phenotypic effect from the MAGIC SMA analysis was located within gene model TraesCS5B01G005100, which encoded a “ubiquitin-conjugating enzyme E2”. This class of genes has been shown to regulate plant disease resistance, both positively and negatively. Examples include the U-box type E3 ubiquitin ligase, CMPG1, that regulates immunity in multiple plant species (González-Lamothe et al., 2006), SPL11, a negative regulator of cell death in rice (Zeng et al., 2004), and Plant U-box 22 (PUB22), PUB23, and PUB24, that negatively regulate PTI in Arabidopsis (Trujillo et al., 2008). Genes TraesCS5B01G005200, TraesCS5B01G005300, and TraesCS5B01G005400 all showed sequence similarity to protein kinases, a class of genes known to play a role in disease resistance (Xia, 2004). However, protein kinase domains were only predicted within the amino acid sequence of TraesCS5B01G005400. Finally, gene models TraesCS5B01G005500 and TraesCS5B01G005600 (containing SNPs BS00064297_51b and BS00064298_51b) both encode predicted transmembrane proteins, with BLASTn matches (≤7e-66) to single, unannotated genes in rice and brachypodium. Further work is needed to investigate whether any of these genes underlie Snn3-B1.
The Use of Effector Sensitivity Loci for Wheat Research and Breeding
SnTox3 sensitivity and disease susceptibility had previously been reported to be poorly correlated (Friesen et al., 2009), only accounting for a significant portion of disease phenotype in adult plants segregating for sensitivity alleles at Snn3-B1, Tsn1, and Snn2 – although when infected with P. nodorum isolates lacking SnToxA. This is consistent with the notion that the SnToxA–Tsn1 interaction is epistatic to the SnTox3–Snn3-B1 interaction (Friesen et al., 2008). However, more recently, the Snn3-B1 locus has been identified in QTL analysis of adult plant field resistance to SNB in northwestern Europe (Waters et al., 2011; Lu and Lillemo, 2014; Ruud et al., 2017b). It is thought that SnTox1 expression inhibits the transcription of SnTox3 (Phan et al., 2016). This may explain the reason that while gene-for-gene interactions are readily identified via effector infiltration, their interactions are not always additive. However, recent work has found infiltration of wheat seedlings with culture filtrate using SnTox3 positive P. nodorum isolates resulted in a necrotic phenotype on wheat containing Snn3-B1, irrespective of the presence of SnTox1 in the pathogen (Ruud et al., 2017b). Nevertheless, the differing associations between disease susceptibility and effector sensitivity will likely depend on the effectors present in regional pathogen populations, the interactions between these effectors, and the alleles present at their corresponding host sensitivity loci. To allow rapid selection for allelic state at Snn3-B1, we develop a co-dominant KASP genetic marker closely linked to the locus for use within wheat breeding programs. The marker represents a useful tool for marker-assisted selection for SNB, given the proven association between Snn3-B1 and SNB resistance and that the marker is able to robustly call alleles. Despite the relatively simple Mendelian control of the trait in bread wheat, however, this marker is not a perfect predictor of SnTox3 sensitivity in the 457 phenotyped accessions in the AM panel – most notably, the 43 highly SnTox3 sensitive varieties that carry A:A alleles at SNP Excalibur_c47452_183 (Table 3 and Supplementary Table S1). This is similar to the results of other studies that have attempted to identify diagnostic markers for SnTox3 sensitivity (Shi et al., 2016a; Phan et al., 2018). This observation could be due to a number of reasons, including one or a combination of the following: insufficient marker saturation, multiple alleles at the Snn3-B1 locus, control by copy number variation, or the effect of minor QTL. Indeed, SnTox3 sensitivity in the AM panel shows more of a quantitative distribution, in contrast to the qualitative phenotypic distribution found for SnToxA sensitivity (Figure 1). Nevertheless, the KASP marker for SNP Excalibur_c47452_183 developed here will be of use in tracking SnTox3 sensitivity alleles where the sensitivity of the founders is known (e.g., Supplementary Table S1), and to help further narrow the Snn3-B1 genetic interval. For example, given that nearly all varieties phenotyped that carry G:G alleles, with few exceptions, are highly sensitive (score > 3) for SnTox3, this marker could be used to remove the majority of highly sensitive varieties from a breeding program.
Author Contributions
RD, LB, GM, and GR undertook research. RD, KG, NG, CCM, IM, and JC analyzed the data. EF, JC, KG, HP, IM, and RO provided scientific input and project resources. JC, K-CT, NG, and RO provided supervision and project management. RD and JC wrote the manuscript. All authors reviewed the manuscript.
Funding
This work was funded by Biotechnology and Biological Sciences Council (BBSSRC) grant BB/N00518X/1, BBSRC Ph.D. grant to RD, and by Curtin University – Grains Research and Development Corporation bilateral research grant CUR00023. Joint coordination and planning of project activities by JC and RO was aided by networking activities funded under the COST Action “SUSTAIN”.
Conflict of Interest Statement
The authors declare that the research was conducted in the absence of any commercial or financial relationships that could be construed as a potential conflict of interest.
The reviewer AT and handling Editor declared their shared affiliation.
Acknowledgments
The authors would like to thank the International Wheat Genome Sequencing Consortium for prepublication access to IWGSC RefSeq v1.0.
Supplementary Material
The Supplementary Material for this article can be found online at: https://www.frontiersin.org/articles/10.3389/fpls.2018.00881/full#supplementary-material
Abbreviations
AM, association mapping; CIM, composite interval mapping; GWAS, genome-wide association scans; MAGIC, multi-parent advanced generation inter-cross; QTL, quantitative trait locus/loci; SMA, single marker analysis; SNB, septoria nodorum blotch; SNP, single nucleotide polymorphism.
Footnotes
References
Abeysekara, N. S., Friesen, T. L., Keller, B., and Faris, J. D. (2009). Identification and characterization of a novel host-toxin interaction in the wheat-Stagonospora nodorum pathosystem. Theor. Appl. Genet. 120, 117–126. doi: 10.1007/s00122-009-1163-6
Altschul, S. F., Gish, W., Miller, W., Myers, E. W., and Lipman, D. J. (1990). Basic local alignment search tool. J. Mol. Biol. 215, 403–410. doi: 10.1016/S0022-2836(05)80360-2
Badaeva, E. D., Dedkova, O. S., Gay, G., Pukhalskyi, V. A., Zelenin, A. V., Bernard, S., et al. (2007). Chromosomal rearrangements in wheat: their types and distribution. Genome 50, 907–926. doi: 10.1139/G07-072
Ballance, G. M., Lamari, L., and Bernier, C. C. (1989). Purification and characterisation of host-selective necrosis toxin from Pyrenophora tritici-repentis. Physiol. Mol. Plant Pathol. 35, 203–213. doi: 10.1016/0885-5765(89)90051-9
Bates, D., Maechler, M., Bolker, B., and Walker, S. (2015). Fitting linear mixed-effects models using lme4. J. Stat. Softw. 67, 1–48. doi: 10.18637/jss.v067.i01
Bhathal, J. S., and Loughman, R. (2003). Yield reduction in wheat in relation to leaf disease from yellow (tan) spot and septoria nodorum blotch. Eur. J. Plant Pathol. 109, 435–443. doi: 10.1023/A:1024277420773
Broman, K. W., Wu, H., and Churchill, G. A. (2003). R/qtl: QTL mapping in experimental crosses. Bioinformatics 19, 889–890. doi: 10.1093/bioinformatics/btg112
Chu, C.-G., Faris, J. D., Xu, S. S., and Friesen, T. L. (2010). Genetic analysis of disease susceptibility contributed by the compatible Tsn1-SnToxA and Snn1-SnTox1 interactions in the wheat-Stagonospora nodorum pathosystem. Theor. Appl. Genet. 120, 1451–1459. doi: 10.1007/s00122-010-1267-z
Clavijo, B. J., Venturini, L., Schudoma, C., Accinelli, G. G., Kaithakottil, G., Wright, J., et al. (2017). An improved assembly and annotation of the allohexaploid wheat genome identifies complete families of agronomic genes and provides genomic evidence for chromosomal translocations. Genome Res. 27, 885–896. doi: 10.1101/gr.217117.116
Cockram, J., Jones, H., Leigh, F. J., O’Sullivan, D., Powell, W., Laurie, D. A., et al. (2007). Control of flowering time in temperate cereals: genes, domestication and sustainable productivity. J. Exp. Bot. 58, 1231–1244. doi: 10.1093/jxb/erm042
Cockram, J., and Mackay, I. J. (2018). “Genetic mapping populations for conducting high resolution trait mapping in plants,” in Advances in Biochemical Engineering Biotechnology, ed. R. Varshney (Berlin: Springer International Publishing).
Cockram, J., Scuderi, A., Barber, T., Furuki, E., Gardner, K. A., Gosman, N., et al. (2015). Fine-mapping the wheat Snn1 locus conferring sensitivity to the Parastagonospora nodorum necrotrophic effector SnTox1 using an eight founder multi-parent advanced generation intercross population. G3 5, 2257–2266. doi: 10.1534/g3.115.021584
Faris, J. D., Anderson, J. A., Francl, L. J., and Jordahl, J. G. (1996). Chromosomal location of gene conditioning insensitivity in wheat to a necrosis-inducing culture filtrate from Pyrenophora tritici-repentis. Phytopathology 86, 459–463. doi: 10.1094/Phyto-86-459
Faris, J. D., Zhang, Z., Lu, H., Reddy, L., Clouter, S., Fellers, J. P., et al. (2010). A unique wheat disease resistance-like gene governs effector-triggered susceptibility to necrotrophic pathogens. Proc. Natl. Acad. Sci. U.S.A. 107, 13544–13549. doi: 10.1073/pnas.1004090107
Finn, R. D., Coggill, P., Eberhardt, R. Y., Eddy, S. R., Mistry, J., Mitchell, A. L., et al. (2016). The Pfam proteins database: towards a more sustainable future. Nucleic Acids Res. 44, D279–D285. doi: 10.1093/nar/gkv1344
Friesen, T. L., Ali, S., Klein, K., and Rasmussen, J. B. (2005). Population genetic analysis of a global collection of Pyrenophora tritici-repentis, causal agent of tan spot of wheat. Phytopathology 95, 1144–1150. doi: 10.1094/PHYTO-95-1144
Friesen, T. L., Chu, C.-G., Liu, Z. H., Xu, S. S., Halley, S., and Faris, J. D. (2009). Host-selective toxins produced by Stagonospora nodorum confer disease susceptibility in adult wheat plants under Weld conditions. Theor. Appl. Genet. 118, 1489–1497. doi: 10.1007/s00122-009-0997-2
Friesen, T. L., Friesen, Z., Solomon, P. S., Oliver, R. P., and Faris, J. D. (2008). Characterization of the interaction of a novel Stagonospora nodorum host-selective toxin with a wheat susceptibility gene. Plant Physiol. 146, 682–693. doi: 10.1104/pp.107.108761
Friesen, T. L., Meinhardt, S. W., and Faris, J. D. (2007). The Stagonospora nodorum-wheat pathosystem involves multiple proteinaceous host-selective toxins and corresponding host sensitivity genes that interact in an inverse gene-for-gene manner. Plant J. 51, 681–692. doi: 10.1111/j.1365-313X.2007.03166.x
Fulton, T. M., Chunwongse, T., and Tanksley, S. D. (1995). Microprep protocol for extraction of DNA from tomato and other herbaceous plants. Plant Mol. Biol. Rep. 13, 207–209. doi: 10.1007/BF02670897
Gardner, K. A., Wittern, L. M., and Mackay, I. J. (2016). A highly recombined, high-density, eight founder wheat MAGIC map reveals extensive segregation distortion and genomic locations of introgression segments. Plant Biotechnol. J. 14, 1406–1417. doi: 10.1111/pbi.12504
González-Lamothe, R., Tsitsigiannis, D. I., Ludwig, A. A., Panicot, M., Shirasu, K., and Jones, J. D. (2006). The U-box protein CMPG1 is required for efficient activation of defense mechanisms triggered by multiple resistance genes in tobacco and tomato. Plant Cell 18, 1067–1083. doi: 10.1105/tpc.106.040998
Huang, B. E., and George, A. W. (2011). R/mpMap: a computational platform for the genetic analysis of multiparent recombinant inbred lines. Bioinformatics 27, 727–729. doi: 10.1093/bioinformatics/btq719
Kang, H. M., Zaitlen, N. A., Wade, C. M., Kirby, A., Heckerman, D., Daly, M. J., et al. (2008). Efficient control of population structure in model organism association mapping. Genetics 178, 1709–1723. doi: 10.1534/genetics.107.080101
Li, P.-C., Huang, J.-G., Yu, S.-W., Li, T.-T., Sun, P., et al. (2016). Arabidopsis YL1/BPG2 is involved in seedling shoot response to salt stress through ABI4. Sci. Rep. 3:30163. doi: 10.1038/srep30163
Lipka, A. E., Tian, F., Wang, Q., Peiffer, J., Li, M., Bradbury, P. J., et al. (2012). GAPIT: genome association and prediction integrated tool. Bioinformatics 28, 2397–2399. doi: 10.1093/bioinformatics/bts444
Liu, Z., Faris, J. D., Oliver, R. P., Tan, K.-C., Soloman, P. S., McDonald, M. C., et al. (2009). SnTox3 acts in effector triggered susceptibility to induce disease on wheat carrying the Snn3 gene. PLoS Pathog. 5:e1000581. doi: 10.1371/journal.ppat.1000581
Liu, Z., Friesen, T. L., Ling, H., Meinhardt, S. W., Oliver, R. P., Rasmussen, J. B., et al. (2006). The Tsn1-ToxA interaction in the wheat-Stagonospora nodorum pathosystem parallels that of the wheat-tan spot system. Genome 49, 1265–1273. doi: 10.1139/g06-088
Liu, Z., Zhang, Z., Faris, J. D., Oliver, R. P., Syme, R., McDonald, M. C., et al. (2012). The cysteine rich necrotrophic effector SnTox1 produced by Stagonospora nodorum triggers susceptibility of wheat lines harbouring Snn1. PLoS Pathog. 8:e1002467. doi: 10.1371/journal.ppat.1002467
Liu, Z. H., Faris, J. D., Meinhardt, S. W., Ali, S., Rasmussen, J. B., and Friesen, T. L. (2004). Genetic and physical mapping of a gene conditioning sensitivity in wheat to a partially purified host-selective toxin produced by Stagonospora nodorum. Phytopathology 94, 1056–1060. doi: 10.1094/PHYTO.2004.94.10.1056
Lu, Q., and Lillemo, M. (2014). Molecular mapping of adult plant resistance to Parastagonospora nodorum leaf blotch in bread wheat lines ‘Shanghai-3/Catbird’ and ‘Naxos’. Theor. Appl. Genet. 127, 2635–2644. doi: 10.1007/s00122-014-2404-x
Mackay, I. J., Bansept-Basler, P., Barber, T., Bentley, A. R., Cockram, J., Gosman, N., et al. (2014). An eight-parent multiparent advanced generation inter-cross population for winter-sown wheat: creation, properties, and validation. G3 4, 1603–1610. doi: 10.1534/g3.114.012963
McCallum, C. M., Comai, L., Greene, E. A., and Henikoff, S. (2000). Targeting induced local lesions IN genomes (TILLING) for plant functional genomics. Plant Physiol. 123, 439–442. doi: 10.1104/pp.123.2.439
McIntosh, R. A., Yamazaki, Y., Dubcovsky, J., Rogers, J., Morris, C., Somers, D. J., et al. (2008). “Catalogue of gene symbols for wheat,” in Proceedings of the 11th International Wheat Genetics Symposium, San Diego, CA, 24–29.
Oliver, R. P., Friesen, T. L., Faris, J. D., and Solomon, P. S. (2012). Stagonospora nodorum: from pathology to genomics and host resistance. Annu. Rev. Phytopathol. 50, 23–43. doi: 10.1146/annurev-phyto-081211-173019
Oliver, R. P., and Solomon, P. S. (2010). New developments in pathogenicity and virulence of necrotrophs. Curr. Opin. Plant Biol. 13, 415–419. doi: 10.1016/j.pbi.2010.05.003
Phan, H., Rybak, K., Bertazzoni, S., Furuki, E., Dinglasan, E., Hickey, L. T., et al. (2018). Novel sources of resistance to Septoria nodorum blotch in the Vavolov wheat collection identified by genome-wide association studies. Theor. Appl. Genet. 131, 1223–1238. doi: 10.1007/s00122-018-3073-y
Phan, H., Rybak, K., Furuki, E., Breen, S., Solomon, P. S., Oliver, R. P., et al. (2016). Differential effector gene expression underpins epistasis in a plant fungal disease. Plant J. 87, 343–354. doi: 10.1111/tpj.13203
Qi, Y., Zhao, J., An, R., Zhang, J., Liang, S., Shao, J., et al. (2016). Mutations in circularly permuted GTPase family genes AtNOA1/RIF1/SVR10 and BPG2 supress var2-mediated leaf variegation in Arabidopsis thaliana. Photosynth. Res. 127, 355–367. doi: 10.1007/s11120-015-0195-9
Quaedvlieg, W., Verkley, G. J., Shin, H. D., Barreto, R. W., Alfenas, A. C., Swart, W. J., et al. (2013). Sizing up septoria. Stud. Mycol. 75, 307–390. doi: 10.3114/sim0017
R Core Team (2013). R: A Language and Environment for Statistical Computing. Vienna: R foundation for statistical computing.
Ramirez-Gonzalez, R. H., Uauy, C., and Caccamo, M. (2015). PolyMarker: a fast polyploid primer design pipeline. Bioinformatics 31, 2038–2039. doi: 10.1093/bioinformatics/btv069
Ruud, A. K., Dieseth, J. A., and Lillemo, M. (2017a). Effects of three Parastagonospora nodorum necrotic effectors on spring wheat under Norwegian field conditions. Crop Sci. 58, 159–168. doi: 10.2135/cropsci2017.05.0281
Ruud, A. K., Windju, S., Belova, T., Friesen, T. L., and Lillemo, M. (2017b). Mapping of SnTox3–Snn3 as a major determinant of field susceptibility to Septoria nodorum leaf blotch in the SHA3/CBRD × Naxos population. Theor. Appl. Genet. 130, 1361–1374. doi: 10.1007/s00122-017-2893-5
Shaw, P. D., Kennedy, J., Graham, M., Milne, I., and Marshall, D. F. (2014). Helium: visualization of large scale plant pedigrees. BMC Bioinformatics 15:259. doi: 10.1186/1471-2105-15-259
Shi, G., Zhang, Z., Friesen, T. L., Bansal, U., Cloutier, S., Wicker, T., et al. (2016a). Marker development, saturation mapping, and high-resolution mapping of the Septoria nodorum blotch susceptibility gene Snn3–B1 in wheat. Mol. Genet. Genomics 291, 107–119. doi: 10.1007/s00438-015-1091-x
Shi, G., Zhang, Z., Friesen, T. L., Raats, D., Fahima, T., Brueggeman, R. S., et al. (2016b). The hijacking of a receptor kinase-driven pathway by a wheat fungal pathogen leads to disease. Sci. Adv. 2:e1600822.
Solomon, P. S., Lowe, R. G., Tan, K.-C., Waters, O. D., and Oliver, R. P. (2006). Stagonospora nodorum: cause of stagonospora nodorum blotch of wheat. Mol. Plant Pathol. 7, 147–156. doi: 10.1111/j.1364-3703.2006.00326.x
Tan, K. C., Ferguson-Hunt, M., Rybak, K., Walters, O. D., Stanley, W. A., Bond, C. S., et al. (2012). Quantitative variation in effector activity of ToxA isoforms from Stagonospora nodorum and Pyrenophora tritici-repentis. Mol. Plant Microbe Interact. 25, 515–522. doi: 10.1094/MPMI-10-11-0273
Tan, K.-C., Walters, O. D. C., Rybak, K., Antoni, E., Furuki, E., and Oliver, R. P. (2014). Sensitivity to three Parastagonospora nodorum necrotrophic effectors in current Australian wheat cultivars and the presence of further fungal effectors. Crop Pasture Sci. 65, 150–158. doi: 10.1071/CP13443
Tanaka, S. (1933). Studies on black spot disease of the Japanese Pear (Pirus serotina Rehd). Memoirs of the College of Agriculture. Kyoto: Kyoto University, 31.
Tomas, A., Gene, G. H., Reeck, G. R., Bockus, W. W., and Leach, J. E. (1990). Purification of a cultivar-specific toxin from Pyrenophora tritici-repentis, causal agent of tan spot of wheat. Mol. Plant Microbe Interact. 3, 221–224. doi: 10.1094/MPMI-3-221
Trujillo, M., Ichimura, K., Casais, C., and Shirasu, K. (2008). Negative regulation of PAMP-triggered immunity by an E3 ubiquitin ligase triplet in Arabidopsis. Curr. Biol. 18, 1396–1401. doi: 10.1016/j.cub.2008.07.085
Tuinstra, M. R., Ejeta, G., and Goldsbrough, P. B. (1997). Heterogeneous inbred family (HIF) analysis: a method for developing near-isogenic lines that differ at quantitative trait loci. Theor. Appl. Genet. 95, 1005–1011. doi: 10.1007/s001220050654
Vincent, D. L., Du Fall, L. A., Livk, A., Mathesius, U., Lipscombe, R. J., Olliver, R. P., et al. (2012). A functional genomics approach to dissect the mode of action of the Stagonospora nodorum effector protein SnToxA in wheat. Mol. Plant Pathol. 13, 467–482. doi: 10.1111/j.1364-3703.2011.00763.x
Wang, S., Wong, D., Forrest, K., Allen, A., Chao, S., Huang, B. E., et al. (2014). Characterization of polyploid wheat genomic diversity using a high-density 90,000 single nucleotide polymorphism array. Plant Biotechnol. J. 12, 787–796. doi: 10.1111/pbi.12183
Waters, O. D. C., Lichtenzveig, J., Rybak, K., Friesen, T. L., and Oliver, R. P. (2011). Prevalence and importance of sensitivity to the Stagonospora nodorum necrotrophic effector SnTox3 in current Western Australian wheat cultivars. Crop Pasture Sci. 62, 556–562. doi: 10.1071/CP11004
Xia, Y. (2004). Proteases in pathogenesis and plant defence. Cell. Microbol. 6, 905–913. doi: 10.1111/j.1462-5822.2004.00438.x
Zadoks, J. C., Chang, T. T., and Konzak, C. F. (1974). A decimal code for the growth stages of cereals. Weed Res. 14, 415–421. doi: 10.1111/j.1365-3180.1974.tb01084.x
Zeng, L. R., Qu, S., Bordeos, A., Yang, C., Baraoidan, M., Yan, H., et al. (2004). Spotted leaf11, a negative regulator of plant cell death and defense, encodes a U-box/armadillo repeat protein endowed with E3 ubiquitin ligase activity. Plant Cell 16, 2795–2808. doi: 10.1105/tpc.104.025171
Keywords: Parastagonospora nodorum, SnTox3, fungal effector proteins, multi-parent advanced generation inter-cross, genome-wide association scans, high-density SNP genotyping, genetic markers
Citation: Downie RC, Bouvet L, Furuki E, Gosman N, Gardner KA, Mackay IJ, Campos Mantello C, Mellers G, Phan HTT, Rose GA, Tan K-C, Oliver RP and Cockram J (2018) Assessing European Wheat Sensitivities to Parastagonospora nodorum Necrotrophic Effectors and Fine-Mapping the Snn3-B1 Locus Conferring Sensitivity to the Effector SnTox3. Front. Plant Sci. 9:881. doi: 10.3389/fpls.2018.00881
Received: 22 January 2018; Accepted: 06 June 2018;
Published: 04 July 2018.
Edited by:
Luigi Cattivelli, Consiglio per la Ricerca in Agricoltura e l’Analisi dell’Economia Agraria (CREA), ItalyReviewed by:
Agata Gadaleta, Università degli studi di Bari Aldo Moro, ItalyAlessandro Tondelli, Consiglio per la Ricerca in Agricoltura e l’Analisi dell’Economia Agraria (CREA), Italy
Copyright © 2018 Downie, Bouvet, Furuki, Gosman, Gardner, Mackay, Campos Mantello, Mellers, Phan, Rose, Tan, Oliver and Cockram. This is an open-access article distributed under the terms of the Creative Commons Attribution License (CC BY). The use, distribution or reproduction in other forums is permitted, provided the original author(s) and the copyright owner(s) are credited and that the original publication in this journal is cited, in accordance with accepted academic practice. No use, distribution or reproduction is permitted which does not comply with these terms.
*Correspondence: Rowena C. Downie, cm93ZW5hLmRvd25pZUBuaWFiLmNvbQ== James Cockram, amFtZXMuY29ja3JhbUBuaWFiLmNvbQ==
†Present address: Nick Gosman, Azotic Technologies Ltd., Nottingham, United Kingdom