 Cyril Douthe1
 Hipólito Medrano1Ignacio Tortosa1Jose Mariano Escalona1
 Esther Hernández-Montes2†
 Alicia Pou2*
- 1Research Group on Plant Biology Under Mediterranean Conditions, INAGEA, Department of Biology, University of the Balearic Islands, Palma, Spain
- 2Instituto de Ciencias de la Vid y del Vino, Logroño, Spain
Water scarcity is a main challenge in vineyards sustainability in most of the grapevine areas now and even more in near future due to climatic change perspectives. In consequence, water use efficiency (WUE) measurements are of the highest interest to improve the sustainability of this crop. The vast majority of WUE measurements relays on measurements of leaf carbon and water fluxes at leaf-level. However, less data are available at the whole-plant level, and for the moment those data are not totally coincident with conclusions reached at leaf scale. In this study, we used whole-plant chambers able to enclose an entire plant of 12 years old to measure at the same time water and carbon fluxes under realistic field grown conditions. The main objectives were to identify the technical issues interfering the whole-plant measurements and track the environmental and other abiotic factors that can affect water and carbon balance, i.e., WUE at the whole-plant scale. To achieve those objectives, we measured whole-plant water and carbon fluxes in grapevine exposed to two different water regimes at three phenological stages [pea size (July), ripening (August), and harvest (September)]. In September, measurements were repeated under high CO2 to also check its effect at the whole-plant scale. The results indicate that water and carbon fluxes are well coordinated under both water availability treatments. Under drought conditions, both fluxes were drastically reduced, but surprisingly the estimated WUE resulted not improved but decreased, contrarily to what is shown at the leaf scale. The phenology (September) also strongly decreased both water and carbon fluxes when compared to measurements in July. We hypostatized that harvest load respiration rates could have an important weight on the whole-plant net carbon exchange (NCE). Finally, high CO2 measurements, after correction for leaks, indicated an increase of whole-plant NCE as well as increased whole-plant WUE, as expected. Several technical issues were identified, like 1/instability of [CO2] during the night period that prevent robust estimation of whole-plant respiration and 2/condensation during last night and sun-rise hours which may affect the estimation of daily plant transpiration.
Introduction
Water use efficiency (WUE) refers to the ratio of water used in plant carbon assimilation (photosynthesis; AN) or in biomass production to water lost by the plant through transpiration (E) and it has become an important parameter to take into account in agricultural systems to increase yield production in semi-arid areas to get more crop per drop. Either AN or E are commonly recorded on single leaves by using portable infrared gas analyzers (IRGAs). However, in canopies such as grapevine and other crops, it has been shown that leaf-level photosynthesis measurements are largely dependent on leaf position (Escalona et al., 2003) so that typical single-leaf measurements can provide incomplete information if extrapolated to quantify photosynthesis at the whole-plant level. On the other hand, whole-vine photosynthesis expressed on a leaf area basis usually results below than expected extrapolating values from single-leaf measurements (Edson et al., 1993; Intrieri et al., 1997; Poni et al., 2009). Factors such as leaf light exposure and position on the shoot, leaf aging and the presence of organs like fruits, shoots, and trunks in a given canopy makes difficult to scaling up from single-leaf to whole-canopy photosynthesis (Alleweldt et al., 1982; Schultz, 1993; Intrieri et al., 1997; Poni et al., 1997; Petrie et al., 2000; Escalona et al., 2003). Moreover, other processes such as nocturnal water loss and respiration (Escalona et al., 2012, 2013) or possible changes in dry matter partitioning among different sinks (Tomàs et al., 2014) may explain a frequently reported lack of correlation between WUEi and WUE expressed as biomass accumulation per unit of water lost.
Scaling up to the whole canopy by using meteorological methods such as eddy correlation or covariance (Field et al., 1989; Long and Hällgren, 1989; Garcia et al., 1990), or by enclosing methods in open system flow-through chambers in which water vapor and CO2 fluxes are measured using an IRGA (Garcia et al., 1990; Poni et al., 1997) has been explored as a way to achieve a reliable measurement of the whole-plant gas-exchange measurement. Moreover, it has become an interesting tool to assess whole-plant responses to climatic change conditions, e.g., high CO2, water stress, high temperatures, etc. But on the other hand, one of scientist’s current concerns is to design a good enclosure system to minimize disturbance of the plant natural environment (Intrieri et al., 1997; Poni et al., 1997; Perez Peña and Tarara, 2004), i.e., to diminish errors associated with the “chamber effect.” Hence, even with a highly transparent cover, an enclosure increases air temperature and reduces incident radiation intensity in the canopy as well as gas exchange between the plant and the atmosphere (Perez Peña and Tarara, 2004) and, contrarily of what it happened when measuring WUE at the leaf-level, these studies reported that WUE at the whole-plant level was not higher on a daily basis in deficit-irrigated vines in comparison with well-watered plants, likely due to their higher respiration rates (Pagay, 2016).
On the other hand, studies about the quantification of the CO2 flows from different organs such as stems, roots and fruits along the vine vegetative cycle and the grapevine’s leaves maturity effects on the whole-plant carbon budgets are important but rather scarce. Several previous studies showed the contribution of grapevine clusters to the total carbon balance (Ollat and Gaudillère, 2000; Palliotti and Cartechini, 2001; Escalona et al., 2012; Hernández-Montes et al. unpublished data) and they reported a contribution of 10 and 18% to the carbon required for fruit development obtained by fruit photosynthesis and by the whole berry respiration, respectively. In this sense, it would be expected that a high rate of respiration during fruit ripening would greatly reduce daily net CO2 exchange rate (NCER). Miller et al. (1997) stated a rapid decrease of the NCER rate from, through harvest, in sharp contrast to the broadleaf chamber which showed no change in AN rate per unit leaf area over the same period. Thus, to quantify the CO2 flows from each organ may contribute to calculate more accurately total plant carbon balances.
In this work, we have used an open framed, open-top, flow through chamber, according to Perez Peña and Tarara (2004) as has been previously reported in Escalona et al. (2016). A detailed evaluation of the daily whole-canopy NCERs and whole-canopy transpiration rates (E) have been done. Parameters such as nocturnal transpiration (Enight) and canopy dark respiration (Rd), were also considered to evaluate the whole-canopy WUE and to point out potential problems of integrating this data.
The goals of this study were: (i) to asses about leaks and difficulties encountered when measuring daily NCER and E to identify improvements needed for a more accurate estimation rates, (ii) measure daily whole-plant WUE for grapevines as affected by different irrigation treatments and high CO2, and (iii) to estimate the contribution of the grapevine’s leaves age and berry development to the total plant carbon balance along the vine phenology.
Materials and Methods
Plant Material and Site of Study
Measurements were conducted in summer 2017 in an experimental vineyard planted in 2009 with Grenache vines grafted in 110-Richter rootstocks, at the University of Balearic Islands. Vines were planted with 2.5 m between rows and 1 m between vines in a N–S orientation, and were submitted to two water regimes: (i) a moderate water irrigation (I) applying a crop coefficient of 0.5 of potential evapotranspiration calculated using Penman–Monteith equation, and (ii) non-irrigation (NI) (see Escalona et al., 2016 for details). Plants were irrigated twice a week from June to September with drips delivering 2 L h-1 placed at 0.6 m from each other.
Measurements were carried-out in two representative plants for each phenological stage [pea size, irrigation (July); ripening, non-irrigation (August) and harvest, irrigation and high CO2 (September)]. The corresponding meteorological data is shown in Figure 1. The same irrigated plants were measured in July and September, while other two non-irrigated plants were measured in August. Thus, for pure phenological effect, sessions of July and September can be directly compared (same plants and both in watered conditions). For drought effects, sessions of August and September can be compared, since only 20 days separated the two measurements. For each session, plants remained inside the chambers 2 or 3 days before the measurements were taken to avoid the disturbing effect of the chamber installation. Afterward the chambers were removed and plants were grown outside the chambers until the next period of measurements (1 month between each period). Each measuring session (for each phenological stage) last two or three consecutive days. Concerning the data treatment, all data were averaged from 1 h.
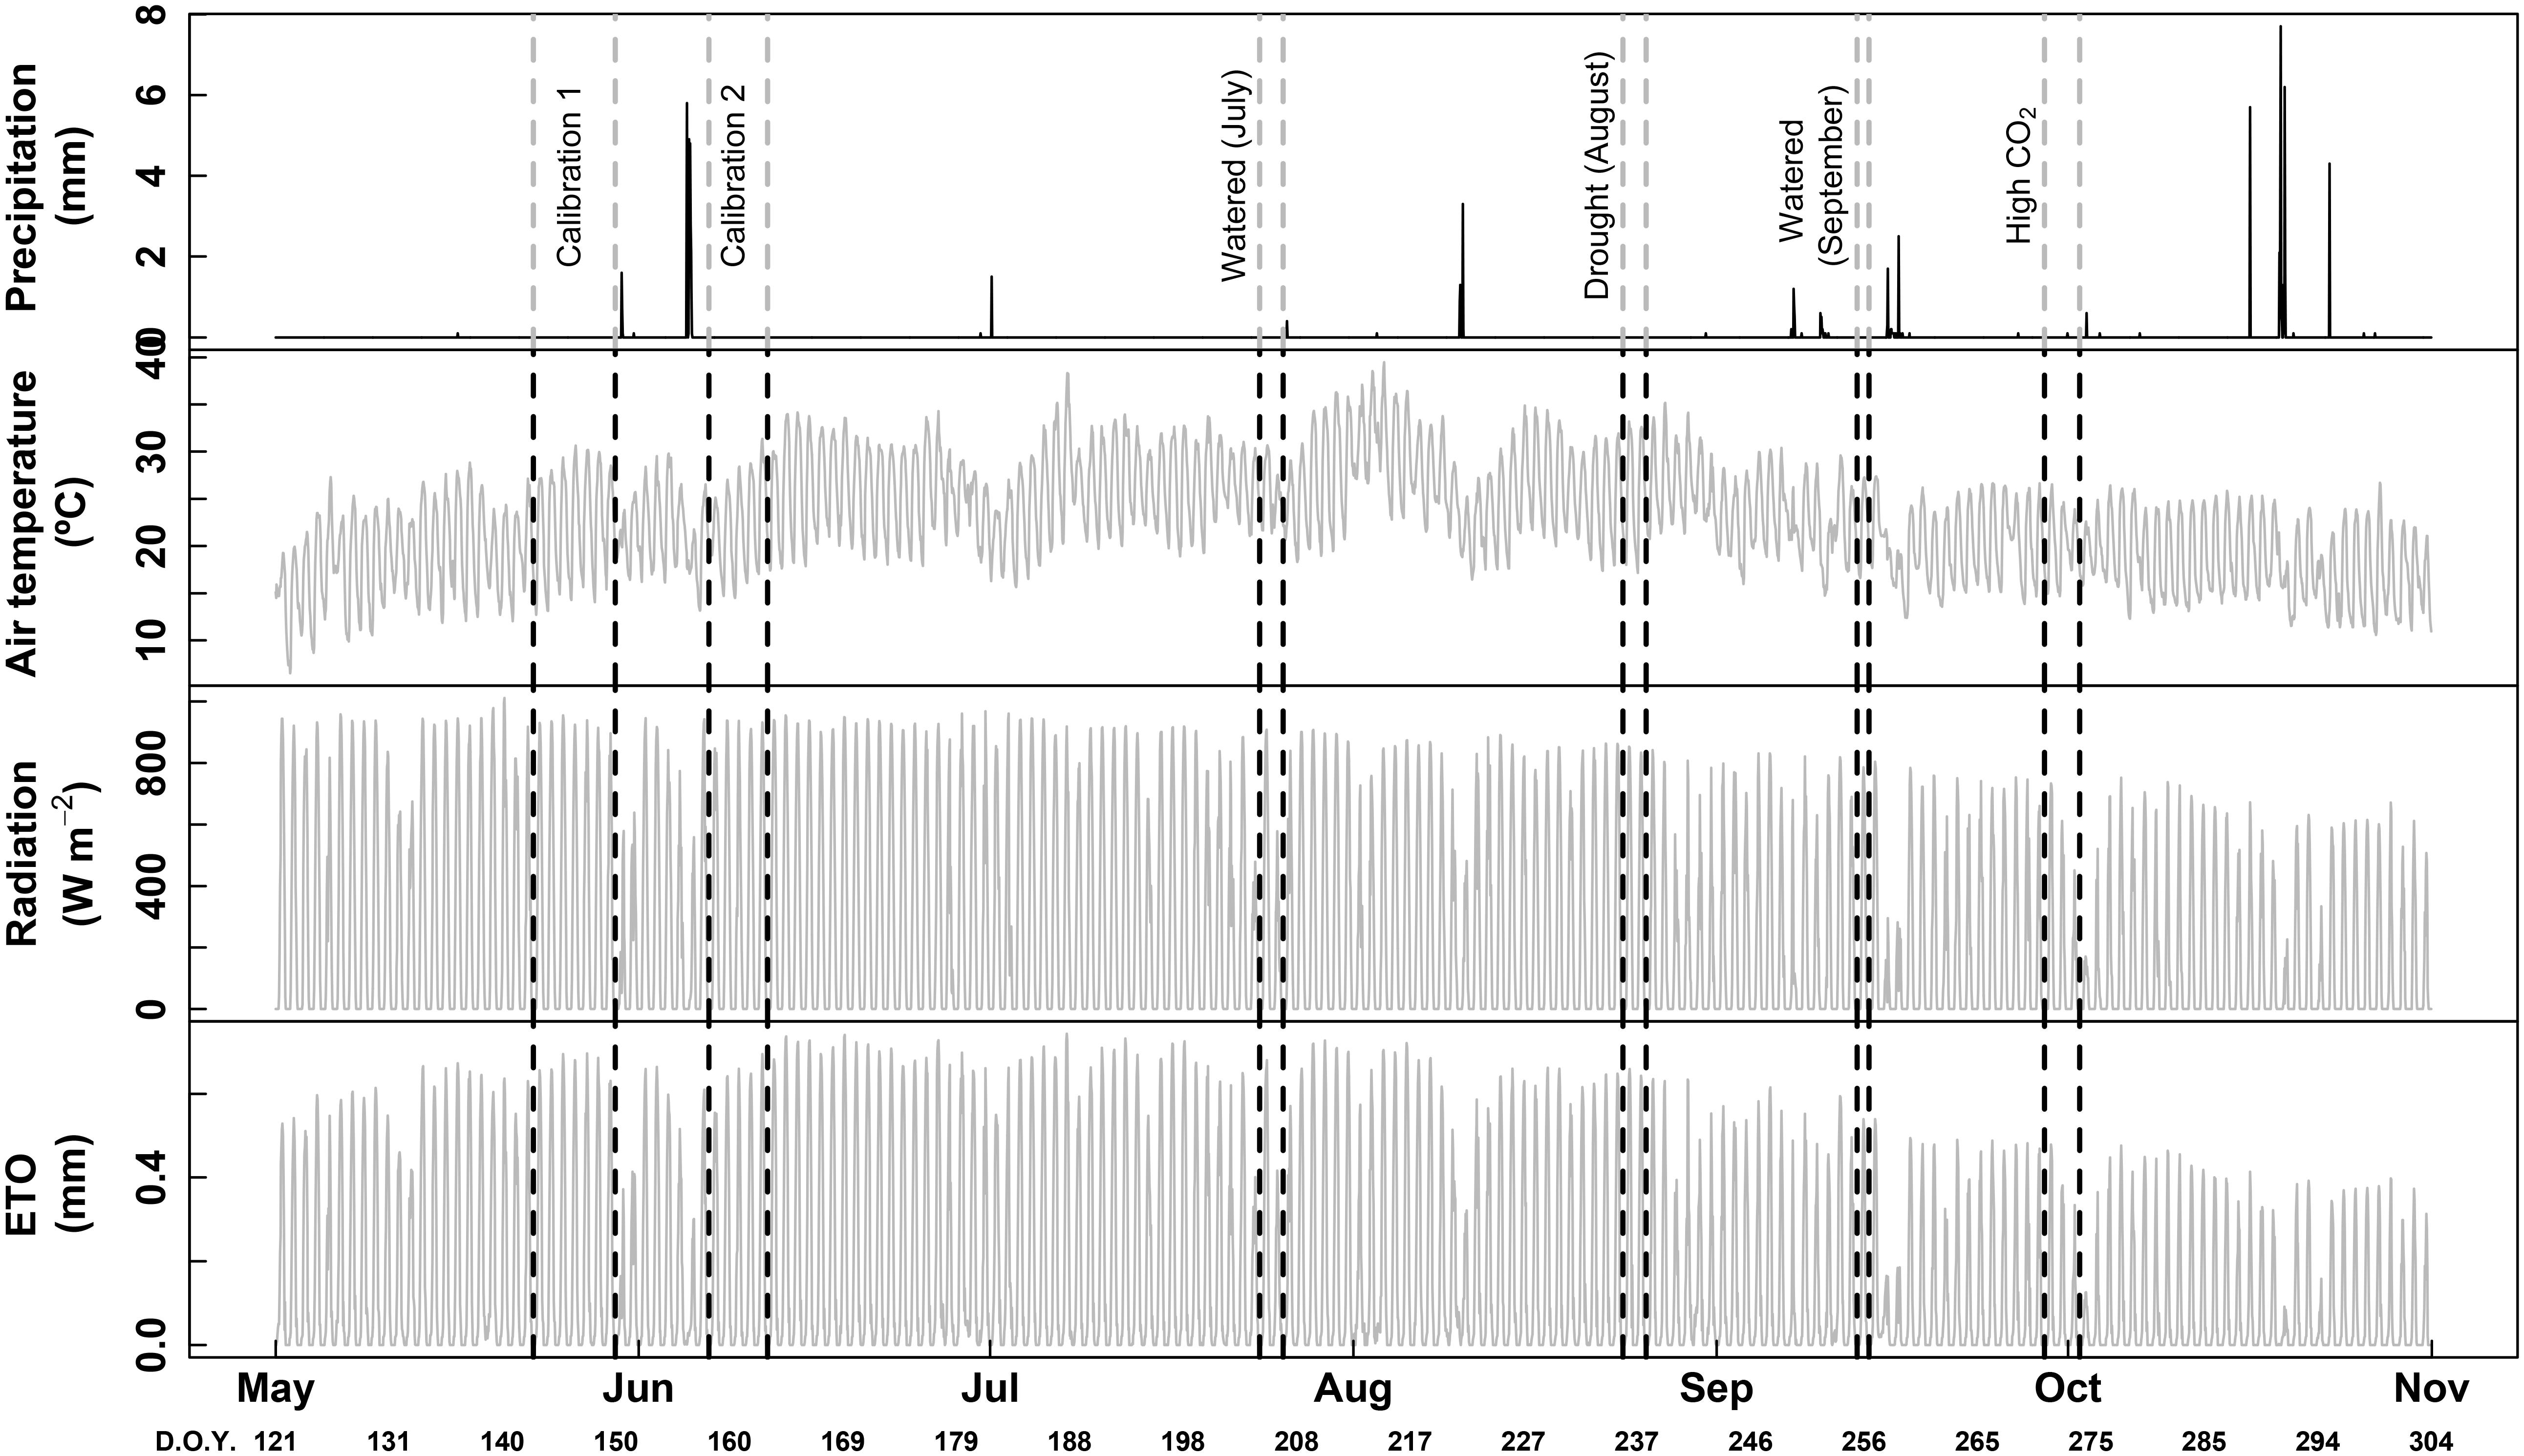
FIGURE 1. Hourly raw data of precipitation, air temperature, radiation and ET0 (potential evapotranspiration). Vertical dotted lines indicate dates of each session of measurements performed in this study, with the corresponding treatments. D.O.Y. for day of the year.
Meteorological Condition During the Experiment
Weather information was recorded using an automatic meteorological station located in the experimental vineyard (Meteodata, 3000, Geonica) (see Table 1 and Figure 1). Effective rainfall was <5 mm in July and August with similar mean diurnal temperatures (29.5°C) and relative humidity (46–48%), while measurements in September were performed with more rainfall (11.5 mm), lower mean diurnal temperatures (23.8°C) and higher relative humidity (67.1%).
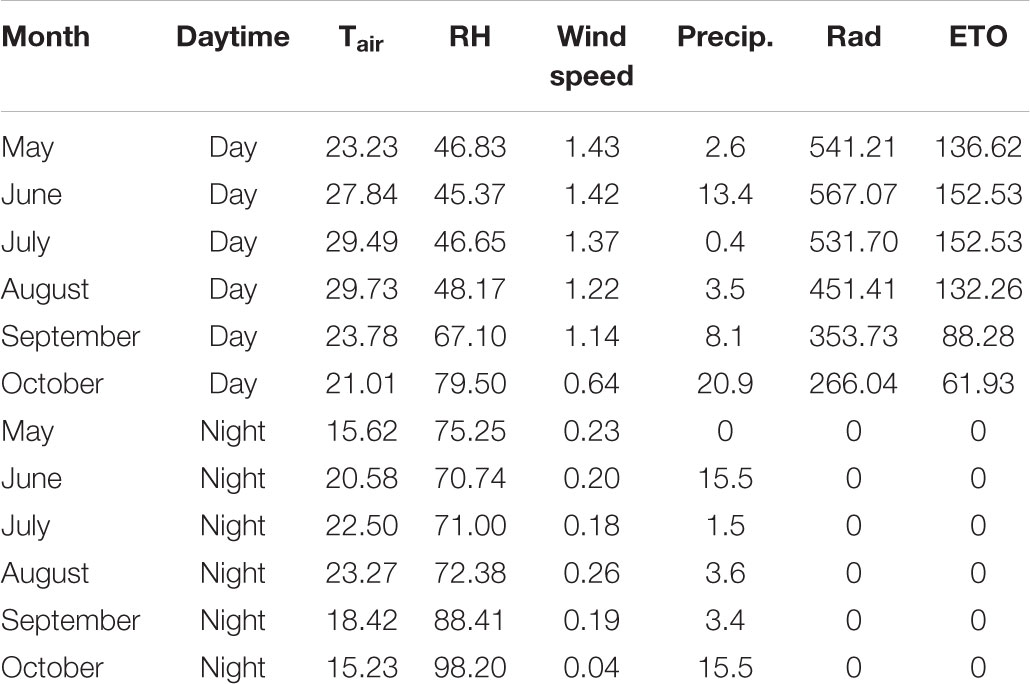
TABLE 1. Average values of air temperature (Tair, °C), relative humidity (RH, %), wind speed (m s-1), cumulative precipitations (Precip.), average radiation (Rad, W m-2) and cumulative evapotranspiration (ET0, mm) for each month of measurement and separated for day/night time.
Whole-Plant Gas Exchange Chambers
Whole-plant net carbon exchange (NCE) and transpiration were measured using two open-top chambers (3.36 m3 each) covered with plastic film (RX 140-PropafilmTM). An air flow (Series 641 Air Velocity Transmitter, Dwyer, IN, United States) through the chamber of 278 mol min-1 (F) was maintained for all measurements, delivered by a constant speed turbine (S & P 500) fed by a ∅ = 165 mm pipe taking the atmospheric air at 3 m above ground. Air entering and leaving the chamber was pumped (TD4x2 type NA; Braislford Pumps, United States) at a flow of 0.5–1 L min-1 to feed a calibrated gas analyzer (Li-840, Li-Cor, Inc., Lincoln, NE, United States). The air flow entering and outgoing the chamber was measured during five consecutive minutes each, alternatively. The four first minutes of data were eliminated to ensure a complete turn-over of the gas in the measuring circuit. [CO2] and [H2O] were used to estimate plant NCE and transpiration (E) with:
where F is the air flow through the chamber, Ce and We the [CO2] and [H2O] entering the chamber, Co and Wo the [CO2] and [H2O] outgoing the chamber and La the total leaf area of the plant. Plant leaf area was estimated in each one of the measured plants at harvest using the methodology proposed by Sánchez-de-Miguel et al. (2010).
Air temperature was measured with type K thermocouple (RoHS, Model TP-01), and placed in the top-center of the chamber. The atmospheric air temperature was recorded with a meteorological station (see above) situated at 50 m from the chambers. The difference in temperature inside/outside the chamber was comprised between 4 and 5°C, with some punctual peaks at 10°C during august. Some of these variations come from the fact that the thermocouple was directly exposed to sun (not shaded), which could increase the estimated temperature from the real one.
Validation of the Gas Exchange Measurements
We intended to confirm the reliability of the gas-exchange measurements with an external estimation of the plant transpiration. For these measurements, we placed one potted vine in each chamber (total plant leaf area around 0.5 m2), placed on a balance (Baxtran, equipped with Giropes module L6E) to measure Transpiration by the loss of weight through 4 days. Chambers were equipped with the gas-exchange system described just above (except the 3 m chimney that was not placed for the calibration), and transpiration via gravimetry and gas-exchange were compared.
Statistical Analysis
All the data analysis was performed using R (R Core Team, 2016), Foundation for Statistical Computing, Vienna, Austria).
Results
Conditions During the Study
The Figure 1 shows the meteorological conditions all along the experiment as well as the location of each session of calibration and measurement.
Climate conditions during the experiment (May–September 2017) were typical for Mediterranean regions, with daytime temperatures above 25°C, night temperatures above 20°C and diurnal radiation frequently reaching 800 W m-2 (Figure 1). Peak photosynthetic photon flux density (PPFD) at midday was usually 1500–1700 μmol m-2 s-1 (not shown).
Comparison Between Gas-Exchange and Gravimetry
To validate the gas-exchange measurements, a potted plant on a balance was placed in each chamber. The weight of each plant was monitored continuously during 24 h for five consecutive days. The calibration procedure was carried-out two times in May and June 2017 (see Figure 1). The resulted correlation between both estimations of the plant transpiration for chamber 1 and chamber 2 were R2 = 0.54 and 0.65 (both p < 0.001), respectively (Figure 2). We observed that gravimetry and gas-exchange data were sometimes noisy (irregular peaks). Such peaks were not related to plant transpiration dynamics but to 1/noise measurement form the device and 2/some possible condensation inside the plant chamber. Diurnal cycles were treated with a spline to eliminate such non-biological noise (Figures 2C,D). The resultant correlations were improved for both chambers (Figure 2B), with R2 = 0.75 and 0.73 (both p < 0.001) for chamber 1 and 2, respectively. We also observed a progressive decrease of the maximum transpiration rate along the calibration session (5 days), since plants were not watered while being inside the chamber.
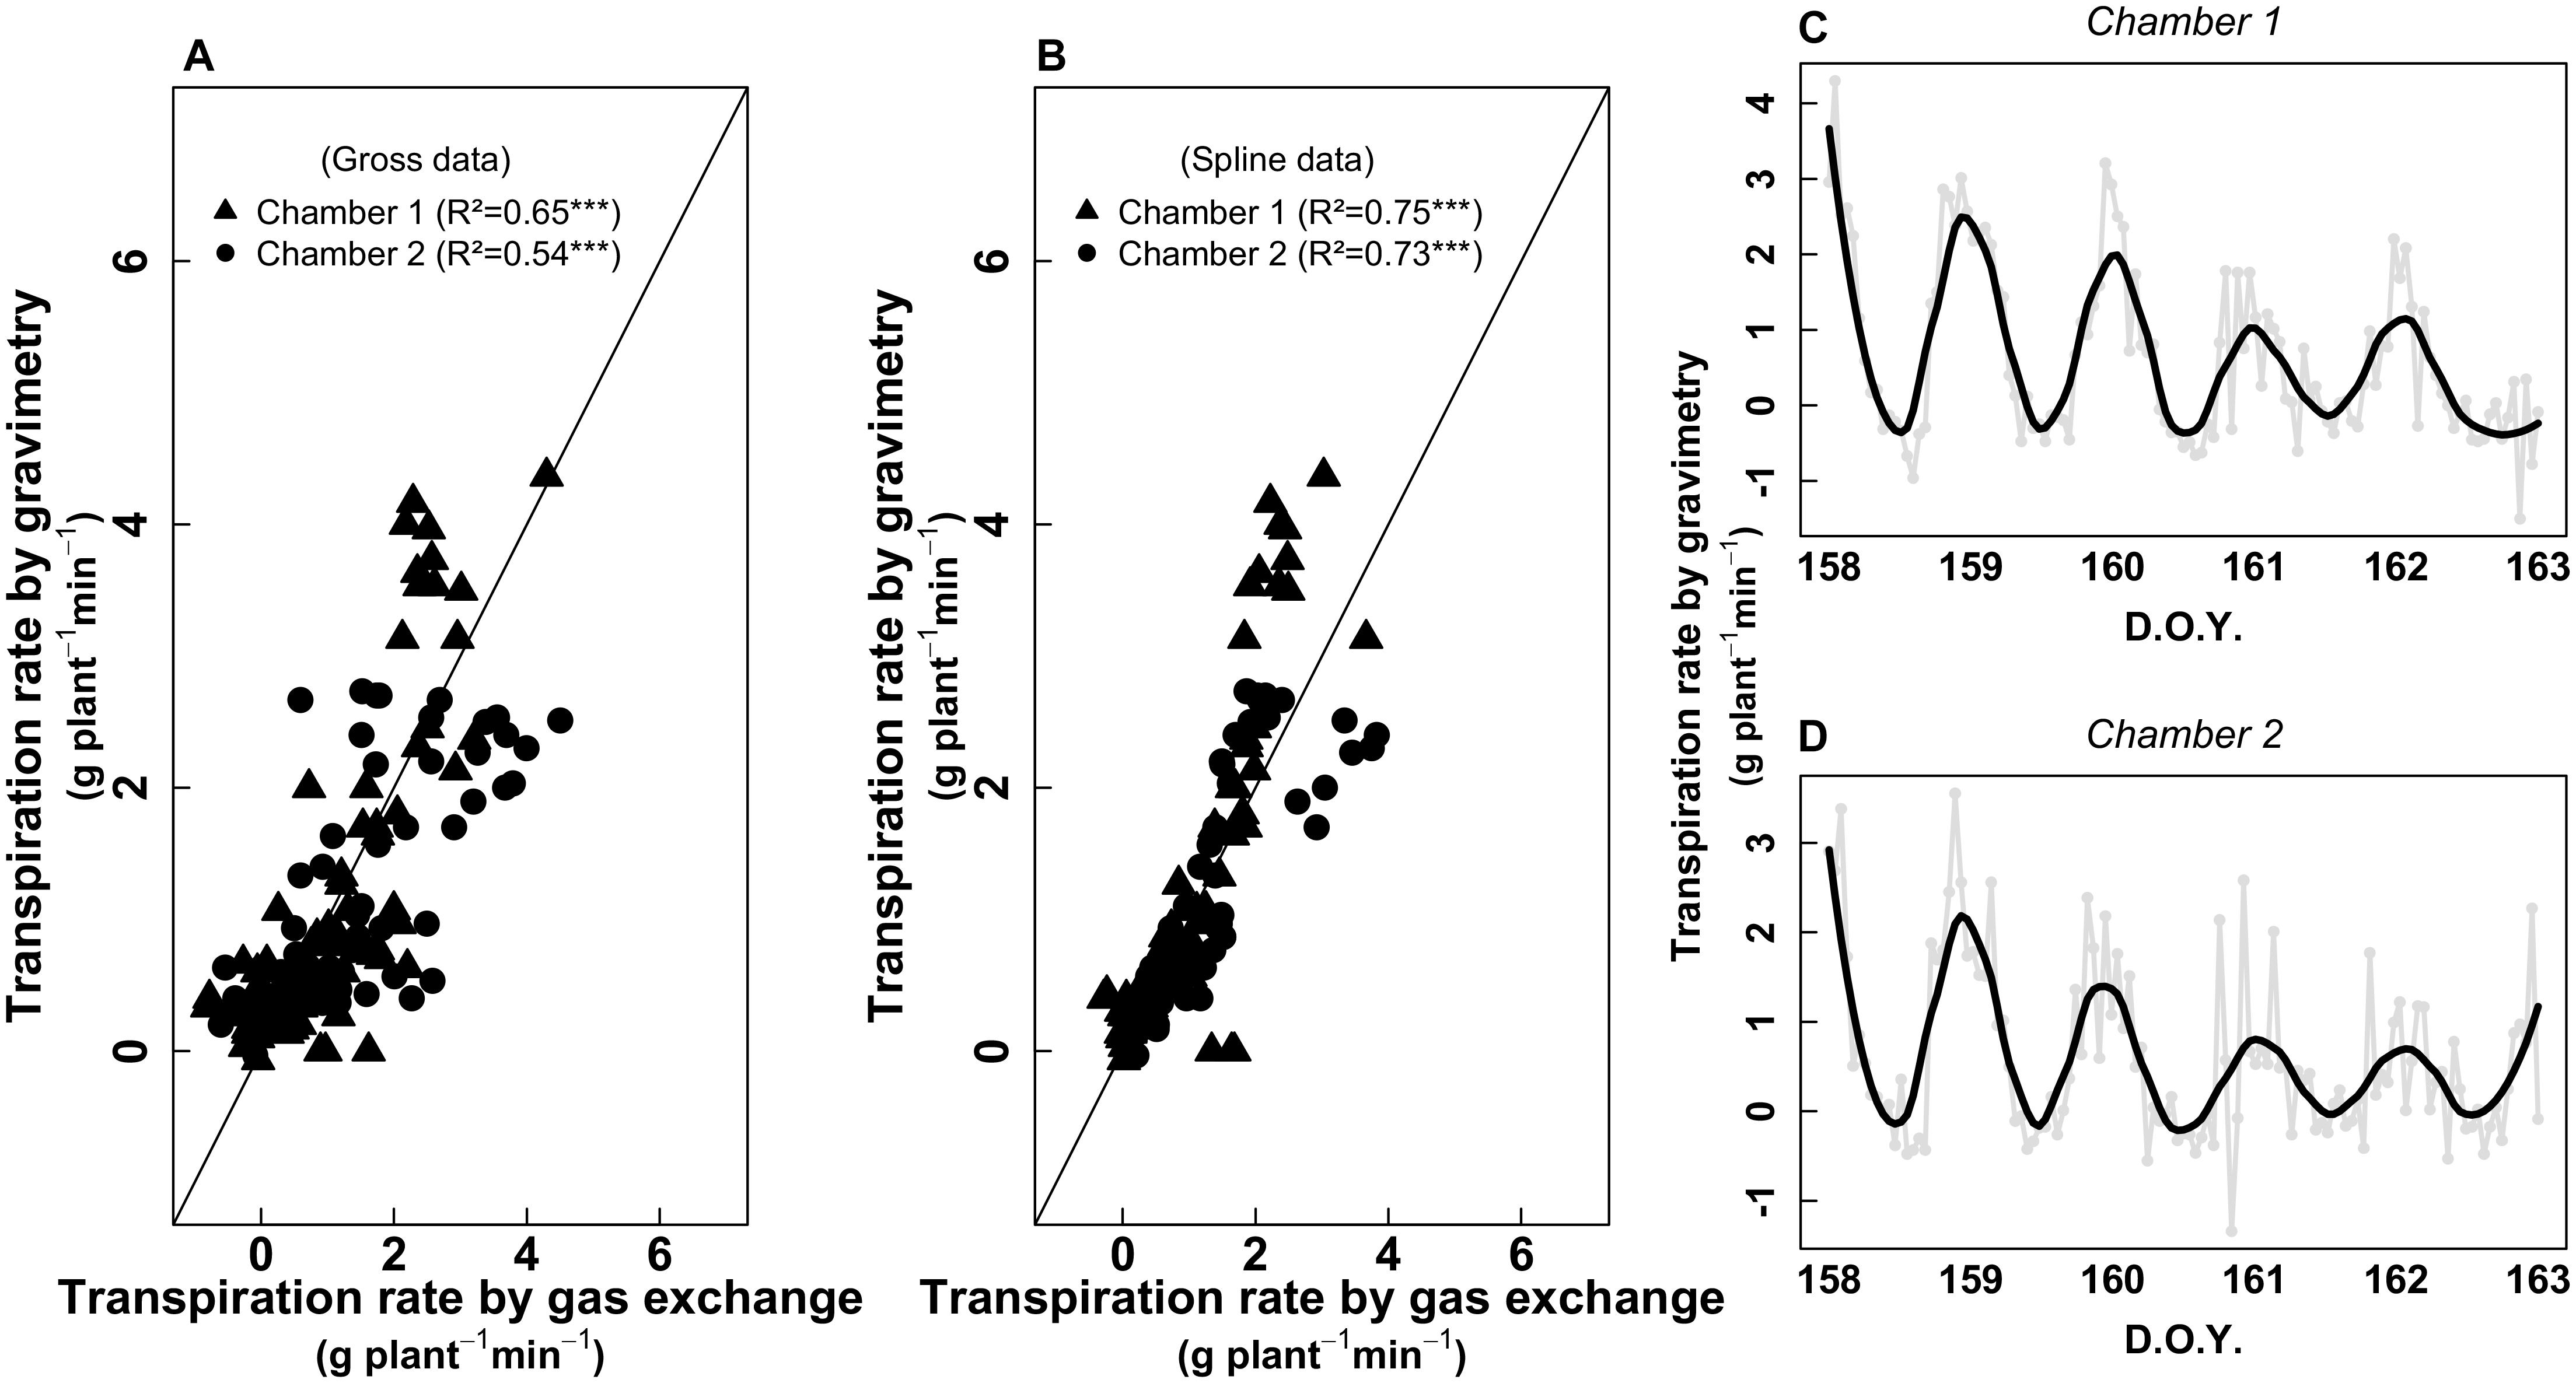
FIGURE 2. (A) Relationship between Transpiration rate (g H2O plant-1 min-1) estimated from gravimetry and gas exchange (whole-plant chamber). The continuous line represents the 1:1 relationship. (B) Same relationship but with data treated with a spline. The continuous line represents the 1:1 relationship. (C,D) gross data of gravimetry [gray circles and lines, same as presented in (A)] for chambers 1 and 2, respectively. The black lines represent the data treated with a spline in order to remove non-biological noise, as presented in (B). The data in (A,B) come from two sampling sessions (first session: from D.O.Y. 143–150; second session: from D.O.Y. 158–163; see Figure 1).
Technical Limitations for the Measurements
We identified some of the limits encountered when using whole-plant chambers. First, the atmospheric (entering air flow) [CO2] was instable during the night (Figure 3, right). While the day [CO2] was around 380 μmol mol-1 and presented very low hourly variations along the day (∼5 μmol mol-1), [CO2] used to increase up to 430 μmol mol-1 during the night, with 20–30 μmol mol-1 variation between two consecutive hours. The same variation pattern was observed for both chambers, and for each daily cycle measured during the session of September (harvest), but these variations were less pronounced than during the other two sessions. In parallel, we observed that NCE estimates during the night were very noisy; meanwhile during the day they were much more robust. We also observed that this gas-exchange system was able to pick the effect of sun-flecks on NCE. Indeed, PAR variations between 700 and 1,500 μmol photons m-2 s-1 within 30 min—1 h (punctual clouds) could induce variations of NCE between 6 and 8 μmol CO2 m-2 s-1 (Figure 3, left).
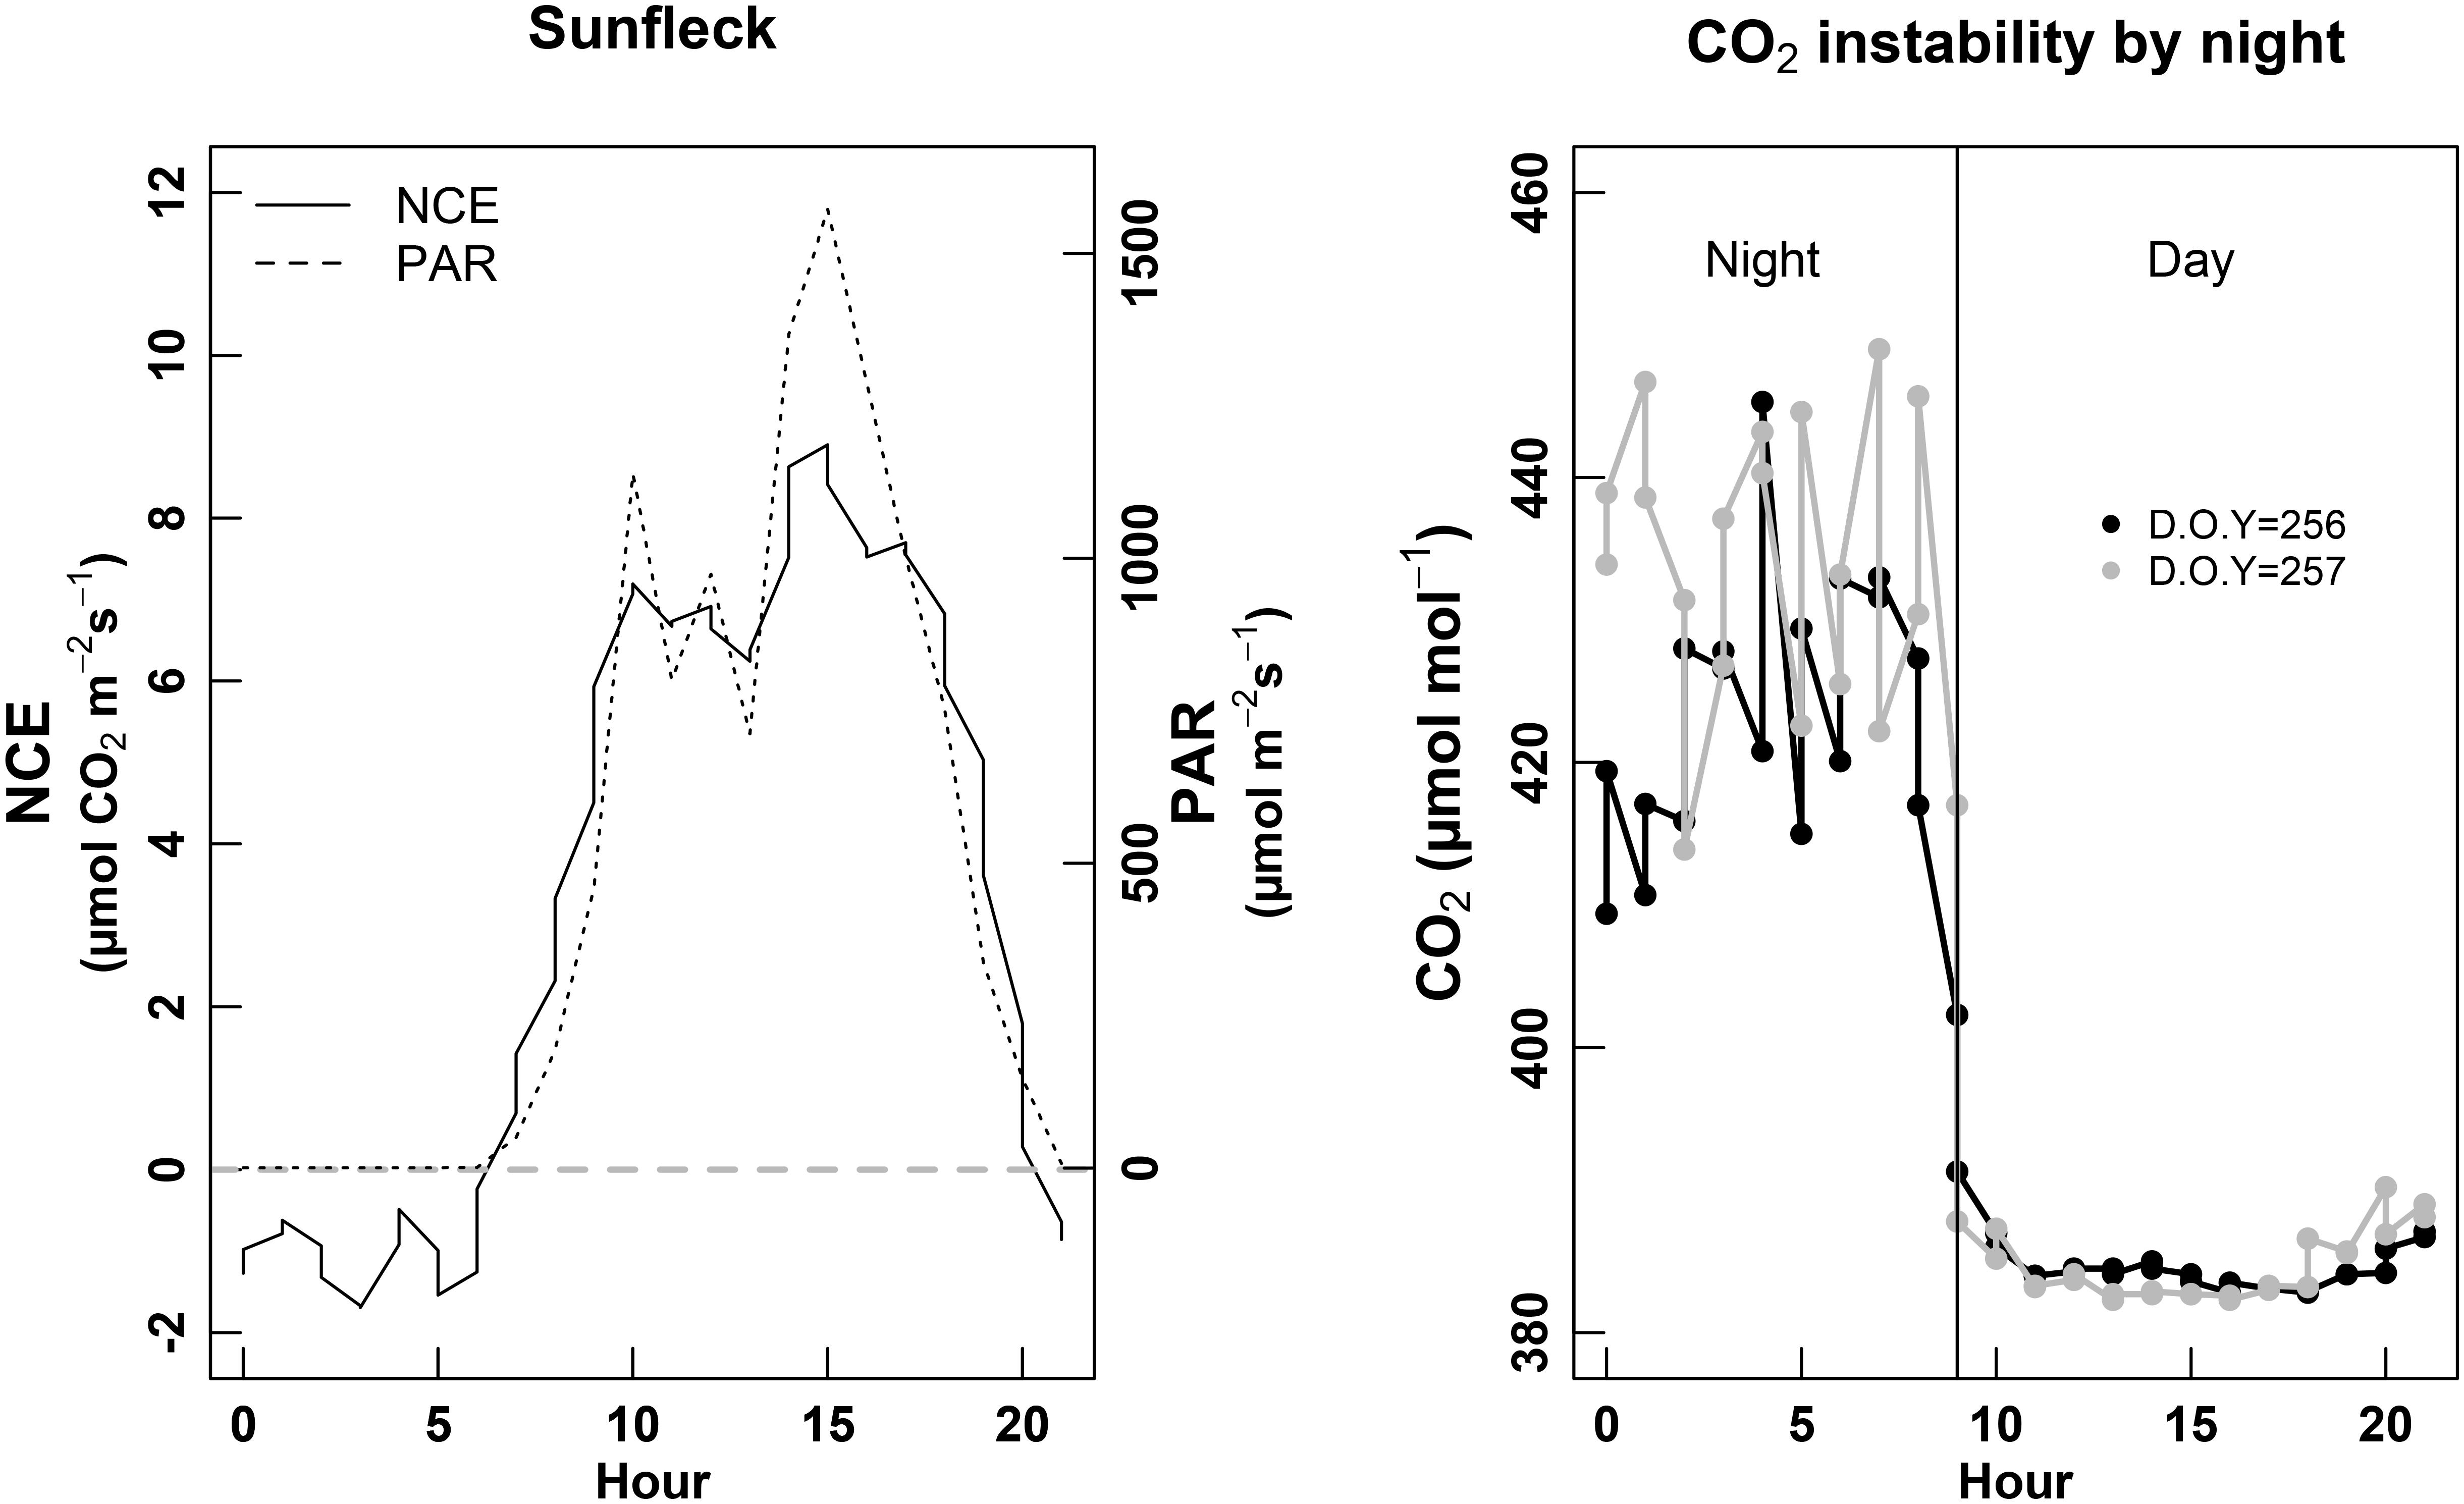
FIGURE 3. Left panel: example of sun fleck (PAR, discontinuous line) effect on the NCE (net carbon exchange of the whole-plant, continuous line). Right panel: monitoring of the [CO2] entering the chamber (atmospheric [CO2]) over a complete 24 h cycle, during two consecutive days (D.O.Y. 256 black line and D.O.Y. 257 gray line). The vertical continuous black line denotes the day/night limit.
The whole-plant gas-exchange system also allowed us to detect condensation at the sun-rise. This was demonstrated by negative transpiration, systematically occurring between 6 and 9 h in the morning. This phenomenon was observed either by gravimetry (Figure 4), and gas exchange (not shown).
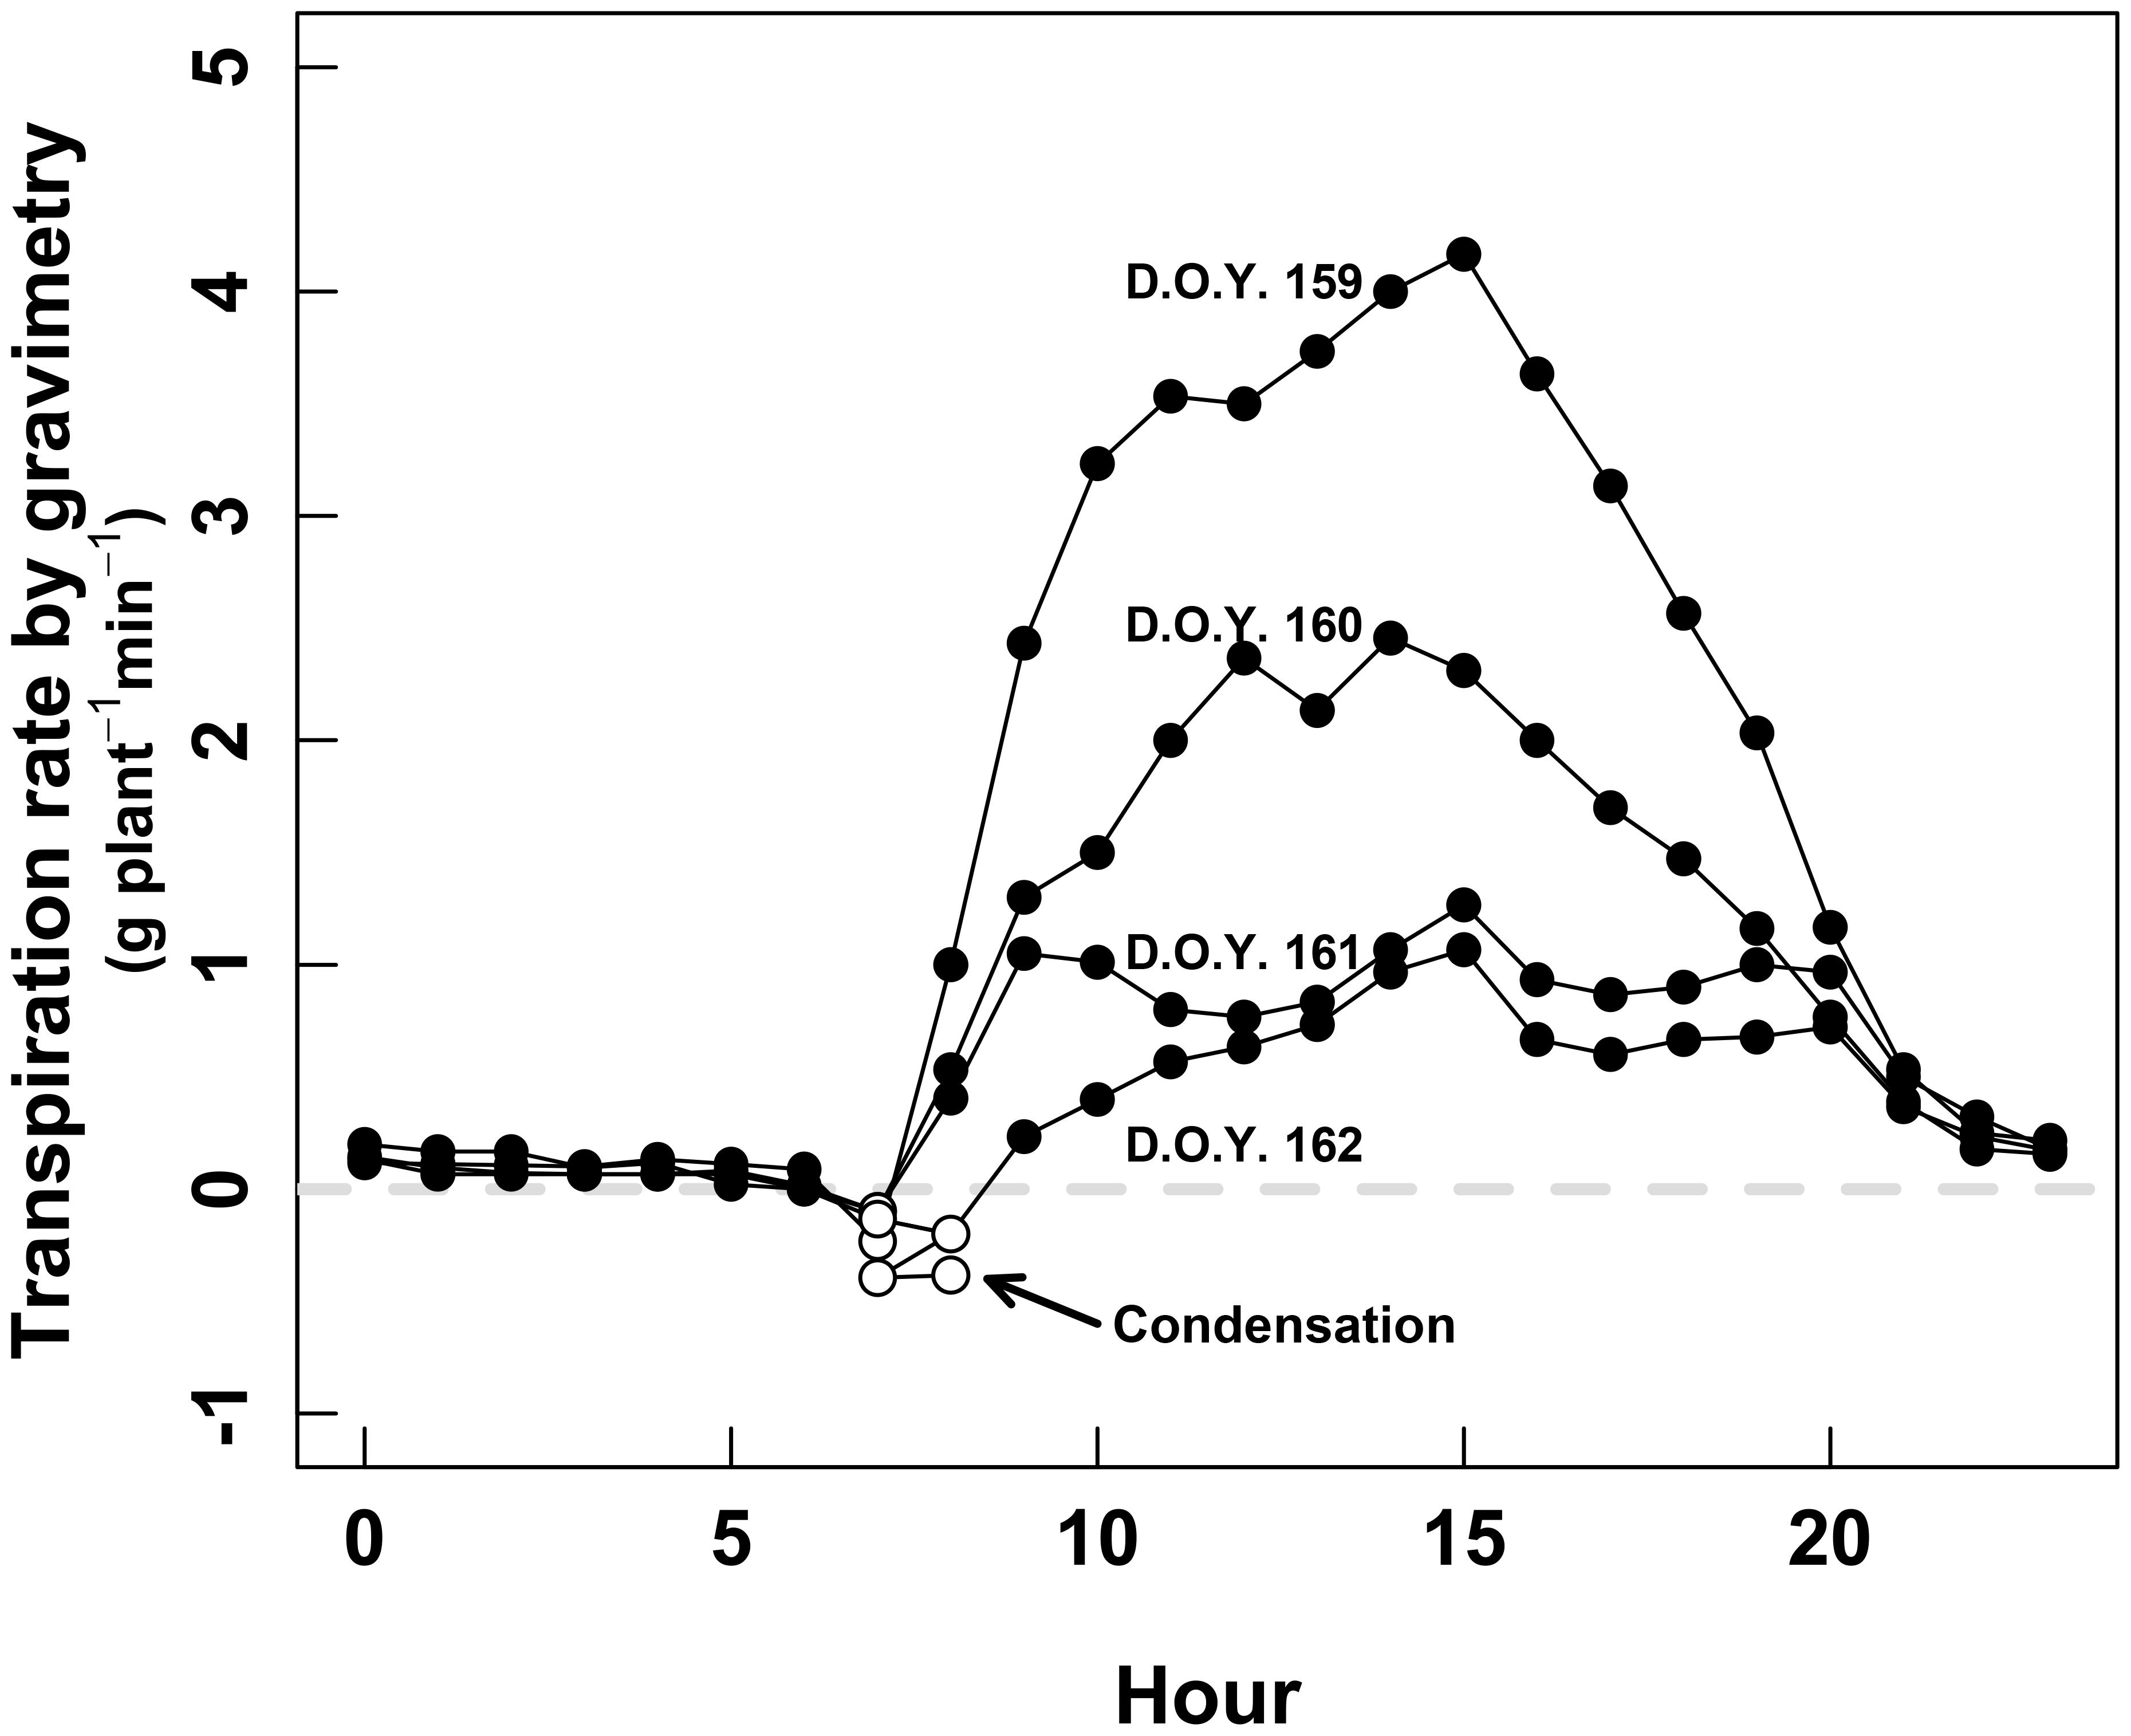
FIGURE 4. Daily course of the whole-plant transpiration measured by gravimetry during the second calibration session (D.O.Y. 158 to D.O.Y. 162). The black dots denote positive transpiration, while the white dots denote negative transpiration, interpreted as condensation during the earlier hours of the day.
Carbon and Water Balance Through Different Phenological and Environmental Conditions
Gas-exchange rate was clearly affected by phenological period of the plant, as expected. When measured in July (pea size, irrigated plants), plant NCE described a classical Gauss curve along the day (Figure 5, left), with the maximum peak reached at 12 h and NCE values of 10 μmol m-2 s-1. The whole-plant transpiration (E) described the same type of variations, with maximum values of 2.5–3 mmol H2O m-2 s-1, coordinately with the peak of NCE (Figure 5, right).
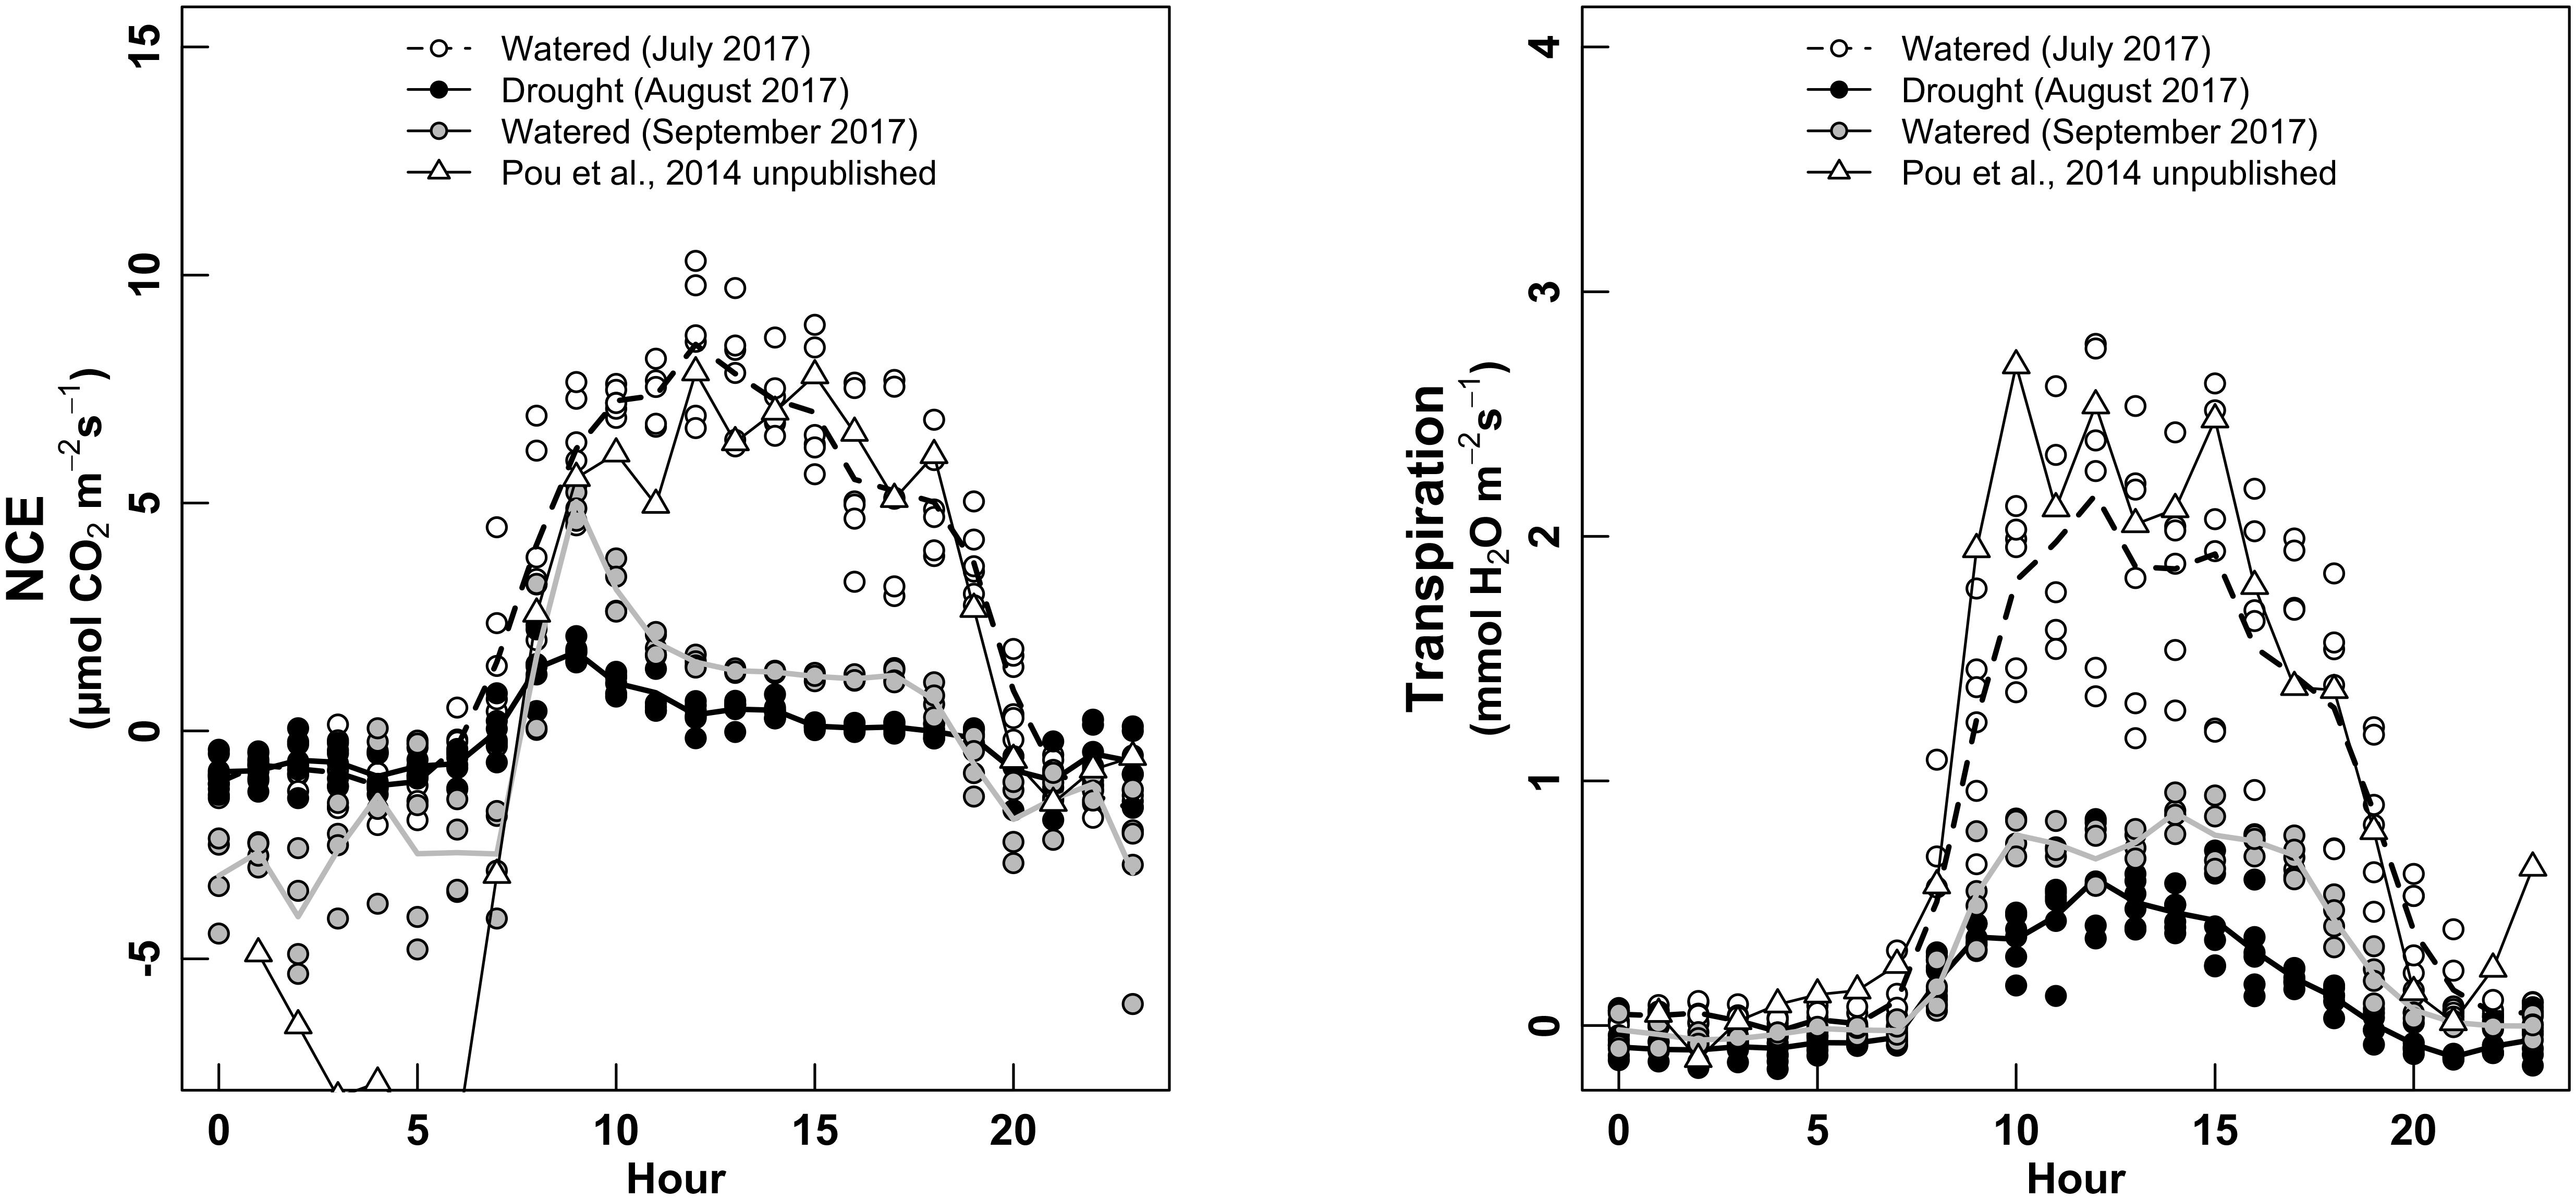
FIGURE 5. Daily cycle of NCE—whole-plant net carbon exchange (left panel, μmol m-2 s-1) and whole-plant Transpiration (right, mmol m-2 s-1), for three water treatments: white dots for “Watered” (measured in July 2017); black dots for “Drought” (measured in August 2017); gray dots for “Watered” (measured in September 2017). The white triangles are measurements performed in 2015 (Pou et al., 2014, unpublished), using the same chamber and experimental set-up in watered conditions.
When measured during the ripening (August, non-irrigated conditions), vines described a different daily cycle, with the maximum NCE of 1–2 μmol m-2 s-1 around 8–9 h in the morning, then decreasing slowly during the day (Figure 5, left). E was also strongly decreased, with maximum values of 0.5 mmol m-2 s-1 around 12–13 h (Figure 5, right). We observed that the non-irrigation conditions in August provoked a dramatic decrease in absolute values of both NCE and E, but with a strong asymmetry along the day for NCE (taking advantage of the early morning) but not for E.
During the harvest period (irrigated conditions, before harvesting the fruits), both NCE and E described the same shape of daily cycle than under non-irrigated condition (August, i.e., with an asymmetric for NCE, not for E), with clearly lower values than for the measurements during July (irrigated conditions), but higher than in August. The night respiration was much more erratic and higher (more negative values) during the harvest (September, irrigated conditions, with higher fruits load) than during previous periods. Finally, we checked whether NCE values of our study were concordant with values previously measured by Pou et al. (2014, unpublished), using the same gas-exchange system, in watered conditions and for same grape cultivar (Grenache). Absolute values and shape of both NCE and E along the day were identical with the measurements of this previous study. The only differences were shown for night respiration, higher (more negative) for Pou et al., 2014, unpublished) than this study. No relationship was found between temperature and night NCE (not shown).
Light Intensity and Carbon and Water Balance Under Different Phenological and Environmental Conditions
The measurements performed during full daily cycles, enabled to perform a comparison of photosynthesis and transpiration dependency from incoming light. This allowed to establish light response curves of NCE and E under different phenological and environmental conditions.
During the pea-size period (July, irrigated conditions), both NCE and E described a positive relationship with the increase in light through the day. NCE followed a clearly saturating shape at high light (after ∼1,000 μmol m-2 s-1), while E described a less saturated response (Figure 6, left and middle).
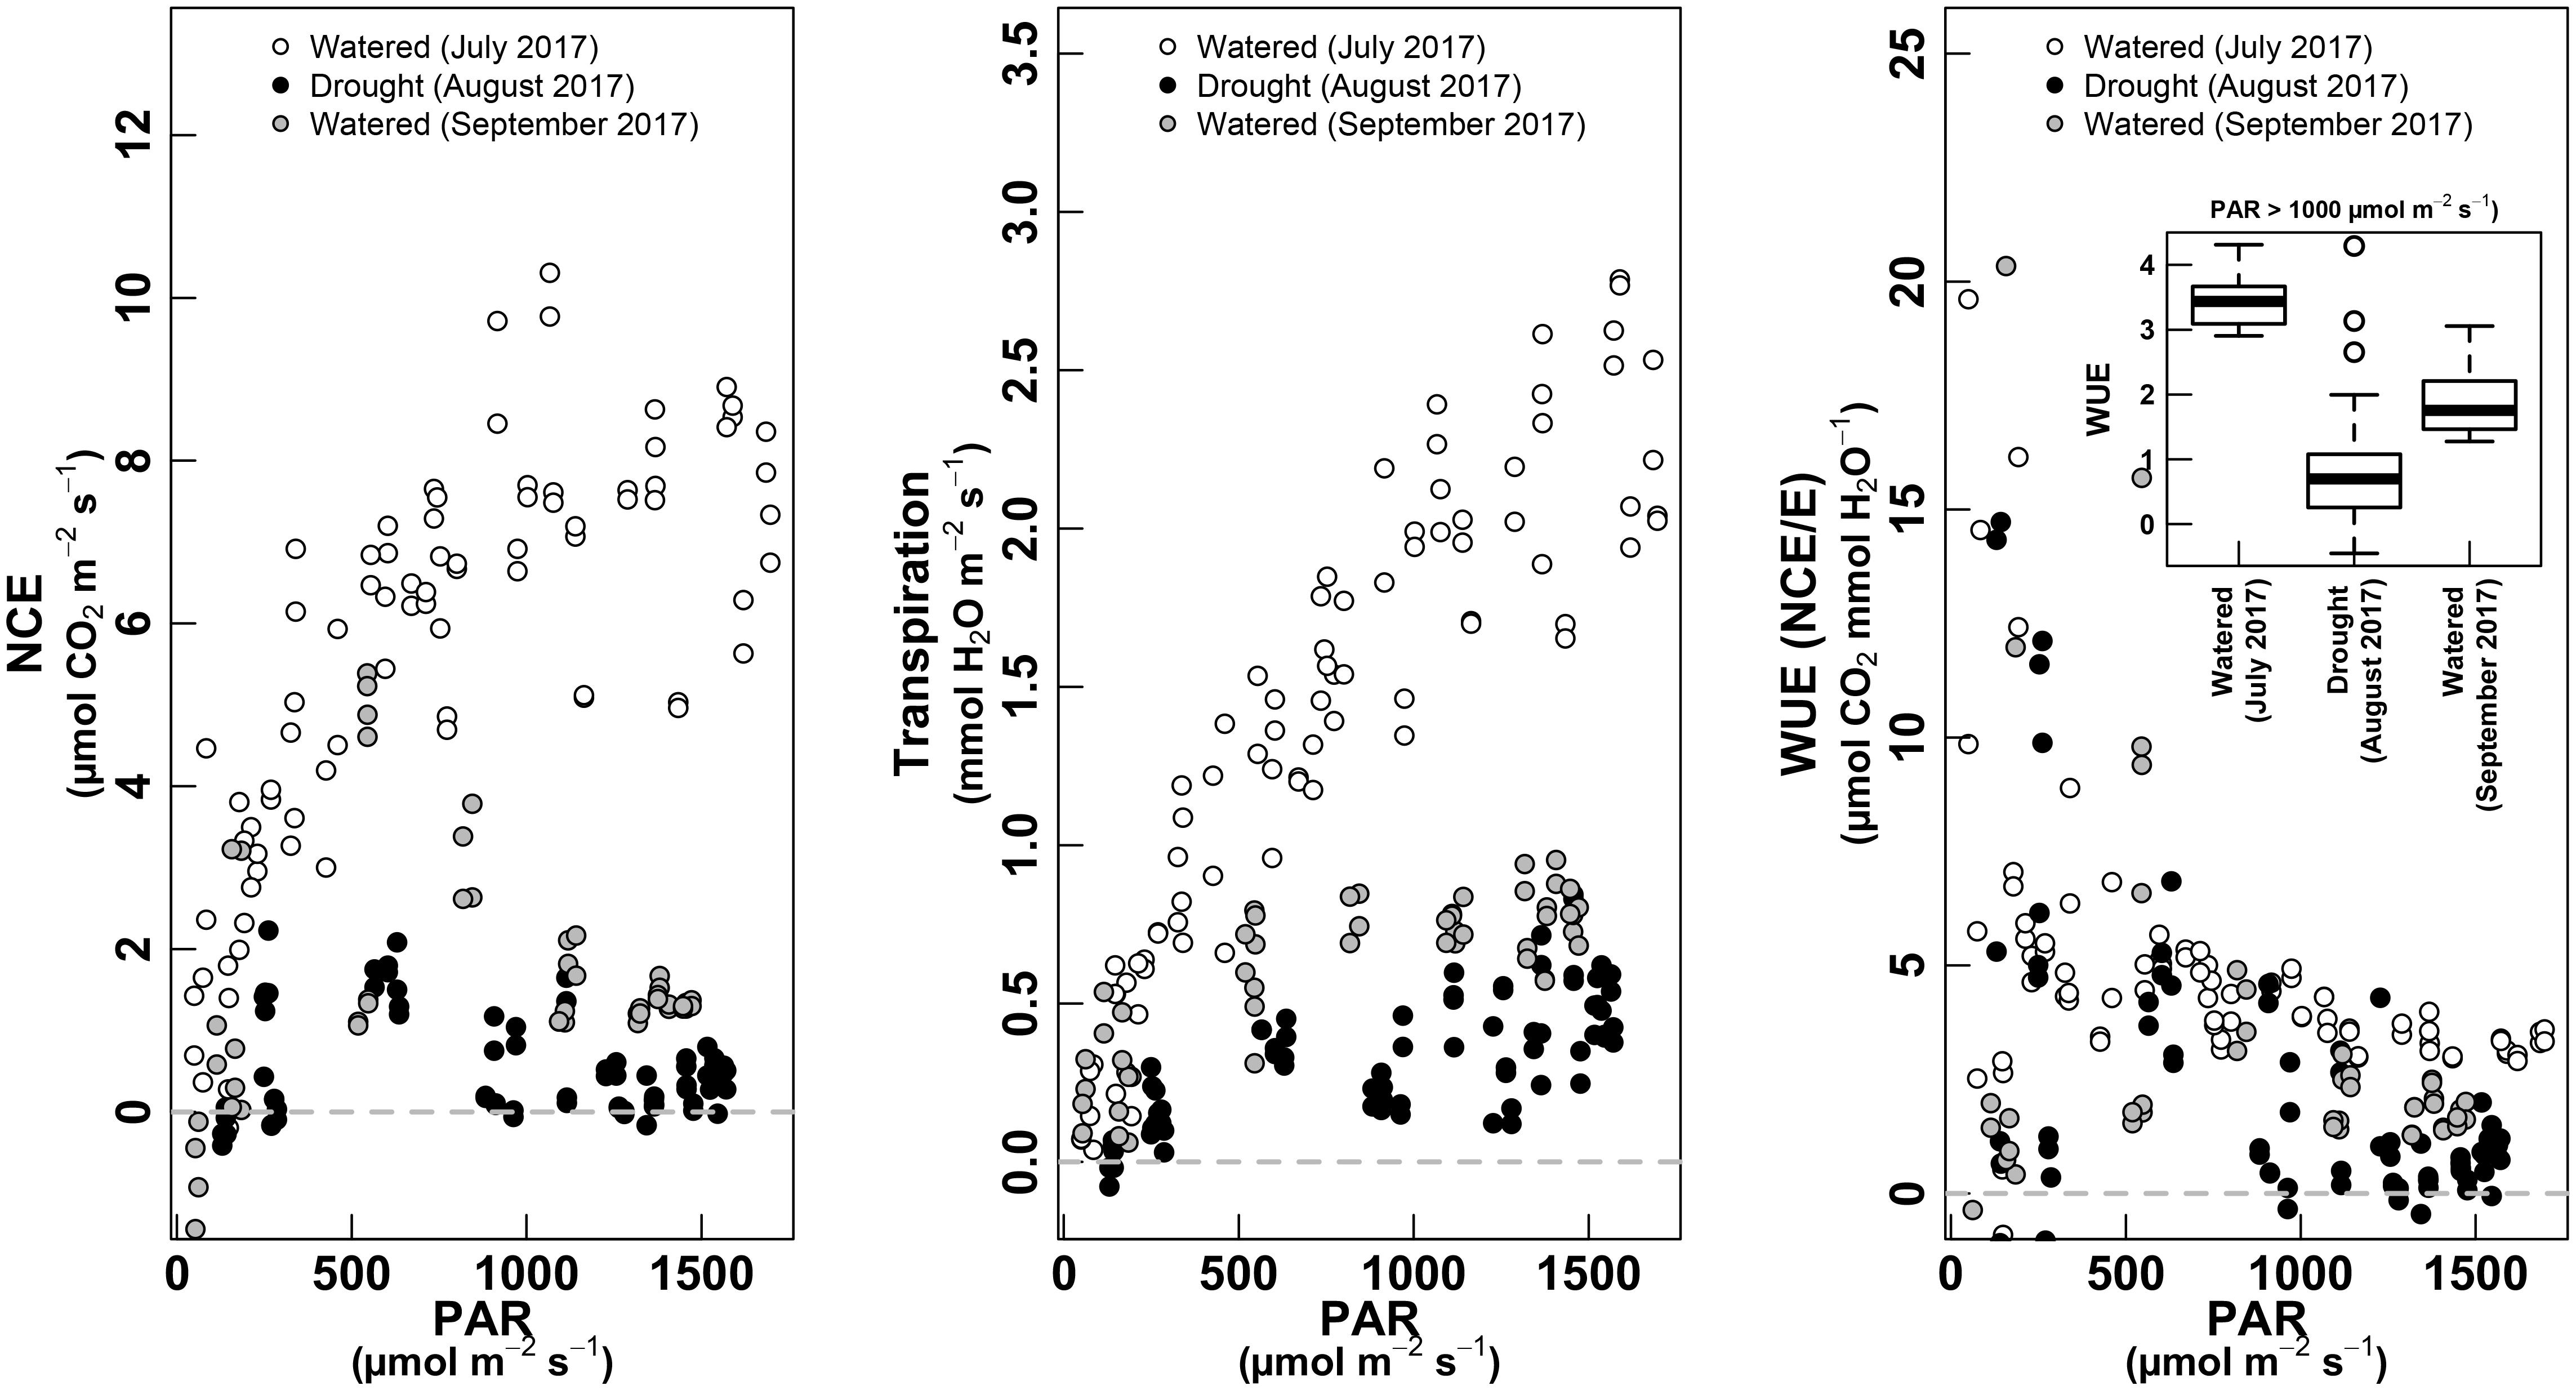
FIGURE 6. PAR response curves for NCE—whole-plant net carbon exchange (left panel, μmol m-2 s-1), whole-plant Transpiration (middle panel, mmol m-2 s-1) and WUE as NCE/E (right panel, μmol CO2 mmol-1 H2O). The relationship is shown for the three water treatments: white dots for “Watered” (measured in July 2017); black dots for “Drought” (measured in August 2017); gray dots for “Watered” (measured in September 2017). The boxplot inset in the right panel shows values of WUE for each treatment when PAR is >1,000 μmol m-2 s-1. Only data with PAR >50 μmol m-2 s-1 are shown.
The NCE and E response to light showed lower values under non-irrigated conditions (August, ripening). NCE showed an asymmetric response, with maximum values reached at ∼500 μmol m-2 s-1 and with a clear decrease at highest light intensity. The E response in August was not asymmetric, with a classical saturated response to light (Figure 6, middle). Again, we observed that during the harvest (September, irrigated conditions), NCE and E showed the same shape of daily cycle as under non-irrigated conditions (August), but with slightly higher absolute values.
The WUE described a decreasing curvilinear tendency with increasing light, with high variations at low light, corresponding to sunrise and sunset (Figure 6, right). In both irrigated conditions (especially in July, with well performing plants), the WUE was higher than under non-irrigated plants (see inset in Figure 6, right).
Response to High CO2 Conditions
At the end of the measurement session of September 2017 (in watered condition and pre-harvest period, see Figure 1), instead of removing the plants from the chambers, they were kept inside and [CO2] entering the chamber was increased until a level of 500 μmol m-2 s-1 (Figure 7, left). Plants were kept 5 days in high CO2 conditions before taking measurements. Calibration curves were also performed before analyzing the raw data (Figure 7, right). After this pretreatment, the whole-plant CO2 response was studied increasing steep by steep the CO2 concentrations inside the chamber (from 400 to 900 ppm).
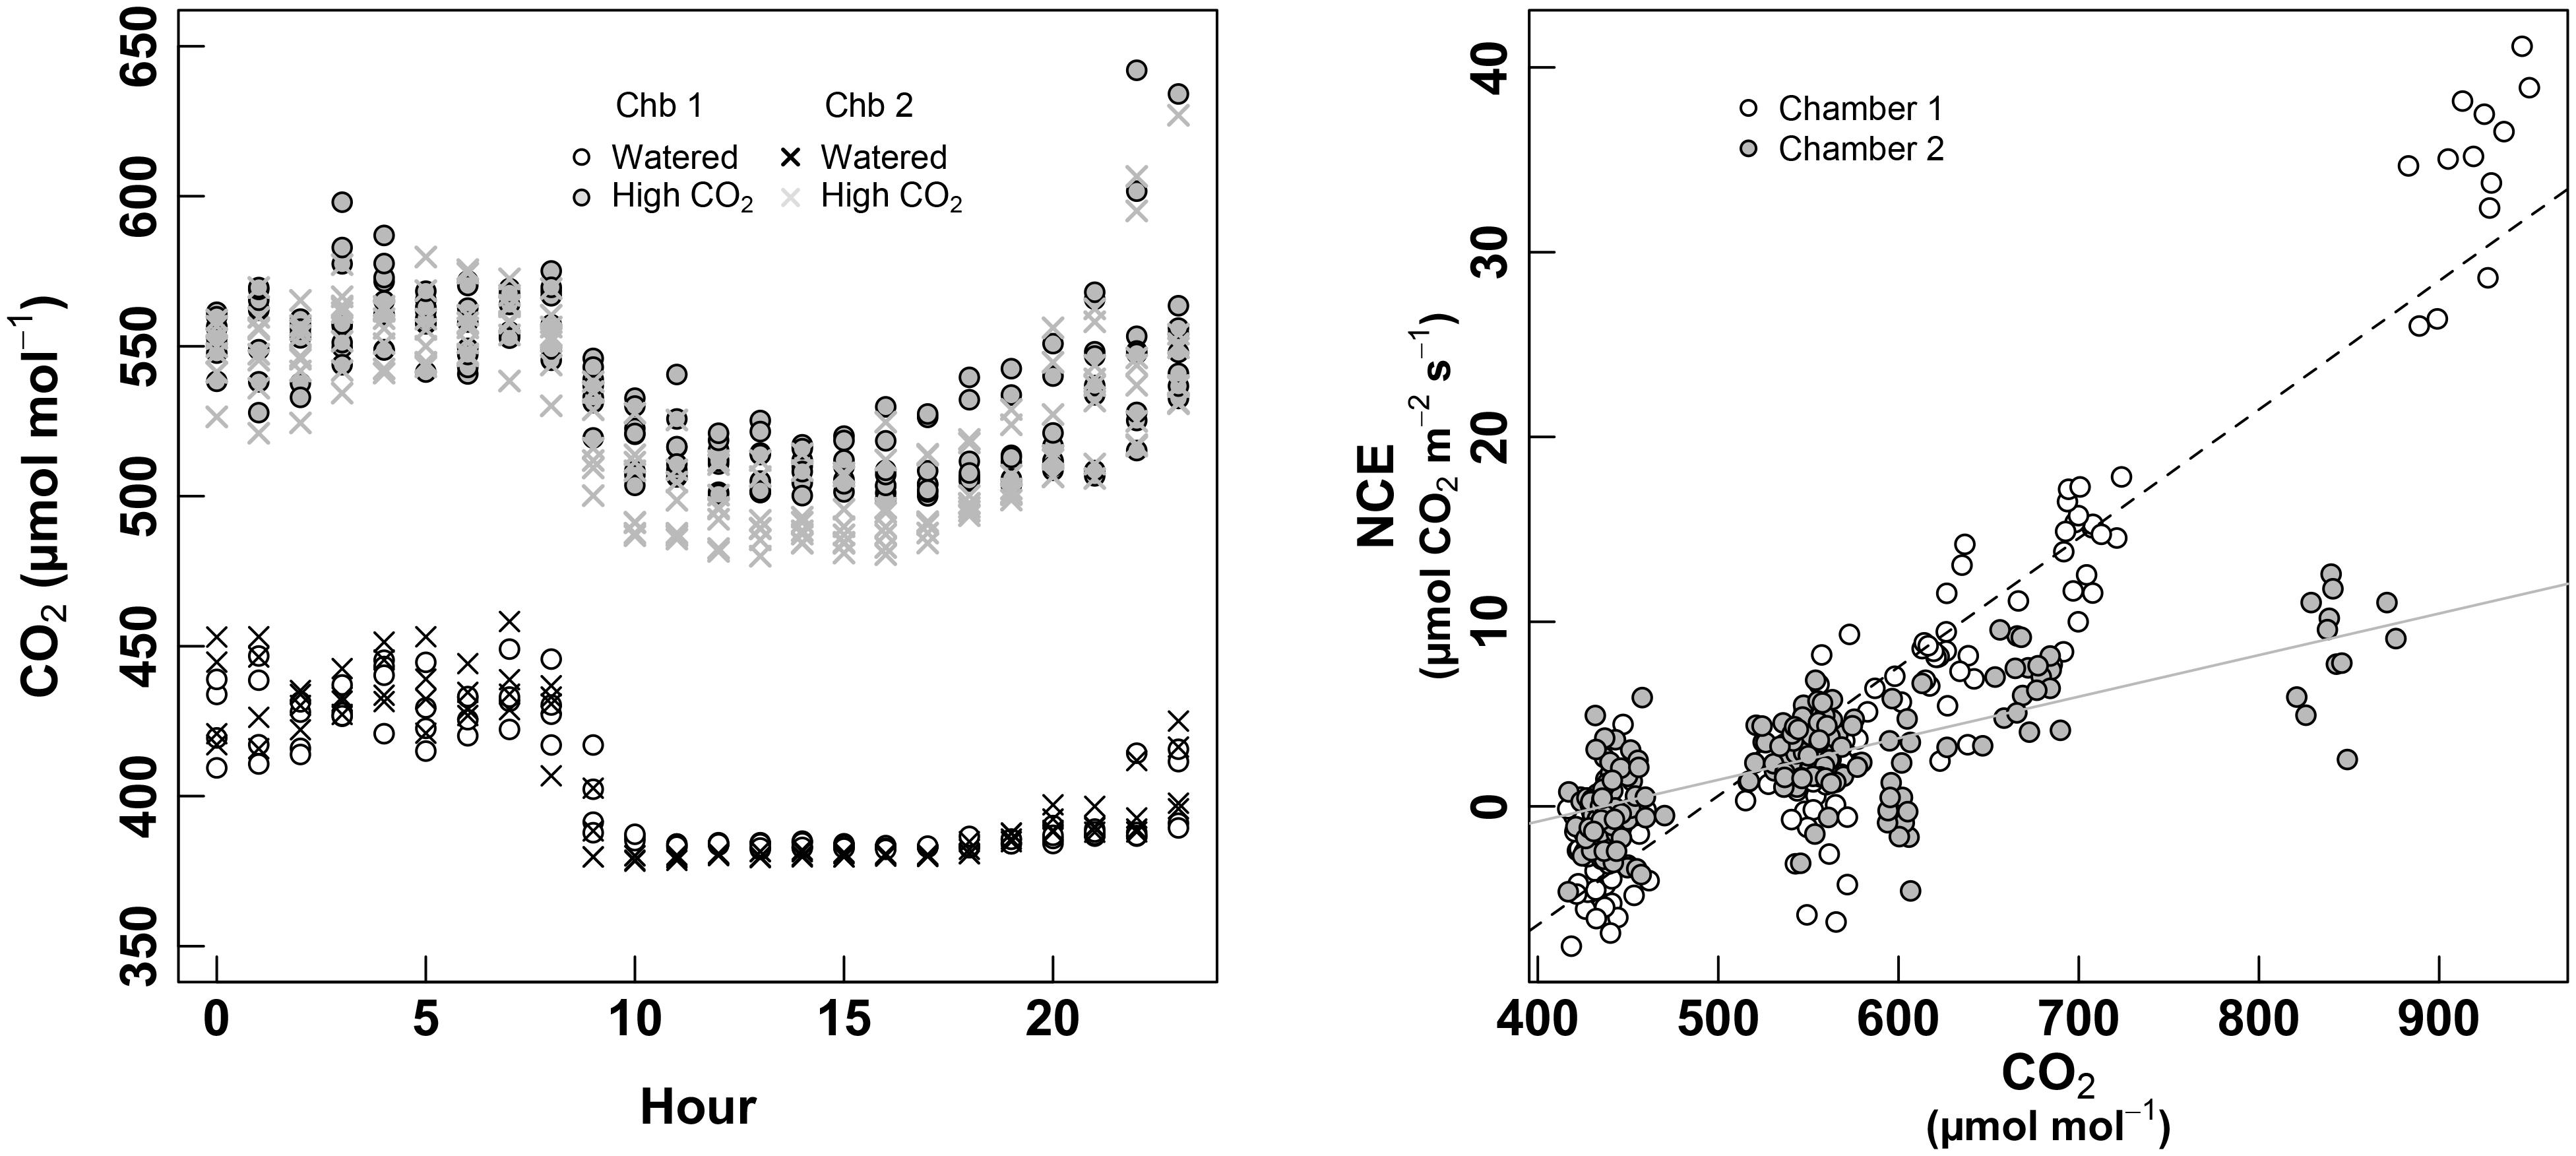
FIGURE 7. Left panel: monitoring of the [CO2] entering the chamber over cycles of 24 h. White dots denote the second “Watered” session (September 2017) for the chamber 1, and the black crosses for the chamber 2, both of them at ambient (atmospheric) CO2. Gray circles and gray crosses denote the “High CO2” treatment (September 2017) for chambers 1 and 2, respectively. Right panel: calibration curves used to correct the estimated NCE during the “High CO2” experiment. White dots are for the chamber 1, and gray dots for the chamber 2. Measurements where carried-out during the night to avoid photosynthetic processes to influence the measurements (and considering the night-respiration as negligible), then [CO2] was increased by steps from 400 μmol mol-1 to approximately 900 μmol mol-1 in order to obtain a calibration curve. This curve was then subtracted to the row-data obtained under high CO2 conditions.
Each chamber showed a different response of apparent NCE to [CO2], likely due to different intensity of leaks (see Figure 7, right). Nevertheless, the total pool of NCE data showed a continuous relationship to [CO2] when plotted against corrected-NCE (Figure 8, left).
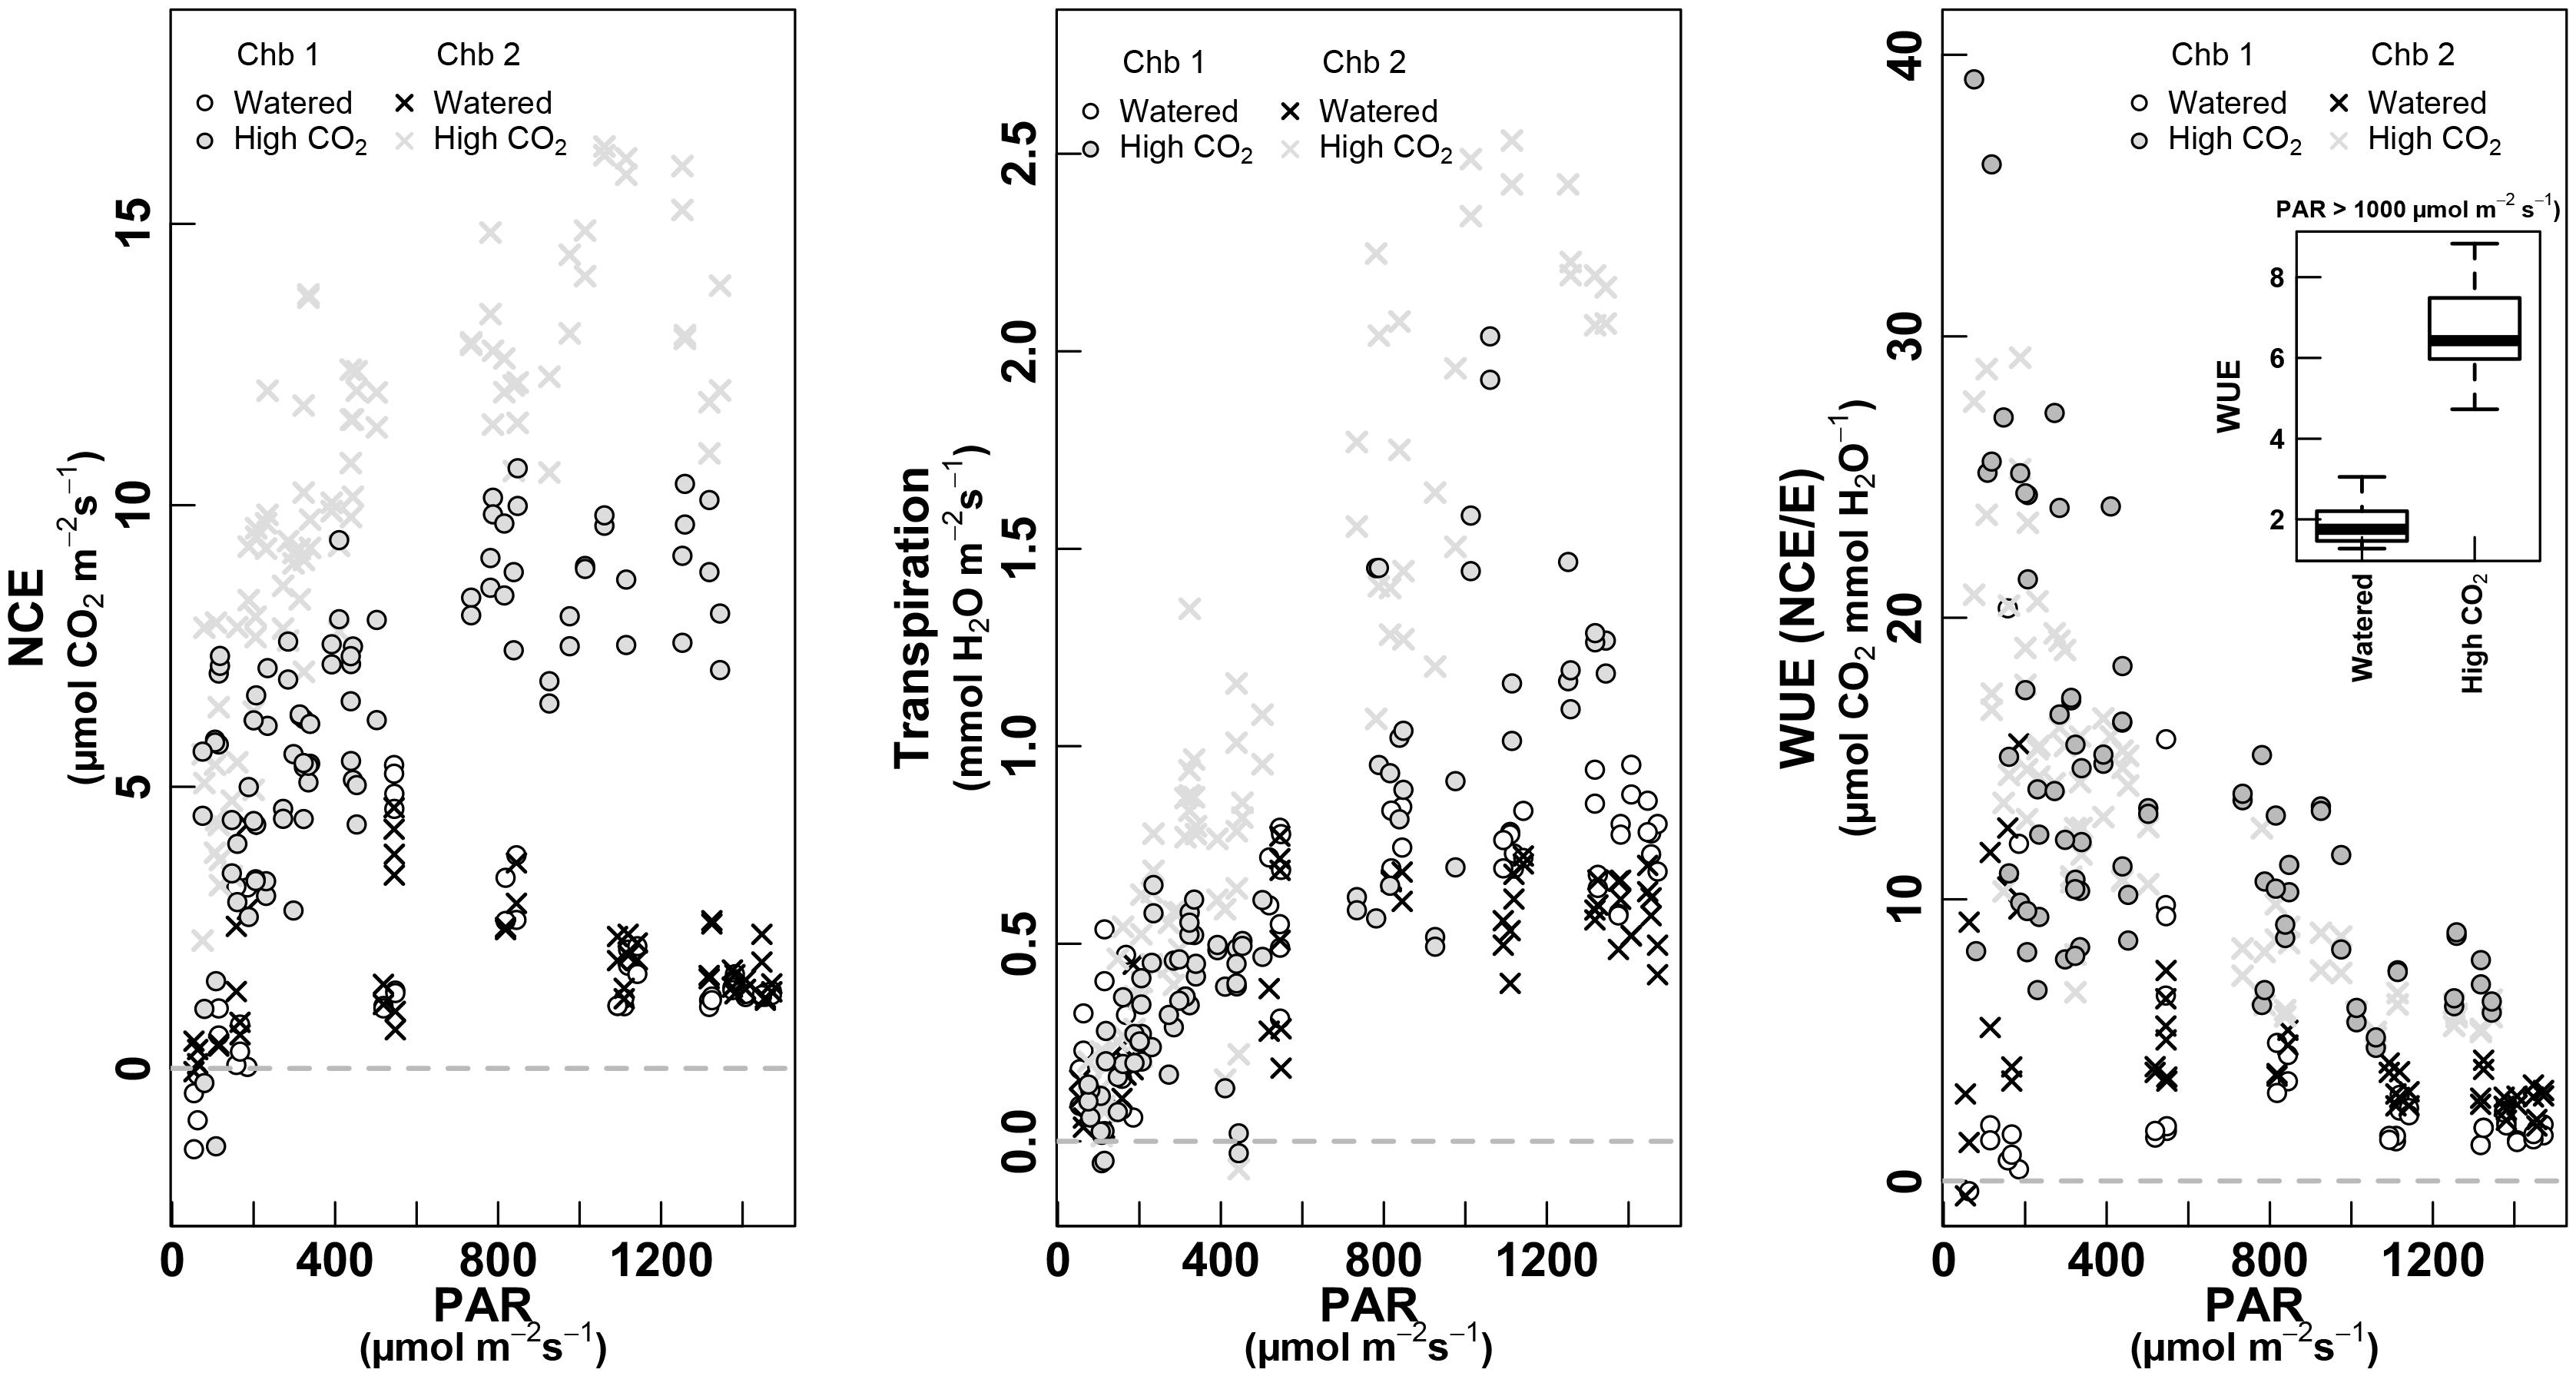
FIGURE 8. PAR response curves for NCE—whole-plant net carbon exchange (left, μmol m-2 s-1), whole-plant Transpiration (mmol m-2 s-1, middle) and WUE as NCE/E (μmol CO2 mmol-1 H2O, right). The relationship is shown for the two treatments: white dots for “Watered” of chamber 1 and crosses for chamber 2; gray dots for “High CO2” for chamber 1 and gray crosses for the chamber 2 (both treatments were measured in September 2017, on the same plant). The boxplot inset in the right panel shows values of WUE for each treatment when PAR is >1,000 μmol m-2 s-1. Only data with PAR >50 μmol m-2 s-1 are shown.
Under high CO2, the NCE along the day was clearly higher than under ambient [CO2], measured 5–6 days before (Figure 8, left). While plants in ambient [CO2] showed a strong decrease at highest PAR intensities, under high [CO2] they maintained a high NCE (∼10 μmol m-2 s-1) along the whole day. The chamber 2 showed slightly higher values than chamber 1, but keeping in the same range, and recovering both the values of watered condition in July. Surprisingly, the values of transpiration increased under high CO2 when compared to previous values of watered conditions in September, but fitted very well with E-values of July, in watered conditions (Figure 6, middle). The WUE was clearly increased under high CO2 (Figure 6, middle), four by eightfold when compared to September in watered conditions, and by twofold when compared to July, watered conditions (see inset Figure 8, right).
Discussion
A better understanding of Carbon and water fluxes at the whole-plant scale is needed to improve the natural ecosystems and crops water management. But this must be done firstly by improving the knowledge of the relationship between whole-plant and single-leaf gas exchange, and their occasional discrepancy when they are directly compared (Medrano et al., 2012; Tomàs et al., 2012). In particular, when talking about WUE, the variability of leaf to leaf environmental conditions and plant gas-exchange regulation could lead to some contradictory results (Poni et al., 2009; Tarara et al., 2011; Escalona et al., 2016). To understand why intensive leaf-level measurements do not always completely reflect the whole-plant physiology, an exhaustive array of data was gathered using entire enclosed plants. To ensure reliability of the data from the whole-plant gas-exchange system, a preliminary calibration was set in order to calibrate chamber-derived transpiration rates by comparing gas exchange versus gravimetric vine water loss. The resulted correlations between both estimations of the plant transpiration were sometimes noisy and apparently not related to plant transpiration dynamics. Thus, diurnal cycles were treated with a spline to eliminate such non-biological noise leading to close linear relationships (R2 = 0.75 and 0.73; both p < 0.001 in chamber 1 and 2, respectively). This resulted in a successful validation of the chamber-derived vine transpiration, in agreement with findings previously reported by Poni et al. (1999, 2014). These noisy measurements faced two large problems. The first one was probably due to the absence of the 3.5 m metal pipe during the calibration process, usually added to minimize fluctuations in ambient CO2 (Perez Peña and Tarara, 2004), emphasizing the importance of having a proper buffer volume during measurements. The second was likely derived from a detected condensation, both by gravimetry and by gas exchange, which systematically occurred between 6 and 9 h a.m., when the temperature of the inner surface of the chamber was surely below the dew point. Maintaining a minimum temperature increase in the chamber and improving air circulation inside whole-plant chambers is therefore necessary to avoid condensation when calculating daily transpiration rates.
Moreover, tracking the whole-plant carbon balance during the vine growing cycle was attempted to be verified by firstly checking the flux of [CO2] during night periods (i.e., nocturnal NCE or night respiration, Rd). Surprisingly, [CO2] measurements at night stand out for their instability, which were especially high during harvest period and not dependent of wind speed or other environmental factors. Such [CO2] instability has been previously described by Patil et al. (2014), who attributed the pronounced CO2 peaks to the absence of solar radiation and accumulation of CO2 in unstable boundary layer. Thus, these noisy measurements may lead to unreliable night respiration estimations, again reinforcing the idea that proper buffer volumes are necessary when large plant chambers are used.
Carbon and Water Balance Through Different Phenology and Environmental Conditions
Instantaneous rates of NCE showed reliable and stable values, and varied with irradiance, temperature and elapsed time, as expected. Over the course of the day, NCE highly correlates with canopy light interception, as also have been reported by Petrie et al. (2009) and Poni et al. (1997). Daily cycles of NCE were very similar for the two water regimes and the two different phenology stages in early morning and late afternoon when sunlight was largely diffuse. Conversely, canopy NCE trends started to differentiate and showed maximum difference from about 9 till 16 h when canopies were subjected to a higher proportion of direct light. Thus, we stressed that the daily NCE measurements were affected by the applied water regime, both pre- and post-véraison, obtaining different shapes when comparing between irrigation treatments (July vs. August) and between different phenological times (different aging) (July vs. September), even being under the same water regime. NCE for watered plants (in July) followed the sinusoidal pattern of irradiance. By contrast, in August (for stressed plants) and September (for watered plants), instantaneous NCE reflected a morning maximum (8 h) peak of about 5 and 2 μmol m-2 s-1, respectively, and then declined steadily after 12 h. Most of the higher CO2 fixation rates during the entire day in watered plants in July could be due to the faster canopy development (high proportion of fully expanded leaves) rather than a higher average photosynthetic rate per leaf, as it has been previously described by Poni et al. (2000). On the other hand, instantaneous rates of NCE in August reflected a combined effect of water stress (no irrigation delivery), similarly of what has been previously observed in Tarara et al. (2011). However, a different trend was observed by Pagay (2016), who did not show differences in diurnal NCE patterns pre-veraison under different water regimes. This was likely because vines did not have a sufficiently long period without irrigation to experience water deficit.
Interestingly, Rd-values in the present study showed slight decreases between pea size (in July) vs. pre-harvest (in September), within the same irrigation level. The dearth of information on Rd as affected by water stress and leaf aging makes comparisons with the present study difficult. On one side, Pagay (2016) described higher Rd-values for deficit-irrigated vines, however, in our experiment, the system sensitivity might not be sufficient to highlight early-season differences in respiration with respect to different irrigation regime mainly due to the obtained high nocturnal CO2 fluctuations and the impossibility of adjusting flow rates at night. On the other side, Zufferey (2016) and Hernández-Montes et al. (2018) showed that during the rapid plant growth phase, young leaves presented the highest Rd rates compared to the mature ones. However, once the vegetative growth had stopped, the effect of the leaf age on Rd was less noticeable. At this stage (i.e., when the vegetative growing phase stops), we can hypothesized that the contribution of grapevine clusters to the total carbon balance by the whole berry respiration, might be highly enough to greatly reduce the daily NCE. Accordingly, Miller et al. (1997) stated a rapid decrease of the NCE rate from veraison through harvest.
Moreover, recent results showed that bunches respiration at veraison and ripening are the main component of plant respiration (Hernández-Montes, 2017), so that this component can be an important part of the NCE rates of the whole canopy during those months reducing significantly the net carbon uptake. On the basis of this important CO2 flux, a more detailed study of the influence of the grapevine clusters to the total NCE is necessary to better understand the whole-plant carbon fluxes.
Patterns of canopy transpiration (E) followed a similar outline than VPD and PAR (data not shown). In accordance to Tarara and Pena (2015), similar patterns of E were obtained between irrigation regimes, and between time points. However, it is noticeable here, that all along the entire experiment, different absolute values of E and Enight (nocturnal water loss) varied following both, different water regimes and the leaf aging of the plant. On the one hand, either at leaf and whole-canopy level, it is well documented that the most important environmental factors affecting transpiration are humidity, temperature, light intensity, wind, and the soil water content (Escalona et al., 2003; Medrano et al., 2003; Merli et al., 2015; Pagay et al., 2016). However, on the other hand, less attention has been given to the evolution of whole-plant transpiration throughout the vine vegetative cycle. Boyer et al. (1997) described the importance of leaf aging in the E levels, mainly because of a great reduction of the cuticular transpiration. So, at the whole-plant level and during the harvest stage, it was expected to have decreased E-values, as it happens here (Figure 5B). It can be also hypothesized that the decrease of photosynthetic capacity due to leaf ontology through the season goes along a decrease in E.
Responses to Light
Over the course of the day, studies have found that patterns of NCE correlates highly with canopy light interception (Poni et al., 1997; Petrie et al., 2009). Pooling data gathered throughout the different treatments permitted to obtain different light response curves for NCE and E. The obtained curves were similar to that known for the light dependence of CO2 assimilation (Harbinson and Foyer, 1991). However, compared with single-leaf light response curves, whole-canopy photosynthesis in well-watered plants showed a much more gradual gain in NCE with increasing PAR and lack of a clear saturation plateau (Corelli-Grappadelli and Magnanini, 1997; Intrieri et al., 1997; Poni et al., 2003).
At low light intensities, below 500 μmol photons m-2 s-1, similar values of NCE and E were observed for the two watered treatments (July and September data) but at high light intensities the maximum values decreased with leaf aging. Indeed, since light intensity is coupled to the energy balance of leaves, the light response curves of photosynthesis are modulated by leaf age through differences in the stomatal sensitivity, and also boundary layer conditions (Field and Mooney, 1983; Zufferey et al., 2000; Poni et al., 2003), likely leading to obtain such differences on a seasonal basis. Additionally, because high light intensity hours are in coincidence with high temperatures, their effect on whole-plant respiration and mainly clusters respiration surely influence the observed light curve shape.
The light response curves of photosynthesis became distinctly flatter with increasing water scarcity. In this case, there was a significant treatment effect starting at low irradiance. Moreover there was a lack of a sharp saturation threshold in the trends of E, which continued to increase even after NCE had started to decrease.
Regardless of the amount of the water supplied and the leaf aging effect, canopy WUE exhibited decreasing trends and flattened out from approximately 500 μmol photons m-2 s-1. Contrarily to the expected, canopy WUE was distinctly higher in the well-watered treatment than under water stress. This scenario differed from that which might derive from traditional single-leaf assessment and some other estimates on the basis of single-leaf measurements made in the entire canopy (Escalona et al., 2003; Medrano et al., 2012). However, these results are in line with most of studies which have tackled the combination of both, leaf and whole-canopy gas exchange (Poni et al., 2009, 2014; Tarara et al., 2011; Merli et al., 2015). Only Palliotti et al. (2014) reported that drought vines exhibited increased WUE at both the single-leaf and whole-canopy levels on Vitis vinifera cv. Sangiovese. Supporting our results, Intrieri et al. (1998) has shown that shaded or partially shaded leaves usually show lower WUE than well-exposed ones since low light limits photosynthesis more than water loss. So, in this case, scaling up WUE readings from leaves to whole-plant, lead to a disappointingly low correlation, mainly because of the obvious differences that a whole canopy may present in terms of leaf exposure and the dynamics of light interception during the day. Moreover, the recent results on the respiration rate of bunches throughout this period (véraison-ripening), could contribute to better understand the discrepancy among single-leaf and whole-canopy results. So, the overall carbon gain is ultimately regulating total plant growth and thus, the study of respiration and photosynthesis of intact whole clusters under field conditions can led us to gain important new knowledge about the real contribution of fruit to the total vine carbon balance.
Responses to High CO2
Increases of atmospheric CO2 concentrations are rising year by year at a rate that has been shown to affect photosynthetic rates in C3 plants (Gerhart and Ward, 2010). There is no doubt that growth at elevated [CO2] stimulates NCE in C3 plants (Drake et al., 1997; Norby et al., 1999; Nowak et al., 2004; Ainsworth and Long, 2005; Ainsworth and Rogers, 2007). We conducted different response curves of NCE to increasing [CO2], and as predicted, there were significant and marked increases in NCE with increasing [CO2]. However, the relative rises in NCE were steeper at low irradiance probably because ATP concentration responds more steeply to increasing CO2 supply when photosynthesis is limited by RuBP regeneration (Buckley et al., 2003).
When comparing between the two analyzed plants for the same treatment, we have obtained similar shapes of NCE to the increasing [CO2] values, however, at high CO2, curves were shifted to higher NCE values for chamber 2. This difference would not be explained by the “chamber effect,” as similar [CO2] was entering in both chambers (Figure 7), so, a much further effect to high CO2 may be suggested in this case for the enclosed plant 2.
Concerning the PAR response curves for transpiration to rises in [CO2], and contrary of what was expected (Long et al., 2004) increasing transpiration values in response to increasing [CO2] have been obtained for the two enclosed plants. We may argue that other direct effects on water loss by transpiration such as ambient temperature, VPD or other driving forces for exchange of the water vapor from the leaf surface to the surrounding atmosphere may even dominate over the stomatal conductance, but also a differential CO2 effect on gs for the shaded canopy leaves. Also, plants were subjected to high [CO2] during 3–4 days before taking the measurements, while the single-leaf CO2 response are always performed at the minute scale. A medium-term stomatal adjustment could also explain this higher E under high [CO2] conditions. However, a complication for the correct estimation of the effect of elevated [CO2] on transpiration is that experiments have been performed in environmentally controlled and generally well mixed and ventilated experimental set-up (open-top chambers), where the indirect effects may not show up so prominently as in a real and outside future climate (Unsworth et al., 1984; Leuning and Foster, 1990).
Conclusion
Whole-plant chambers were developed as a mean to measure gas-exchange rates in grapevines growing in the field, thus becoming a valuable way to handle the daily variations of carbon and water fluxes in the whole-plant under variable environmental conditions [i.e., water regimes, (CO2), etc.], and leaf aging.
These results clearly show marked differences in daily NCE and E all along the vine vegetative growing cycle as well as when comparing between irrigation treatments.
Water scarcity and leaf aging were shown to significantly decrease daily water use but at expenses of lower NCE, but reducing WUE and confirming the lack of correlation between WUEi and whole-canopy WUE. At late stages (i.e., when the vegetative growing phase stops), we suggest that the contribution of grapevine clusters to the total carbon balance by the whole berry respiration, might be high enough to greatly reduce the daily NCE, and thus to ultimately regulate total plant WUE.
Future studies in this area should address to measure the specific contribution of grapevine clusters to the whole-plant NCE as it may explain the reported discrepancy between WUEi and whole-canopy WUE.
Author Contributions
All authors contributed to the experiments, data collection, and results evaluation. HM supervised and discussed the manuscript.
Funding
This work has been developed with financial support from the Spanish Ministry of Science and Technology (project AGL-2014-54201-C4-1R AEI/FEDER, UE) and by the UE project ERA-NET COFOUNMD FACCE SURPLUS, (Ref: 652615). We would like to thank Mr. Miquel Mas and collaborators of the UIB Experimental Field and Greenhouses which are supported by the UIBGrant 15/2015.
Conflict of Interest Statement
The authors declare that the research was conducted in the absence of any commercial or financial relationships that could be construed as a potential conflict of interest.
References
Ainsworth, E. A., and Long, S. P. (2005). What have we learned from 15 years of free-air CO2 enrichment (FACE)? A meta-analytic review of the responses of photosynthesis, canopy properties and plant production to rising CO2. New Phytol. 165, 351–372. doi: 10.1111/j.1469-8137.2004.01224.x
Ainsworth, E. A., and Rogers, A. (2007). The response of photosynthesis and stomatal conductance to rising [CO2]: mechanisms and environmental interactions. Plant Cell Environ. 30, 258–270. doi: 10.1111/j.1365-3040.2007.01641.x
Alleweldt, G., Eibach, R., and Ruhl, E. (1982). Investigations on gas exchange in grapevine. I. Influence of temperature, leaf age and time of day on net photosynthesis and transpiration. Vitis 21, 93–100.
Boyer, J. S., Wong, S. C., and Farquhar, G. D. (1997). CO2, and water vapor exchange across leaf cuticle (epidermis) at various water potentials. Plant Physiol. 114, 185–191. doi: 10.1104/pp.114.1.185
Buckley, T. N., Mott, K. A., and Farquhar, G. D. (2003). A hydromechanical and biochemical model of stomatal conductance. Plant Cell Environ. 26, 1767–1785. doi: 10.1104/pp.17.00666
Corelli-Grappadelli, L., and Magnanini, E. (1997). Whole-tree gas exchanges: can we do it cheaper? Acta Horticult. 451, 279–285. doi: 10.17660/ActaHortic.1997.451.32
Drake, B. G., Gonzalez-Meler, M. A., and Long, S. P. (1997). More efficient plants: a consequence of rising atmospheric CO2? Annu. Rev. Plant Physiol. Plant Mol. Biol. 48, 609–639. doi: 10.1146/annurev.arplant.48.1.609
Edson, C. E., Howell, G. S., and Flore, J. A. (1993). Influence of crop load on photosynthesis and dry matter partitioning of Seyval grape-vines. I. Single leaf and whole vine response pre- and post-harvest. Am. J. Enol. Vitic. 44,139–147.
Escalona, J. M., Flexas, J., Bota, J., and Medrano, H. (2003). Distribution of leaf photosynthesis and transpiration within grapevine canopies under different drought conditions. Vitis 42, 57–64.
Escalona, J. M., Fuentes, S., Tomàs, M., Martorell, S., Flexas, J., and Medrano, H. (2013). Responses of leaf night transpiration to drought stress in Vitis vinifera L. Agric. Water Manag. 118, 50–58. doi: 10.1016/j.agwat.2012.11.018
Escalona, J. M., Pou, A., Tortosa, I., Hernández-Montes, E., Tomás, M., Martorell, S., et al. (2016). Using whole-plant chambers to estimate carbon and water fluxes in field-grown grapevines. Theor. Exp. Plant Physiol. 28, 241–254. doi: 10.1007/s40626-016-0073-7
Escalona, J. M., Tomas, M., Martorell, S., Medrano, H., Ribas-carbo, M., and Flexas, J. (2012). Carbon balance in grapevines under different soil water supply: importance of whole plant respiration. Aust. J. Grape Wine Res. 18, 308–318. doi: 10.1111/j.1755-0238.2012.00193.x
Field, C., and Mooney, H. A. (1983). Leaf age and seasonal effects on light, water, and nitrogen use efficiency in a California shrub. Oecologia 56, 348–355. doi: 10.1007/BF00379711
Field, C. B., Ball, J. T., and Berry, J. A. (1989). “Photosynthesis: Principles and field techniques, 209-253,” in Plant Physiological Ecology. Field Methods and Instrumentation, eds R. W. Pearcy, J. Ehleringer, H. A. Mooney, and P. W. Rundel (New York, NY: Chapman and Hall Ltd.).
Garcia, R., Norman, J. M., and Mc Dermitt, D. K. (1990). Measurements of canopy gas exchange using an open chamber system. Remote Sensing Rev. 5, 141–162. doi: 10.1080/02757259009532126
Gerhart, L. M., and Ward, J. K. (2010). Plant responses to low [CO2] of the past. New Phytol. 188, 674–695. doi: 10.1111/j.1469-8137.2010.03441.x
Harbinson, J., and Foyer, C. H. (1991). Relationship between the efficiencies of Photosystem I and Photosystem II and stromal redox state in CO2 free air–evidence for cyclic electron flow in vivo. Plant Physiol. 97, 41–49. doi: /10.1104/pp.97.1.41
Hernández-Montes, E. (2017). Respiratory Processes and Carbon Balance in Grapevines: Environmental and Genotype Effects. Master’s thesis. Spain: University of the Balearic Islands.
Hernández-Montes, E., Tomás, M., Escalona, J. M., Bota, J., and Medrano, H. (2018). Leaf growth rate and nitrogen content determine respiratory costs during leaf expansion in grapevines. Physiol. Plant. doi: 10.1111/ppl.12769 [Epub ahead of print].
Intrieri, C., Poni, S., Rebucci, B., and Magnanini, E. (1997). Effects of canopy manipulations on whole-vine photosynthesis: Results from pot and field experiments. Vitis 36, 167–173.
Intrieri, C., Poni, S., Rebucci, B., and Magnanini, E. (1998). Row orientation effects on whole-canopy gas exchange of potted and field grown grapevines. Vitis 37, 147–154.
Leuning, R., and Foster, L. J. (1990). Estimation of transpiration by single trees: comparison of a ventilated chamber, leaf energy budgets and a combination equation. Agric. For. Meteorol. 51, 63–68. doi: 10.1016/0168-1923(90)90042-5
Long, S. P., Ainsworth, E. A., Rogers, A., and Ort, D. R. (2004). Rising atmospheric carbon dioxide: plants FACE the Future. Annu Rev. Plant Biol. 55, 591–628. doi: 10.1146/annurev.arplant.55.031903.141610
Long, S. P., and Hällgren, J. E. (1989). “Measurement of CO2 assimilation by plants in the field and the laboratory, 62-94,” in Techniques in Bioproductivity and Photosynthesis, eds J. Coombs, D. O. Hall, S. P. Long, and J. M. Scurlock (Oxford: Pergamon Press).
Medrano, H., Escalona, J. M., Cifre, J., Bota, J., and Flexas, J. (2003). A ten-year study on the physiology of two Spanish grapevine cultivars under field conditions: effects of water availability from leaf photosynthesis to grape yield and quality. Funct. Plant Biol. 30, 607–619. doi: 10.1071/FP02110
Medrano, H., Pou, A., Tomás, M., Martorell, S., Gulias, J., Flexas, J., et al. (2012). Average daily light interception determines leaf water use efficiency among different canopy locations in grapevine. Agric. Water Manage. 114, 4–10. doi: 10.1016/j.agwat.2012.06.025
Merli, M. C., Gatti, M., Galbignani, M., Bernizzoni, F., Magnanini, E., and Poni, S. (2015). Water use efficiency in Sangiovese grapes (Vitis vinifera L.) subjected to water stress before veraison: different levels of assessment lead to different conclusions. Funct. Plant Biol. 42, 198–208. doi: 10.1071/FP14112
Miller, D. P., Howell, G. S., and Flore, J. A. (1997). Influence of shoot number and crop load on potted Chambourcin grapevines: Whole-vine vs. single-leaf photosynthesis. Vitis 36, 109–114.
Norby, R. J., Wullschleger, S. D., Gunderson, C. A., Johnson, D. W., and Ceulemans, R. (1999). Tree responses to rising CO2 in field experiments: implications for the future forest. Plant Cell Environ. 22, 683–714. doi: 10.1046/j.1365-3040.1999.00391.x
Nowak, R. S., Ellsworth, D. S., and Smith, S. D. (2004). Functional responses of plants to elevated atmospheric CO2-do photosynthetic and productivity data from FACE experiments support early predictions? New Phytol. 162, 253–280. doi: 10.1111/j.1469-8137.2004.01033.x
Ollat, N., and Gaudillère, J. P. (2000). Carbon balance in developing grapevine berries. Acta Horticult. 526, 345–350. doi: 10.17660/ActaHortic.2000.526.37
Pagay, V. (2016). Effects of irrigation regime on canopy water use and dry matter production of Tempranillo grapevines in the semi-arid climate of Southern Oregon. U.S.A. Agric. Water Manag. 178, 271–280. doi: 10.1016/j.agwat.2016.10.014
Pagay, V., Zufferey, V., and Lakso, A. N. (2016). The influence of water stress on grapevine (Vitis vinifera L.) shoots in a cool humid climate: growth, gas exchange and hydraulics. Funct. Plant Biol. 43, 827–837. doi: 10.1071/FP16017
Palliotti, A., and Cartechini, A. (2001). Developmental changes in gas exchange activity in flowers, berries and tendrils of field-grown cabernet sauvignon. Am. J. Enol. Viticult. 4, 317–323.
Palliotti, A., Tombesi, S., Frioni, T., Famiani, F., Silvestroni, O., Zamboni, M., et al. (2014). Morpho-structural and physiological response of container-grown Sangiovese and Montepulciano cv. (Vitis vinifera) to re-watering after a pre-veraison limiting water deficit. Funct. Plant Biol. 41, 634–647. doi: 10.1071/FP13271
Patil, M. N., Dharmaraj, T., Waghmare, R. T., Prabha, T. V., and Kulkarni, J. R. (2014). Measurements of carbon dioxide and heat fluxes during monsoon-2011 season over rural site of India by eddy covariance technique. J. Earth Syst. Sci. 123, 177–185. doi: 10.1007/s12040-013-0374-z
Perez Peña, J. P., and Tarara, J. M. (2004). A portable whole canopy gas exchange system for several mature field-grown grapevines. Vitis 43, 7–14.
Petrie, P. R., Trought, C. T., and Howell, G. S. (2000). Influence of leaf aging, leaf area and crop load on photosynthesis, stomatal conductance and senescence of grapevines (Vitis vinifera L. cv. Pinot noir) leaves. Vitis 39, 31–36.
Petrie, P. R., Trought, M. C., Howell, G. S., Buchan, G. D., and Palmer, J. W. (2009). Whole-canopy gas exchange and light interception of vertically trained Vitis vinifera L. under direct and diffuse light. Am. J. Enol. Vitic 60,173–182.
Poni, S., Bernizzonia, F., Civardia, S., Gattia, M., Porro, D., and Caminc, F. (2009). Performance and water-use efficiency (single-leaf vs. whole-canopy) of well-watered and half-stressed split-root Lambrusco grapevines grown in Po Valley (Italy). Agric. Ecosyst. Environ. 129, 97–106. doi: 10.1016/j.agee.2008.07.009
Poni, S., Intrieri, C., and Magnani, E. (1999). Set-up, calibration and testing of a custom-built system for measuring whole-canopy transpiration in grapevine. Acta Hortic. 493, 149–160. doi: 10.17660/ActaHortic.1999.493.14
Poni, S., Intrieri, C., and Magnani, E. (2000). Seasonal growth and gas exchange of conventionally and minimally pruned Chardonnay canopies. Vitis 39, 13–18.
Poni, S., Magnanini, E., and Rebucci, B. (1997). An automated chamber system for measurements of whole-vine gas exchange. HortScience 32, 64–67.
Poni, S., Magnanini, E., and Bernizzoni, F. (2003). Degree of correlation between total light interception and whole-canopy net CO2 exchange rate in two grapevine growth systems. Aust. J Grape Wine Res. 9, 2–11.
Poni, S., Merli, M. C., Magnanini, E., Galbignani, M., Bernizzoni, F., Vercesi, A., et al. (2014). An Improved multi chamber gas exchange system for determining whole-canopy water-use. Am. J. Enol. Vitic. 65, 268–276. doi: 10.5344/ajev.2014.13117
R Core Team (2016). R: A Language and Environment for Statistical Computing. Vienna: R Foundation for Statistical Computing. Available at: https://www.R-project.org/
Sánchez-de-Miguel, P., Baeza, P., Junquera, P., and Lissarrague, J. R. (2010). “Vegetative development: total leaf area and surface area indexes,” in Methodologies and Results in Grapevine Research, eds S. Delrot, H. Medrano, L. Bavaresco, and S. Grando (Amsterdam: Springer), 31–44.
Schultz, H. R. (1993). Photosynthesis of sun and shade leaves of field grown grapevines (Vitis vinifera L) in relation to leaf age. Suitability for the plastochron concept for the expression of physiological age. Vitis 32, 197–205.
Tarara, J. M., and Pena, J. E. P. (2015). Moderate water stress from regulated deficitirrigation decreases transpiration similarly to net carbon exchange ingrapevine canopies. J. Am. Soc. Horticult. Sci. 140, 413–426.
Tarara, J. M., Peña, J. E. P., Keller, M., Schreiner, R. P., and Smithyman, R. P. (2011). Net carbon exchange in grapevine canopies responds rapidly to timing and extent of regulated deficit irrigation. Funct. Plant Biol. 38, 386–400. doi: 10.1071/FP10221
Tomàs, M., Medrano, H., Escalona, J. M., Martorell, S., Pou, A., Ribas-Carbó, M., et al. (2014). Variability of water use efficiency in grapevines. Environ. Exp. Bot. 103, 148–157. doi: 10.1016/j.envexpbot.2013.09.003
Tomàs, M., Medrano, H., Pou, A., Escalona, J. M., Martorell, S., Ribas-Carbó, M., et al. (2012). Water-use efficiency in grapevine cultivars grown under controlled conditions: effects of water stress at the leaf and whole-plant level. Austr. J. Grape Wine Res. 18, 164–172. doi: 10.1111/j.1755-0238.2012.00184.x
Unsworth, M. H., Heagle, A. S., and Heck, W. W. (1984). Gas exchange in open top field chambers. I. Measurement and analysis of atmospheric resistances. Atmosph. Environ. 18, 373–380. doi: 10.1016/0004-6981(84)90111-2
Zufferey, V. (2016). Leaf respiration in grapevine (Vitis vinifera ‘Chasselas’) in relation to environmental and plant factors. J. Grapevine Res. 72, 65–72.
Keywords: grapevine, water use efficiency, whole plant chambers, water stress, carbon balance
Citation: Douthe C, Medrano H, Tortosa I, Escalona JM, Hernández-Montes E and Pou A (2018) Whole-Plant Water Use in Field Grown Grapevine: Seasonal and Environmental Effects on Water and Carbon Balance. Front. Plant Sci. 9:1540. doi: 10.3389/fpls.2018.01540
Received: 14 August 2018; Accepted: 02 October 2018;
Published: 12 November 2018.
Edited by:
Manoj Menon, University of Sheffield, United KingdomReviewed by:
Claudio Lovisolo, Università degli Studi di Torino, ItalyWalter Chitarra, Consiglio per la Ricerca in Agricoltura e l’Analisi dell’Economia Agraria (CREA), Italy
Copyright © 2018 Douthe, Medrano, Tortosa, Escalona, Hernández-Montes and Pou. This is an open-access article distributed under the terms of the Creative Commons Attribution License (CC BY). The use, distribution or reproduction in other forums is permitted, provided the original author(s) and the copyright owner(s) are credited and that the original publication in this journal is cited, in accordance with accepted academic practice. No use, distribution or reproduction is permitted which does not comply with these terms.
*Correspondence: Alicia Pou, YWxpY2lhLnBvdS44MUBnbWFpbC5jb20=
†Present address: Esther Hernández-Montes, Department of Horticulture and Landscape Architecture, Irrigated Agriculture Research and Extension Center, Washington State University, Prosser, WA, United States