 Harsh Raman1*
 Rosy Raman1
 Simon Diffey2Yu Qiu1
 Brett McVittie1Denise Maria Barbulescu3Phil Anthony Salisbury3,4Steve Marcroft5
 Regine Delourme6
- 1Graham Centre for Agricultural Innovation, Wagga Wagga Agricultural Institute, Wagga Wagga, NSW, Australia
- 2Centre for Bioinformatics and Biometrics, University of Wollongong, Wollongong, NSW, Australia
- 3Agriculture Victoria, Grains Innovation Park, Horsham, VIC, Australia
- 4Faculty of Veterinary and Agricultural Sciences, The University of Melbourne, Melbourne, VIC, Australia
- 5Marcroft Grains Pathology, Horsham, VIC, Australia
- 6IGEPP, INRA, Agrocampus Ouest, Université Rennes, Le Rheu, France
The hemibiotrophic fungus, Leptosphaeria maculans is the most devastating pathogen, causing blackleg disease in canola (Brassica napus L). To study the genomic regions involved in quantitative resistance (QR), 259–276 DH lines from Darmor-bzh/Yudal (DYDH) population were assessed for resistance to blackleg under shade house and field conditions across 3 years. In different experiments, the broad sense heritability varied from 43 to 95%. A total of 27 significant quantitative trait loci (QTL) for QR were detected on 12 chromosomes and explained between 2.14 and 10.13% of the genotypic variance. Of the significant QTL, at least seven were repeatedly detected across different experiments on chromosomes A02, A07, A09, A10, C01, and C09. Resistance alleles were mainly contributed by ‘Darmor-bzh’ but ‘Yudal’ also contributed few of them. Our results suggest that plant maturity and plant height may have a pleiotropic effect on QR in our conditions. We confirmed that Rlm9 which is present in ‘Darmor-bzh’ is not effective to confer resistance in our Australian field conditions. Comparative mapping showed that several R genes coding for nucleotide-binding leucine-rich repeat (LRR) receptors map in close proximity (within 200 Kb) of the significant trait-marker associations on the reference ‘Darmor-bzh’ genome assembly. More importantly, eight significant QTL regions were detected across diverse growing environments: Australia, France, and United Kingdom. These stable QTL identified herein can be utilized for enhancing QR in elite canola germplasm via marker- assisted or genomic selection strategies.
Introduction
Canola (rapeseed, Brassica napus L.) is one of the major oilseed crops of the world, contributing 13% of oil supply. In recent years, high market price of canola, plasticity in flowering time window, and response to moisture supply (rainfall and irrigation) has encouraged farmers to grow this crop in narrow rotations across a range of environments. Blackleg disease, caused by the hemibiotrophic fungal pathogen, Leptosphaeria maculans undermines sustainable production of canola especially in Australia, Canada, France, and United Kingdom (West et al., 2001; Fitt et al., 2006). Yield reductions of up to 80% have been reported (West et al., 2001) in addition to marked reduction in seed and oil quality attributes. Several control measures such as crop rotation, stubble management and use of fungicides, as seed dressing and foliar application, have been used to control the disease (West et al., 2001; Marcroft et al., 2012a,b). However, widespread use of fungicides such as Jockey® (Fluquinconazole) for seed dressing, and Impact® (Flutriafol) as a fertilizer has led the development of fungicide resistant isolates (Van de Wouw et al., 2017). Breeding for host resistance is considered as an effective and environment friendly strategy to protect various crops, including canola from L. maculans infection. It has become a major target trait in Australian canola breeding programs after the severe epidemics of the early 1970s (Salisbury and Wratten, 1999).
There is a wide range of genetic variation in resistance to blackleg among canola cultivars. Two types of resistance, qualitative resistance conferred by race-specific R genes, and quantitative resistance (QR) conferred by non-race specific genes (QTL) have been deployed to combat this disease in commercial cultivars. To date, at least fifteen R genes have been identified in B. napus and its related species, B. rapa and B. juncea (Raman et al., 2013). Although these R genes provide ‘complete’ protection from L. maculans infection, this resistance often becomes ineffective, particularly when the frequency of avr alleles is high in nature (Sprague et al., 2006; Van de Wouw et al., 2010a,b, 2014). Even deployment of R gene pyramids, in cultivars such as Surpass400 and Hyola50 has not provided long-term durability against highly diverse L. maculans races in Australia. Research has shown that QR is more ‘durable’ and provides long-term protection to host plants (Delourme et al., 2006a; Brun et al., 2010; Delourme et al., 2014). However, identification of such resistance is very difficult to achieve particularly when R gene(s) are present in the same cultivar/accession. Several canola breeding programs rely on screening germplasm under blackleg nurseries across multiple locations and selecting the best standing plants or surviving lines at the end of the growing season. This practice is quite effective but is not highly efficient for making genetic gains by incorporating QR in breeding lines.
Genetic mapping of QR via traditional QTL and association (genome wide association studies) mapping approaches has enabled the identification of quantitative loci for resistance to L. maculans on the genetic/physical maps of B. napus (Delourme et al., 2008; Kaur et al., 2009; Jestin et al., 2011; Jestin et al., 2012; Raman et al., 2012a,b; Raman R. et al., 2016; Raman H. et al., 2016; Fopa Fomeju et al., 2014; Jestin et al., 2015; Larkan et al., 2016a; Kumar et al., 2018). One of the major limitations of QTL mapping studies in genetic improvement programs has been the stability of QTL across environments and the magnitude of QTL effects in different genetic backgrounds (Pilet et al., 2001; Delourme et al., 2008; Jestin et al., 2012; Huang et al., 2016; Larkan et al., 2016a; Kumar et al., 2018). Of the various genetic analyses/QTL identification studies conducted to date, Darmor-bzh/Yudal (DY) DH population of B. napus has been extensively evaluated for resistance to blackleg in diverse environments across Europe (Pilet et al., 1998; Delourme et al., 2008; Huang et al., 2009; Jestin et al., 2012; Kumar et al., 2018). However, the effectiveness of QR and those QTL identified in Europe have not been tested against highly diverse pathogenic Australian L. maculans populations.
In this study, we evaluated the DYDH population under Australian field, glasshouse and shade house conditions using an ascospore shower test and identified QR loci. We further compared the physical locations of QTL that are identified in Australia (this study), with those identified in France and United Kingdom to identify consistent genomic regions involved in resistance across continents. Research findings would be useful to decipher functional genes underlying such regions as well as to provide target regions (molecular markers) for marker-assisted and genomic selection in canola breeding programs.
Materials and Methods
A doubled haploid (DH) population derived from a cross between ‘Darmor-bzh’ and ‘Yudal,’ comprising 276 lines (Foisset et al., 1995, 1996) was accessed from INRA, Le Rheu, France. ‘Darmor-bzh’ is a French winter type and double-low oil quality cultivar, while ‘Yudal,’ is a Korean Spring type cultivar. Besides resistance to blackleg disease, this population also segregates for a range of traits such as plant height, flowering time, oil content (Delourme et al., 2006b) and quality, and tolerance to manganese (Mn2+) toxicity (Raman et al., 2017). ‘Darmor-bzh’ carries the dwarf Bzh gene and is known to carry Rlm9 for qualitative resistance to L. maculans (Foisset et al., 1995; Delourme et al., 2004). Seed of parental lines as well DH lines was multiplied in caged tents to produce ‘pure’ seed for phenotypic and genetic analyses.
Fungal Isolates
Pure cultures of L. maculans were obtained from Marcroft Grains Pathology, Horsham (Australia) and then multiplied on V8 agar medium at the Wagga Wagga Agricultural Institute (WWAI). One isolate D10 (PHW1223, AvrLm5, AvrLm6, AvrLm8, AvrLm9, LepR3; Marcroft et al., 2012b) was used to screen for expression of resistance conferred by Rlm9 gene. D13 isolate (having avrLm9) was used to reconfirm the resistance mediated by Rlm9 among resistant lines.
Phenotyping of DH Lines for Resistance to L. maculans
R Gene Mediated Resistance
To pinpoint whether Rlm9 gene contributes to resistance under field conditions, we evaluated 259 DH lines of a DYDH population using a single spore isolate of L. maculans following randomized complete block design.
2016 Glasshouse Trial: We used a randomized complete block design where thirty eight 7 column by 2 row seedling trays were placed on a glasshouse bench in the manner presented in Supplementary Figure 1. Even numbered trays were one replicate block and odd numbered trays the other replicate block. Two hundred and sixty six lines, comprising 259 DH lines and 7 control lines were sown once in each replicate block. The treatment and blocking structure for the 2016 glasshouse trial can be written as
Blocking structure: Block
Treatment structure: Geno
where Block is a factor with 2 levels and Geno is a factor with 266 levels.
Expression of the R gene was assessed under controlled environment (CE) conditions at the cotyledon stage. Seven to 10 day old seedlings were inoculated with conidial spore suspension (5 × 10⁶ spores/mL) containing 0.01% of Tween 20 as described previously (Raman et al., 2012b). Both lobes of each cotyledon were punctured with a plastic micropipette tip and then inoculated with 10 μL of spore suspension. Inoculated seedlings were subjected to a humidity chamber to ensure optimum wetness in the CE for 48 h. Trays were then shifted to the CE room and maintained at 20°C ± 1C with 16–8 h photoperiod. The disease symptoms started to appear after 10–12 days from inoculation. Three week after inoculation, all DH lines and other parental lines including ‘checks’ were scored for disease severity based on a scale described previously (Koch et al., 1991). DH lines as well as six parental lines/check cultivars, Darmor, AV-Garnet, and TornadoTT were used as resistant, while Yudal, Westar (no R gene), and Caiman were used as susceptible controls.
In order to test whether the same set of R gene(s) expressed at the cotyledon stage also control resistance at the adult plant stage, we raised all DH lines that were inoculated with isolate PHW1223 in a glasshouse using the same experimental design as described above. Five months after inoculations, all DH lines were scored for internal infection using a 1–5 scale; where 0 = healthy, 1 = 1–20% stem discoloration (internal infection), 2 = 21 to 40% internal infection, 3 = 41–60% internal infection, 4 = 61–80% internal infection and 5 = 81–100% internal infection, as described in Larkan et al. (2016a).
Quantitative Genes Mediated Resistance
Three experiments were carried out in 2014, 2015, and 2016 to assess resistance to L. maculans in the DYDH population following statistically valid designs under shade house and field conditions.
Ascospore shower test
The 2014 ascospore shower (tub) test using the mixed stubble collected after harvest of canola varieties was conducted as described previously (Marcroft et al., 2012b) in a multi-phase experiment comprising a glasshouse, growth chamber and shade house phase. Seedlings were grown in 20 cell (4 rows by 5 columns) seedling trays for approximately 2 weeks in a glasshouse. In each tray, a single DH line (or a parental line) was allocated to the 4 cells in each tray column, i.e., each tray contained 5 DH lines. Each DH line was replicated twice, i.e., was allocated to a tray column in two different trays. The two parental lines were replicated 30 times. The experimental unit at the glasshouse (and growth chamber) stage of the experiment is a tray column. Trays were then allocated to one of two growth chambers in such a way that each growth chamber contains 4 seedlings, i.e., one experimental unit, of each DH line. The growth chamber phase of the experiment lasts 2 days in which time blackleg fungal spores have an opportunity to cause seedling infection. At the end of the growth chamber phase the 4 single DH line seedlings in a tray are transplanted into a pot which is then placed in a shade house. The shade house is divided into two bays (left and right) with pots arranged in a 4 column by 86 row arrays in one bay and a 4 column by 69 row arrays in the other bay, i.e., a total of 620 pots. A restricted randomization was used to assign growth chamber tray experimental units to non-rectangular blocks of 5 pots in the shade house. Pots were kept in the shade house for approximately 3 weeks and then each plant within a pot was visually assessed for internal infection. Internal infection data was collected on 269 DH lines, the two parental lines and 6 Australian canola varieties: Crusher, CB-Telfer, Hyola444, ThumperTT, ATR-Marlin, ATR-Stingray which were used as resistant and susceptible controls. The treatment and blocking structure for the 2014 tub test trial can be written using the symbolic notation of Wilkinson and Rogers (1973) as
Blocking structure: GC + GC.Tray + GC.GCCol.GCRow
+ SHBay + SHBay.SHBlock
Treatment structure: Geno
where GC indexes growth chambers and is a factor with 2 levels, Tray is a unique identifier for trays within growth chambers, GGCol and GCRow indexes the spatial arrangement of tray experimental units within each growth chamber, SHBay is a factor which indexes the two sides of the shade house and SHBlock indexes non-rectangular blocks of 5 pots within each shadehouse bay.
Field evaluation trials
The design for the 2015 field trial was a randomized complete block design where 600 plots were arranged in a 40 row by 15 column array with two replicate blocks comprising rows 1–20 and rows 21–40. Three hundred lines, comprising 276 DYDH lines, two parental lines and 22 other commercial lines were sown in each replicate block. The treatment and blocking structure for the 2015 field trial can be written as
Blocking structure: Block
Treatment structure: Geno
where Block is a factor with 2 levels and Geno is a factor with 300 levels.
The design for the 2016 field trial was a randomized complete block design where 600 plots were arranged in a 50 row by 12 column array with two replicate blocks comprising columns 1–6 and columns 7–12. Two hundred and ninety eight lines, comprising 274 DH lines, two parental lines and 22 other commercial/advanced breeding lines (05-P71-11, ATR-Stingray, AV-Garnet, ATR-Marlin, BC78868-P2, BC78868-P3, BC 78868-P6, BLN3343-CO0402, CB-Telfer, Charlton-093, Crusher-TT, Hyola50, Monty-094, NMT370, Surpass501TT, Tarcoola-27, Tarcoola-43, Tarcoola-22-094, Tarcoola-69-092, Tarcoola-141, Tarcoola-191, and TornadoTT) were sown once in each replicate block. A single commercial line was sown twice in each replicate block. The treatment and blocking structure for the 2016 field trial can be written as
Blocking structure: Block
Treatment structure: Geno
where Block is a factor with 2 levels and Geno is a factor with 299 levels. Each experimental unit (DH/parental/check cv.) was sown in 10 m rows with 50 cm row spacing. Two hundred seed from each line were sown in the blackleg nurseries under lateral move irrigation having mixed TT stubble as described previously (Raman H. et al., 2016).
Expression of QR was assessed at the physiological maturity stage (BBCH 90). Disease severity was assessed as per cent plant survival as well as per cent internal infection for all field and shade house experiments (internal darkening, canker scores) as described previously (Marcroft et al., 2012b; Raman et al., 2012b). Phenological development of DY population (maturity) was assessed in the 2015 field trial based on growth stages using the standard BBCH scale (an ordinal scale between 0 and 9 where 93% of the maturity scores were either: 7, 8, or 9).
Genetic Mapping
After the assessment of disease severity of the parental lines, ‘Darmor-bzh’ and ‘Yudal’ and their DH progenies, fresh leaf samples were obtained in 96 well formatted tubes. Total genomic DNA was isolated following a high throughout DNA protocol, essentially based on chloroform and phenol. A framework map of the DYDH population, based on 2,094 DArTseq markers was constructed as described previously (Raman et al., 2014, 2017). PCR based SCAR (sequence characterized amplified region) marker specific to Bzh gene for dwarfness was analyzed using the primer-pairs: SCM07UP1 and LP2 as described in Barret et al. (1998). The quality of marker data was reassessed for its suitability for QTL identification by considering missing data, duplicate markers, markers with excessive segregation distortion, and DH clones that may arise during the microspore culture process. A total of 249 markers with more than 70% missing data, were removed. Two DH lines (DY043 and DY044) which had more than 70% of missing marker scores were also removed from the analysis.
Thirteen DH individuals were removed from the marker data as the proportion of matching genotypes with another marker was more than 99%. The DH individual with the most missing data was the DH individual removed when considering clones. The final set of marker data containing 1842 markers scored as −1, or 1 or NA (missing) over 262 DH lines was used for QTL identification. Missing data for a DH line was imputed using the mean of the 4 nearest neighbors with non-missing data for that DH line using the ASMap (Taylor and Butler, 2016) and pedicure (Butler, 2016) software packages within the R (R Core Team, 2014) computing environment.
Statistical Analysis of the Phenotypic Data and QTL Mapping
Reliability (broad sense heritability, H2) and accuracy (Mrode and Thompson, 2005) were calculated from the extended baseline linear mixed for each trait within trials. The statistical analysis of each trait within a trial used linear mixed model technology and proceeded in six stages: (1) Fit a baseline linear mixed model. (2) Extend the baseline linear mixed model by considering other sources of variation, e.g., spatial variability in field trials. (3) Add markers to the (extended) baseline linear mixed model. (4) Consider each marker separately as a fixed effect in a genome scan model. (5) Based on the genome scan model select a subset of markers upon which backward elimination is performed. (6) A final set of markers is identified and declared as putative QTL. All traits considered, except maturity, were transformed using the logit transformation to better satisfy model assumptions of normality and constant variance.
The baseline statistical model for each trait in each trial can be written, using the symbolic notation described by Wilkinson and Rogers (1973), as trait ∼1 + GnonDH + GDH + BlockingStructure + units where 1 is the overall mean, GnonDH and GDH are a partitioning of the treatment structure term Geno into non doubled haploid lines and doubled haploid lines respectively, i.e., GnonDH indexes the parental, control and commercial lines. The term BlockingStructure refers to factors which reflect trial design. Terms in bold font are considered random terms and associated with each of these terms is a variance parameter (often referred to as a variance component). The preferred method for estimating these parameters is residual (or restricted) maximum likelihood (REML) (Patterson and Thompson, 1971). The term units refer to the residual and its associated variance parameter is the residual variance. Marker effects can be accommodated in the (extended) baseline linear mixed model by partitioning the effects of doubled haploid lines into marker effects plus random genetic variation. In the genome scan model, each marker is fitted as a fixed effect sequentially and for each marker a Wald type conditional F-statistic and an associated p-value is computed. LOD scores are calculated for each marker using the formula - log10(pi) where pi is the p-value associated with the i-th marker. At the completion of fitting the genome scan model a subset of markers where each marker had a p-value less than 0.01, i.e., a LOD score greater than 2, were chosen. Chosen markers that were within 30 cM of another chosen marker were culled to a single representative marker for that region based on LOD score. The chosen subset of markers were simultaneously fitted as fixed effects and backward elimination was conducted by dropping markers fitted as fixed effects one at a time until all remaining markers in the model had a LOD score of approximately 2. This final set of markers is referred to as the putative QTL marker set. The process of performing a genome scan, choosing a subset of markers for backward elimination and identifying a putative QTL marker set is performed a second time with the initial putative QTL marker set fitted as fixed effects in the genome scan and subsequent models. This approach to QTL identification is the approach considered by Nelson et al. (2014). All models were fitted using the statistical software package ASreml (Butler et al., 2009) within the R computing environment.
Results
Resistance to L. maculans Is Genetically Controlled in DYDH Population
The mean logit-transformed disease scores for plant survival, cotyledon infection and internal infection (canker scores) were calculated for each phenotypic value. There was a significant genotypic variation for plant survival and internal infection scores among the DH lines. Frequency distributions for plant survival and internal infection showed continuous variation, confirming the quantitative inheritance of resistance to L. maculans. The H2 varied from 43 to 95%. The accuracy was also generally high for each experiment (Table 1). For example, the values for accuracy of ‘ascospore’ shower test carried-out under shade house were 66, 72 to 84% for field experiments and 88–98% for glasshouse experiments. High values for H2 and accuracy suggested that blackleg resistance was controlled by genetic factors, and the phenotypic data could be confidently used for detecting reliable QTL. To determine whether there was any correlation (r) between plant survival and internal infection, pair-wise raw correlations were calculated; high negative r values were obtained varying from r = −0.52 to −0.98 (Figure 1). For internal infection, r values ranged from 0.16 to 0.26 across three experiments (Ascospore shower test, field and glasshouse).
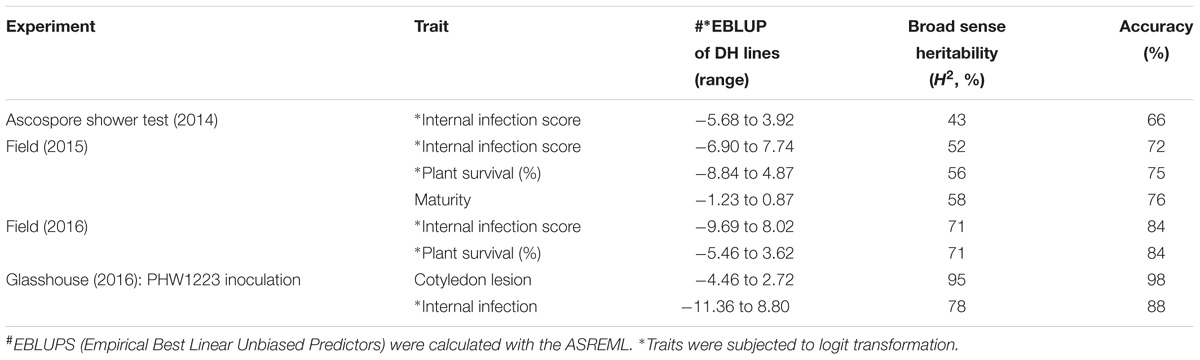
TABLE 1. Estimated reliability (H2, broad sense heritability) and accuracy from the (extended) baseline linear model for each trait and experiment combination.
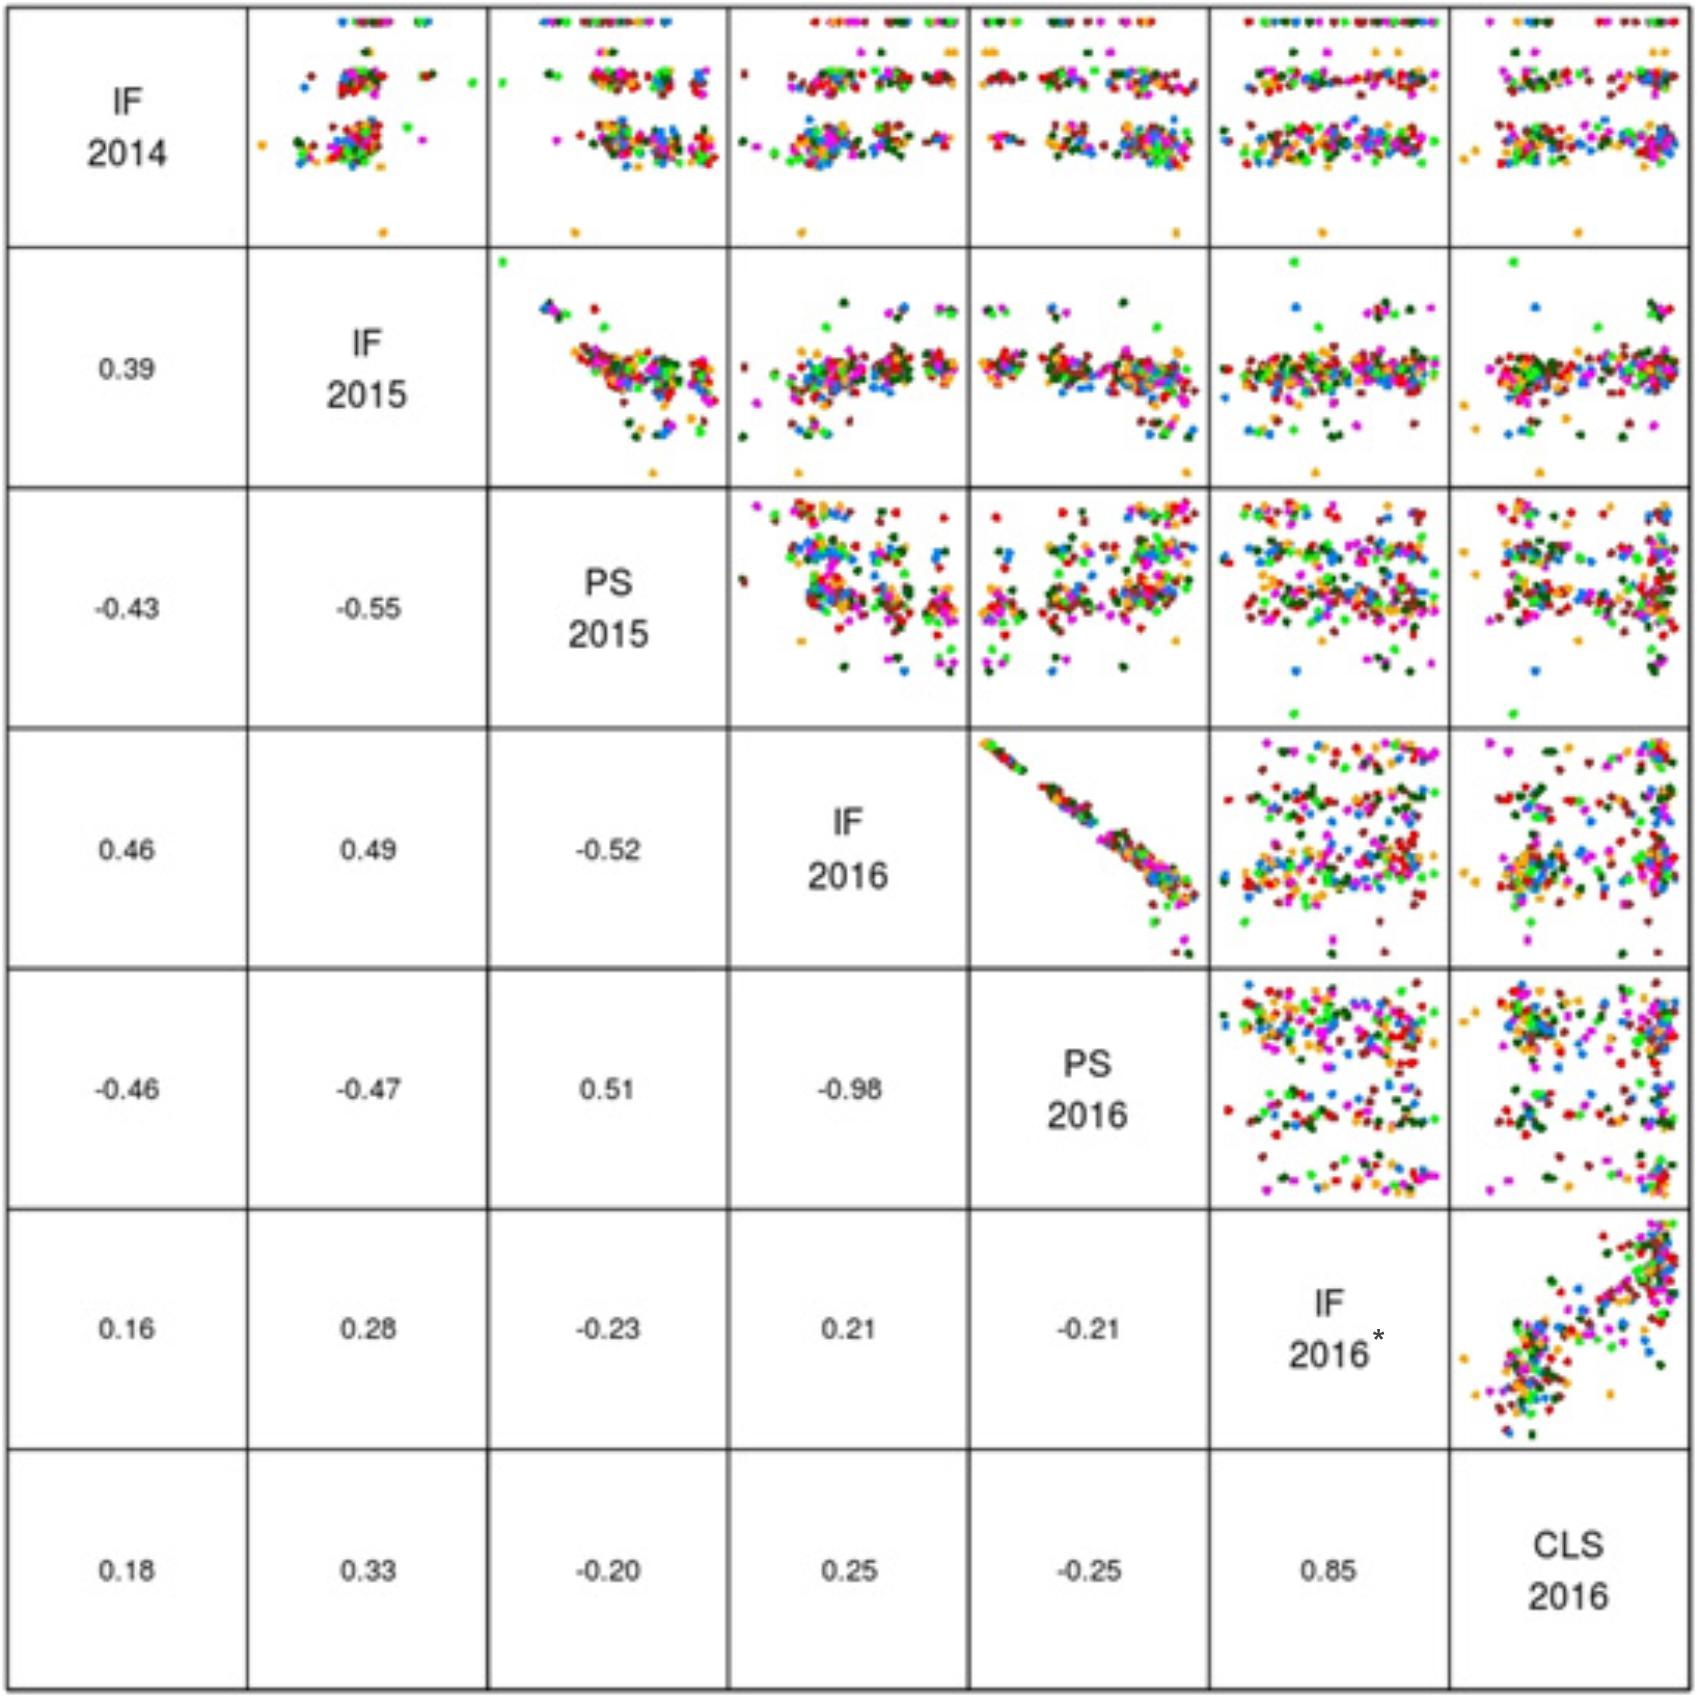
FIGURE 1. Pair plots showing genetic correlations between different phenotypic scores (EBLUPS) for resistance to L. maculans in the doubled haploid population from Darmor-bzh/Yudal. CLS, IF, and PS refer to cotyledon lesion score, internal infection and plant survival, respectively. IF 2014 data relate to internal infection scores from ascospore shower test. IF 2016∗ relates to internal infection scores from the inoculated plants with PHW1223 isolate.
QTL Identification: Multiple QTL Control Resistance to L. maculans
A total of 31 putative QTL were associated with resistance to L. maculans under glasshouse, shade house, and field conditions (Table 2) which were distributed onto chromosomes A02, A04, A06, A07, A08, A09, A10, C01, C02, C04, C07, C08, and C09. No QTL for resistance on chromosomes A01, A03, A05, C03, C05, and C06 was detected in the DYDH population.
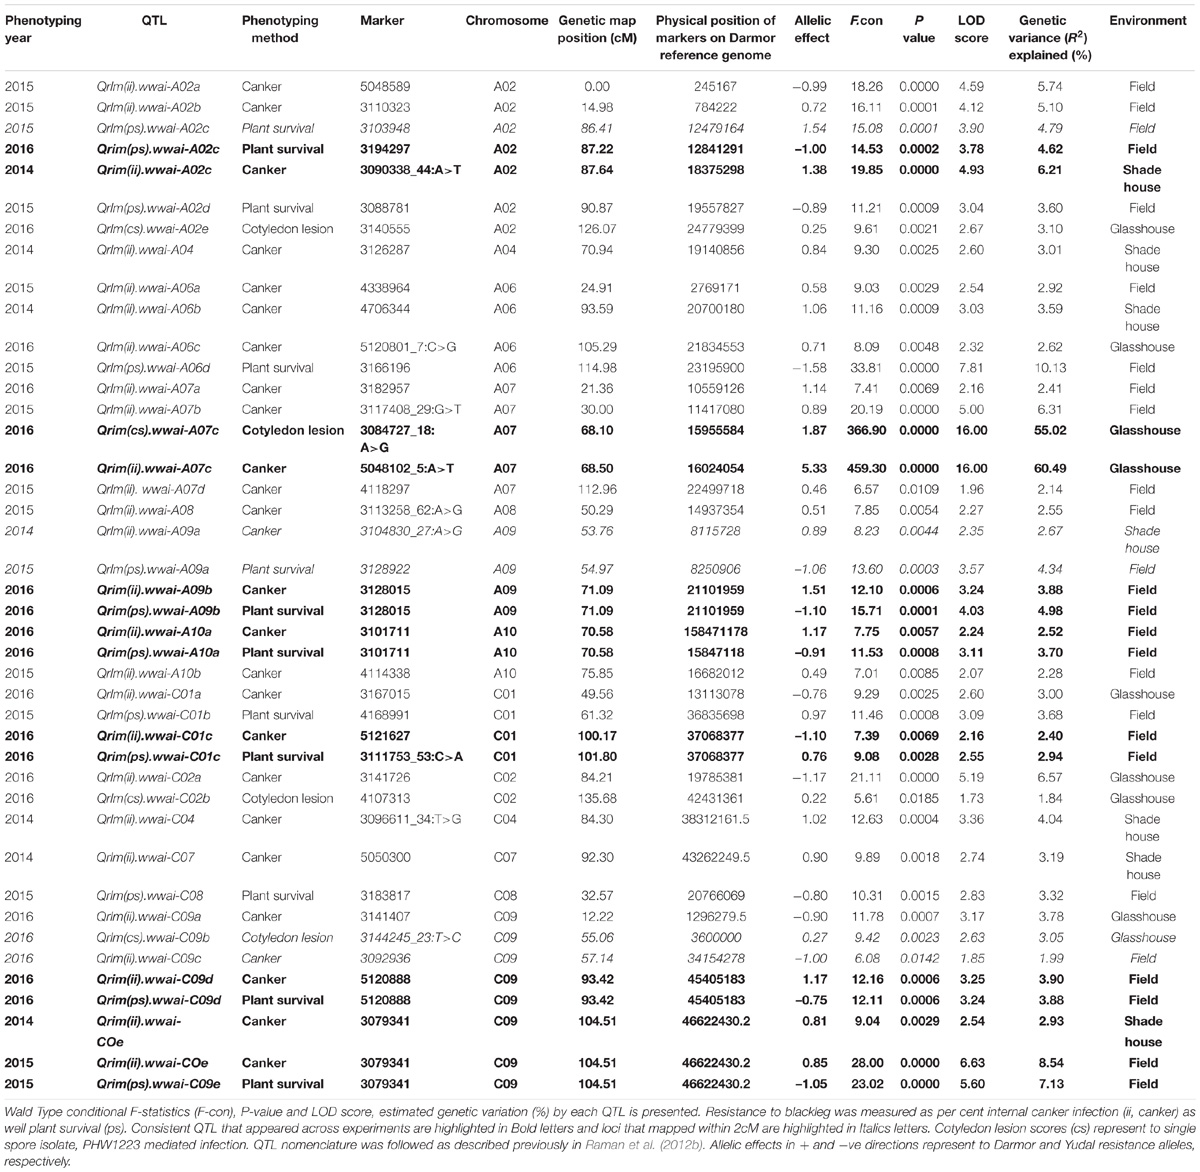
TABLE 2. Putative QTL for resistance to L. maculans evaluated under different environments.
Glasshouse Experiments
Distribution of scores obtained for 259 DH lines of DY population using PHW1223 isolate of L. maculans following randomized complete block design are shown in Supplementary Figure 1. We identified three QTL for resistance to L. maculans evaluated at cotyledonary stage, on chromosomes A02, A07 and C09 (LOD ≥ 2) accounting for 3.05–55% of genotypic variation (Table 2). In addition, a suggestive QTL with LOD score of 1.7 was also detected on C02. Of these, QTL; Qrlm(cs).wwai-A07c on chromosome A07 detected with DArTseq-SNP marker; 3084727_18:A>G explained the majority (87.33%) of the total genotypic variance (Supplementary Table 1). ‘Darmor-bzh’ contributed alleles for resistance at all three QTL regions. Since the QTL on A07 accounted for the largest R2, we binned the quantitative phenotypic data into two categories: resistant and susceptible based on the size of lesions on cotyledons (Figure 2A) as described previously (Raman et al., 2012a,b). 122 DH lines were resistant, and 134 lines were susceptible to isolate PHW1223 of L. maculans, suggesting that segregation of resistance and susceptibility conforms to monogenic ratio (χ2 = 0.56; P = 0.45). Using this binned data, a major gene for resistance could be mapped on chromosome A07 (Figure 3A). We deduced that Rlm9 gene control resistance in the DY population on the basis of avr gene profile of L. maculans isolate (AvrLm5, AvrLm6, AvrLm8, AvrLm9, LepR3), and is consistent with the previous study (Delourme et al., 2004). To verify whether disease expression for resistance is not as a result of experiment ‘escape,’ all resistant DH lines were inoculated with the D13 isolate carrying avrLm9. Resistant DH lines to PHW1223 showed susceptible reaction to this isolate. This confirmed that all resistant phenotypes were correct. When the inoculated seedlings of DH lines with isolate PHW1223 were raised to physiological maturity under glasshouse conditions at Wagga Wagga and subsequently evaluated for the extent of internal infection, five QTL were detected on chromosomes A06, A07, C01, C02 and C09, accounting for 2.62–60.49% of genetic variance (Table 2). At these genomic regions, allelic effects on A06 and A07 were contributed by ‘Darmor-bzh,’ while ‘Yudal’ contributed alleles for resistance at C01, C02, and C09. Among different genomic regions detected, the Qrlm(cs).wwai-A07c on A07 explained the largest R2 (60.49%) and corresponded to the Rlm9 location (Figure 4), suggesting that Rlm9 mediated resistance was expressed at the adult plant stage under glasshouse conditions.
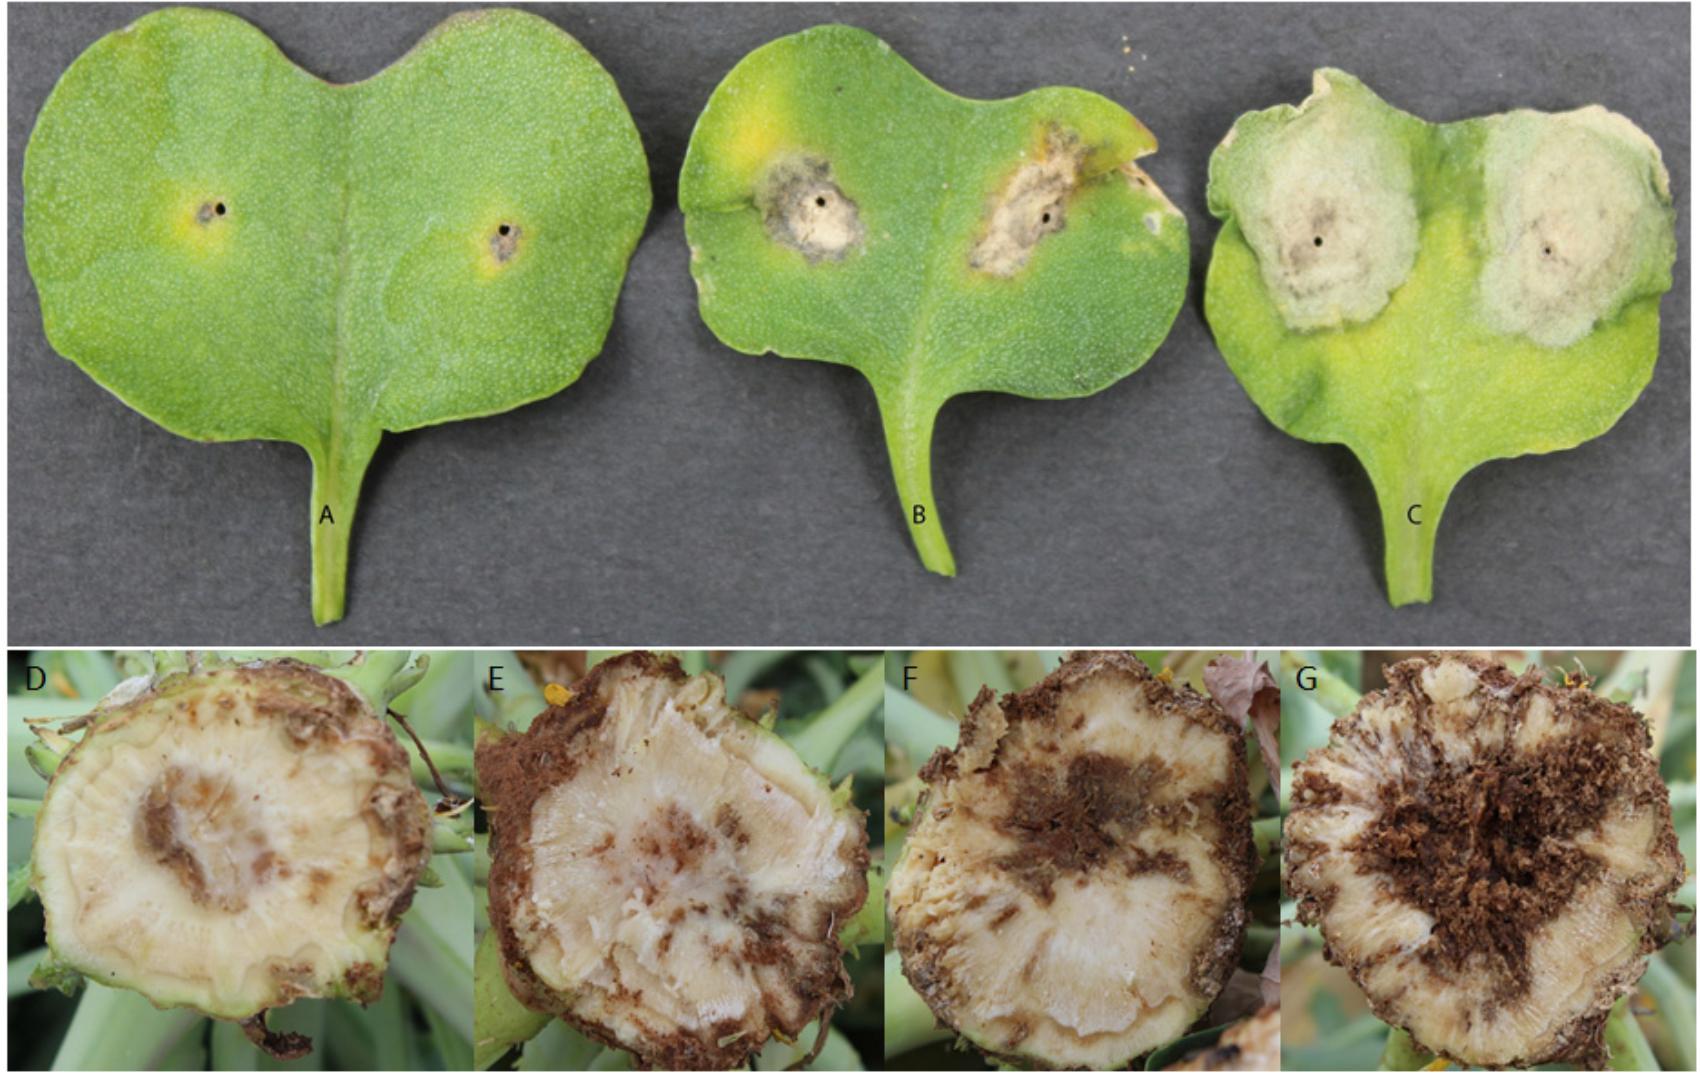
FIGURE 2. (A–C) Cotyledons of doubled haploid lines showing lesions upon inoculation with Leptosphaeria maculans isolate PHW1223. Symptoms were assessed after 20 days of infection. (A,B) resistant DH lines and (C) susceptible line. (D–G) Varying levels of internal infection among doubled haploid lines of Darmor-bzh/Yudal population assessed at the physiological maturity stage.
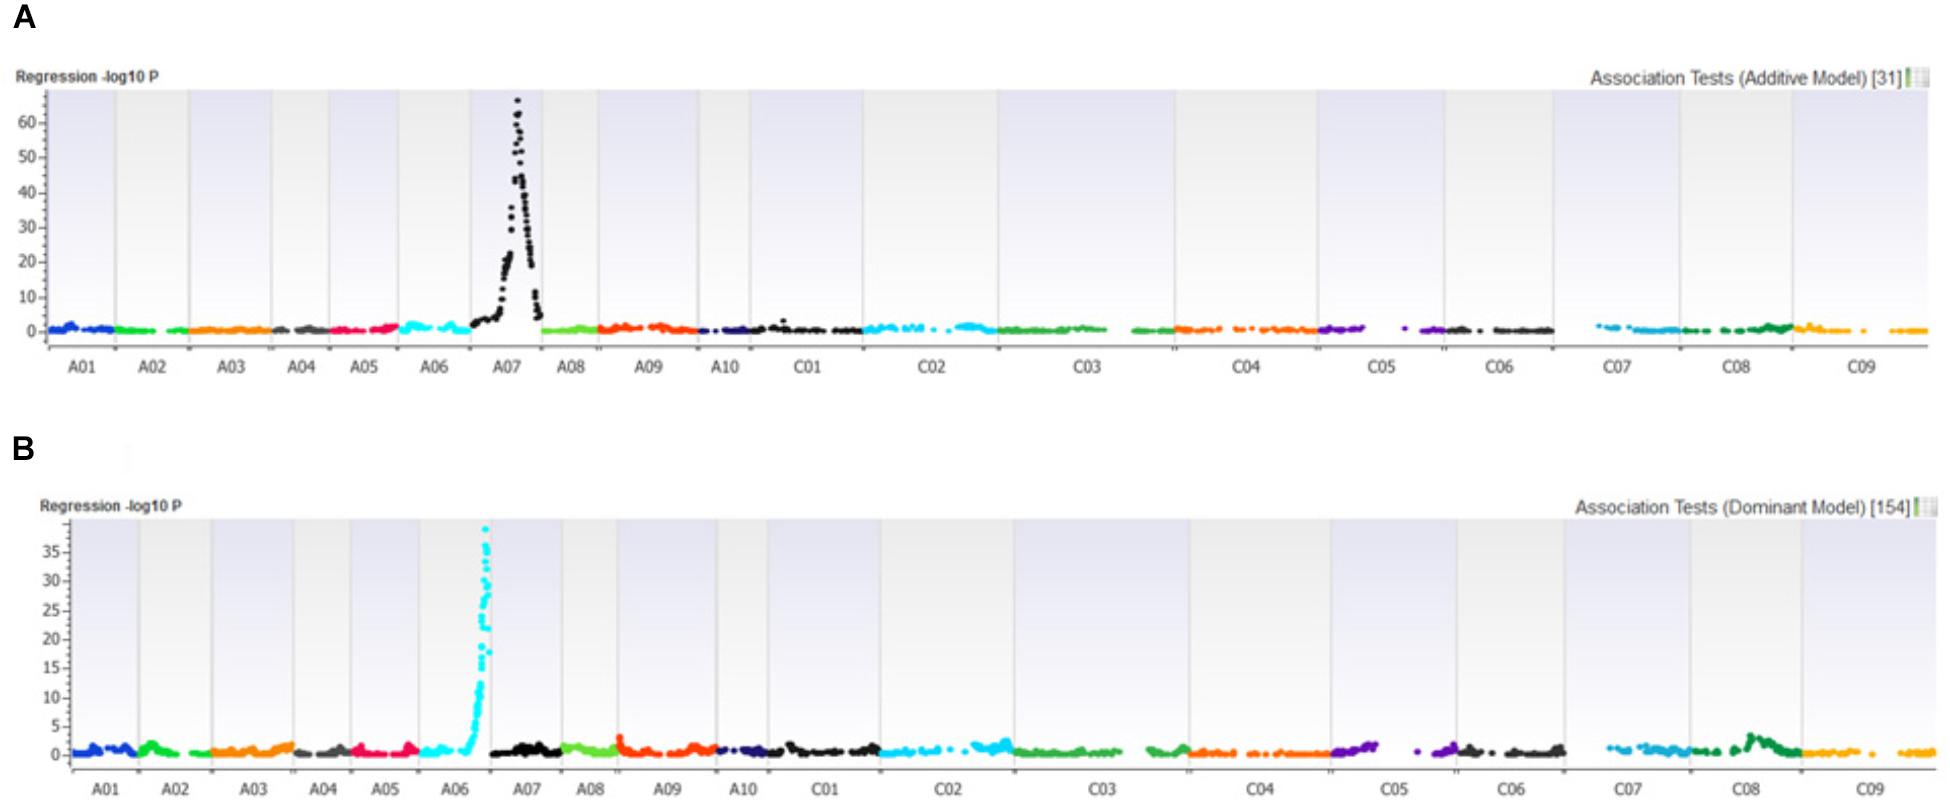
FIGURE 3. Manhattan plots showing association for (A) resistance to PHW1223 isolate of L. maculans assessed at the cotyledon stage after 20 days of inoculation, and (B) for dwarfness (bzh) in the Darmor-bzh/Yudal DH population.
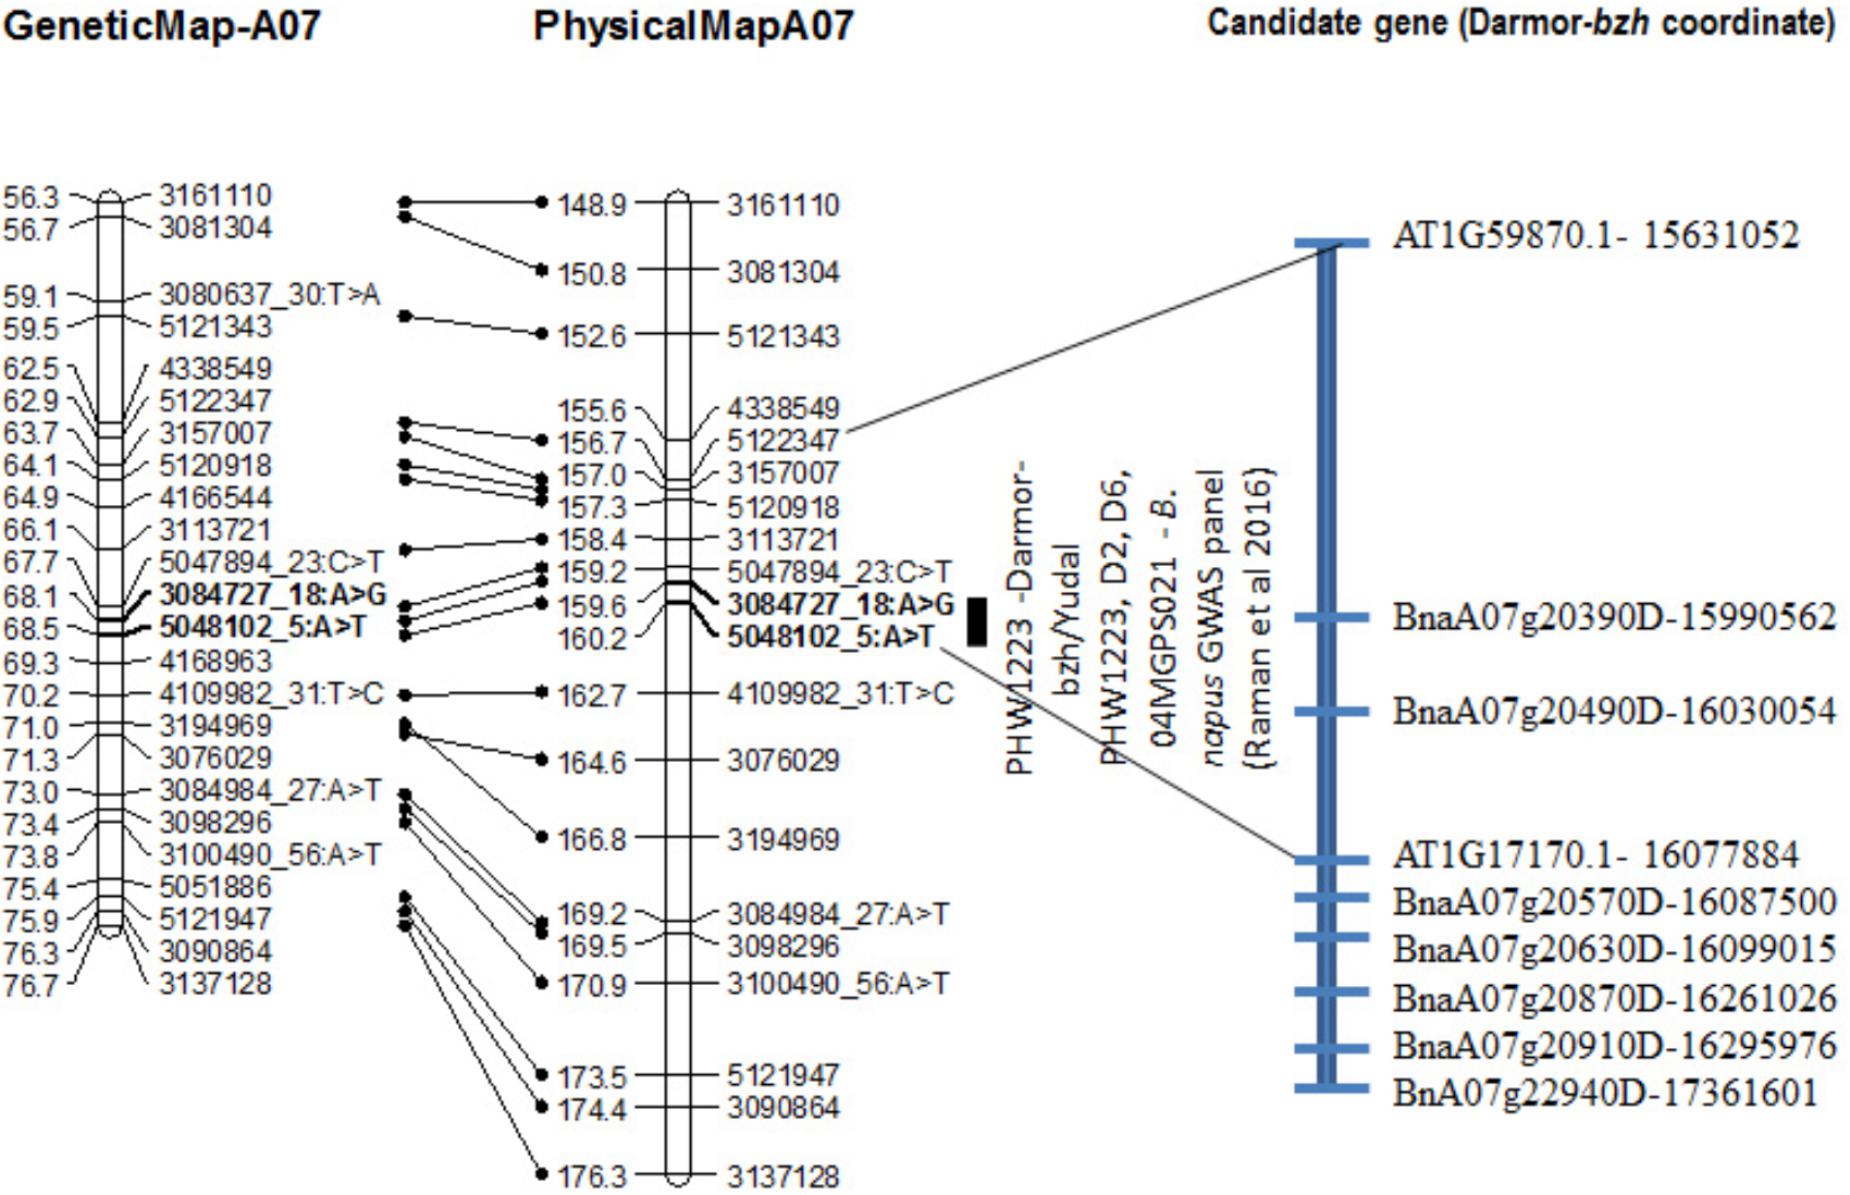
FIGURE 4. Genetic and physical localization of Rlm9 locus for resistance to L. maculans in a doubled haploid population from Darmor-bzh/Yudal. Physical map positions are based on the reference genome assembly of Darmor-bzh (Chalhoub et al., 2014). Markers that showed highly significant association with resistance to PHW1223 isolate (AvrLm9) at both seedling and adult plants stages are in bold letters. For clarity, both partial genetic (in cM) and physical maps of chromosome A07 are shown herein; physical locations are depicted as 1/100,000th from the original coordinates. For details, see Supplementary Table 3.
Ascospore Shower Test
Seven QTL were detected for internal infection under shade house conditions which were located on chromosomes A02, A04, A06, A09, C04, C07, and C09 (Table 2). These QTL accounted for 25.6% of total genotypic variation (R2) for internal infection; each QTL explained from 2.67% (on A09) to 6.21% (on A02) of the variation (Supplementary Table 1). The resistant parent, ‘Darmor-bzh’ contributed resistance alleles at all seven QTL regions. Of check cultivars, only ‘ThumperTT’ had less internal infection (0–10%) compared to other check cultivars; ATR-Marlin, ATR-Stingray, CB-Telfer, Crusher, and Hyola444.
Field Experiments
DH lines were evaluated for plant survival, internal infection and plant maturity (in 2015) across 2 years and showed continuous variation for resistance (Figure 1 and Supplementary Figure 2). Results on putative QTL and their allelic effects are presented in Table 2 and Supplementary Table 1. For plant survival, 11 QTL were detected on chromosomes A02, A06, A09, A10, C01, C08, and C09, explaining 2.94–10.13% of genotypic variance. The Qrlm(ps).wwai-A06d delimited with marker 3166196 on A06 accounted for the largest proportion (10.13%) of the variation. Across both experiments, at least one QTL flanked by DArTseq markers; 3194297–3088781 on chromosome A02 was detected repeatedly. Both parental lines, ‘Darmor-bzh’ and ‘Yudal’ contributed favorable alleles for resistance to L. maculans; ‘Darmor-bzh’ contributed alleles for resistance at A02, A06, A09, A10, C08, and C09, while ‘Yudal’ contributed resistance allele at QTL on chromosome C01 in 2015.
For internal infection, 14 QTL were detected on chromosomes A02, A06, A07, A08, A09, A10, C01, and C09 (Table 2). These QTL explained 1.99–8.54% of the genotypic variance. QTL delimited with 3079341 marker (LOD score = 6.63) accounted for the largest variation. In 2015, only maternal parent, ‘Darmor-bzh’ contributed favorable alleles for resistance whereas both parents of DH population contributed resistance alleles in 2016. Allelic effects contributed by ‘Yudal’ were only detected at two QTL on chromosomes C01 and C09.
Consistent QTL Across Phenotypic Environments
Taken together, of the 31 genomic regions for resistance to L. maculans identified, nine were consistently detected across different experiments on chromosomes A02, A07, A09, A10, C01, and C09; four QTL were common between internal infection and plant survival (on A02, A10, C01, and C09), three were common between two field experiments (on A02, A10, and C09) and two QTL were common between ascospore shower and field test (on chromosomes A02, and A09). Only one QTL on chromosome C09 was detected for resistance assessed by three phenotypic methods: plant survival, internal infection under field conditions and ‘ascospore’ shower test (Figure 5 and Table 2). None of the QTL significantly associated with internal infection and plant survival, assessed either using the ascospore shower or field tests colocalized with Rlm9.
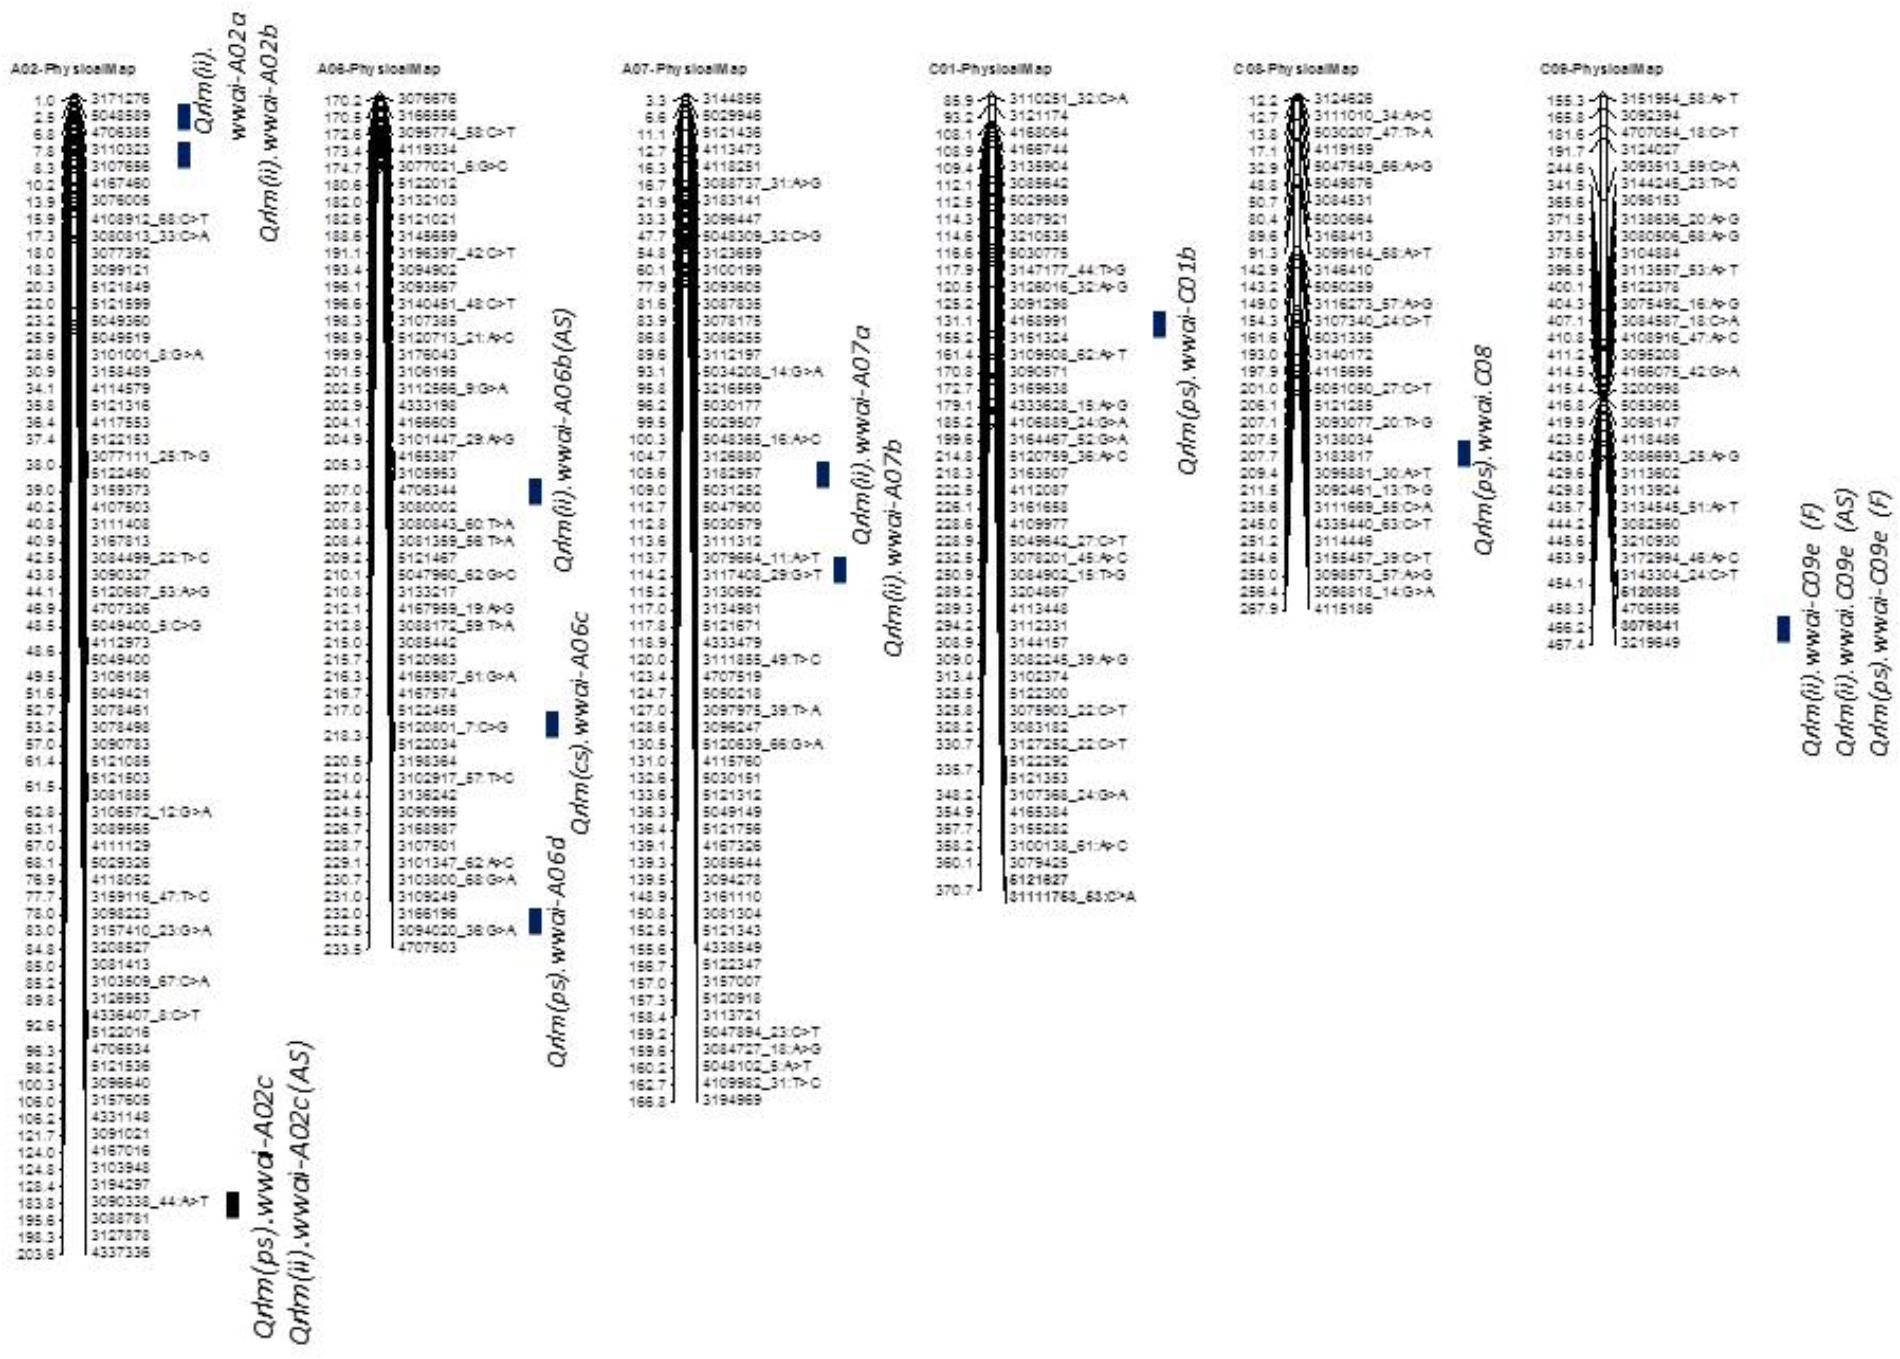
FIGURE 5. Localization of ‘stable’ QR loci for resistance to L. maculans on the physical map of B. napus cv. Darmor-bzh. QTL for QR were identified in a doubled haploid population derived from Darmor-bzh/Yudal. Resistance was tested as (i) internal infection under shadehouse conditions with ascospore shower test [2014-IF (AS)], (ii) internal infection under field conditions in 2015 and 2016 [2015/2016-IF (F)], and (iii) plant survival under field conditions in 2015 and 2016 [2015/2016-PS (F)]. Race-specific resistance was evaluated with a single spore isolate, PHW1223 of L. maculans. Only stable QTL that were detected for QR (this study and Kumar et al., 2018) are shown herein. Physical locations are depicted as 1/100,000th from the original coordinates.
Localization of Stable QR Loci to L. maculans Across Environments
To identify QR loci of global relevance, we compared QTL that were detected in the DYDH population for resistance evaluated under different phenotypic environments in France, United Kingdom, and Australia (Kumar et al., 2018), based on their physical map positions of QTL regions on the reference ‘Darmor-bzh’ genome assembly (Chalhoub et al., 2014). Physical coordinates that were mapped within ∼200 Kb were considered as consistent/stable; i.e., the same QTL across environments. A total of 8 genomic regions that were located on chromosomes A02, A06, A07, C01, C08, and C09, were repeatedly detected in different environments: Australia, France and/or United Kingdom (Supplementary Table 2). These QTL were unevenly distributed across the B. napus genome, two QTL on chromosome A02 and A06, and one each on chromosomes A07, C01, C02 and C09. Resistant alleles at QTL mapped on chromosome C01 in both Darmor-bzh/Yudal and Darmor-bzh/Bristol DH populations are contributed by the susceptible parent (Yudal or Bristol, Kumar et al., 2018), were also detected in our study (Supplementary Table 2).
Mapping of QTL for Plant Maturity
In order to establish whether there was any link between plant maturity and resistance to L. maculans, we phenotyped the DYDH population for plant maturity in the 2015 trial using BBCH scoring system. Our results showed that DH lines display a continuous variation in plant maturity (Supplementary Figure 2), implying its quantitative inheritance. Seven putative QTL were detected for plant maturity on chromosomes A02, A06, C01, C02, C06, and C09, accounting for the total of 57.60% of R2 (Supplementary Table 1). The QTL on C09 (LOD = 12.7) explained the largest proportion (16.49%, >30%) of the total variation, followed by QTL on C02. Both the parents of DH population accounted for genotypic variation in plant maturity; ‘Darmor-bzh’ alleles accounted for late maturity at QTL on A02, A06, C02, and C09 chromosomes, while early maturity alleles at QTL on A06, C01, and C06 were contributed by parent, ‘Yudal.’ Three significant QTL associated with plant maturity were located near the QR loci on A02, A06, and C09, suggesting that these genomic regions may have a pleiotropic effect on QTL for QR (Supplementary Table 1).
Mapping of Bzh Gene for Dwarfness
In order to establish whether there was any relationship between plant height (dwarfness due to bzh) and QR loci to L. maculans, we conducted molecular screening for bzh gene using gene specific PCR based markers (Foisset et al., 1995). Of 148 DH lines tested, 79 had 439 bp allele specific for dwarfness (Darmor-bzh type) and 69 lines had 528 bp allele for non-bzh (Yudal type) (Supplementary Figure 3). Chi squared test revealed that the allelic segregation was not significantly different from 1:1 ratio (χ2 = 0.676; P = 0.4111). This is consistent with ‘Darmor-bzh’ and DH progeny from the Darmor-bzh/Yudal having bzh gene. Linkage analysis reconfirmed that bzh marker was indeed mapped on A06, consistent with chromosomal location of the bzh gene (Foisset et al., 1995). PCR marker showed tight linkage with 3103800_68:G > A (LOD = 38.97) and 3101347_62:A > C (LOD = 36.19) markers which were mapped on chromosome A06 (Figure 3B). Alignment between DArTseq marker sequences linked with bzh, and the genome sequences of Darmor-bzh showed that bzh locus is inferred to reside within a region of 22.9 Mb on A06. One of the QTL for plant maturity was mapped close (34.5 kb) to the bzh genomic region. In addition, one QTL associated with plant survival (in the 2015 trial) was also located within 121 Kb from bzh gene. Location of QTL for plant dwarfness, physiological plant maturity and QR at A06 region delimited with 22.8–23.1 Mb coordinates on the Darmor-bzh genome further hints toward the possible role of plant developmental genes in blackleg resistance in canola (Raman H. et al., 2016).
Physical Mapping and Identification of Candidate Genes Underlying QR and Rlm9
Release of the reference genome assembly of cv. Darmor-bzh (Chalhoub et al., 2014) enabled us to identify location of trait marker associations on the physical map of canola, representing both A and C subgenomes (Supplementary Table 3). The current annotation of the ‘Darmor-bzh’ reference genome assembly (v4.0) predicted at least five B. napus R genes, which were mapped within 100 Kb from ten significant marker-trait associations that were detected in the DYDH population, evaluated using ascospore shower test (2014), internal infection and disease severity, and plant survival (2015) (Supplementary Table 3). Predicted R genes in the vicinity of QR loci included BnaA02g015160D (A02), BnaA020120D (A02), BnaA07g04380D (A07), BnaA09g14320D (A09), BnaC09g02130D (C09), and BnaC09g06020D (C09), BnaC09g44520D (C09) having TIR - NBS – LRR (Chalhoub et al., 2014; Alamery et al., 2018). Two marker associations detected in the 2016 glasshouse (PHW1223 isolate) and 2015 field experiment (plant survival) were mapped within 6 Kb from resistance genes (Supplementary Table 3). DArTseq marker 3141726 (A09) was localized 2.94 Kb from a homolog of AT1G54470.2 which is involved in resistance to several isolates of Peronospora parasitica causing downy mildew resistance, while marker 3128922 (C02) was localized within 5.8 Kb from B. napus resistance gene BnaA09g14420D, having TIR - NBS - LRR motif (Alamery et al., 2018). In addition, LRR and NB-ARC domains-containing disease resistance protein gene (AT1G61180.2) was located ∼102 Kb from the QTL for internal infection (ascospore shower test) on chromosome C04.
The Rlm9 locus was localized at the coordinates 15,955,583–16,024,053 bp (Figure 4) of the ‘Darmor-bzh’ genome assembly on chromosome A07 and mapped in the vicinity of BnaA07g20390D and BnaA07g20490D. Several genes implicated in disease resistance such as BnaA07g20630D (AT1G78290.2, Protein kinase superfamily protein), BnaA07g20870D (AT1G77700.1, Pathogenesis-related thaumatin superfamily protein) and BnaA07g20910D (AT1G21870.1, golgi nucleotide sugar transporter 5) and BnA07g22940D were located near Rlm9.
Discussion
Multiple Genes Control QR in the DY Population
Our results first confirm that ‘Darmor’ QR is effective in Australian conditions, despite the composition of L. maculans population is different from the one in Europe (Light et al., 2011; Rouxel and Balesdent, 2017), thus confirming the broad-spectrum of this resistance. Continuous segregation for resistance to L. maculans was observed among DH lines assessed on the basis of disease severity (plant survival and internal infection). High H2 values for field trials are comparable with those recently reported in ‘Darmor-bzh/Yudal’ population (Kumar et al., 2018) for QR, which implied that observed variation in resistance is highly heritable in different conditions such as the blackleg nurseries under field conditions across years as well as in ascospore shower test. Therefore, genetic gain could be made for QR to blackleg in canola improvement programs. There were lower H2 and accuracy values for ‘ascospore shower’ test as compared to field experiments (Table 1). This could be due to the G × E interactions and inoculation method. It is mentioned that we inoculated DH lines with ascospore shower test initially, and once the symptoms appeared on susceptible check cultivars and on some of the DY lines, plants were then vernalised under cold conditions (4°C for 11–12 weeks). Such conditions may have also partly contributed to G × E interactions. We identified a total of 27 QTL associated with quantitative resistance to L. maculans under shade house and field conditions, which were distributed on 12 chromosomes, except on A01, A03, A05, C03, C05, and C06 (Table 2). These observations confirmed that quantitative resistance to blackleg is due to multiple genes distributed across genome.
Stable QTL for QR Across Environments
We detected 15 significant QTL (LOD score ≥ 3.0) for QR across different experiments. At least four genomic regions on A02, A09, A10, and C09 were repeatedly detected for resistance evaluated as internal infection and plant survival under field/ascospore test, suggesting that some resistance mechanisms are consistently expressed across environments. However, we also found that detection of QTL and their magnitudes were highly dependent upon phenotyping environment. For example, of 13 QTL detected for internal infection, only one appeared repeatedly across 2 years. This could be attributed to several environmental factors which may have influenced the expression and intensity of L. maculans under field conditions. In addition, a range of r2 values, 36.6–66.1% were accounted for by QTL (Kumar et al., 2018), whereas such values ranged from 20.1 to 37.9% in our study. Such discrepancy could also be due to growing environment and G × E interactions.
In an independent study, Kumar et al. (2018) reported 16 QTL for resistance in this population on 15 chromosomes but not on A10, C02, C03, and C05. In both described studies, there was no evidence of QR loci on chromosome C03 and C05. In order to identify loci for QR relevant internationally, we compared the physical location of QTL (significant marker associations/confidence marker intervals) that were detected in this and previous studies. A total of 8 genomic regions that were located on chromosomes A02, A06, A07, C01, C02, and C09 were repeatedly detected in different environments: Australia, France, and United Kingdom. On chromosome A10, we identified two genomic regions, one within 1.42 Mb from BnaA10g24700D gene for resistance to LepR3/Rlm2 complex, and second near the BnaA10g25550D (Darmor coordinates 16,682,012 bp). Both QTL were not detected in Darmor-bzh/Yudal population in France (Kumar et al., 2018) or United Kingdom (Huang et al., 2016) conditions. Discrepancy in detecting QTL could be attributed to the method used for QTL identification in different studies as well as phenotypic environments. However, many of the putative QTL identified in this study are in similar positions to those reported earlier (Huang et al., 2016; Kumar et al., 2018). An example is the stable QTL reported on A02. Another putative QTL identified in this study on C01 for a number of trials and trait combinations may also be of interest to canola breeding programs as it appears in one of the trials (RREs08) reported by Huang et al. (2016). We found that the majority of favorable alleles for resistance were contributed by ‘Darmor-bzh’ at QR loci, while only two QTL on chromosomes C01 and C09 were detected in ‘Yudal.’ Our results are consistent with Kumar et al. (2018) who reported resistance alleles from ‘Yudal’ on A01, A03, and C01. Though in our study, no QTL for quantitative resistance was identified on A01 and A03 in the Darmor-bzh/Yudal DH population, QTL for resistance to L. maculans on chromosome A01 have been reported previously in the Skipton/Ag-Spectrum, Ag-Castle/Topas, Damor-bzh/Yudal and diversity panels of B. napus (Raman et al., 2012b; Raman H. et al., 2016; Larkan et al., 2016a; Kumar et al., 2018) Further research is required to fine map these loci to understand their structure, function and evolution.
It was interesting to note that despite non-vernalisation of DH lines derived from winter (‘Darmor-bzh’) and spring (‘Yudal’) cross and limited plant growth in 56 well tray having 35 × 35 × 35 mm dimension (length, width, and height) cells, several QTL for internal infection were detected at the vegetative stage, however, none of them was consistently detected under field conditions (after 28 weeks of sowing). It remains to be established how far G × E interaction plays a role in differential expression for QR under field and glasshouse conditions.
QR Locations vs. QTL Associated With Plant Maturity and Plant Height
A major QTL for QR explaining 10.13% of total genetic variance on A06 was located near the genomic region that showed significant association with maturity (∼322 Kb) and dwarfness (∼121 Kb). The second ‘major’ QTL for QR was mapped on chromosome C09 and was also located near the genomic position of plant maturity QTL, accounting for 16.5% of total variance. These findings suggested that QR may be partly conditioned by plant developmental genes as suggested previously (Raman H. et al., 2016). In previous studies, QTL for QR have been mapped near the bzh locus for dwarfness on chromosome A06 under French (INRA 96 trial) and United Kingdom field (RRes09) conditions (Pilet et al., 1998; Huang et al., 2016).
QR Genes May Correspond to ‘Weak’ Expression of R Genes
None of L. maculans R genes either cloned (LepR3/Rlm2) or mapped on the reference Darmor-bzh genome assembly (Larkan et al., 2013, 2015, 2016b; Raman H. et al., 2016), were located within 200 Kb of QR loci. However, several QR loci with moderate to small allelic effects were localized in the vicinity of possible qualitative R genes. Our results showed that at least 8 QR loci identified in ascospore shower test and field conditions for plant survival and internal infection do map within 1.9–167.2 Kb (Supplementary Table 3) from the genomic regions detected from cotyledon tests with single spore isolates (IBCN17, IBCN18, IBCN75, and PHW1223) on chromosomes A06 and C09 in our previous study (Raman H. et al., 2016). C09 QTL (coordinate 46,622,430) for QR detected with ascospore shower test, internal infection and plant survival was mapped 24.1 Kb apart from the genomic region identified with cotyledon tests using IBCN17 and PHW1223 isolates in a B. napus GWAS panel. Another C09 QTL (coordinate 45405183) for QR detected in field for plant survival and internal infection was mapped within 1.9 Kb from the genomic region identified with IBCN75 isolate in the same GWAS panel. A suite of five SNP markers (4113953|F| 0-39:C > T, 3098403|F| 0-41:C > A, 100061301|F| 0-62:A > G, 3099981|F| 0-28:G > T, 3168084|F| 0-9:G > A) associated with internal infection on A06 were detected within 187.1 Kb from the genomic region detected with ascospore shower test (ATR-Cobbler) as well as with cotyledon test using isolate, PHW1223 in the GWAS panel (Raman H. et al., 2016). Colocalization of genomic regions detected with ascospore shower, plant survival, internal infection and single spore isolates suggests that QR resistance to L. maculans may be partly conditioned by R genes which may have residual effect, or by other genes linked to R genes (Chantret et al., 1999; Delourme et al., 2004). This hypothesis is only partly supported by our glasshouse experiment, where we challenged the DY lines with a single spore isolate PHW1223 and assessed resistance at the cotyledon and adult plants stages. We detected three QTL for resistance to L. maculans on chromosome A02, A07 and C09 using quantitative lesion scores on cotyledon. Only one QTL detected on C09 genomic regions with single spore isolate PHW1223 showed significant association with resistance to L. maculans under field conditions but resistant allele was not contributed by the same parent. Thus whether this C09 QTL region is also involved in QR remains unclear.
A quantitative trait locus from the glasshouse experiment mapped on A07 corresponds to Rlm9. Physical location of Rlm9 gene in the ‘DYDH’ population is consistent with the one in BC1F1 derived population between Rlm9-introgression line/Topas (Larkan et al., 2016b). The efficacy of Rlm9 was assessed in the field as well as under glasshouse conditions. Rlm9 did not provide any resistance to L. maculans in the field, suggesting that virulent races (avrLm9) attacking Rlm9 were present in our Australian field conditions (Light et al., 2011). However, when the efficacy of Rlm9 (assessed at cotyledon stage) was tested at the adult plant stage under glasshouse conditions, Rlm9 conferred complete resistance. These results imply that Rlm9 gene indeed confers resistance at the adult plant stage provided there is corresponding AvrLm9 gene present in L. maculans. Our results are consistent with the previous genetic analyses studies which showed that the R gene mediated resistance expressed at the cotyledon stage is also effective at the adult plant stages in B. napus populations, grown under controlled/field environment conditions in the presence of specific corresponding Avr gene (Delourme et al., 2004; Raman et al., 2012a,b). However, we found that other significant QTL (e.g., C02 and C09) account for QR in the DY population, besides the Rlm9 gene on chromosome A07. This is not fully consistent with single gene for gene interaction. It is possible that other uncharacterized Avr genes (and/or interaction) may exist in the differential set of Australian L. maculans isolates which are not identified yet and which are ‘poorly’ recognized by the plant. In a previous study, Delourme et al. (2004) identified two QTL for resistance to L. maculans isolate, IBCN56 (AvrLm1, AvrLm2, AvrLm3, AvrLm5, AvrLm6, AvrLm9) in ‘Darmor-bzh/Yudal’ population: a major QTL was mapped on LG10 (A07) corresponding to Rlm9 and a minor QTL on LG16 (A10, R2 = 9%) at a position corresponding to Rlm2/LepR3 (Delourme et al., 2004). The later region also showed association with resistance at the adult plant stage (Pilet et al., 2001). In this study, we did not find any evidence for QTL associated with resistance at the seedling (cotyledon) stage on A10 using PHW1223 isolate (AvrLm5, AvrLm6, AvrLm8, AvrLm9, LepR3). However, we identified QTL for internal infection and plant survival on A10 which was mapped 1.4 Mb part from LepR3/Rlm2 genes, as in Pilet et al. (2001).
Expressions of weak gene/partial resistance could also be due to the growing environment. For example, we reported a significant QTL on chromosome A01 for blackleg resistance in the Skipton/Ag-Spectrum DH population (Raman et al., 2012b), which was later on validated in the Skipton/Ag-Spectrum//Skipton as well as in B. napus diversity panels as having a major allelic effect (Raman et al., 2012b; Larkan et al., 2016a; Raman H. et al., 2016). It remains to be established whether some R genes for L. maculans resistance which do not express or partially express at the seedling stage, become more effective at the adult plant stage, as shown in Cf-9B/L. system (Panter et al., 2002).
Putative Candidate Genes for Resistance Loci
Physical localization of R genes from A. thaliana, and B. napus in the vicinity of significant trait-marker association suggested that these genomic regions may be associated with defense related genes. For examples, B. napus R genes such as BnaA02g25160D with CC – NBS – LRR domain, BnaA02g36900D with TIR domain, BnaA09g14320D, BnaC09g06020D and BnaC09g44520D with TIR – NBS – LRR domains and A. thaliana R genes such as AT2G05940.1 (RPM1-INDUCED PROTEIN KINASE) which encodes a receptor-like cytoplasmic kinase that phosphorylates the host target RIN4, leading to the activation of a plant innate immune receptor RPM1, were detected within 200Kb from significant SNP associations. AT1G56510.1 (BnaC09g06020D) is reported to confer resistance to races of Albugo candida. The TIR, NBS, LRR, protein kinase proteins are well known to confer disease resistance in plants (Césari et al., 2014).
Recently, several transcripts involved in L. maculans infection in resistant and susceptible lines were identified in B. napus lines upon infection with L. maculans, at the cotyledonary stage (Becker et al., 2017). We compared the physical position of those genes with the genomic regions associated with resistance in DY population. We found two genes, BnaA07g32130D and BnaC01g36910D within 200 Kb from the transcripts which are shown to be accumulated upon infection with L. maculans (Becker et al., 2017). The BnaA07g32130D (PDF1.2) gene model relates to the A. thaliana gene (AT5G44420.1) and belongs to the plant defensin (PDF) family and encodes an ethylene- and jasmonate-responsive plant defensin, while the BnaC01g36910D was mapped within 100 Kb from a significant QTL for field canker and survival on C01.
Strategies to Incorporate Into Breeding Programs
Various breeding programs prefer to introgress qualitative and quantitative resistance genes with major allelic effects to L. maculans. In this study, we found eight significant QTL regions for QR on A02, A07, A09, A10, C01, and C09 which were detected across diverse growing environments: Australia, France, and United Kingdom. Almost all QTL had small allelic effects and accounted for less than 10% of the genotypic variance individually. Some of the allelic effects have been validated in DH populations derived from ‘Darmor-bzh/Bristol’ and ‘Darmor/Samourai’ and diversity panels. Therefore, these validated and stable loci can be introgressed for enhancing QR in elite canola germplasm via molecular marker assays such as KASP and sequence capture probes. Given that QR is difficult to select and confounded with environmental factors, genomic selection could be performed while also targeting loci associated with high grain yield, flowering time and tolerance to water and nutrient stress in the canola improvement programs.
Author Contributions
HR and RR planned the experiments and wrote the manuscript. RD and SD edited the manuscript. DB, SM, and PS carried-out ascospore shower test at Horsham. HR, RR, and YQ carried out single spore and field experiments. HR and RR scored all field, glasshouse, and CE trials. SD and HR performed genetic/QTL analyses. BM screened the marker for bzh in the DY population. All authors read and commented on manuscript.
Funding
This work was supported by joint research investment under the projects, DAN00117 and DAN00208 by the Grains Research and Development Corporation, NSW DPI, DEDJTR and UWA.
Conflict of Interest Statement
The authors declare that the research was conducted in the absence of any commercial or financial relationships that could be construed as a potential conflict of interest.
Acknowledgments
We would like to thank Chris Fuller and Dean McCallum, Technical Assistants from NSW DPI, for sowing field trials. We are also grateful to BrACySol Biological Resource Center (INRA Ploudaniel, France) for providing the seeds of DY population used in this study.
Supplementary Material
The Supplementary Material for this article can be found online at: https://www.frontiersin.org/articles/10.3389/fpls.2018.01622/full#supplementary-material
References
Alamery, S., Tirnaz, S., Bayer, P., Tollenaere, R., Chaloub, B., Edwards, D., et al. (2018). Genome-wide identification and comparative analysis of NBS-LRR resistance genes in Brassica napus. Crop Pasture Sci. 69, 72–93. doi: 10.1071/CP17214
Barret, P., Delourme, R., Foisset, N., and Renard, M. (1998). Development of a SCAR (sequence characterised amplified region) marker for molecular tagging of the dwarf BREIZH (Bzh) gene in Brassica napus L. Theor. Appl. Genet. 97, 828–833. doi: 10.1007/s001220050962
Becker, M. G., Zhang, X., Walker, P. L., Wan, J. C., Millar, J. L., Khan, D., et al. (2017). Transcriptome analysis of the Brassica napus–Leptosphaeria maculans pathosystem identifies receptor, signaling and structural genes underlying plant resistance. Plant J. 90, 573–586. doi: 10.1111/tpj.13514
Brun, H., Chevre, A. M., Fitt, B. D. L., Powers, S., Besnard, A. L., Ermel, M., et al. (2010). Quantitative resistance increases the durability of qualitative resistance to Leptosphaeria maculans in Brassica napus. New Phytol. 185, 285–299. doi: 10.1111/j.1469-8137.2009.03049.x
Butler, D. (2016). Pedicure: Pedigree Tools. Available at: www.asreml.org
Butler, D. G., Cullis, B. R., Gilmour, A. R., and Gogel, B. J. (2009). ASReml-R Reference manual. Release 3.0.. Available at: http://www.vsni.co.uk/downloads/asreml/release2/doc/asreml-R.pdf
Césari, S., Kanzaki, H., Fujiwara, T., Bernoux, M., Chalvon, V., Kawano, Y., et al. (2014). The NB-LRR proteins RGA4 and RGA5 interact functionally and physically to confer disease resistance. EMBO J. 33, 1941–1959. doi: 10.15252/embj.201487923
Chalhoub, B., Denoeud, F., Liu, S., Parkin, I. A. P., Tang, H., Wang, X., et al. (2014). Early allopolyploid evolution in the post-neolithic Brassica napus oilseed genome. Science 345, 950–953. doi: 10.1126/science.1260782
Chantret, N., Pavoine, M. T., and Doussinault, G. (1999). The race-specific resistance gene to powdery mildew, MlRE, has a residual effect on adult plant resistance of winter wheat line RE714. Phytopathology 89, 533–539. doi: 10.1094/PHYTO.1999.89.7.533
Delourme, R., Bousset, L., Ermel, M., Duffe, P., Besnard, A. L., Marquer, B., et al. (2014). Quantitative resistance affects the speed of frequency increase but not the diversity of the virulence alleles overcoming a major resistance gene to Leptosphaeria maculans in oilseed rape. Infect. Genet. Evol. 27, 490–499. doi: 10.1016/j.meegid.2013.12.019
Delourme, R., Chevre, A. M., Brun, H., Rouxel, T., Balesdent, M. H., Dias, J. S., et al. (2006a). Major gene and polygenic resistance to Leptosphaeria maculans in oilseed rape (Brassica napus). Eur. J. Plant Pathol. 114, 41–52. doi: 10.1007/s10658-005-2108-9
Delourme, R., Falentin, C., Huteau, V., Clouet, V., Horvais, R., Gandon, B., et al. (2006b). Genetic control of oil content in oilseed rape (Brassica napus L.). Theor. Appl. Genet. 113, 1331–1345. doi: 10.1007/s00122-006-0386-z
Delourme, R., Piel, N., Horvais, R., Pouilly, N., Domin, C., Vallée, P., et al. (2008). Molecular and phenotypic characterization of near isogenic lines at QTL for quantitative resistance to Leptosphaeria maculans in oilseed rape (Brassica napus L.). Theor. Appl. Genet. 117, 1055–1067. doi: 10.1007/s00122-008-0844-x
Delourme, R., Pilet-Nayel, M. L., Archipiano, M., Horvais, R., Tanguy, X., Rouxel, T., et al. (2004). A cluster of major specific resistance genes to Leptosphaeria maculans in Brassica napus. Phytopathology 94, 578–583. doi: 10.1094/PHYTO.2004.94.6.578
Fitt, B., Brun, H., Barbetti, M., and Rimmer, S. (2006). World-wide importance of phoma stem canker (Leptosphaeria maculans and L. biglobosa) on oilseed rape (Brassica napus). Eur. J. Plant Pathol. 114, 3–15. doi: 10.1007/s10658-005-2233-5
Foisset, N., Delourme, R., Barret, P., and Renard, M. (1995). Molecular tagging of the dwarf BREIZH (Bzh) gene in Brassica napus. Theor. Appl. Genet. 91, 756–761. doi: 10.1007/BF00220955
Foisset, N., Delourme, R., Lucas, M.-O., and Renard, M. (1996). In vitro androgenesis and segregation distortion in Brassica napus L.: spontaneous versus colchicine-doubled lines. Plant Cell Rep. 16, 464–468. doi: 10.1007/BF01092767
Fopa Fomeju, B., Falentin, C., Lassalle, G., Manzanares-Dauleux, M. J., and Delourme, R. (2014). Homoeologous duplicated regions are involved in quantitative resistance of Brassica napus to stem canker. BMC Genomics 15:498. doi: 10.1186/1471-2164-15-498
Huang, Y. J., Jestin, C., Welham, S. J., King, G. J., Manzanares-Dauleux, M. J., Fitt, B. D. L., et al. (2016). Identification of environmentally stable QTL for resistance against Leptosphaeria maculans in oilseed rape (Brassica napus). Theor. Appl. Genet. 129, 169–180. doi: 10.1007/s00122-015-2620-z
Huang, Y. J., Pirie, E. J., Evans, N., Delourme, R., King, G. J., and Fitt, B. D. L. (2009). Quantitative resistance to symptomless growth of Leptosphaeria maculans (phoma stem canker) in Brassica napus (oilseed rape). Plant Pathol. 58, 314–323. doi: 10.1111/j.1365-3059.2008.01957.x
Jestin, C., Bardol, N., Lodé, M., Duffé, P., Domin, C., Vallée, P., et al. (2015). Connected populations for detecting quantitative resistance factors to phoma stem canker in oilseed rape (Brassica napus L.). Mol. Breed. 35:167. doi: 10.1007/s11032-015-0356-8
Jestin, C., Lodé, M., Vallée, P., Domin, C., Falentin, C., Horvais, R., et al. (2011). Association mapping of quantitative resistance for Leptosphaeria maculans in oilseed rape (Brassica napus L.). Mol. Breed. 27, 271–287. doi: 10.1007/s11032-010-9429-x
Jestin, C., Vallée, P., Domin, C., Manzanares-Dauleux, M. J., and Delourme, R. (2012). Assessment of a new strategy for selective phenotyping applied to complex traits in Brassica napus. Open J. Genet. 2, 190–201. doi: 10.4236/ojgen.2012.24025
Kaur, S., Cogan, N. O. I., Ye, G., Baillie, R. C., Hand, M. L., Ling, A. E., et al. (2009). Genetic map construction and QTL mapping of resistance to blackleg (Leptosphaeria maculans) disease in Australian canola (Brassica napus L.) cultivars. Theor. Appl. Genet. 120, 71–83. doi: 10.1007/s00122-009-1160-9
Koch, E., Song, K., Osborn, T. C., and Williams, P. H. (1991). Relationship between pathogenicity based on restriction fragment length polymorphism in Leptosphaeria maculans. Mol. Plant Microbe Interact. 4, 341–349. doi: 10.1094/MPMI-4-341
Kumar, V., Paillard, S., Fopa-Fomeju, B., Falentin, C., Deniot, G., Baron, C., et al. (2018). Multi-year linkage and association mapping confirm the high number of genomic regions involved in oilseed rape quantitative resistance to blackleg. Theor. Appl. Genet. 131, 1627–1643. doi: 10.1007/s00122-018-3103-9
Larkan, N. J., Lydiate, D. J., Parkin, I. A. P., Nelson, M. N., Epp, D. J., Cowling, W. A., et al. (2013). The Brassica napus blackleg resistance gene LepR3 encodes a receptor-like protein triggered by the Leptosphaeria maculans effector AvrLM1. New Phytol. 197, 595–605. doi: 10.1111/nph.12043
Larkan, N. J., Ma, L., and Borhan, M. H. (2015). The Brassica napus receptor-like protein RLM2 is encoded by a second allele of the LepR3/Rlm2 blackleg resistance locus. Plant Biotechnol. J. 13, 983–992. doi: 10.1111/pbi.12341
Larkan, N. J., Raman, H., Lydiate, D. J., Robinson, S. J., Yu, F., Barbulescu, D. M., et al. (2016a). Multi-environment QTL studies suggest a role for cysteine-rich protein kinase genes in quantitative resistance to blackleg disease in Brassica napus. BMC Plant Biol. 16:183. doi: 10.1186/s12870-016-0877-2
Larkan, N. J., Yu, F., Lydiate, D. J., Rimmer, S. R., and Borhan, M. H. (2016b). Single R gene introgression lines for accurate dissection of the brassica - leptosphaeria pathosystem. Front. Plant Sci. 7:1771. doi: 10.3389/fpls.2016.01771
Light, K. A., Gororo, N. N., and Salisbury, P. A. (2011). Usefulness of winter canola (Brassica napus) race-specific resistance genes against blackleg (causal agent Leptosphaeria maculans) in southern Australian growing conditions. Crop Pasture Sci. 62, 162–168. doi: 10.1071/CP10187
Marcroft, S. J., van De Wouw, A., Salisbury, P., Potter, T., and Howlett, B. J. (2012a). Rotation of canola (Brassica napus) cultivars with differential complements of blackleg resistance genes decreases disease severity. Plant Pathol. 61, 934–944. doi: 10.1111/j.1365-3059.2011.02580.x
Marcroft, S. J., Elliott, V. L., Cozijnsen, A. J., Salisbury, P. A., Howlett, B. J., and Van de Wouw, A. P. (2012b). Identifying resistance genes to Leptosphaeria maculans in Australian Brassica napus cultivars based on reactions to isolates with known avirulence genotypes. Crop Pasture Sci. 63, 338–350. doi: 10.1071/CP11341
Mrode, R., and Thompson, R. (2005). Linear Models for the Prediction of Animal Breeding Values. Available at: https://books.google.com.au/books?id=bnewaF4Uq2wC doi: 10.1079/9780851990002.0000
Nelson, M. N., Rajasekaran, R., Smith, A., Chen, S., Beeck, C. P., Siddique, K. H. M., et al. (2014). Quantitative trait loci for thermal time to flowering and photoperiod responsiveness discovered in summer annual-type Brassica napus L. PLoS One 9:e102611. doi: 10.1371/journal.pone.0102611
Panter, S. N., Hammond-Kosack, K. E., Harrison, K., Jones, J. D., and Jones, D. A. (2002). Developmental control of promoter activity is not responsible for mature onset of Cf-9B-mediated resistance to leaf mold in tomato. Mol. Plant Microbe Interact. 15, 1099–1107. doi: 10.1094/mpmi.2002.15.11.1099
Patterson, H. D., and Thompson, R. (1971). Recovery of inter-block information when block sizes are unequal. Biometrika 58, 545–554. doi: 10.1093/biomet/58.3.545
Pilet, M. L., Delourme, R., Foisset, N., and Renard, M. (1998). Identification of loci contributing to quantitative field resistance to blackleg disease, causal agent Leptosphaeria maculans (Desm.) Ces. et de Not., in winter rapeseed (Brassica napus L.). Theor. Appl. Genet. 96, 23–30. doi: 10.1007/s001220050704
Pilet, M. L., Duplan, G., Archipiano, M., Barret, P., Baron, C., Horvais, R., et al. (2001). Stability of QTL for field resistance to blackleg across two genetic backgrounds in oilseed rape. Crop Sci. 41, 197–205. doi: 10.2135/cropsci2001.411197x
R Core Team (2014) R: A language and Environment for Statistical Computing. Vienna: R Foundation for Statistical Computing Available at: http://www.R-project.org/
Rahman, M., Mamidi, S., del Rio, L., Ross, A., Kadir, M. M., Rahaman, M. M., et al. (2016). Association mapping in Brassica napus (L.) accessions identifies a major QTL for blackleg disease resistance on chromosome A01. Molecular Breeding 36, 1–15. doi: 10.1007/s11032-016-0513-8
Raman, H., Raman, R., Coombes, N., Song, J., Diffey, S., Kilian, A., et al. (2016). Genome-wide association study identifies new loci for resistance to Leptosphaeria maculans in canola. Front. Plant Sci. 7:1513. doi: 10.3389/fpls.2016.01513
Raman, R., Coombes, N., Wratten, N., Qiu, Y., Easton, A., Luckett, D. J., et al. (2016). Mapping loci for resistance to Leptosphaeria maculans in a doubled haploid population of Brassica napus from BLN2762/Surpass400. Front. Plant Sci. 7:1513. doi: 10.3389/fpls.2016.01513
Raman, H., Raman, R., Kilian, A., Detering, F., Carling, J., Coombes, N., et al. (2014). Genome-wide delineation of natural variation for pod shatter resistance in Brassica napus. PLoS One 9:e101673. doi: 10.1371/journal.pone.0101673
Raman, H., Raman, R., and Larkan, N. (2013). Genetic Dissection of Blackleg Resistance Loci in Rapeseed (Brassica napus L.). Plant Breeding from Laboratories to Fields (Ed. Prof. Sven Bode Andersen). Available: https://www.intechopen.com/books/plant-breeding-from-laboratories-to-fields/genetic-dissection-of-blackleg-resistance-loci-in-rapeseed-brassica-napus-l- [accessed October 31, 2018].
Raman, H., Raman, R., McVittie, B., Orchard, B., Qiu, Y., and Delourme, R. (2017). A major locus for manganese tolerance maps on chromosome A09 in a doubled haploid population of Brassica napus L. Front. Plant Sci. 8:1952. doi: 10.3389/fpls.2017.01952
Raman, R., Taylor, B., Lindbeck, K., Coombes, N., Barbulescu, D., Salisbury, P., et al. (2012a). Molecular mapping and validation of Rlm1 gene for resistance to Leptosphaeria maculans in canola (Brassica napus L.). Crop Pasture Sci. 63, 1007–1017. doi: 10.1071/CP12255
Raman, R., Taylor, B., Marcroft, S., Stiller, J., Eckermann, P., Coombes, N., et al. (2012b). Molecular mapping of qualitative and quantitative loci for resistance to Leptosphaeria maculans; causing blackleg disease in canola (Brassica napus L.). Theor. Appl. Genet. 125, 405–418. doi: 10.1007/s00122-012-1842-6
Rouxel, T., and Balesdent, M.-H. (2017). Life, death and rebirth of avirulence effectors in a fungal pathogen of Brassica crops. Leptosphaeria maculans. New Phytol. 214, 526–532. doi: 10.1111/nph.14411
Salisbury, P. A., and Wratten, N. (eds) (1999). “Brassica napus breeding. Canola in Australia: the first 30 years,” in Organising Committee of the 10th International Rapeseed Congress, eds P. A. Salisbury, T. D. Potter, G. McDonald, and A. G. Green (Canberra, CAT), 29–35.
Sprague, S. J., Marcroft, S. J., Hayden, H. L., and Howlett, B. J. (2006). Major gene resistance to blackleg in Brassica napus overcome within three years of commercial production in Southeastern Australia. Plant Dis. 90, 190–198. doi: 10.1094/pd-90-0190
Taylor, J., and Butler, D. (2016). ASMap: Linkage Map Construction Using the Mstmap Algorithm. Available at: https://CRAN.R-project.org/package=ASMap
Van de Wouw, A. P., Cozijnsen, A. J., Hane, J. K., Brunner, P. C., McDonald, B. A., Oliver, R. P., et al. (2010a). Evolution of linked avirulence effectors in Leptosphaeria maculans is affected by genomic environment and exposure to resistance genes in host plants. PLoS Pathog. 6:e1001180. doi: 10.1071/CP16411
Van de Wouw, A. P., Stonard, J. F., Howlett, B. J., West, J. S., Fitt, B. D. L., and Atkins, S. D. (2010b). Determining frequencies of avirulent alleles in airborne Leptosphaeria maculans inoculum using quantitative PCR. Plant Pathol. 59, 809–818. doi: 10.1111/j.1365-3059.2010.02311.x
Van de Wouw, A. P., Elliott, V. L., Chang, S., López-Ruiz, F. J., Marcroft, S. J., and Idnurm, A. (2017). Identification of isolates of the plant pathogen Leptosphaeria maculans with resistance to the triazole fungicide fluquinconazole using a novel in planta assay. PLoS One 12:e0188106. doi: 10.1371/journal.pone.0188106
Van de Wouw, A. P., Marcroft, S. J., Ware, A., Lindbeck, K., Khangura, R., and Howlett, B. J. (2014). Breakdown of resistance to the fungal disease, blackleg, is averted in commercial canola (Brassica napus) crops in Australia. Field Crops Res. 166, 144–151. doi: 10.1016/j.fcr.2014.06.023
West, J. S., Kharbanda, P. D., Barbetti, M. J., and Fitt, B. D. L. (2001). Epidemiology and management of Leptosphaeria maculans (phoma stem canker) on oilseed rape in Australia, Canada and Europe. Plant Pathol. 50, 10–27. doi: 10.1046/j.1365-3059.2001.00546.x
Keywords: blackleg, Leptosphaeria maculans, quantitative resistance, ascospore shower, genetic mapping, physical mapping
Citation: Raman H, Raman R, Diffey S, Qiu Y, McVittie B, Barbulescu DM, Salisbury PA, Marcroft S and Delourme R (2018) Stable Quantitative Resistance Loci to Blackleg Disease in Canola (Brassica napus L.) Over Continents. Front. Plant Sci. 9:1622. doi: 10.3389/fpls.2018.01622
Received: 09 July 2018; Accepted: 18 October 2018;
Published: 23 November 2018.
Edited by:
Maoteng Li, Huazhong University of Science and Technology, ChinaReviewed by:
Ryo Fujimoto, Kobe University, JapanYan Long, Institute of Biotechnology (CAAS), China
Copyright © 2018 Raman, Raman, Diffey, Qiu, McVittie, Barbulescu, Salisbury, Marcroft and Delourme. This is an open-access article distributed under the terms of the Creative Commons Attribution License (CC BY). The use, distribution or reproduction in other forums is permitted, provided the original author(s) and the copyright owner(s) are credited and that the original publication in this journal is cited, in accordance with accepted academic practice. No use, distribution or reproduction is permitted which does not comply with these terms.
*Correspondence: Harsh Raman, aGFyc2gucmFtYW5AZHBpLm5zdy5nb3YuYXU=