 Yongbin Peng
 Feixue HouQue Bai
 Peizhou Xu
 Yongxiang Liao
 Hongyu ZhangChaojian GuXiaoshu DengTingkai WuXiaoqiong Chen
 Asif Ali
 Xianjun Wu*
- Rice Research Institute, Sichuan Agricultural University at Wenjiang, Chengdu, China
Panicle apical abortion (PAA) causes severe yield losses in rice production, but details about its development and molecular basis remain elusive. Herein, a PAA mutant, paa1019, was identified among the progeny of an elite indica maintainer rice line Yixiang 1B (YXB) mutagenized population obtained using ethyl methyl sulfonate. The abortion rate of spikelets in paa1019 was observed up to 60%. Genetic mapping combined with Mutmap analysis revealed that LOC_Os03g20380 harbored a single-bp substitution (C to T) that altered its transcript length. This gene encodes calcineurin B-like protein-interacting protein kinase 31 (OsCIPK31) localized into the cytoplasm, and is preferentially expressed in transport tissues of rice. Complementation of paa1019 by transferring the open reading frame of LOC_Os03g20380 from YXB reversed the mutant phenotype, and conversely, gene editing by knocking out of OsCIPK31 in YXB results in PAA phenotype. Our results support that OsCIPK31 plays an important role in panicle development. We found that dysregulation is caused by the disruption of OsCIPK31 function due to excessive accumulation of ROS, which ultimately leads to cell death in rice panicle. OsCIPK31 and MAPK pathway might have a synergistic effect to lead ROS accumulation in response to stresses. Meanwhile the PAA distribution is related to IAA hormone accumulation in the panicle. Our study provides an understanding of the role of OsCIPK31 in panicle development by responding to various stresses and phytohormones.
Introduction
Plant architectural features (Wang and Li, 2008), especially panicle structure, size, and shape (Sakamoto and Matsuoka, 2004), are the major factors influencing grain yield, and improving panicle architecture is an important goal in rice (Oryza sativa) breeding programs (Sakamoto and Matsuoka, 2008). During panicle development, the inflorescence meristem initiates primary branch meristems, which also produce several secondary branch meristems, and ultimately, primary panicle branches (PBs) and secondary panicle branches (SBs) differentiate into spikelets. Finally, the inflorescence undergoes a long period of branch elongation and spikelet development before heading (Li et al., 2009).
Many regulatory genes are involved in the determination of panicle architecture. The pattern of axillary meristem (AM) formation is of special significance and it determines the complexity of the whole plant architecture. Transcription factors such as MONOCULM1 (MOC1) (Li et al., 2003), LAX1 (Komatsu et al., 2003; Oikawa and Kyozuka, 2009), LAX2 (Tabuchi et al., 2011), and frizzy panicle (FZP) (Komatsu et al., 2001) regulate the pattern formation of AMs, whereas SHORT PANICLE1 (SP1) (Li et al., 2009) and ERECT PANICLE2 (EP2) (Zhu et al., 2010) regulate AM formation by controlling the transportation of unknown substrates. Phytohormones are also thought to influence panicle architecture (Mcsteen, 2009; Lu et al., 2017). Generation and outgrowth of lateral shoots are regulated by combined actions of hormones such as auxins, cytokinins, strigolactones, and environmental cues (Tabuchi et al., 2011). PBs and SBs are increased upon upregulation of CYTOKININ OXIDASE (OsCKX2) in the cytokinin synthesis pathway (Ashikari et al., 2005; Han et al., 2014), and are dependent on iterations of branching and spikelet meristem formation during the maintenance of determinacy and indeterminacy (Kellogg et al., 2013; Zhang and Yuan, 2014; Zhi et al., 2014). RCN1 and RCN2, rice homologs of TERMINAL FLOWER/CENTRORADIALIS (TFL/CEN) that promote indeterminate inflorescence on branch and spikelet meristems in Arabidopsis and Antirrhinum, respectively (Bradley et al., 1996, 1997), lead to indeterminate inflorescence and a more branched panicle when ectopically expressed (Nakagawa et al., 2002). These indeterminacy inhibiting and promoting factors also interact with each other (Bradley et al., 1996).
In rice, panicle development can be roughly divided into two main stages; the early stage includes initiation of branch primordium and spikelet differentiation until panicle length remains short, whereas branch elongation and spikelet formation occur in the second stage (Li et al., 2009). Almost all characterized genes affecting panicle architecture participate in molecular activities during the first stage, and the mechanisms underlying branch elongation and spikelet development remain yet poorly understood. SP1 negatively regulates panicle length, and OsRAMOSA2 (RA2) controls panicle architecture by regulating pedicel length, but also little is known about the control of terminal spikelet development.
Panicle apical abortion (PAA) is common in rice, and spikelet abortion can take place either in the apical or basal part of the panicle. Early stage degeneration of spikelets is one of the detrimental factors affecting the final grain yield (Senanayake et al., 1994; Ansari et al., 2003; Kobayasi and Imaki, 2008). PAA is commonly influenced by various environmental factors, but the underlying mechanisms and targets are poorly understood. Several quantitative trait loci (QTLs) have been reported for floret abortion that are located on different chromosomes (Yamagishi et al., 2004; Xu et al., 2007; Cheng et al., 2011; Tan et al., 2011), and the SP1 gene influences the basal part of the panicle (Li et al., 2009). The tut1 mutant displays abnormal development of anthers and pollen grains (Bai et al., 2015). The PAA2 gene belongs to the NPF family and mutation in it leads to PAA phenotype in rice (Luo, 2016). Recently, OsALMT7 is reported as a malate transporter that plays its role in the development of panicle apical portions (Heng et al., 2018). In addition, both the genetic and environmental factors can affect the degeneration of florets (González et al., 2011), which makes analysis more complicated. Herein, we report a novel rice mutant, paa1019, which is specifically defective in panicle development. Gene cloning and characterization indicate that PAA1019 encodes OsCIPK31, a CIPK family kinase, which affects panicle development in rice. Possible roles of CIPK31 in regulating the PAA phenotype are explored and discussed.
Results
Phenotype of the paa1019 Mutant
Compared with wild-type (WT) YXB plants, paa1019 exhibited a reduction in plant height (Figures 1A,E), longer growth duration (Supplementary Figure S1A), drastically reduced spikelet number per panicle, smaller main panicle length, reduced 1000-grain weight, and smaller erect panicles with clearly aborted tips (Figures 1F–H). Meanwhile, paa1019 displayed the same number of tillers and secondary branches per panicle (Supplementary Figures S1B,C), and more primary branches per panicle (Figure 1I). Overall, unlike WT plants in which all spikelets were developed normally, the development of more than 60% of apical spikelets growth was arrested in paa1019 (Figure 1C and Supplementary Figure S1D). Some areas of paa1019 leaves lacked chlorophyll, and the net photosynthetic rate was lower than that in WT plants, whereas the carotene contents were higher (Supplementary Figures S2A–D). Furthermore, the malondialdehyde (MDA) contents of leaves in paa1019 were higher (Supplementary Figure S2E), indicating peroxidation damage. After finishing grain filling, paa1019 plants displayed brown lesions on glumes (Figure 1B). Electron microscopy (EM) revealed that grain filling in paa1019 was incomplete compared with WT plants (Figure 1D).
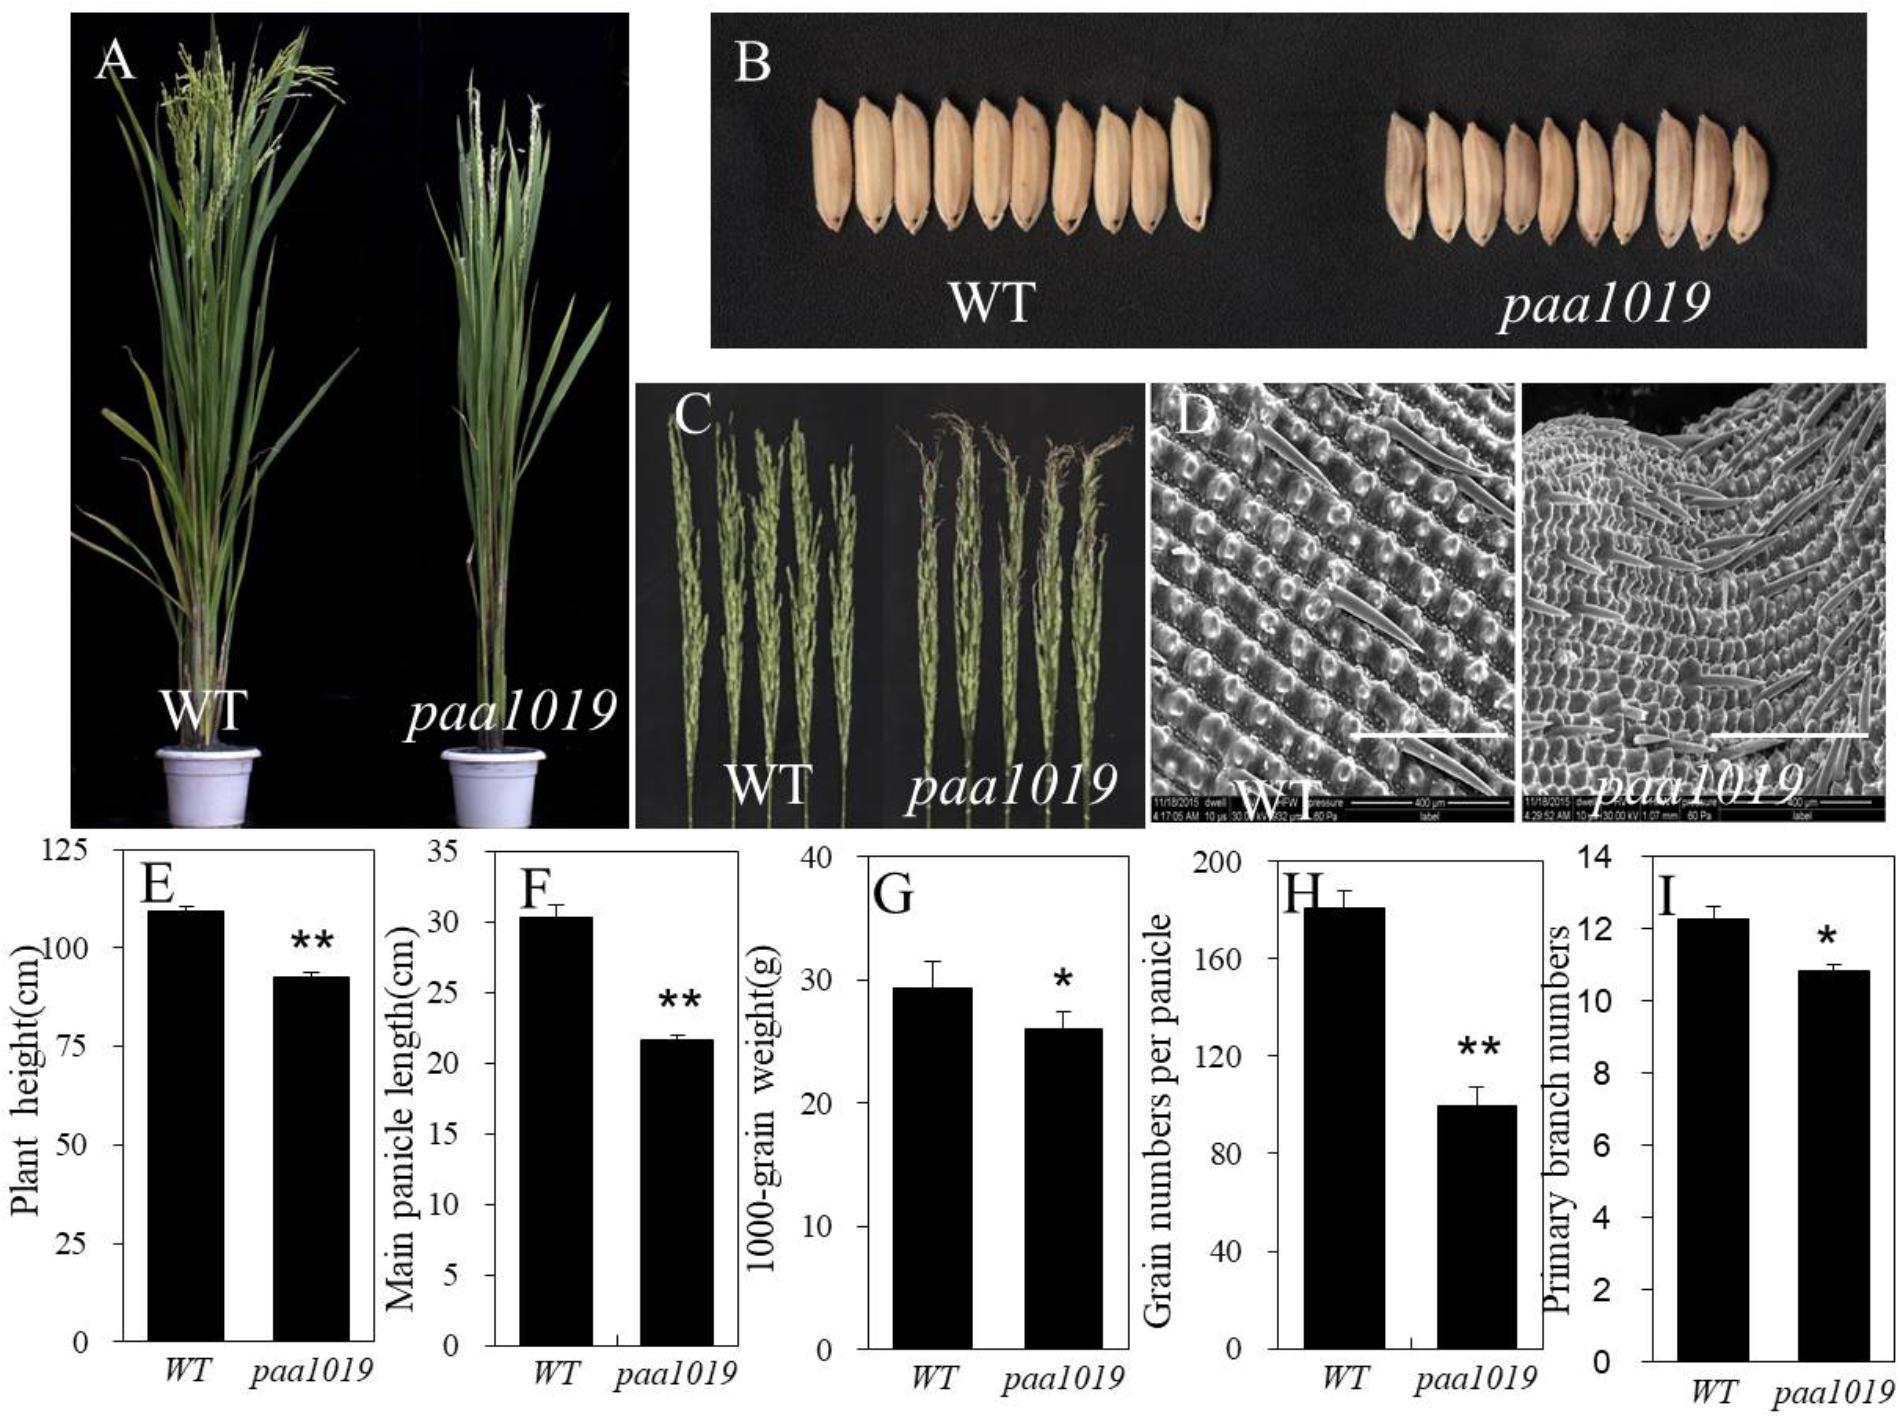
FIGURE 1. Phenotypes of the paa1019 mutant. Phenotypes, microscopy analysis, and agronomic traits of wild-type (WT) and paa1019 mutant plants. (A) Phenotype of the heading stage. (B) Phenotype of seeds. (C) Phenotype of panicles. (D) Microscopy analysis of the seed surface. (E) Quantification of plant height. (F) Main panicle length. (G) 1000-grain weight. (H). Grain number per panicle. (I) Primary branch number. Statistical analysis was performed using Student’s t-tests. ∗p < 0.05, ∗∗p < 0.01. Scale bar in (D) = 400 μm.
Isolation and Genetic Analysis of the paa1019 Mutant
Genetic analysis showed that paa1019 was controlled by a single recessive nuclear locus with a segregation ratio of 3.0. To map the PAA1019 locus, 550 pairs of simple sequence repeat (SSR) markers that are evenly distributed in the rice genome were selected to screen polymorphic markers between parent and mutant plants. The OsPAA1019 locus was initially mapped to a region of 871 kb on chromosome 3 that is located between the markers Os3_50.8 and RM5748 (Figure 2A). Pooled DNA from 25 individuals displaying the PAA phenotype in F2 progeny was resequenced using the Illumina HiSeq 2500 platform. A sequence comparison showed several single-nucleotide polymorphisms (SNPs) between WT plants and the mutant pool. Fortunately, only one SNP (SNP-index = 100%) was found in the candidate region, which was localized in the junction between the first intron and the second exon of LOC_Os03g20380 (Figure 2B). A single-base substitution (G to A) was detected at the position of 1101 nucleotide, and sequence comparison analysis revealed deletion of the entire second exon in paa1019 (63 bp deletion; Figure 2C and Supplementary Figure S3). These results indicate that the PAA phenotype in the paa1019 mutant likely arose from the single-base substitution in LOC_Os03g20380, and this gene encodes a CBL-interacting protein kinase, OsCIPK31, that belongs to plant CIPK family of proteins (Piao et al., 2010).
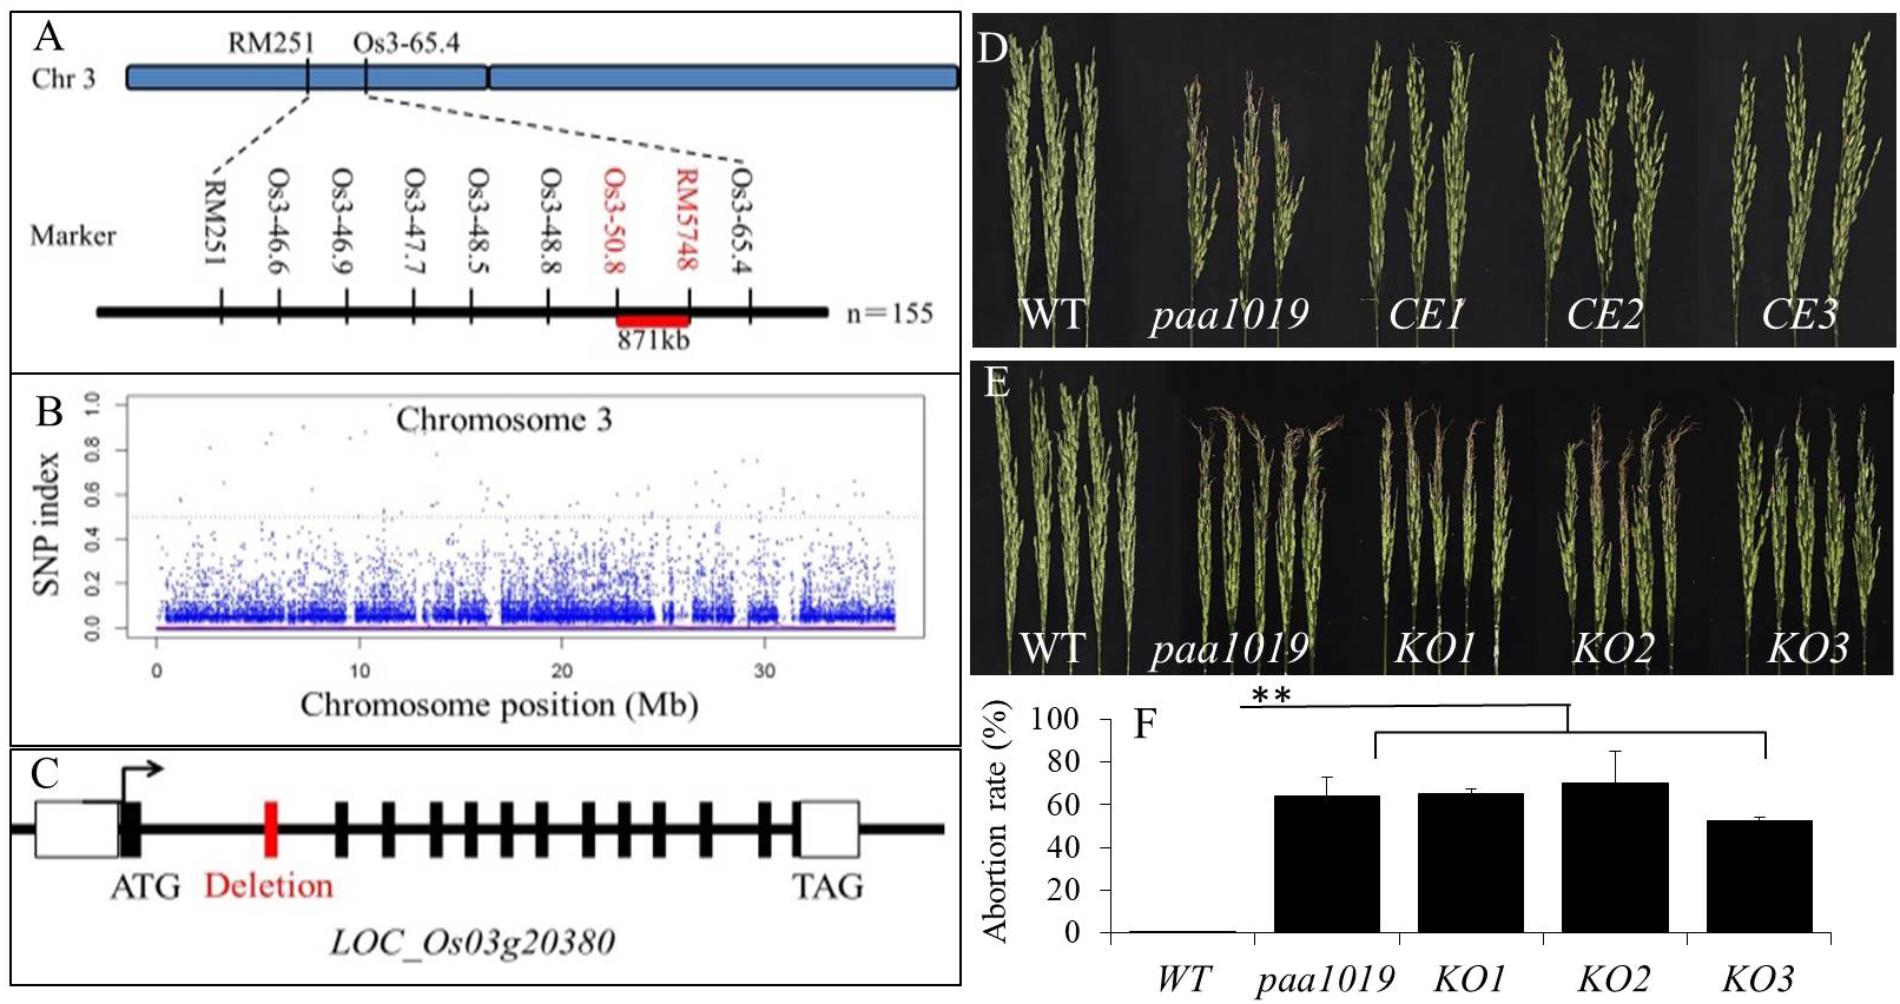
FIGURE 2. Genetic and physical maps of the OsCIPK31 gene. (A) The OsCIPK31 gene is located on chromosome 3 between Os3-50.8 and RM 5748. (B) Manhattan plot of chromosome 3. (C) Gene structure of OsCIPK31. The splicing pattern is altered in the mutant, resulting in the deletion of the second exon. (D) Phenotype of WT, paa1019, and complementation lines. CE1 – CE3 represent the three complementation transgenic lines. (E) Phenotype of WT, paa1019, and knock-out lines. KO1 – KO3 represent three knock-out transgenic lines. (F) Abortion rate analysis of lines corresponding to (E). Statistical analysis was performed using Student’s t-tests, ∗∗p < 0.01.
To perform complementation analysis, plasmid pBWA(V)BII containing the entire LOC_Os03g20380 open reading frame (ORF) was introduced into the paa1019 mutant. All the three resulting transgenic lines showed complementation of the paa1019 phenotype (Figure 2D). Quantitative real-time RT-PCR (qRT-PCR) data revealed complementation lines expressed similar quantity of the OsCIPK31 transcripts (Supplementary Figure S4). We also transformed a CRISPR-Cas9 construct targeting the fourth exon of OsCIPK31 into wild-type (YXB). Based on the phenotype of PAA, we identified and analyzed all the three independent transgenic lines (with frame shift; Supplementary Figure S5). To avoid the presence of off-targets, all the lines were backcrossed to the wild-type, respectively, and target lines were isolated from backcross populations. Strikingly, all the knock-out plants exhibited the apical panicle abortion phenotype (Figure 2E), with a degree of degradation degree comparable to the paa1019 mutant (Figure 2F). The mode of mutation for these knock-out lines is shown in Supplementary Figure S5. Together, these results confirmed that LOC_Os03g20380 indeed corresponds to the PAA1019 gene.
Spatiotemporal Analysis of Spikelet Degeneration Indicates Apical Dominance
To examine the developmental defects affecting spikelets, we carried out an in-depth analysis of panicle formation by comparing differences between WT and paa1019 plants during representative developmental stages. Scanning Electron Microscopic (SEM) observations did not reveal significant morphological differences between paa1019 and WT shoot apical meristems (SAMs) in vegetative or reproductive apices (Figures 3A–D). The paa1019 plants initiated branch primordia and spikelet primordia in the similar way as WT plants, and the young panicle appeared to be normal in paa1019 plants until they reached ∼4 cm in length. However, when the young panicle elongated gradually, the apical part of each primary branch in WT panicles elongated normally, whereas those in paa1019 were significantly delayed or completely arrested, and the spikelets at the top of panicles were clearly found degenerated (Figures 3E–J). As panicle development proceeded, the degree of abortion was observed increasing in paa1019 plants.
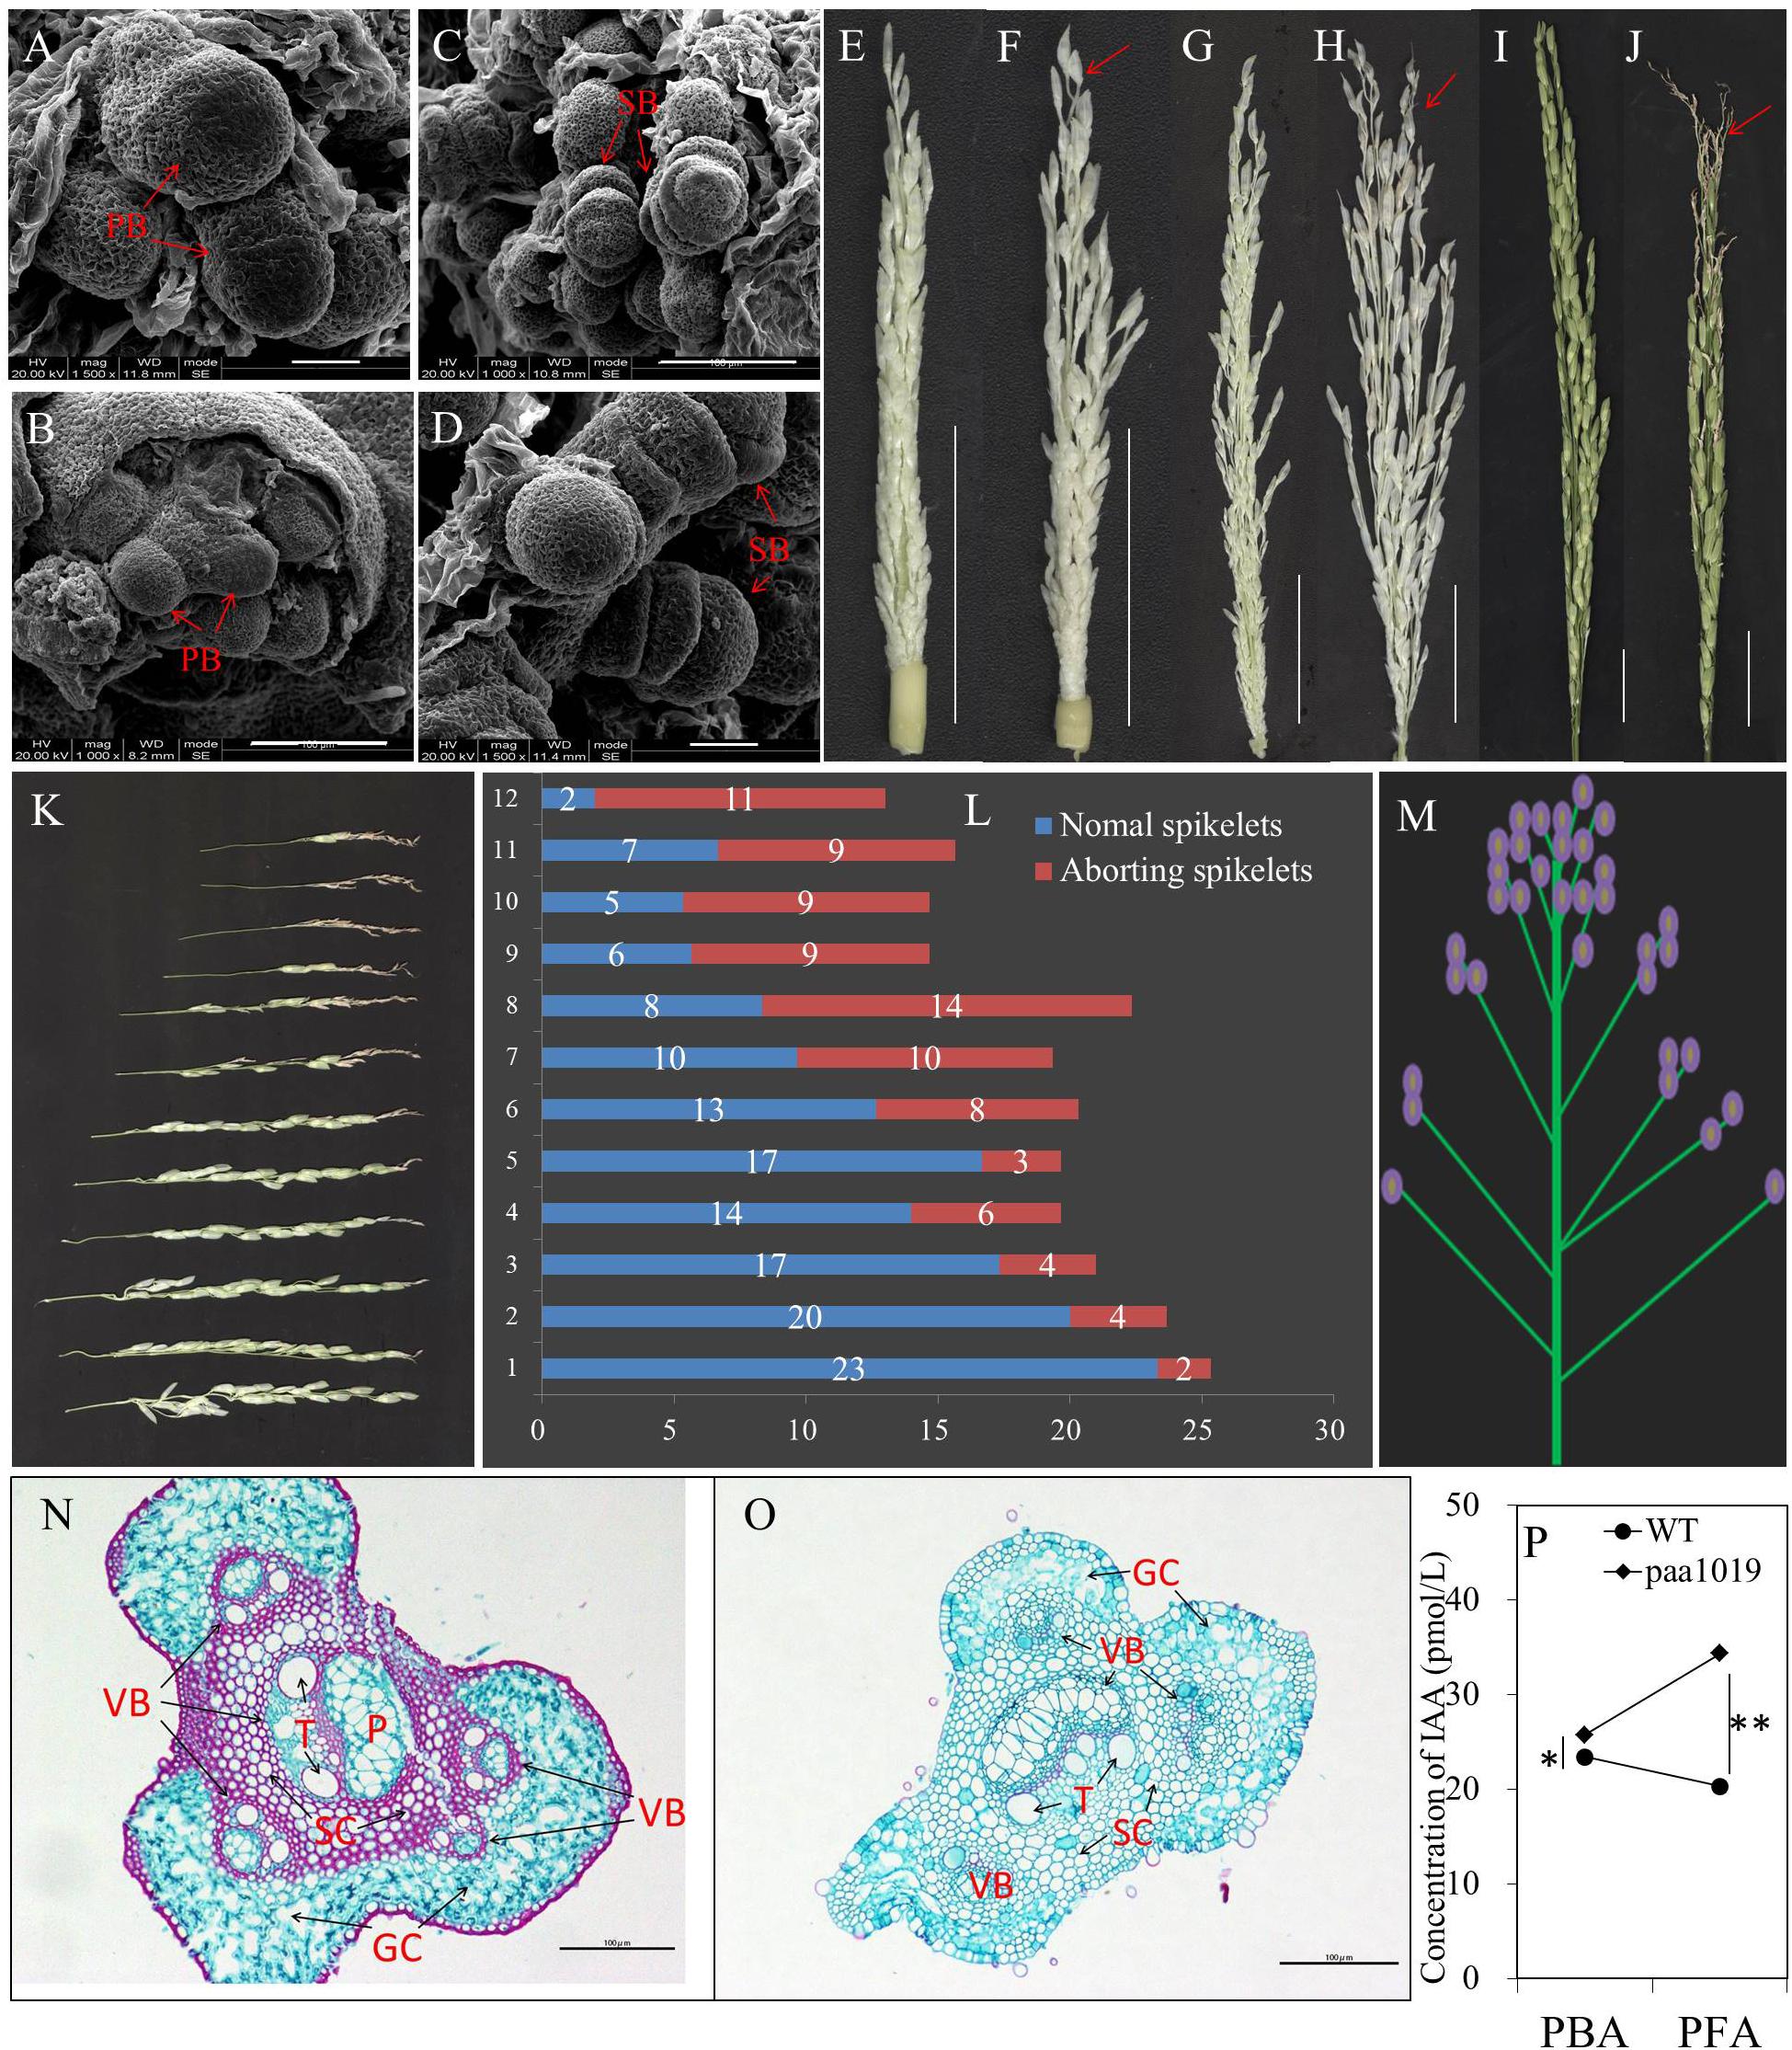
FIGURE 3. Characteristics of degraded spikelets. (A–D) Scanning electron microscopy (SEM) of shoot apical meristems (SAMs). Branch and spikelet primordia of WT (A,C) and paa1019 (B,D) plants. PB, primary branches; SB, second branches. (E–J) Panicle development at different growth stages. Panicles were observed when the length was 4, 10, and 15 cm for WT (E,G,I) and paa1019 (F,H,J) plants. (K) Phenotype of primary branches from the bottom to the top of the panicle in paa1019. (L) Statistics for the spikelet number correspond to (K). (M) Model of apical abortion distribution in paa1019. (N,O) Transverse sections of pedicels. (O) Secondary pedicel in PAA. (N) Corresponding parts in WT plants. VB, vascular bundle; GC, green cells; SC, sclerenchymatous cells; T, vessel; P, phloem. (P) Concentration of indole-3-acetic acid (IAA/auxin). PBA, panicles before abortion; PFA, panicles following abortion. Scale bar = 100 μm (A–D,N,O) and 2 cm (E–J). ∗p < 0.05, ∗∗p < 0.01.
It is commonly believed that auxin accumulation in the apical meristem promotes terminal bud growth and inhibits lateral bud growth, and this is referred to as “apical dominance.” Differentiation of spikelet primordia on each primary branch is basipetal; development of apical spikelets always occurs earlier than basal spikelets. Consistently, the occurrence of PAA was consistent with previous studies (Chenjia et al., 2010). We also noticed that the degree of degradation was associated with spikelet location. First, the abnormal part appeared at the top of each primary branch (Figure 3K). Second, the rate of spikelet abortion in a single primary branch increased gradually from the bottom to the top of the panicle (Figure 3L); we observed only a few abnormal spikelets at the basal regions of panicles, whereas the upper regions barely showed normal development (Figure 3M). In addition, the content of indole-3-acetic acid (IAA/auxin) in the young panicles of paa1019 plants was higher than in WT plants during panicle development (Figure 3P), indicating that IAA may be involved in regulating PAA. We examined transverse sections of pedicels, and found fewer vascular bundles and reduced green cells in paa1019. By contrast, regions of vascular bundles in pedicels were replaced with sclerenchymatous cells in WT plants (Figures 3N,O). Thus, a few structural changes appeared to cause blockage of nutrient transportation, leading to malnutrition during apical development.
Reactive Oxygen Species (ROS) Accumulation Induces Cell Death in Panicle Apical Spikelets
To examine whether PAA was accompanied by programmed cell death (PCD), we analyzed PAA using trypan blue and Evans blue staining. Spikelets suffering PAA in paa1019 displayed much darker blue staining (Figures 4A,B). ROS are well-known stress signaling molecules in both plants and animals, and excessive levels of H2O2 can damage the structure of cell walls, cell membranes, and macromolecules such as DNA and proteins (Gomez et al., 2004). To investigate the functions of ROS in rice panicle apical spikelet fate regulation, we first examined H2O2 distribution in apical spikelets using 3,3′-diaminobenzidine (DAB). H2O2 levels in apical spikelets in paa1019 differed during different development stages (Figure 4C). We further confirmed the relative concentration of H2O2 in panicles in both WT and paa1019 plants, and H2O2 increased in paa1019 (Figure 4D). Catalase (CAT) is the key peroxidase acting in the biological defense system, and excessive H2O2 is converted by CATs into oxygen. OsCAT1, OsCAT2, and OsCAT3 are CAT isozymes in rice. Consistent with our previous findings, all the three isozymes were expressed at lower levels in paa1019 than WT plants (Figures 4E–G), indicating that ROS accumulation (H2O2) might affect the plasma membrane (PM) system, eventually leading to apical spikelet to cell death.
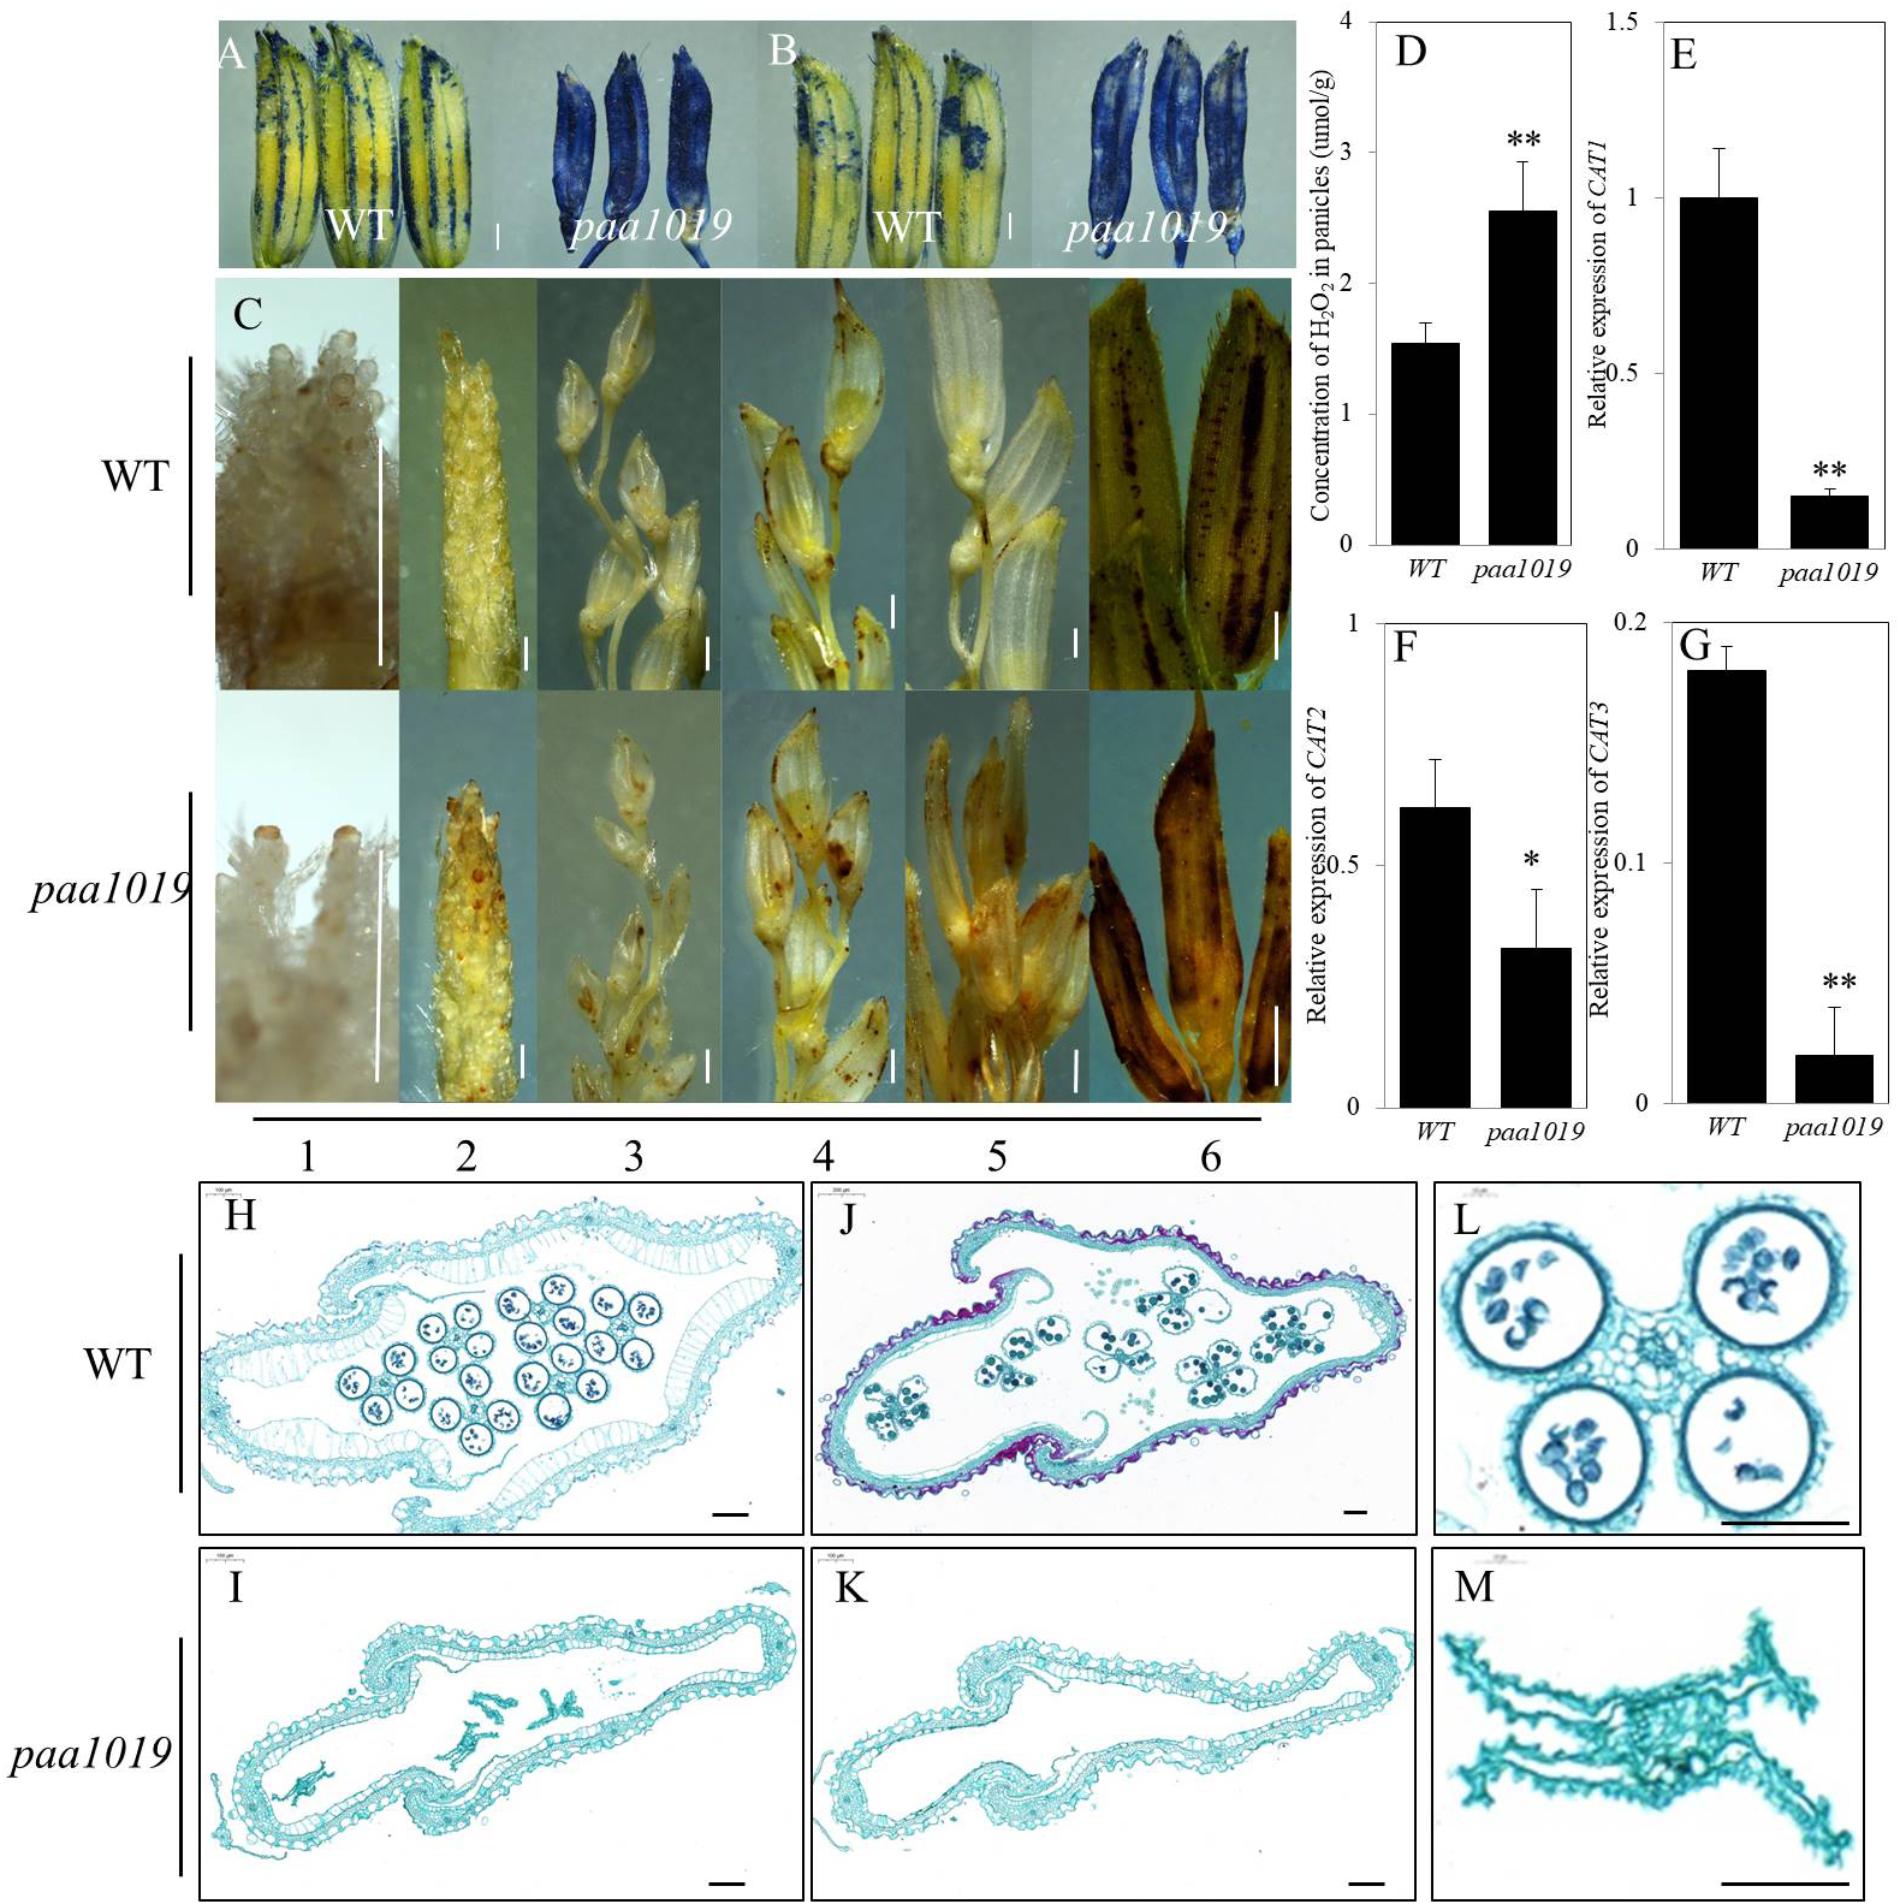
FIGURE 4. ROS accumulation leads to plasma membrane damage in paa1019. (A) Trypan blue staining. (B) Evans blue staining. (C) DAB staining at different growth stages. Primordium differentiation stage (1) = 20 days before flowering (DBF); (2) = 15 DBF; (3) = 10 DBF; (4) = 5 DBF; (5) = heading stage; (6) differences between WT and paa1019. (D) Concentration of H2O2 in panicles. (E–G) Relative expression of CAT1, CAT2, and CAT3 isozymes. Rice ACTIN was used as an internal control. Data are presented as mean ± SE (n = 3). (H–M) Transverse sections of spikelets at booting stages (H,I) and heading stages (J,K). (L,M) Enlargement of stamens in (H,I). Scale bar = 0.2 c (C) and 100 μm (H–M). ∗p < 0.05, ∗∗p < 0.01.
To further confirm damage caused by ROS accumulation, floral organ development was assessed during different stages before flowering. During the early stage of stamen and pistil development, between 20 and 15 days before flowering (DBF), there were no significant differences observed between WT and paa1019 plants (Supplementary Figures S6A–D), but differences began to appear at 10 DBF and remained until maturity. Compared with WT, the androecium was withered and smaller, and trichomes attached to the gynoecium were reduced at 10 DBF in paa1019 (Supplementary Figures S6E,F). Over time, the anther was filled with abundant pollen grains, and the gynoecium acquired numerous trichomes at 5 DBF in WT plants (Supplementary Figures S6G,H). By contrast, the corresponding parts were far less well developed in paa1019, and the anther and stigma were more withered, ovaries were fragile, and the filament and style offered minimal support. Although pollen grains were still visible in the pollen sac, I2-KI staining suggested these were not viable (Supplementary Figures S6K,L). All the reproductive organs were apoptotic in paa1019 until flowering time (Supplementary Figures S6I,J). Moreover, to further understand the nature of spikelet abortion, we prepared cross-sections of spikelets along the middle region of the hull, which showed that the cell wall and cytoplasmic membrane of glumes and stamens were deformed during both booting and heading stages, consistent with the above observations (Figures 4H–M). These results suggest that that ROS accumulation indeed damages the PM structure of panicle apical spikelets, eventually leading to cell death.
The paa1019 Mutant Exhibits Hypersensitivity to Abiotic Stress
OsCIPK31, a member of the OsCIPK family, encodes a CBL-interacting protein kinase involved in germination and seedling growth under abiotic stress conditions in rice (Piao et al., 2010). PAA is relatively common and affected by environmental factors during grain production. To further elucidate the multifaceted functions of OsCIPK31 in rice, we evaluated the performance of paa1019 under cold and salt stress conditions during the seedling stage. Under normal growth conditions in a hydroponic environment, no significant differences in growth rate or morphological phenotype were detected between WT and paa1019. However, after 5 days of cold treatment (10°C), paa1019 leaves were rolled and droopy, whereas those of WT plants remained upright, although a few rolled leaves were observed. Additionally, paa1019 roots were more severely wizened than those of WT plants (Figure 5A). To determine the water deficit response quantitatively, the relative water content (RWC) was determined for detached leaves. In response to cold stress, paa1019 plants lost water faster than WT plants under both 20 and 10°C treatments (Figure 5B). Expression of two cold stress-inducible genes was analyzed. OsCOLD1 has been reported to play a critical role in cold stress tolerance (Ma Y. et al., 2015). As shown in Figure 5C, OsCOLD1 expression in WT plants was higher than in paa1019 under normal conditions, and this remained the case after cold treatment (Figures 5C,D). Consistently, a significant decrease in the expression of OsLTG1, another cold-inducible gene, was observed in paa1019 plants under normal and cold treatments (Figures 5E,F). Abiotic stress usually results in oxidative damage and accumulation of ROS, and the balance between production and removal of ROS is mainly determined by ROS-scavenging enzymes such as catalase (CAT) and glutathione reductase (GR). We therefore examined the activity of these two enzymes. The activity of CAT and GR in paa1019 was reduced following cold stress (Supplementary Figures S8A,B), suggesting an important role for OsCIPK31 in the cold stress response. To further assess whether the abortion phenotype in paa1019 was associated with temperature, paa1019 plants were grown at different times of the year, and a dramatic negative correlation between abortion rate and average daily temperature was apparent (Supplementary Figure S7).
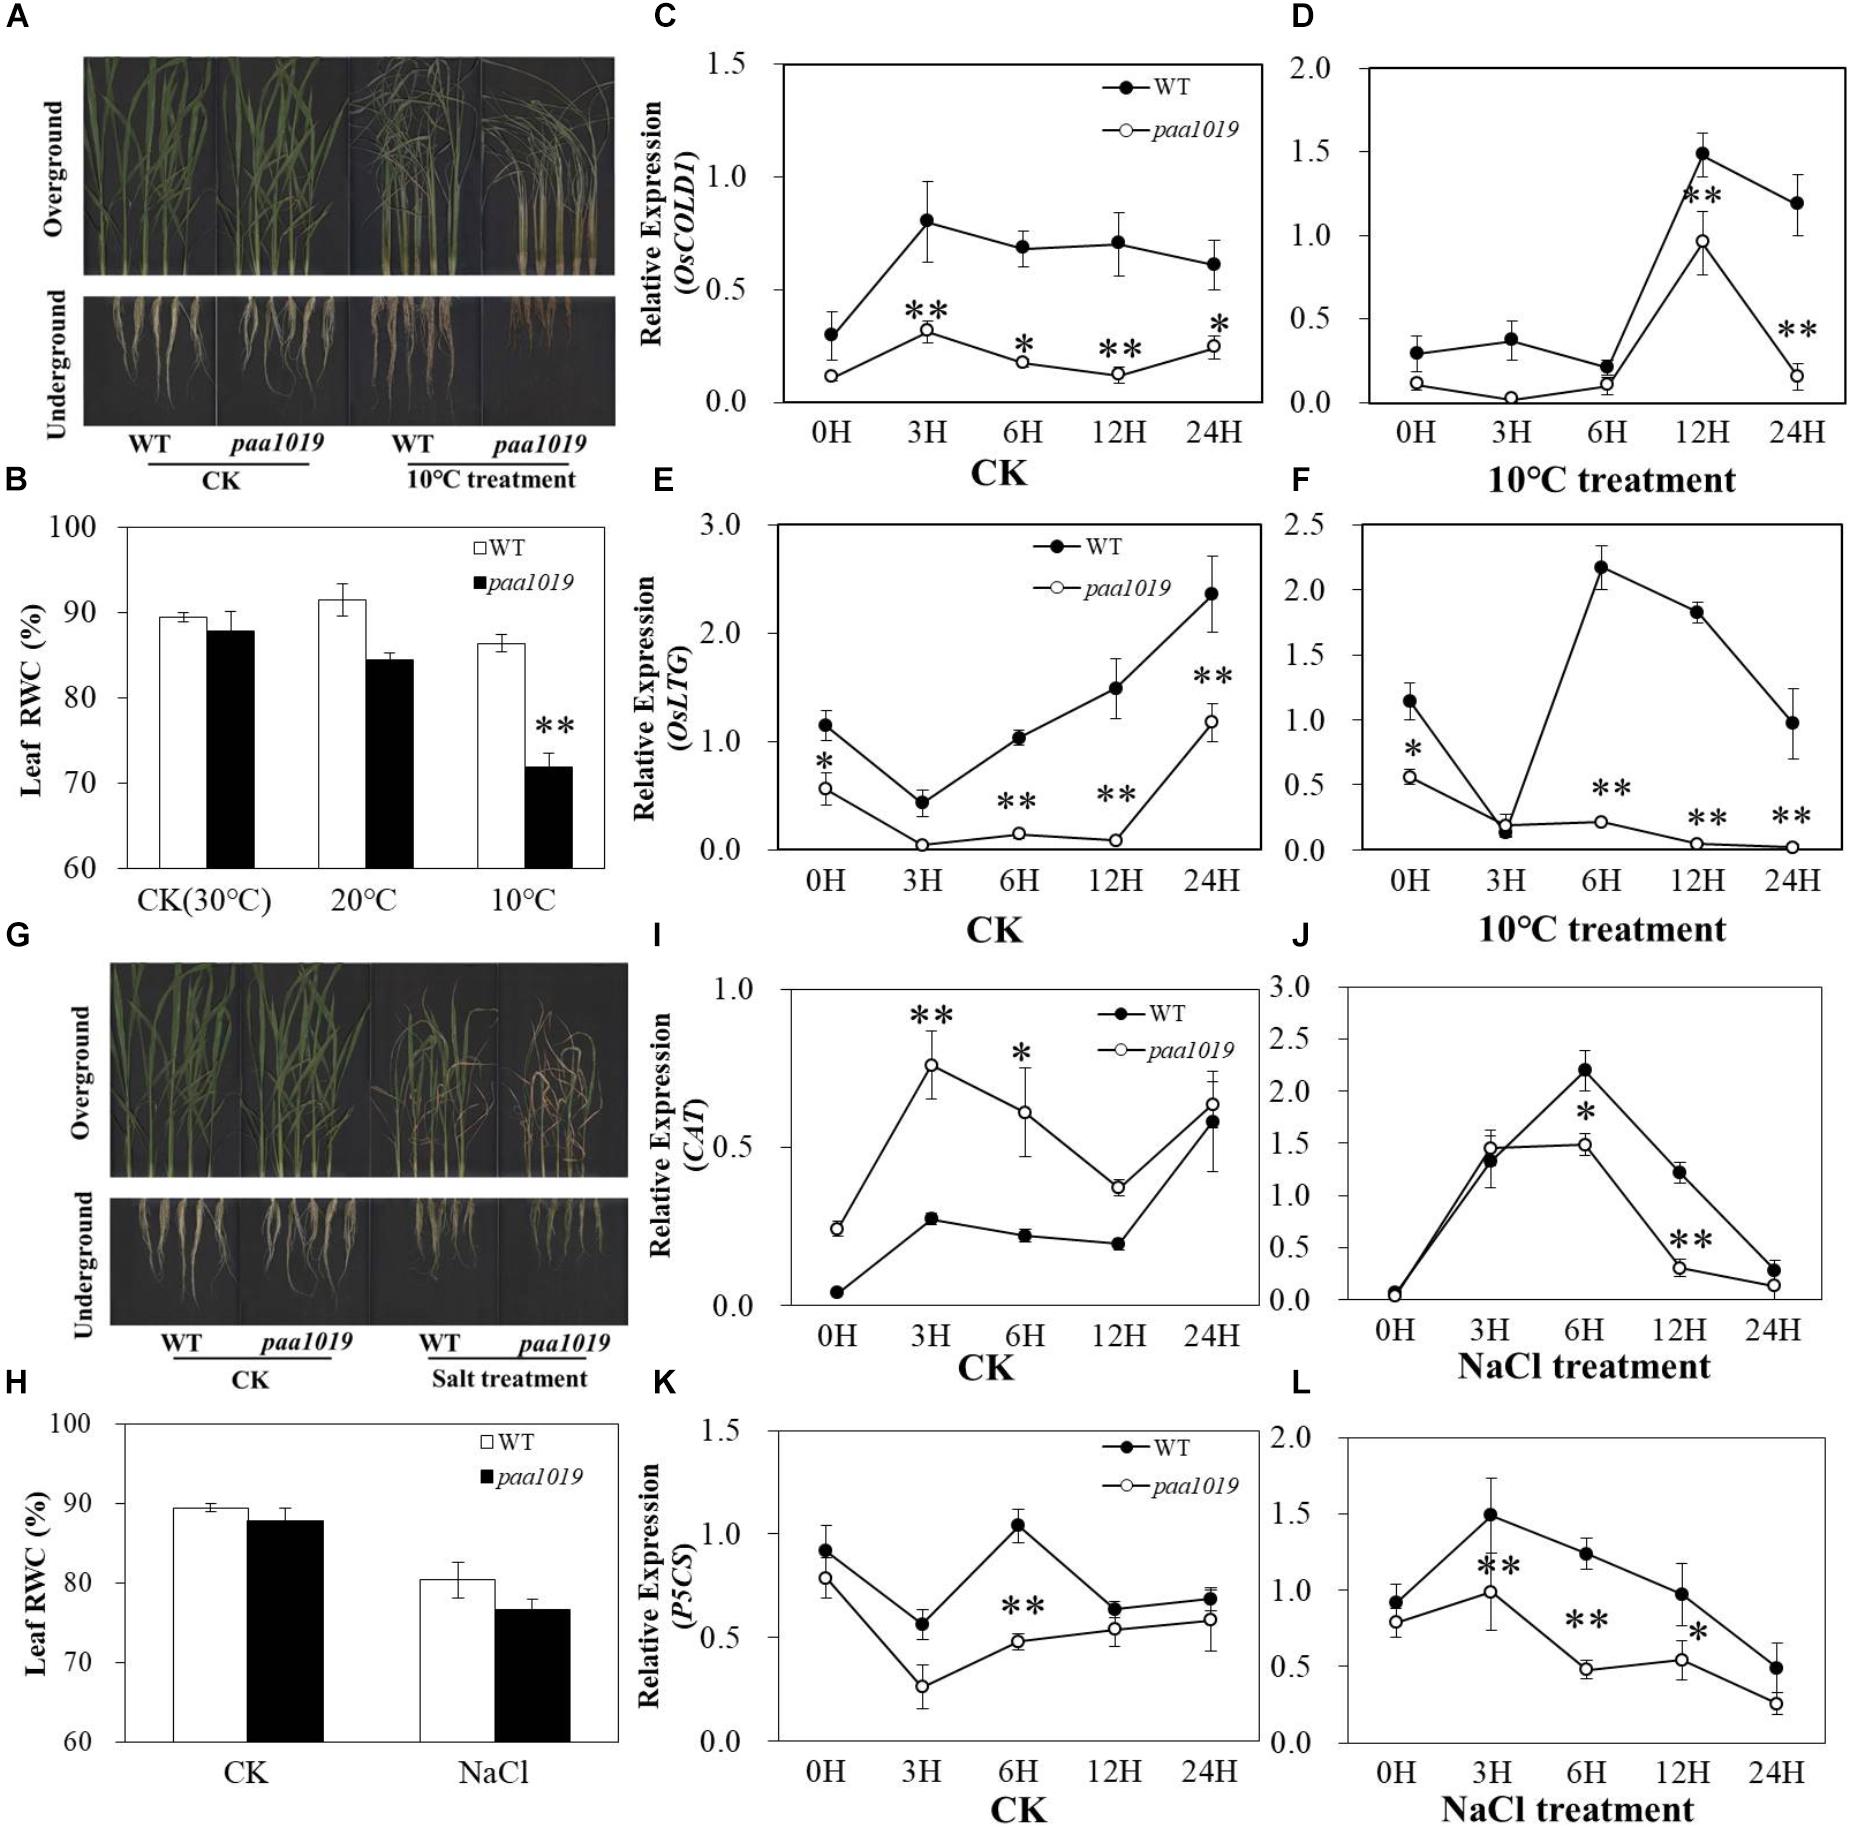
FIGURE 5. paa1019 plants are more sensitive to cold and salt stresses. (A) Phenotype following cold treatment. (B) Relative water concentration in leaves. (C–F) Relative expression of OsCOLD1 and OsLTG. (G) Phenotype following salt treatment. (H) Relative water concentration in leaves. (I–L) Relative expression of CAT and P5CS. ∗p < 0.05, ∗∗p < 0.01.
Consistent with the cold treatment results, we found that the development of paa1019 plants was arrested more seriously after 5 days of exposure to 100 mM NaCl, and the leaf RWC of WT plants was higher than that of paa1019 (Figures 5G,H). Lower NaCl dosage led to a shorter lethal period in paa1019 plants (Supplementary Figure S9). Furthermore, we analyzed the expression levels of two salt stress-inducible genes, OsP5CS and OsCAT, and compared with WT, expression of OsP5CS was consistently downregulated in paa1019 in both control (CK) and salt treatments (Figures 5K,L). Consistently, a significant decrease in OsCAT expression was observed in paa1019 plants following salt treatment. (Figures 5I,J), indicating a reduction in the salt tolerance of paa1019 plants. CAT and GR activities in paa1019 plants were also reduced at all NaCl concentrations except 50 mM, in which GR activity was increased (Supplementary Figures S8C,D). These results demonstrated that OsCIPK31 positively regulates salt stress tolerance in rice.
Expression Profiling of OsCIPK31
To explore the spatiotemporal expression of OsCIPK31 in rice, we examined expression in different tissues by qRT-PCR. The results indicated that OsCIPK31 was expressed in all examined tissues. The highest expression was found in young roots, and expression was lowest in mature roots. Expression was relatively high in leaves, stems, stamens, and panicle necks, and lowest in developing panicles. However, expression levels were increased during panicle development (Supplementary Figure S10). To further examine the tissue-specific expression pattern of OsCIPK31, we generated stable transgenic rice plants expressing the β-glucuronidase (GUS) gene under the control of the native promoter of OsCIPK31. GUS histochemical activity was detected in various plant tissues, especially in transport tissues. Strong GUS staining was detected in the meristem zones of primary root and stem (Figures 6A–C), whereas faint staining was observed in veins of adult leaves (Figure 6E). No GUS activity was detected on the surface of young panicles, but obvious staining was observed in the stamens (Figure 6G). Young leaves and young stem nodes showed strong staining (Figures 6D,F). Strong GUS staining was also detected in embryo, radicle, and crown root tissue in germinating seeds (Figures 6H–J).
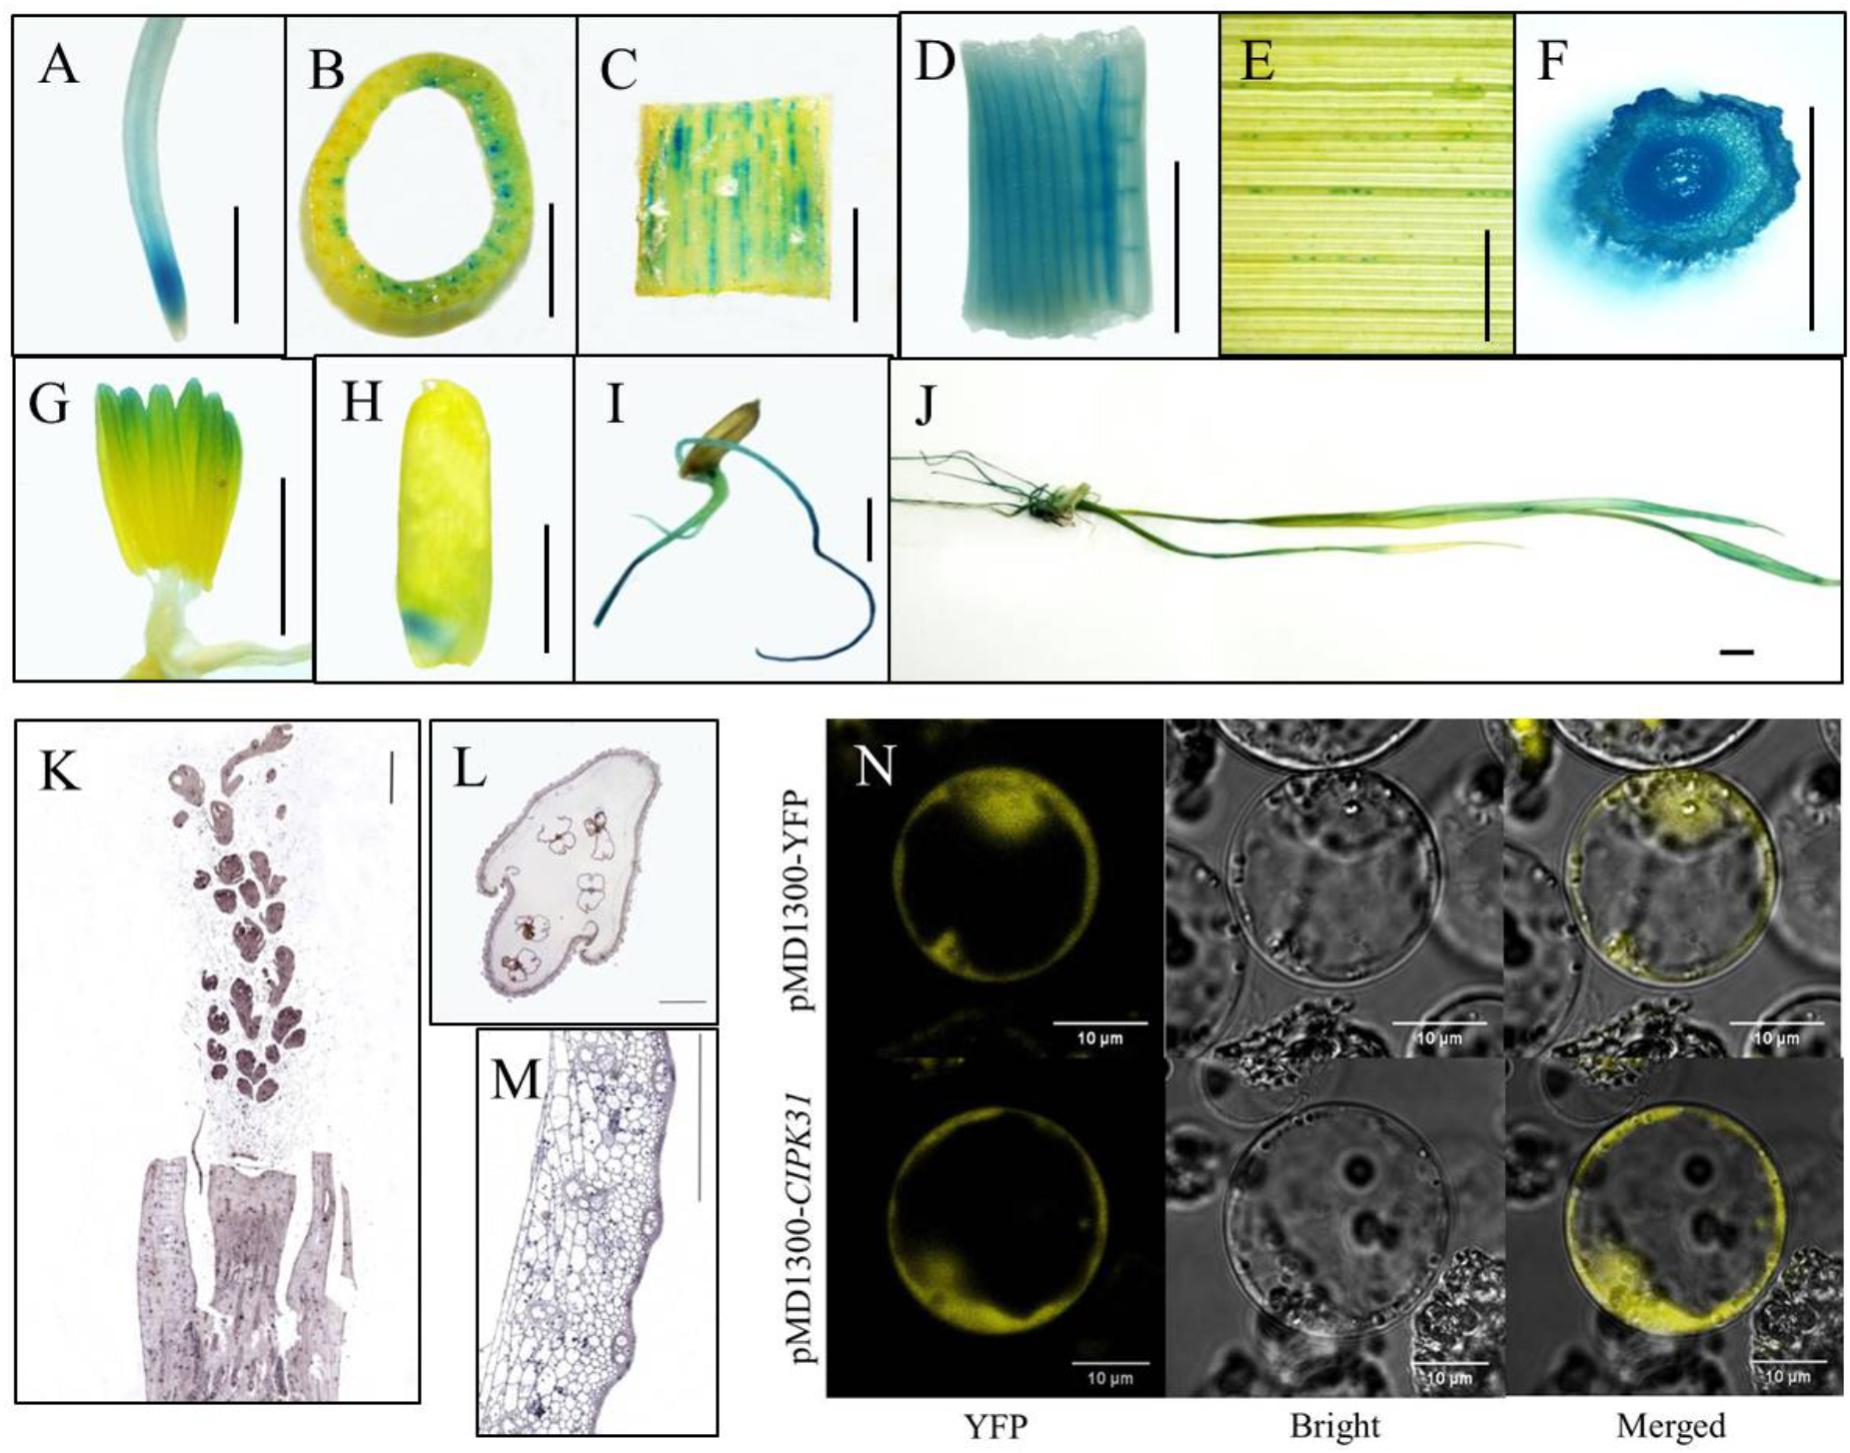
FIGURE 6. Analysis of OsCIPK31 expression. (A–J) Detection of GUS activity in OsCIPK31 promoter:GUS transgenic plants. GUS staining was performed using more than three independent transgenic lines with similar patterns. Primary roots (A), stems (B,C), center of young leaves (D), adult leaves (E), young stem nodes (F), stamens (G), embryos of seeds (H), germinating seeds (I), seedlings (J). (K–M) In situ hybridization of an OsCIPK31-specific probe with a longitudinal section of young panicle (K), and cross-sections of spikelets (L) and stems (M). (N) Subcellular location of the OsCIPK31 protein. Scale bar = 0.5 cm (A–J), 500 μm (K–M) and 10 μm (N).
To further determine the expression of OsCIPK31, RNA in situ hybridization was performed using developing panicles, stems, and spikelets, and the results demonstrated the preferential expression of OsCIPK31 in the stamens of spikelets and the hull of vascular tissues in stems (Figures 6K–M). Subcellular location analysis in the rice protoplast indicated that OsCIPK31 was localized to the cytoplasm (Figure 6N).
Identification of Differentially Expressed Genes (DEGs) Related to PAA Regulation
To elucidate the possible regulatory mechanisms of OsCIPK31 in panicle development, we performed transcriptome profiling of WT and paa1019 panicles at 2 and 6 cm length using RNA-seq. Young panicle tissue was collected at two stages encompassing the entire PAA process. Principal component analysis (PCA) and correlation analysis indicated that the RNA sequencing data were of high quality, with sufficient sequencing depth for subsequent analysis of differential expression (Supplementary Figures S11A–D). Differential expression and analysis of differences in each gene between WT and paa1019 plants, during panicles before abortion (PBA) and panicles following abortion (PFA), showed different groups with unequal dysregulation of genes with a fold change (FC) > 2 and a p-value less than 0.05 (Figure 7A).
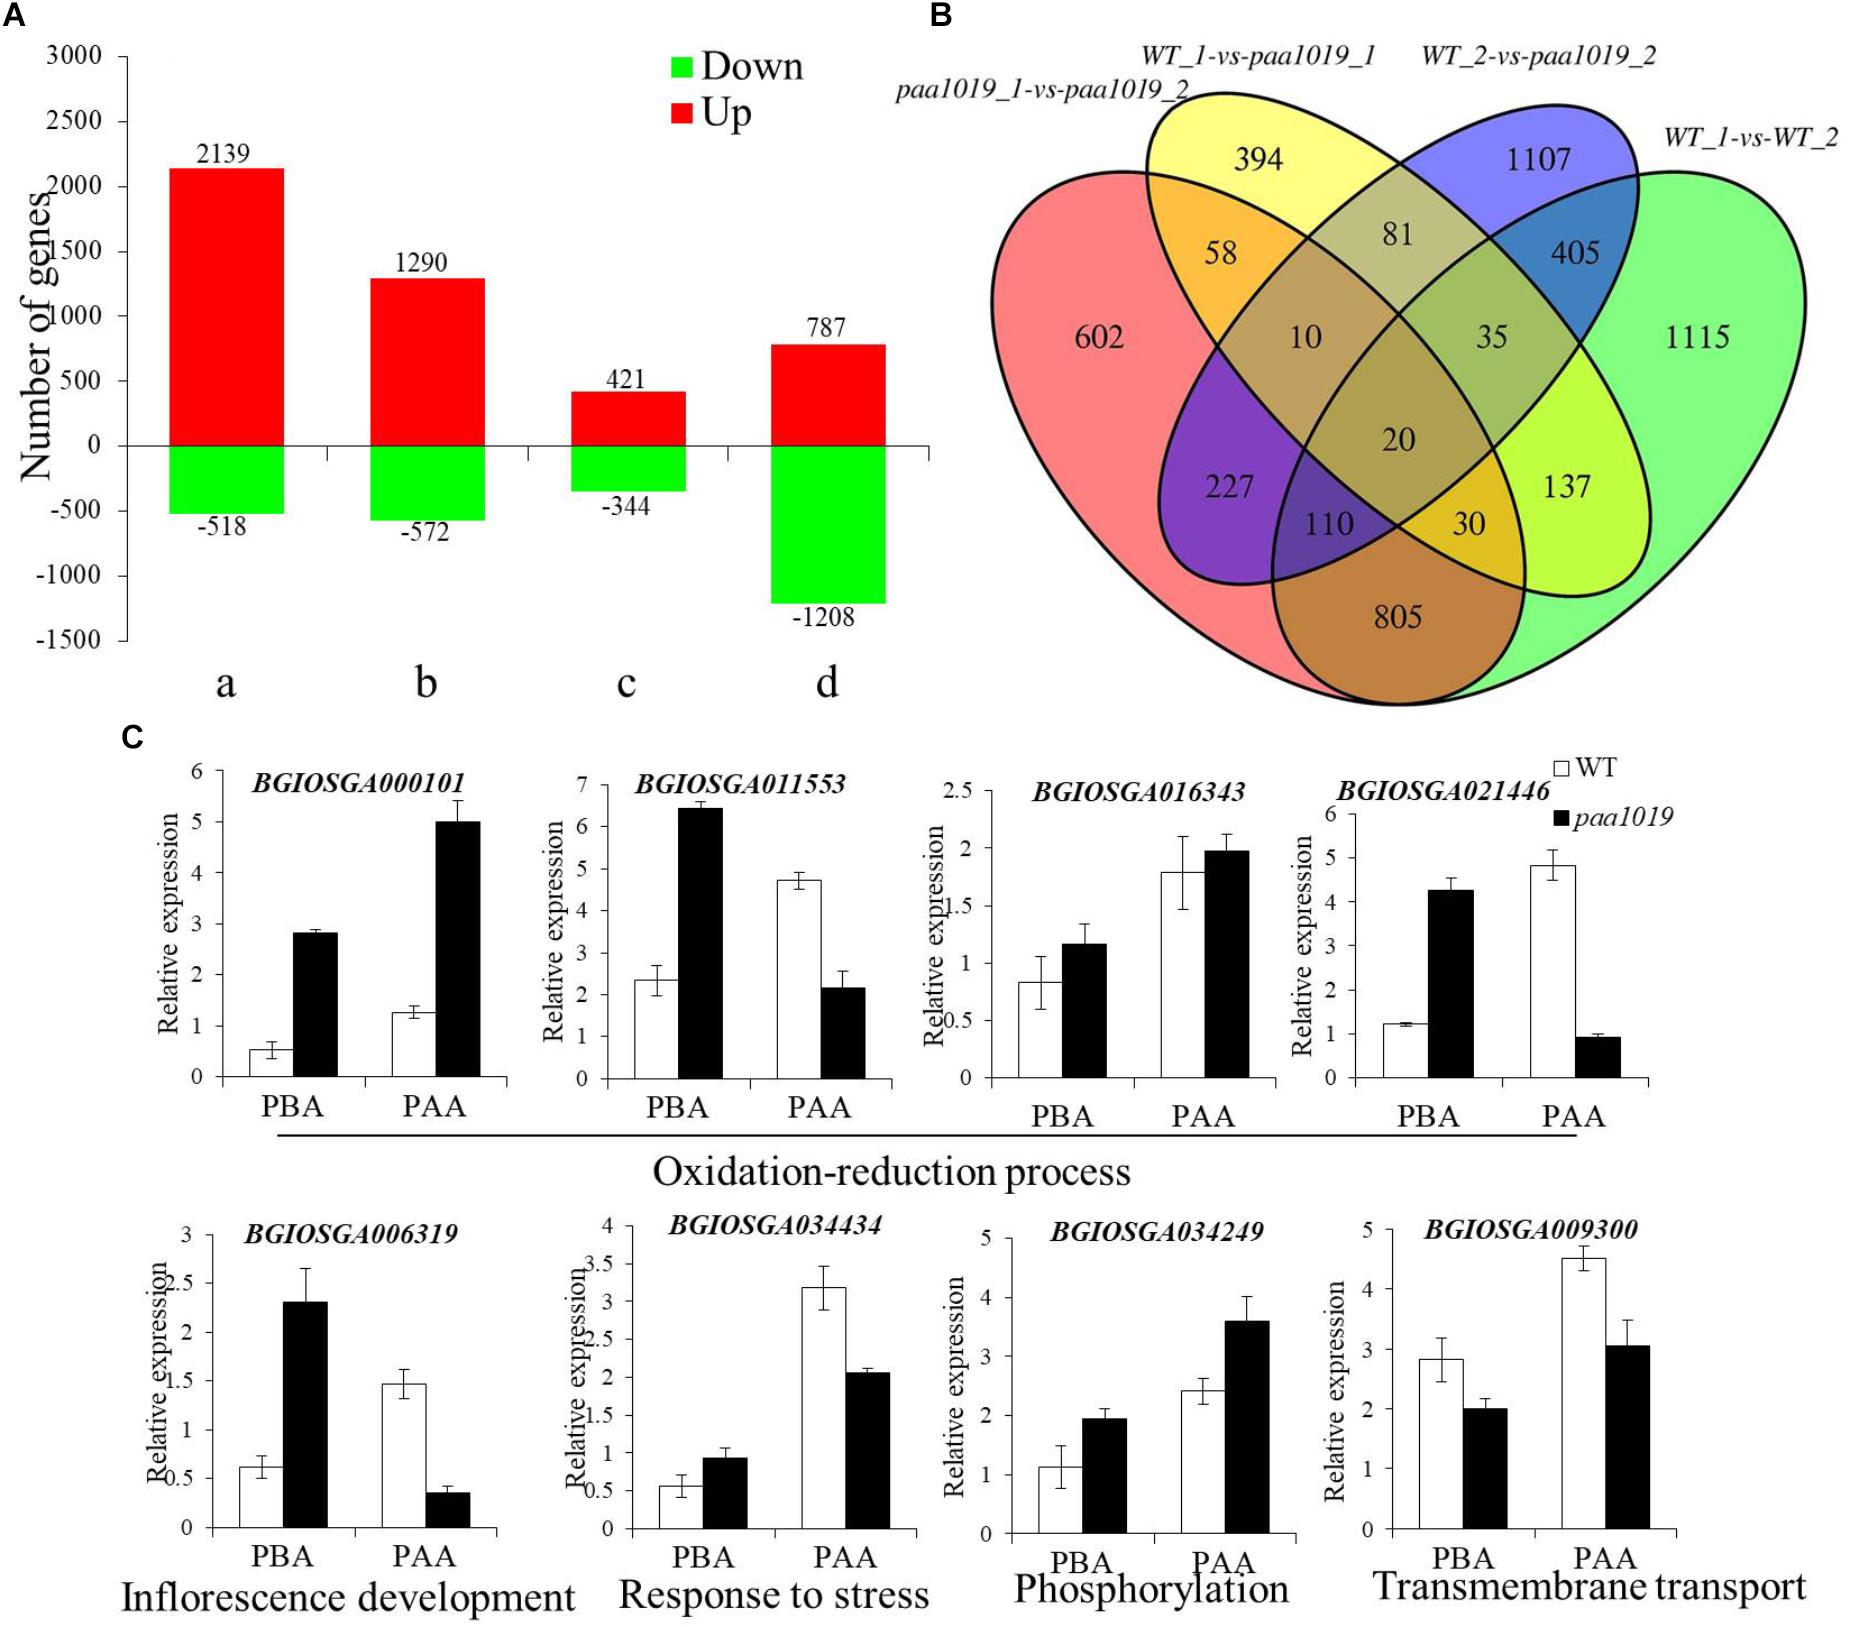
FIGURE 7. Differentially expressed genes (DEGs) in panicles of WT and paa1019 plants. (A) Number of DEGs in host tissues. Green and red bars indicated down- and upregulated genes, respectively. a, b, c, and d represent WT-2 cm vs. WT-6 cm, paa1019-2 cm vs. paa1019-6 cm, WT-2 cm vs. paa1019-2 cm, and WT-6 cm vs. paa1019-6 cm, respectively. 765 significantly dysregulated genes with a fold change (FC) > 2 and a p-value less than 0.05 was identified. Among these, 421 were upregulated and 344 were downregulated in mutant panicles before degradation. By contrast, 1995 significantly dysregulated genes, including 787 upregulated and 1208 downregulated genes, were identified between WT and mutant panicles after degradation. A total of 2657 genes, including 2139 upregulated and 518 downregulated genes, were observed in WT groups, and 1862 genes, including 1290 upregulated and 572 downregulated genes, were identified in mutant groups. (B) Venn diagram showing genes common to WT-1, WT-2, paa1019-1, and paa1019-2 groups (represented by WT-2 cm, WT-6 cm, paa1019-2 cm, and paa1019-6 cm, respectively). (C) Analysis of the expression of common genes.
To identify DEGs common in both WT and paa1019 panicles, we compared DEGs in each group. The Venn diagram revealed 20 specific genes with diverse regulatory patterns, details of which are shown in Supplementary Table S3 and Figure 7B. Functional analysis showed that four genes (BGIOSGA000101, BGIOSGA011553, BGIOSGA016343, and BGIOSGA021446) were predicted to be essential in the oxidation-reduction and hydrogen peroxide catabolic processes, and response to oxidative stress in plants. Based on GO term analysis, BGIOSGA006319 could play important roles in inflorescence development. Meanwhile, BGIOSGA034434 and BGIOSGA009926 are known to respond to various stresses. The rest of the dysregulated genes were divided into three groups, all of which were related to lipids. BGIOSGA009099, BGIOSGA021541, BGIOSGA023124, and BGIOSGA029706 are predicted to be related to cell wall and membrane biogenesis. BGIOSGA004346, BGIOSGA009300, and BGIOSGA031591 are regulators of transmembrane transport. BGIOSGA034249 is involved in phosphorylation-related signal transduction. Further qRT-PCR analysis verified that the expression of selected genes was found different between WT and paa1019 panicles (Figure 7C), and these differences are consistent with the RNA-seq analysis. The results implied that OsCIPK31 regulation is related to the inflorescence development, responses to various stresses, and ROS accumulation by controlling the expression of specific genes.
Functional Enrichment in Response to OsCIPK31 Mutation
GO term analysis revealed that biological process (BP), cellular component (CC), and molecular function (MF) were more enriched in paa1019 panicle abortion than in WT panicle development (Figure 8A). For the top 10 BP terms, the most relevant was lipid transport, consistent with Venn diagram analysis, and basic genetic processes also scored highly. Association of BP terms with defense and hormonal response revealed, abiotic stress and IAA are involved in the regulation of PAA phenotype in paa1019 mutant. Interestingly, the top 10 CC terms were associated with integral membrane components, whereas MF terms were enriched in lipid/protein responses to stress (Figure 8A). Also, based on Kyoto Encyclopedia of Genes and Genomes (KEGG) pathway analysis (Figure 8B), DEGs were mainly associated with lipid/protein regulation pathways such as phenylpropanoid biosynthesis (osa00940), ubiquitin-mediated proteolysis (osa04120), MAPK signaling pathways in plants (osa04016), and plant hormone signal transduction (osa04075; Figure 8B).
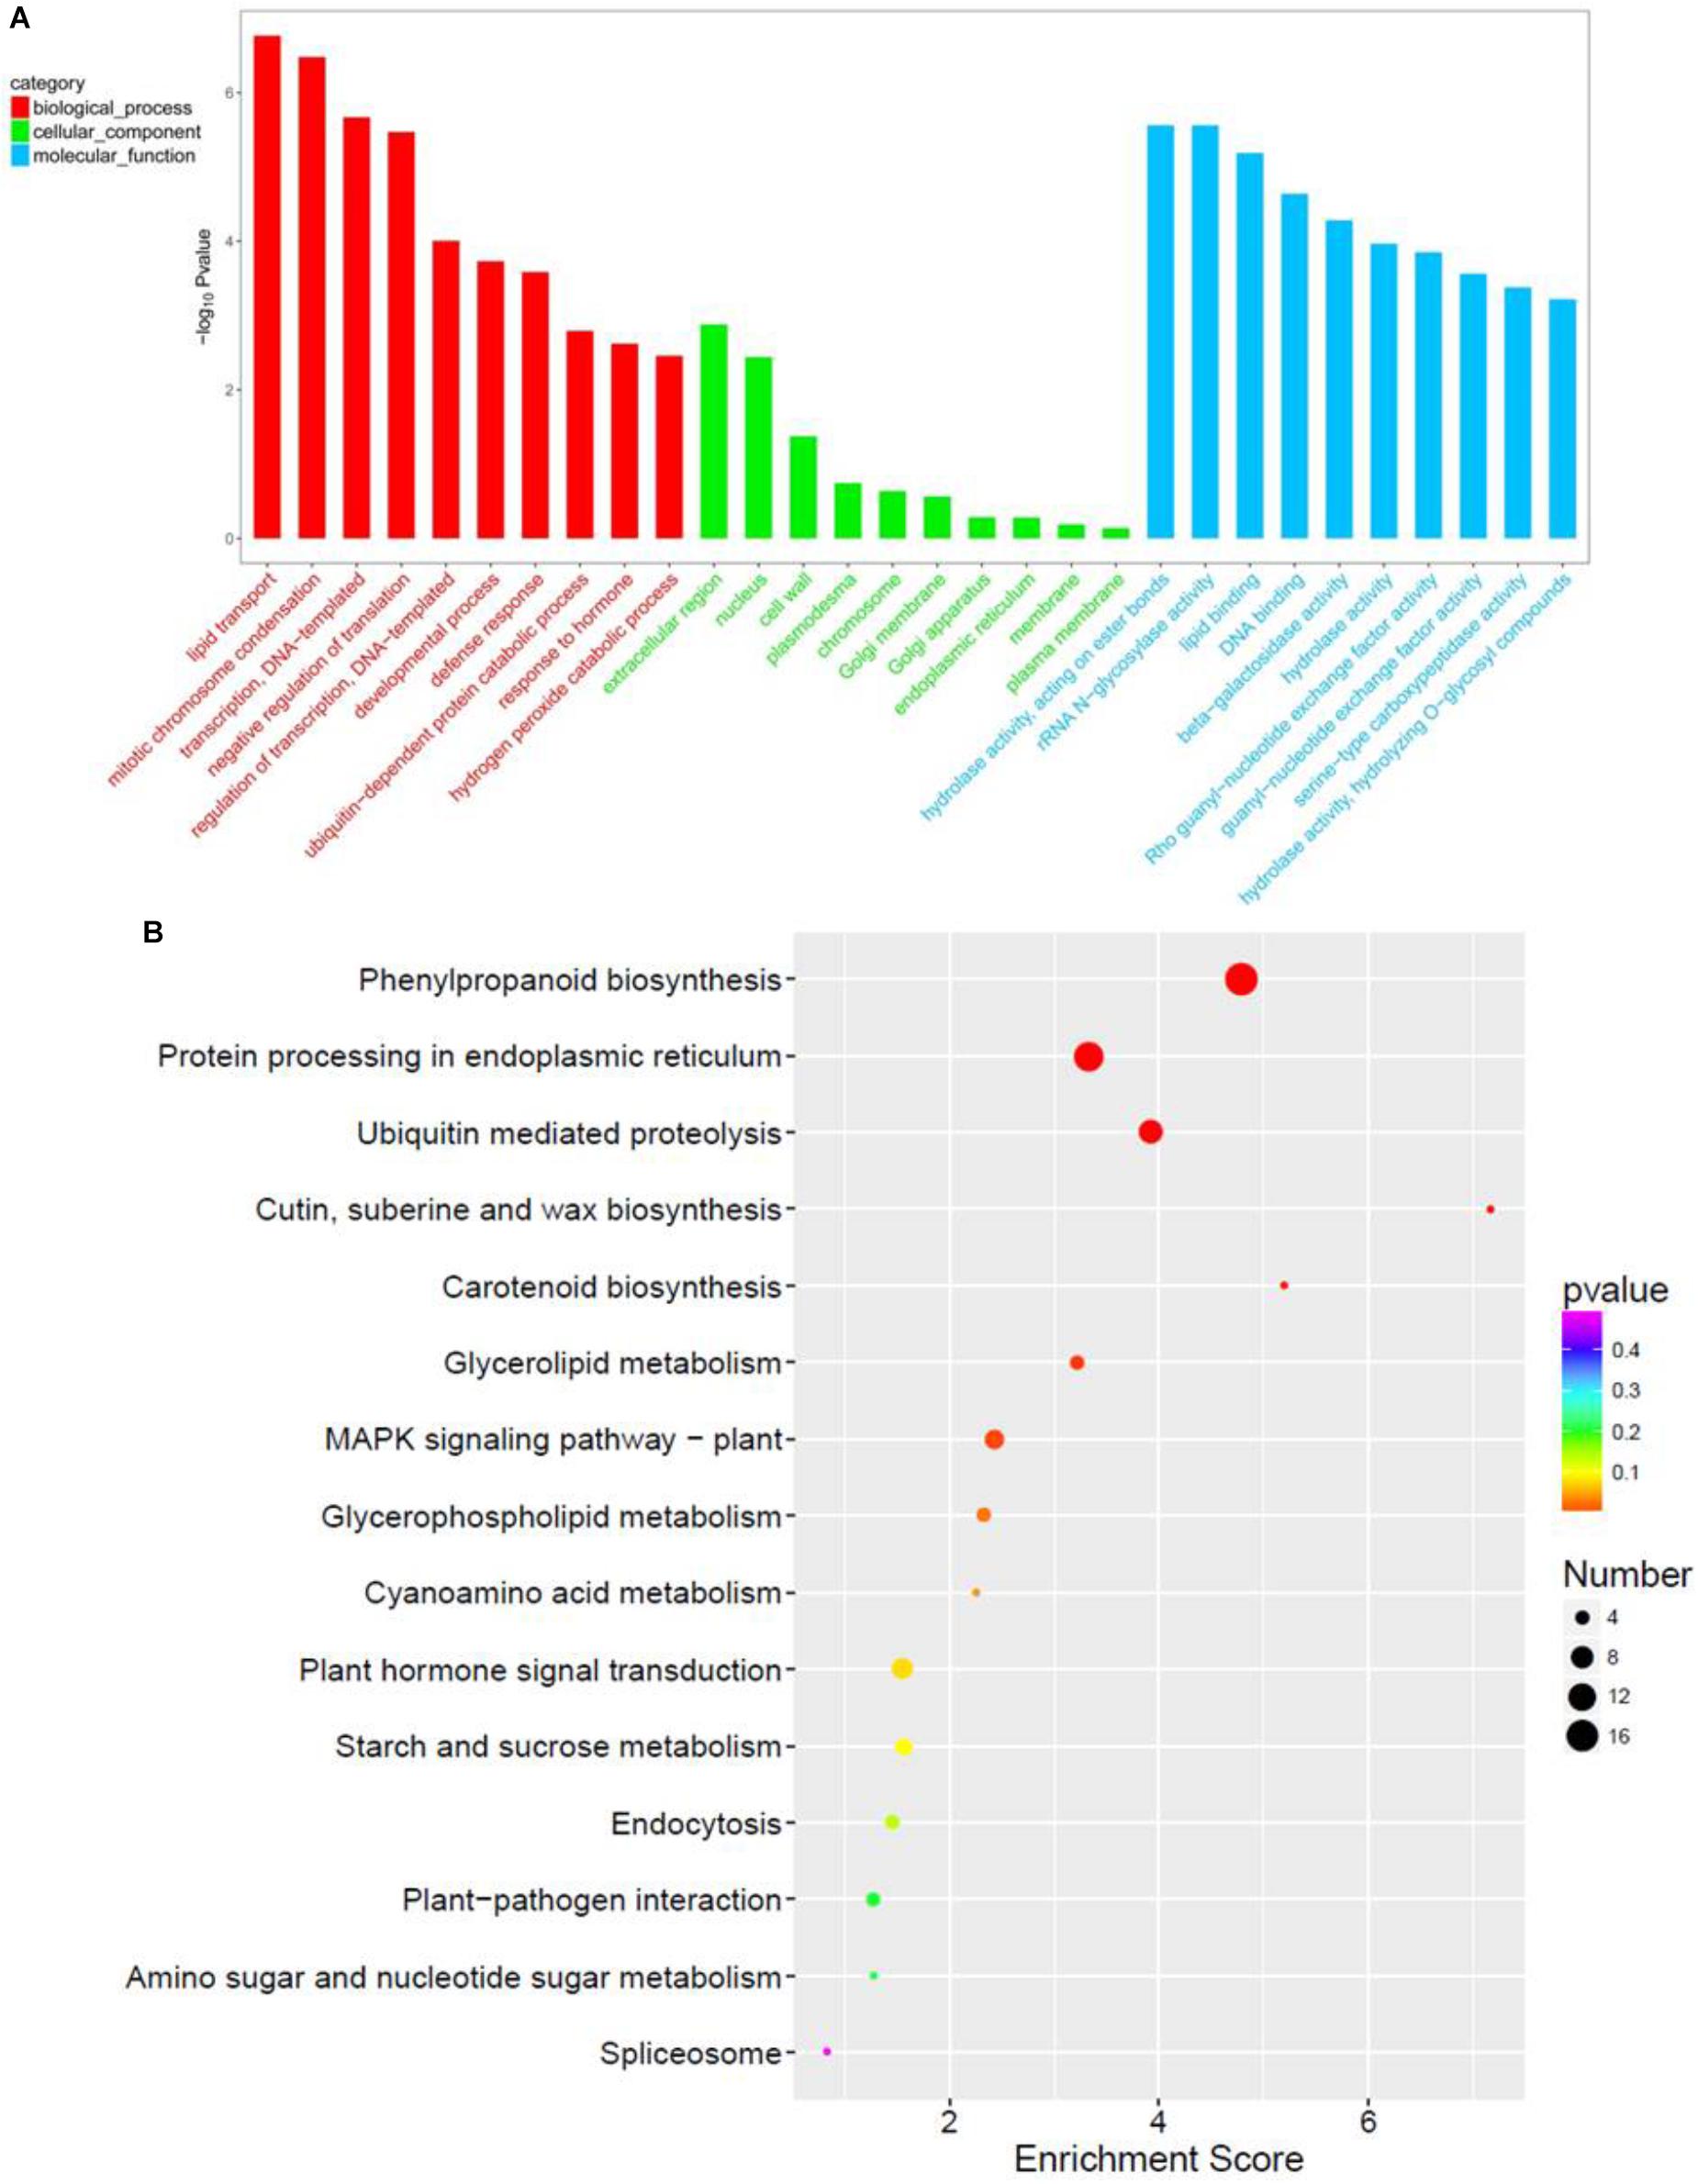
FIGURE 8. Functional enrichment in response to OsCIPK31 mutation. (A) Comparison of GO enrichment analysis. The top 10 significantly enriched GO terms for biological process (BP, cellular component (CC) and molecular function (MF) in PAA relative to normal panicle development in WT plants are shown in red, green, and blue, respectively. (B) Comparison of Kyoto Encyclopedia of Genes and Genomes (KEGG) pathway enrichment. The top 20 significantly enriched KEGG pathways in PAA relative to normal panicle development in WT plants are shown. The x-axis represents the enrichment factor for each pathway, and the y-axis shows the KEGG pathway names. The size of the circle represents the number of genes involved in each significant pathway. The color represents the significance level of the -log (p-value), from red (most significant) to green (least significant).
Furthermore, several representative modules for lipid/protein responses to stress were observed in the cluster analysis, and relevant genes were differentially expressed in different samples (Figure 9A). Furthermore, qRT-PCR showed different expression of important genes in paa1019 than WT panicles, which are regulating different phytohormones involved in the transduction of MAPK signaling pathway (Supplementary Figure S12). These results strongly suggest the MAPK signaling pathway and phytohormone signal transduction are regulated by OsCIPK31. To further explore the connection between these genes and pathways, gene regulatory networks based on protein-protein interactions (PPIs) were constructed. The relative size of each node presents the strength of the correlation. The networks revealed that most genes potentially interacting with OsCIPK31 belong to the MAPK signaling pathway (MPK3/6, CaM4, PP2C, and ANP1) and the plant hormone signal transduction pathway (NPR1, CRE1 and JAZ; Figure 9B). These results suggest that OsCIPK31 might be involved in the regulation of expression of those genes that are involved in MAPK signaling and phytohormonal transduction pathway.
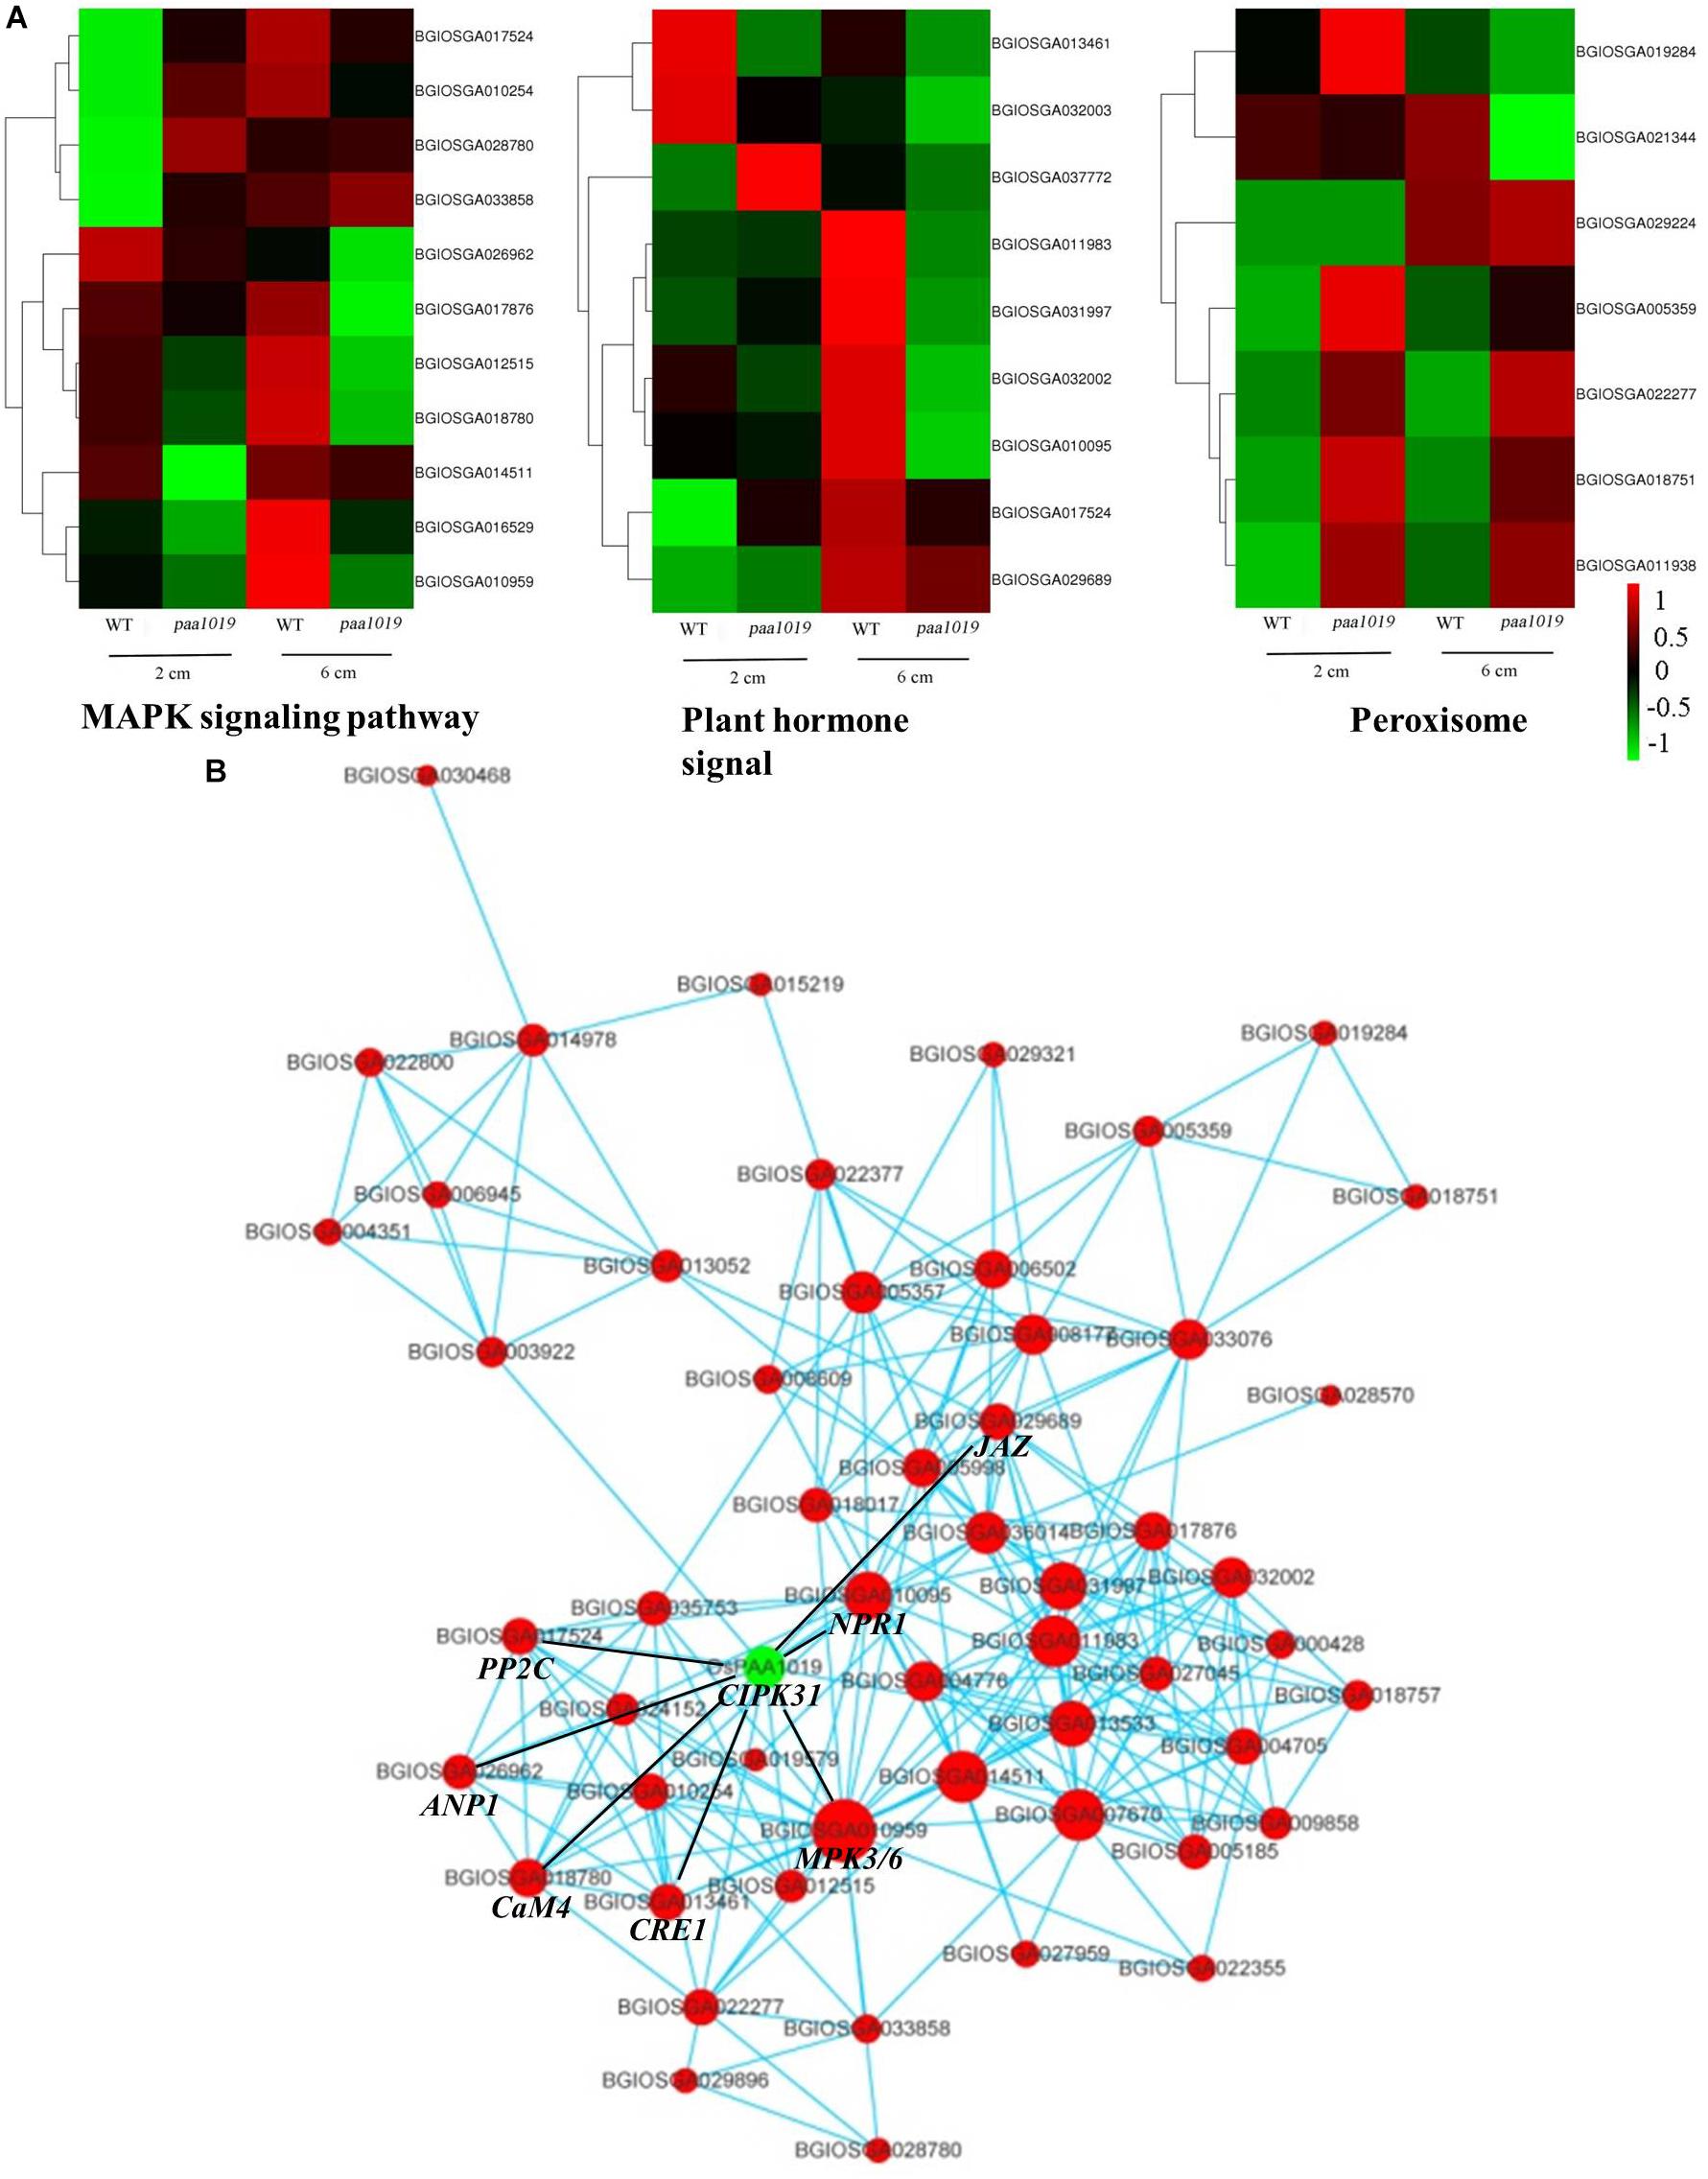
FIGURE 9. Interaction networks involving OsCIPK31 and the most significantly enriched pathways. (A) Comparison of DEGs in different pathways between WT and paa1019 plants. (B) Protein-protein interaction (PPI) networks involving OsCIPK31 and the most significantly enriched pathways (the MAPK signaling pathway, plant hormone signal transduction, peroxisome, and alpha-linolenic acid metabolism).
Discussion
Panicle development is crucial for grain yield in rice, and PAA often causes yield losses during rice production. Commencement of PAA is complex and probably associated with environmental conditions. In this study, we identified OsCIPK31, which encodes CBL-interacting protein kinase OsCIPK31. OsCIPK31 is expressed mainly in roots in response to environmental signals, and regulates the development of panicle apical spikelets, and it can also be influenced with content of phytohormones in the panicles.
Calcineurin B-like proteins (CBLs) are Ca2+ sensors in plant cells that regulate the activity of CBL-interacting protein kinases (CIPKs) (Luan et al., 2002; Kolukisaoglu et al., 2004). CIPKs transmit the calcium-mediated signal downstream, generally by phosphorylating target proteins such as transcription factors or transporters/channels, ultimately triggering appropriate responses. In Arabidopsis, 10 CBLs and 26 CIPKs have been identified (Weinl and Kudla, 2009; Hashimoto et al., 2012), whereas 10 CBLs and 30 CIPKs have been found in O. sativa (Albrecht et al., 2001; Kolukisaoglu et al., 2004). Since the discovery of CBL-CIPKs, most of them have been associated with abiotic stress signaling (Cuéllar et al., 2010; Hu et al., 2012; Ji et al., 2013; Kanwar et al., 2014), and some are also believed to be involved in biotic and/or oxidative stress and in developmental pathways as well (Xiang et al., 2007; Piao et al., 2010; Zhang et al., 2010, 2013). In rice, OsCIPKs are involved in abiotic stress signaling, and 20 OsCIPKs respond to at least one type of any abiotic stress, such as drought, salt, low temperature, or abscisic acid (ABA) (Xiang et al., 2007). OsCK1 (OsCIPK31) is influenced by diverse signaling of cold, salt, light, cytokinins, sugars, and calcium upregulates transcript levels of OsCIPK31. The OsCIPK31 protein phosphorylates itself to a generic substrate, myelin basic protein, in the presence of Mn2+ (Kim et al., 2003). Overexpression of OsCIPK31 (OsCIPK3) enhances cold tolerance (Xiang et al., 2007), as OsCIPK31 modulates responses to abiotic stress during seed germination at various seedling stages, and regulates the expression of stress-responsive genes (Piao et al., 2010). However, further detailed analysis of the role of OsCIPK31 in abiotic stress in rice is needed, with particular attention on crosstalk and the interconnection of CIPK signaling with other signaling pathways such as mitogen-activated protein kinases (MAPKs), phytohormones such as ABA, jasmonic acid (JA), and salicylic acid (SA), and auxin-mediated signaling networks. However, it is not known whether OsCIPK31 is involved in developmental pathways especially in panicle development of rice.
PAA Exhibits Apical Dominance and Is Regulated by Phytohormones, Especially Auxin
Panicle architecture is regulated at several positions where primary branches are formed by genes such as lax1 (Komatsu et al., 2003; Oikawa and Kyozuka, 2009), moc1 (Li et al., 2003), and SP1 is an essential regulator that controls panicle branch elongation processes other than the initiation of branch primordia (Li et al., 2009). However, we found that regulation of PAA development was spatiotemporal. Unlike WT plants in which all young branches elongate normally, development of the top spikelets in the paa1019 mutant (which has young panicles of ∼4 cm) was clearly arrested. OsCIPK31 appears to be an essential regulator that controls panicle branch elongation, especially spikelet development other than the initiation of branch and spikelet primordia. Furthermore, the degree of abortion was correlated with spikelet location.
In general, rice florets on branches at the top of young panicles are the first to appear, and for each branch, apical spikelets are predominant. This implies “apical dominance” during panicle differentiation, and the same trend was also observed in flag leaves (Supplementary Figure S2A). It is widely believed that auxin accumulation in the apical meristem promotes terminal bud growth and inhibits lateral bud growth. Auxin biosynthesis in the apical bud is a characteristic of polar transport, which occurs in panicles from the top to down. Interestingly, this mode of development is consistent with the spatiotemporal features of PAA observed in the present study. Similarly, polar transport of IAA was found to be reduced in the cipk6 mutant, which led to hypocotyl expansion and delayed lateral root development (Tripathi et al., 2009). These observations indicate a relationship between the degree of PAA and auxin accumulation. Herein, we found that IAA levels in young panicles of paa1019 plants were higher than those in WT plants, and BP terms in GO analysis were enriched in responses to plant hormone signals. Also, KEGG pathway analysis showed that many of the identified DEGs were related to phytohormone signal transduction (osa04075). PPI analysis also (Figure 9B) supported that OsCIPK31 might interact with other factors that are associated with the phytohormonal signal transduction pathway. In addition, vessels of vascular bundles in secondary branches were found to be blocked to varying degrees in paa1019, which could explain why material transportation deficiency plummeted. Together, these results suggest auxins affect polar transport, and make a necessary contribution to regulating PAA. In conclusion, auxins appear to affect polar transport and spatiotemporal development of PAA in paa1019 and hormone signaling could be a major factor in determining the development and distribution of PAA.
Mutation in OsCIPK31 Increases Sensitivity to Stress, Accompanying ROS Accumulation in the Panicle
Among the various stresses affecting plant growth and development, abiotic stresses represent a major problem for agricultural production worldwide. PAA is clearly influenced by the external environment. The role of CBL-CIPK signaling in regulating diverse aspects of abiotic stress responses has been thoroughly investigated in Arabidopsis. Recently, studies have shown that CIPKs could regulate the plant development by interacting with CBLs or only itself, so CBLs are not indispensable for CIPK31 functioning (Bender et al., 2018). The CIPK family member CIPK31 is believed to play a role in the regulation of seedling growth in rice. Herein, we found that OsCIPK31 positively regulates cold and salt stress responses, whereas the degree of panicle abortion was negatively regulated by temperature in rice. These results strongly suggest that mutation in OsCIPK31 led to increased sensitivity to cold and salt stresses; hence, the development of paa1019 plants was more susceptible to adverse environmental conditions.
Excessive sensitivity to stress is not usually favorable for plant growth and development, since this can result in higher ROS levels. Indeed, our ROS experiments also indicated excessive H2O2 accumulation in plants suffered PAA. The H2O2 signal was stronger in different developmental stages in apical spikelets of paa1019 plants, and differential expression of genes related to oxidation-reduction and hydrogen peroxide catabolic processes was evident (Figures 7C, 8A).
Usually PMs and cell wall provide a barrier to environmental factors, and are means of plant defense activation by which responses can be initiated (Mongrand et al., 2010). The PM is a medium for exchange of metabolites such as signaling molecules, ions, and hormones (Yadeta et al., 2013). Herein, we found that the PM system of panicle cells was damaged in plants suffering from PAA. The cell wall and cytoplasmic membrane of glumes and stamens in paa1019 were deformed during booting and heading stages. Transcription analysis further confirmed that lipid/protein pathways were affected by OsCIPK31. H2O2 accumulation appears to lead the damage of cellular structures, interrupting the growth of young spikelets, and eventually resulting in cell death.
Mutation in OsCIPK31 increases sensitivity to stresses and disrupt the balance of metabolic pathways of some phytohormones. Paa1019 is susceptible to some environmental stresses that is why the PAA showed a degree of phenotypes under different environment.
Synergistic Effect Between OsCIPK31 and MAPK Pathway Signaling in Response to Environmental Stress
Mitogen-activated protein kinase cascades are involved in several aspects of plant physiology, including cell division, plant growth and development, plant resistance to pathogens, and plant response to abiotic stresses (Liu and He, 2017). There is a complex relationship between the MAPK pathway and ROS. On one hand, ROS activates and regulates MAPK cascades; while on the other hand MAPK cascades could also regulate ROS-related genes and result in initiation of ROS responses. Collectively, ROS and MAPK cascades could induce cell death collectively (Liu and He, 2017). CIPKs have been found to interact with and target a large number of partners including phosphatases (Ohta et al., 2003), transporters/channels (Sánchez-Barrena et al., 2012), transcription factors (Song et al., 2005), and enzymes (Drerup et al., 2013). Here, we also found that PAA was accompanied by programmed cell death (PCD) in paa1019. Excessive ROS accumulation was observed in the young panicle of paa1019 mutant and it also exhibited hypersensitivity to abiotic stress. Furthermore, RNA-seq analysis of WT and paa1019 revealed numerous PAA-related MAPK signaling pathway DEGs. PPI analysis (Figure 9B) predicted that OsCIPK31 might interact with factors that are associated with the MAPK signaling pathway. Based on the above findings, we predicted that OsCIPK31 and MAPK pathway have a synergistic effect to lead to ROS accumulation in response to stresses.
Previous studies have greatly appreciated the role of CIPKs in regulation of various biological processes such as abiotic stress, plant development, and ROS signaling (Pandey, 2008; Batistiè et al., 2012; Tang et al., 2012). OsCIPK31 plays an important role in the regulation of seedling growth and response to stresses in rice (Piao et al., 2010). In this study, we demonstrated that OsCIPK31 is a key factor required to maintain sustained growth of the panicle, and the mutation in OsCIPK31 leads to PAA phenotype. As abortion of spikelets is particularly seen under unfavorable environmental conditions (Itoh et al., 2005; Kato et al., 2008), we found dysregulation is caused by the disruption of the OsCIPK31 function due to excessive accumulation of ROS, which ultimately leads to cell death in rice panicle. MAPK cascades also might take part in response to environmental stresses and regulate ROS metabolism. There is a relationship between PAA distribution and IAA phytohormone accumulation in the panicle (Figure 10). Thus, our discovery provides novel insights into panicle development by OsCIPK31 likely through responding to stresses in rice and other species.
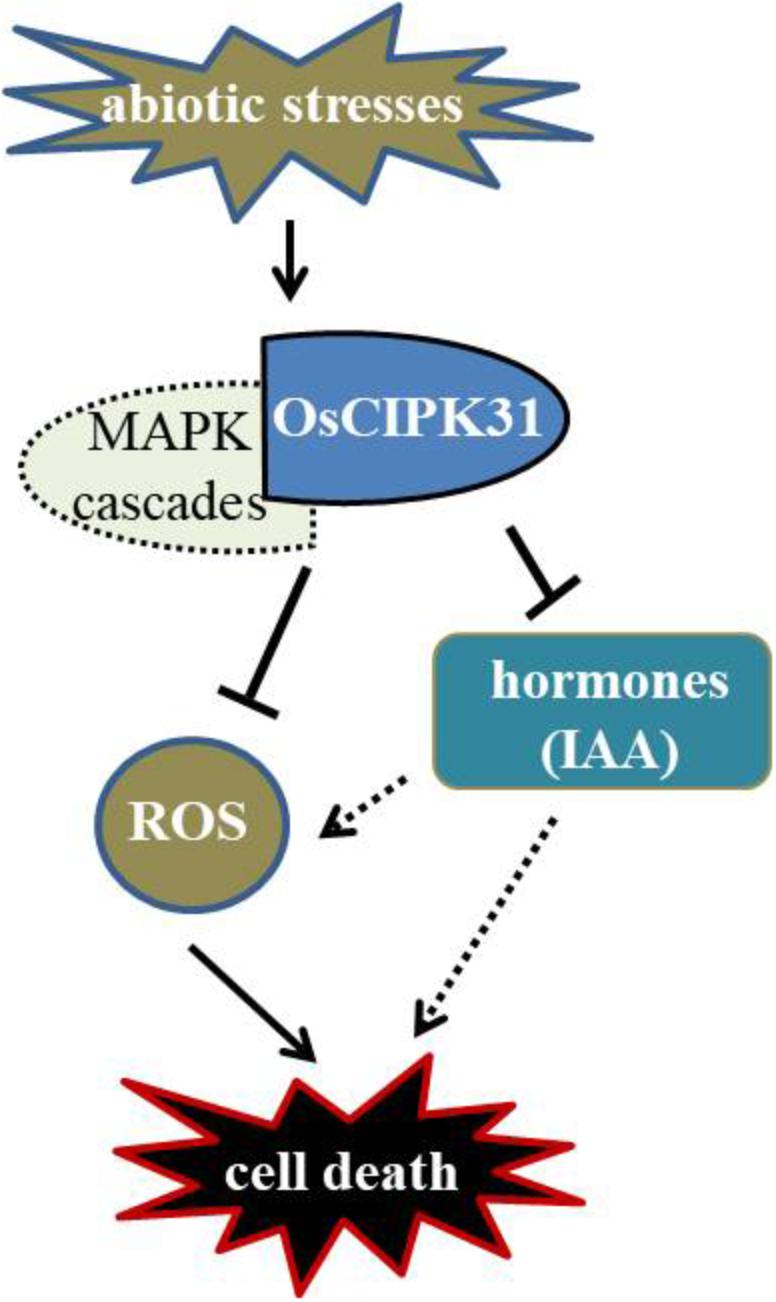
FIGURE 10. Putative regulation of panicle development by OsCIPK31. OsCIPK31 perceives the response against stresses and regulates ROS accumulation, which might be collaboration with MAPK cascades. Meanwhile OsCIPK31 regulates IAA phytohormone distribution in the panicle, and excessive IAA might lead to the ROS accumulation in the apical spikelet, and ROS regulates PCD of the panicle.
Materials and Methods
Plant Materials and Growth Conditions
The stably inherited mutation in paa1019 was derived from the progeny of the excellent indica maintainer line Yixiang 1B, seeds of which were treated with 1% EMS. Yixiang 1B plants are represented as WT plants throughout this work. The 02428 japonica cultivar was obtained from Jiangsu Province Academy of Agricultural Sciences, and paa1019 and F1 plants were self-crossed to generate the F2 population for gene mapping of PAA1019. The paa1019 mutant was also backcrossed with WT Yixiang 1B and self-crossed to create the BC1F2 population. Rice plants were cultivated under natural conditions in an experimental field at Sichuan Agricultural University Rice Research Institute, or at Lingshui, Hainan Province, China.
Determination of Antioxidase Activities
A 0.3 g fresh sample was homogenized in 5 mL of 50 mM TRIS-HCl buffer (pH 7.0) containing 1 mM EDTA, dithiothreitol (DTT), acrylonitrile styrene acrylate copolymer (AsA), reduced glutathione (GSH), and 5 mM MgCl2. Catalase (CAT) activity was determined by measuring the consumption of H2O2 at 240 nm according to the method of Aebi with slight modifications. The reaction mixture consisted of 2.9 mL 50 mM TRIS-HCl buffer (0.1 mM EDTA, pH 7.0), 50 μL 750 mM H2O2, and 50 μL enzyme extract. The consumption of H2O2 was monitored by the decrease in absorbance of light at 240 nm over 3 min. Activity is expressed in units (mM of H2O2 decomposed per min) per g of formula weight (FW).
Glutathione reductase (GR) activity was assessed as described by Foyer and Halliwell (Foyer and Halliwell, 1976) with minor modifications. The 3.0 mL assay mixture consisted of 450 μL of enzyme extract, 2.34 mL 50 mM TRIS-HCl buffer (0.1 mM EDTA, 5 mM MgCl2, pH 7.5), 60 μL 10 mM NADPH, and 150 μL 10 mM oxidized glutathione. The NADPH oxidation rate was monitored by measuring the decrease in absorbance at 340 nm. GR activity is expressed as the amount of enzyme needed to oxidize 1 μmol of NADPH per min per g of FW.
Stress Treatments
Seeds were surface-sterilized with 2% H2O2 for 24 h and washed with flowing water for 1 day. After sterilization, seeds were germinated in nutrient solution at 26°C for 16 h under light conditions, then at 22°C for 8 h in the dark. Two-week-old seedlings were used for stress treatments and subjected to NaCl (50, 100, or 150 mM) and temperatures of 10 or 20°C.
Genetic Analysis and Map-Based Cloning
To identify genes involved in normal panicle and spikelet development in rice, a mutant library of 10,431 accessions of indica cultivar Yixiang 1B was generated using ethyl methane sulfonate (EMS) mutagenesis and screened for PAA mutants. One mutant displaying apical abortion was selected for further genetic and complementation analyses. As detailed below, this mutant was named PAA paa1019. When pollinated with WT pollen grains, all paa1019 F1 progeny displayed the WT phenotype and grew normal panicles. The F2 population derived from the cross of 02428 × paa1019 was used for rough mapping using bulk segregation analysis (BSA). A physical linkage map was then constructed using molecular markers near the PAA1019 locus. The SSR sequences and InDel markers are listed in Supplementary Table S1.
For whole-genome resequencing (Mutmap), the paa1019 was backcrossed with the WT and self-crossed to generate BC1F2 population. The equal total DNA of 25 BC1F2 plants displaying the PAA phenotype was mixed and resequenced by Illumina HiSeq 2500 platform and the WT genome DNA was also sequenced as control. Then raw data (raw reads) of fastq format were first processed through a series of quality control (QC) procedures in-house C scripts. Burrows–Wheeler Aligner (Li and Durbin, 2009) was used to align the clean reads of each sample against the reference genome (93-11 cultivar). ANNOVAR was used to annotate SNP or InDel based on the GFF3 files for the reference genome (Wang et al., 2010). Finally, the difference of the SNP index of two pools was calculated as the delta SNP index.
DNA Extraction, Primer Design, and PCR/qRT-PCR
Total DNA from parental and mutant lines was extracted using the cetyltrimethylammonium bromide (CTAB) method. The SSR markers were designed according to information in the Gramene database1. The InDel primers were designed based on the alignment of the reference genome of 93–11 with sequence of the indica rice cultivar2 and Nipponbare japonica rice cultivar2. The PCR mixtures (20 μL) contained the following components: 2 μL DNA (50 ng/μL), 2 μL primers (10 μmol/μL), 0.3 μL dNTPs (10 mM), 0.2 μL Taq DNA Polymerase (5 U/μL), and 13.5 μL ddH2O. Amplifications were performed using the following procedure: 5 min at 95°C, followed by 33 cycles of 30 s at 95°C, 30 s at 55°C, and 1 min at 72°C, with a final extension at 72°C for 10 min. The PCR products were separated on 3% agarose gels and visualized by ethidium bromide (EB) staining.
Total RNA was extracted from different tissues using TRIZOL (Invitrogen, Carlsbad, CA, United States). First-strand of cDNAs was synthesized using a PrimeScript RT Reagent Kit with gDNA Eraser (TaKaRa Bio Inc., China). Then, qRT-PCR was performed using a C1000 thermal cycler and a Bio-Rad CFX96 Real-Time System (Bio-Rad, Hercules, CA, United States). Relative expression levels of genes were measured relative to OsActin1 and calculated using the 2-ΔΔCt method. The values are presented as means ± SD of three biological repeats. The primers are listed in Supplementary Table S2.
mRNA Sequencing and Analysis of RNA-Seq Data
Analysis of RNA-seq data was performed using the following standard protocol (Trapnell et al., 2012). Total RNA was extracted from 2 cm panicles from control samples, 6 cm panicles from WT plants (WT-1 and WT-2), and from 2 and 6 cm panicles of experimental samples (mutants paa1019-1 and paa1019-2) using TRIZOL. A total of 12 sequencing samples were treated, and each group included three biological replicates. RNA sequencing was performed by OE Biotechnology (Shanghai, China), and sequencing data were retrieved through the standard Illumina pipeline with custom and default parameters. All the 12 raw reads were deposited into the NCBI Sequence Read Archive (SRA) database with accession number SRX4908949∼4908960. Additional filtration was performed by trimming adapter and low-quality sequences. For each sample, STAR software was used for sequence alignment of preprocessed sequences and reference genome sequences (OE Bio Inc., Shanghai, China). Sequences of mouse genes were downloaded from the Ensemble database2. HTSeq software was used to analyze the original sequences of known genes for all the samples (OE Bio Inc., Shanghai, China), and expression of known genes was calculated using the fragments per kilobase of transcript per million fragments mapped (FPKM). Clusters were analyzed by principal component analysis (PCA), and differentially expressed genes (DEGs) were analyzed by DESeq, with cut-offs p-value ≤ 0.05 and fold change (FC) ≥ 2. The distance metric of the Pearson correlation, average linkage, and hierarchical clustering were calculated for the DEGs, and functional annotation was performed using gene set enrichment analysis (GSEA), which includes Gene Ontology (GO) and Kyoto Encyclopedia of Genes and Genomes (KEGG) pathway enrichment. Cytoscape was used to reconstruct the regulatory networks3.
Scanning Electron Microscopy
Shoot apex tissue from the vegetative apices of WT and paa1019 plants was collected and dissected carefully under a sterol microscope, and subsequently fixed in 2.5% glutaraldehyde in 0.1 M phosphate-buffered saline (PBS; 4 mM sodium phosphate, 200 mM NaCl, pH 7.2) at 4°C overnight. After rinsing twice with PBS, the samples were rinsed in 4% (w/v) sucrose solution for 5 min, then dehydrated using a graded series of ethanol (30, 50, 70, 80, 90, 95, and 100%). Finally, the samples were dried in a critical-point drier, sputter-coated with platinum, and observed under bright-field by scanning electron microscopy (Inspect, FEI, United States).
Histological Analysis and RNA in situ Hybridization
Young panicles from WT and paa1019 plants at different developmental stages were collected for ROS analysis using 3,3′-diaminobenzidine (DAB) staining to measure H2O2 accumulation as described previously (Zhu et al., 2016). Trypan blue staining assays were also performed as described previously with minor modifications (Zhu et al., 2016). Briefly, the samples were incubated in lactic acid-phenol-trypan blue solution overnight and destained with buffer (ethanol:acetic acid, 84:16, v/v) for 24 - 48 h. Evans blue staining was performed according to the manufacturer’s instructions4. Paraffin sectioning was done according to previous reports (Ma et al., 2017).
For RNA in situ hybridization, a gene-specific region of OsCIPK31 mRNA was selected as the digoxigenin (DIG)-labeled RNA probe (Roche), and labeled with DIG at the 5′ end. RNA in situ hybridization with detectable probes was performed as described previously (Liu et al., 2015). The probes are listed in Supplementary Table S4.
GUS Staining Assay
β-glucuronidase (GUS) activity was detected according to the instructions supplied with the GUS staining kit5. First, X-gluc powder was dissolved in X-gluc solution (1 mL) and stored at -20°C. Working solution was then obtained by mixing X-gluc with GUS buffer (1:50). The plant tissues were collected and fixed in 90% acetone for 20 min, then vacuum-infiltrated in working solution and incubated at 37°C overnight. After the incubation, the tissues were cleaned in destaining buffer (ethanol:acetic acid, 84:16, v/v) at room temperature. Finally, clean tissue samples were observed under a dissecting microscope (Leica S8APO, Germany).
Subcellular Localization of OsCIPK31
To investigate the subcellular localization of OsCIPK31, the coding sequence of OsCIPK31 was amplified with the primer pair pMD1300-CIPK31-YFP-1 and pMD1300-CIPK31-YFP-2 from the wild-type plant and then cloned into the pMD1300 vector to generate a N-terminal fusion with the yellow fluorescent protein (YFP) under control of the CaMV 35S promoter, resulting in the pMD1300-CIPK31-YFP construct. Rice protoplasts were isolated from the indica cv. 9311 cultivar seedlings leaves (7–15 days after germination with dark treatment, 30°C), and were transformed with the plasmids pMD1300-CIPK31-YFP following the method as described previously (Ren et al., 2013). YFP fluorescence was detected using a confocal laser scanning microscope (Olympus FluoView FV1000, Japan).
Material Content Determination
To measure chlorophyll content, flag leaves (0.2 g) were collected from WT and paa1019 plants and soaked in 20 mL of 95% alcohol for 48 h in the dark, then examined spectrophotometrically at 665 and 649 nm (in triplicate). The following formulae were then applied: Chl a absorbance = (13.95 × OD665) – (6.88 × OD649); Chl b absorbance = (24.96 × OD649) – (7.32 × OD665); Chlorophyll content (mg/g) = (C × V × D)/(1000 × W) (where C = absorbance, V = volume, D = dilution, and W = weight of sample).
The water content (WC) of seedlings was calculated using the following formula: WC [%] = [(fresh weight – dry weight)/fresh weight] × 100 (Kim et al., 2005). Determination of IAA content was carried out using the enzyme-linked immunosorbent assay (ELISA) method as previously described (Teng et al., 2006).
Vector Construction and Plant Transformation
A 5.7 kb genomic fragment containing the 2 kb native promoter and the entire CIPK31 gene sequence was cloned into the pBWA(V)BII vector to generate the pBWA(V)BII-PROCIPK31:CIPK31 complementation construct. To generate the CIPK31-CRISPER/Cas9 construct, two sites of the 20 nt guide RNA (gRNA) targeting the CIPK31 coding sequence were amplified and cloned into the pCRISPR/CAS9–MT vector as described previously (Ma X. et al., 2015). For promoter-GUS assays, the genomic fragment of the complementation construct was amplified and cloned into the pBWA(V)BII-GUS vector. The promoter and full-length coding sequence of OsCIPK31 were separately amplified with pMD1300-CIPK31-YFP-1 and pMD1300-CIPK31-YFP-2 markers, and the resulting PCR products were cloned into the pMD1300-YFP vector. All the resulting constructs were introduced into rice using the Agrobacterium tumefaciens-mediated transformation method. Primers used for vector construction are listed in Supplementary Table S5.
Author Contributions
XW designed and performed the project. YP, FH, and QB performed the analysis of agronomic traits, histochemical staining, stress treatment, and assessed rice stress resistance. YP, FH, and AA carried out genetic analysis, map-based cloning assay. YP and TW performed the mutation analysis and sequence analysis. YP, YL, and PX performed the vector construction and plant transformation. XD, CG, HZ, YP, and XC assisted in the data analysis. YP, AA, and XW wrote the manuscript. All the authors read and approved the final manuscript.
Funding
This work was supported by grants from the National Key Research and Development Program of China (Grant No. 2016YFD0100406), The Special Scientific Research Project of Agricultural Public Welfare of MOA, China (Grant No. 201403002-3), and the National Natural Science Foundation of China (Grant No. 31430072).
Conflict of Interest Statement
The authors declare that the research was conducted in the absence of any commercial or financial relationships that could be construed as a potential conflict of interest.
Supplementary Material
The Supplementary Material for this article can be found online at: https://www.frontiersin.org/articles/10.3389/fpls.2018.01661/full#supplementary-material
FIGURE S1 | Phenotypes of the paa1019 mutant. (A-D) Agronomic traits of wild-type (WT) and paa1019 mutant plants. (A) Duration. (B) Tilling number. (C) Secondary branch number. (D) Abortion rate. Statistical analysis was performed using Student’s t-tests, ∗p < 0.05, ∗∗p < 0.01.
FIGURE S2 | Phenotype of leaves. (A) The color of leaves in paa1019 is more yellow than in WT plants. (B-E) Content of chlorophyll (B), carotene (C), net photosynthetic rate (D), and organic acids (E). ∗p < 0.05, ∗∗p < 0.01.
FIGURE S3 | The alternative splicing of PAA1019 gene. (A) The pair of primers used for RT-PCR analysis. The forward and reverse primers were located in 1st and 5th exons, respectively. (B) RT-PCR analysis showing the presence of the abnormal size transcript of paa1019. The primers were used for amplification that is given in (A), where larger transcript was of WT (due to 2nd exon) and smaller transcript was of paa1019. The genomic DNA was used as a control. (C) The alternative splicing of PAA1019 gene in paa1019. The boxes are indicating exons, whereas the dotted lines indicate base sequences. The deleted region is highlighted in red (2nd exon), whereas base substitution is highlighted in green (that was located between the boundary of 1st intron and 2nd exon). (D) Sequencing and alignment of CDS obtained in B (WT and paa1019) showed the deletion of entire 2nd exon in paa1019. (E) Sequencing and alignment of DNA obtained in (B) revealed a base substitution from G to A in paa1019.
FIGURE S4 | Relative expression of OsCIPK31 in WT, paa1019, and complementation lines. CE1-CE3 represent the three complementation transgenic lines. Statistical analysis was performed using Student’s t-tests.
FIGURE S5 | The sgRNA target sequence analysis of the knock-out lines. Different mutation at the target site in three representative knock-out lines generated by the CRISPR/Cas9 technology. The filled bars and lines are indicating exons and introns of OsCIPK31, respectively. The knock-out target region was located in the fourth exon of OsCIPK31. Mutation types of KO1 and KO3 (knock-out lines) were substitution. While the mutation type of KO2 was insertion. These mutations led to the premature termination of translation in three lines (the terminator codon is not shown in KO2 sequence). The black line indicates sgRNA target sequences. The red and green triangles are indicating the substitutive and inserted sites, respectively. OsCIPK31_DNA, OsCIPK31_CDS, and KO1/2/3 are indicating OsCIPK31 genomic, CDS, and three knock-out transgenic lines cDNA sequences, respectively. KO1/2/3 coding amino acid is indicating the corresponding amino acid sequences, where red color is depicting changed amino acid and ∗ to a termination codon.
FIGURE S6 | Development of flowers is arrested in the degraded spikelets of paa1019 plants. (A–J) Phenotype of flower development observed at different growth stages. (A,B) = 20 DBF; (C,D) = 15 DBF; (E,F) = 10 DBF; (G,H) = 5 DBF; (I,J) = flowering stage; (K-L) KI staining of pollen. DBF indicated days before flowering. Scale bar = 0.2 cm (A-J).
FIGURE S7 | The abortion rate is influenced by the environmental temperature.
FIGURE S8 | Activity of CAT and GR enzymes following different treatments. (A,B) Activity of CAT and GR enzymes following the cold treatments; (C,D) activity of CAT and GR enzymes following the salt treatments. ∗p < 0.05, ∗∗p < 0.01.
FIGURE S9 | The lethal duration following different treatments.
FIGURE S10 | Relative expression of OsCIPK31 in wild-type. Tissues including young roots, young leaves, 0–20 cm panicles (40–70 days after germination) and stems, panicle neck, adult roots, adult leaves, stamens (80 days after germination). Rice ACTIN was used as an internal control. Data are presented as mean ± SE (n = 3).
FIGURE S11 | Differentially expressed genes (DEGs) between WT and paa1019 plants. (A,B) Heatmap showing the expression patterns of significantly dysregulated genes for WT-2 cm vs. paa1019-2 cm (A) and WT-6 cm vs. paa1019-6 cm (B) groups. According to DEGs analysis, significantly dysregulated genes displayed a fold change (FC) ≥ 2 and a p-value ≤ 0.05. (C,D) Volcano plot of DEGs in paa1019-2 cm (C) and paa1019-6 cm (D) relative to controls. DEGs were selected based on a false discovery rate (FDR) < 0.05 and a |log2 fold change| > 1.0. The x-axis shows the fold change in gene expression between paa1019-2 cm (C) and paa1019-6 cm (D) relative to controls, and the y-axis shows the –log10 (FDR). Blue splashes indicate genes not exhibiting significant differences in expression. Red splashes indicate significantly upregulated genes. Green splashes indicate significantly downregulated genes. Gray splashes indicate unfiltered genes.
FIGURE S12 | Relative expression of genes related to MAPK signaling pathway and phytohormone signal transduction. (A) Relative expression of genes related to MAPK signaling pathway. (B) Relative expression of genes related to phytohormone signal transduction. Rice ACTIN was used as an internal control. Data are presented as mean ± SE (n = 3). ∗p < 0.05, ∗∗p < 0.01.
TABLE S1 | Polymorphic molecular markers used for mapping.
TABLE S2 | Primers used for qRT-PCR.
TABLE S3 | GO terms.
TABLE S4 |LOC_Os03g20380 probe used for RNA in situ hybridization.
TABLE S5 | Primers used to generate transgenic constructs.
Footnotes
- ^http://www.gramene.org/microsat
- ^http://plants.ensembl.org/Oryza_indica/Info/Index
- ^www.cytoscape.org/
- ^www.solarbio.com
- ^www.biosharp.cn
References
Albrecht, V., Ritz, O., Linder, S., Harter, K., and Kudla, J. (2001). The NAF domain defines a novel protein–protein interaction module conserved in Ca2+-regulated kinases. EMBO J. 20, 1051–1063. doi: 10.1093/emboj/20.5.1051
Ansari, T. H., Yamamoto, Y., Yoshida, T., Miyazaki, A., and Wang, Y. (2003). Cultivar differences in the number of differentiated spikelets and percentage of degenerated spikelets as determinants of the spikelet number per panicle in relation to dry matter production and nitrogen absorption.Soil Sci. Plant Nutr. 49, 433–444. doi: 10.1080/00380768.2003.10410029
Ashikari, M., Sakakibara, H., Lin, S., Yamamoto, T., Takashi, T., Nishimura, A., et al. (2005). Cytokinin oxidase regulates rice grain production. Science 309, 741–745. doi: 10.1126/science.1113373
Bai, J., Zhu, X., Wang, Q., Zhang, J., Chen, H., Dong, G., et al. (2015). Rice TUTOU1 encodes a suppressor of CAMP receptor-like protein that is important for actin organization and panicle development. Plant Physiol. 169, 1179. doi: 10.1104/pp.15.00229
Batistiè, O., Rehers, M., Akerman, A., Schl Cking, K., Steinhorst, L., Yalovsky, S., et al. (2012). S-acylation-dependent association of the calcium sensor CBL2 with the vacuolar membrane is essential for proper abscisic acid responses. Cell Res. 22, 1155–1168. doi: 10.1038/cr.2012.71
Bender, K. W., Zielinski, R. E., and Huber, S. C. (2018). Revisiting paradigms of Ca2+ signaling protein kinase regulation in plants. Biochem. J. 475, 207–223. doi: 10.1042/BCJ20170022
Bradley, D., Carpenter, R., Copsey, L., Vincent, C., Rothstein, S., and Coen, E. (1996). Control of inflorescence architecture in antirrhinum. Nature 379, 791–797. doi: 10.1038/379791a0
Bradley, D., Ratcliffe, O., Vincent, C., Carpenter, R., and Coen, E. (1997). Inflorescence commitment and architecture in Arabidopsis. Science 275, 80–83. doi: 10.1126/science.275.5296.80
Cheng, Z., Mao, B., Gao, S., Zhang, L., Wang, J., Lei, C., et al. (2011). Fine mapping of QPAA8, a gene controlling panicle apical development in rice. J. Integr. Plant Biol. 53, 710–718. doi: 10.1111/j.1744-7909.2011.01055.x
Chenjia, S., Youhuang, B., Suikang, W., Saina, Z., Yunrong, W., Ming, C., et al. (2010). Expression profile of Pin, Aux/Lax and Pgp auxin transporter gene families in Sorghum bicolor under phytohormone and abiotic stress. FEBS J. 277, 2954–2969. doi: 10.1111/j.1742-4658.2010.07706.x
Cuéllar, T., Pascaud, F., Verdeil, J. L., Torregrosa, L., Adam-Blondon, A. F., Thibaud, J. B., et al. (2010). A grapevine Shaker inward K+ channel activated by the calcineurin B-like calcium sensor 1–protein kinase CIPK23 network is expressed in grape berries under drought stress conditions. Plant J. Cell Mol. Biol. 61, 58–69. doi: 10.1111/j.1365-313X.2009.04029.x
Drerup, M. M., Schlücking, K., Hashimoto, K., Manishankar, P., Steinhorst, L., Kuchitsu, K., et al. (2013). The calcineurin B-like calcium sensors CBL1 and CBL9 together with their interacting protein kinase CIPK26 regulate the Arabidopsis NADPH oxidase RBOHF. Mol. Plant 6, 559–569. doi: 10.1093/mp/sst009
Foyer, C. H., and Halliwell, B. (1976). The presence of glutathione and glutathione reductase in chloroplasts: a proposed role in ascorbic acid metabolism. Planta 133, 21–25. doi: 10.1007/BF00386001
Gomez, J. M., Jimenez, A., Olmos, E., and Sevilla, F. (2004). Location and effects of long-term NaCl stress on superoxide dismutase and ascorbate peroxidase isoenzymes of pea (Pisum sativum cv. Puget) chloroplasts. J. Exp. Bot. 55, 119–130. doi: 10.1093/jxb/erh013
González, F. G., Miralles, D. J., and Slafer, G. A. (2011). Wheat floret survival as related to pre-anthesis spike growth. J. Exp. Bot. 62, 4889–4901. doi: 10.1093/jxb/err182
Han, Y., Yang, H., and Jiao, Y. (2014). Regulation of inflorescence architecture by cytokinins. Front. Plant Sci. 5:669. doi: 10.3389/fpls.2014.00669
Hashimoto, K., Eckert, C., Ansch, T. Z. U., Scholz, M., Held, K., Waadt, R., et al. (2012). Phosphorylation of calcineurin B-like (CBL) calcium sensor proteins by their CBL-interacting protein kinases (CIPKS) is required for full activity of CBL-CIPK complexes toward their target proteins. J. Biol. Chem. 287, 7956–7968. doi: 10.1074/jbc.M111.279331
Heng, Y., Wu, C., Long, Y., Luo, S., Ma, J., Chen, J., et al. (2018). OSALMT7 maintains panicle size and grain yield in rice by 3 mediating malate transport. Plant Cell 30, 889–906. doi: 10.1105/tpc.17.00998
Hu, D., Li, M., Luo, H., Dong, Q., Yao, Y., You, C., et al. (2012). Molecular cloning and functional characterization of MDSOS2 reveals its involvement in salt tolerance in apple callus and Arabidopsis. Plant Cell Rep. 31, 713–722. doi: 10.1007/s00299-011-1189-5
Itoh, J. I., Nonomura, K. I., Ikeda, K., Yamaki, S., Inukai, Y., Yamagishi, H., et al. (2005). Rice plant development: from zygote to spikelet. Plant Cell Physiol. 46, 23–47. doi: 10.1093/pcp/pci501
Ji, H., Pardo, J. M., Batelli, G., Oosten, M. J. V., Bressan, R. A., and Li, X. (2013). The salt overly sensitive (Sos) pathway: established and emerging roles. Mol. Plant 6, 275–286. doi: 10.1093/mp/sst017
Kanwar, P., Sanyal, S. K., Tokas, I., Yadav, A. K., Pandey, A., Kapoor, S., et al. (2014). Comprehensive structural, interaction and expression analysis of CBL and CIPK complement during abiotic stresses and development in rice. Cell Calcium 56, 81–95. doi: 10.1016/j.ceca.2014.05.003
Kato, Y., Hirotsu, S., Nemoto, K., and Yamagishi, J. (2008). Identification of QTLS controlling rice drought tolerance at seedling stage in hydroponic culture. Euphytica 160, 423–430. doi: 10.1007/s10681-007-9605-1
Kellogg, E. A., Camara, P. E., Rudall, P. J., Ladd, P., Malcomber, S. T., Whipple, C. J., et al. (2013). Early inflorescence development in the grasses (Poaceae). Front. Plant Sci. 4:250. doi: 10.3389/fpls.2013.00250
Kim, D. W., Rakwal, R., Agrawal, G. K., Jung, Y. H., Shibato, J., Jwa, N. S., et al. (2005). A hydroponic rice seedling culture model system for investigating proteome of salt stress in rice leaf. Electrophoresis 26, 4521–4539. doi: 10.1002/elps.200500334
Kim, K. N., Lee, J. S., Han, H., Choi, S. A., Go, S. J., and Yoon, I. S. (2003). Isolation and characterization of a novel rice Ca2+-regulated protein kinase gene involved in responses to diverse signals including cold, light, cytokinins, sugars and salts. Plant Mol. Biol. 52, 1191–1202. doi: 10.1023/B:PLAN.0000004330.62660.a2
Kobayasi, K., and Imaki, T. (2008). Varietal differences of rice in differentiation and degeneration of secondary rachis-branches and spikelets in terms of their nodal distribution on a rachis. Jpn. J. Crop Sci. 66, 578–587. doi: 10.1626/jcs.66.578
Kolukisaoglu, U., Weinl, S., Blazevic, D., Batistic, O., and Kudla, J. (2004). Calcium sensors and their interacting protein kinases: genomics of the Arabidopsis and rice Cbl-Cipk signaling networks. Plant Physiol. 134, 43–58. doi: 10.1104/pp.103.033068
Komatsu, K., Maekawa, M., Ujiie, S., Satake, Y., Furutani, I., Okamoto, H., et al. (2003). Lax and Spa: major regulators of shoot branching in rice. Proc. Natl. Acad. Sci. U.S.A. 100, 11765–11770. doi: 10.1073/pnas.1932414100
Komatsu, M., Maekawa, M., Shimamoto, K., and Kyozuka, J. (2001). The LAX1 and FRIZZY PANICLE 2 genes determine the inflorescence architecture of rice by controlling rachis-branch and spikelet development. Dev. Biol. 231, 364–373. doi: 10.1006/dbio.2000.9988
Li, H., and Durbin, R. (2009). Fast and Accurate Short Read Alignment With Burrows–Wheeler Transform. Oxford: Oxford University Press.
Li, S., Qian, Q., Fu, Z., Zeng, D., Meng, X., Kyozuka, J., et al. (2009). Short panicle1 encodes a putative PTR family transporter and determines rice panicle size. Plant J. 58, 592–605. doi: 10.1111/j.1365-313X.2009.03799.x
Li, X., Qian, Q., Fu, Z., Wang, Y., Xiong, G., Zeng, D., et al. (2003). Control of tillering in rice. Nature 422, 618–621. doi: 10.1038/nature01518
Liu, L., Tong, H., Xiao, Y., Che, R., Xu, F., Hu, B., et al. (2015). Activation of big grain1 significantly improves grain size by regulating auxin transport in rice. Proc. Natl. Acad. Sci. U.S.A. 112, 11102–11107. doi: 10.1073/pnas.1512748112
Liu, Y., and He, C. (2017). A review of redox signaling and the control of Map kinase pathway in plants. Redox Biol. 11, 192–204. doi: 10.1016/j.redox.2016.12.009
Lu, H., Dai, Z., Li, L., Wang, J., Miao, X., and Shi, Z. (2017). Osramosa2 shapes panicle architecture through regulating pedicel length. Front. Plant Sci. 8:1538. doi: 10.3389/fpls.2017.01538
Luan, S., Kudla, J., Rodriguez-Concepcion, M., Yalovsky, S., and Gruissem, W. (2002). Calmodulins and calcineurin B-like proteins: calcium sensors for specific signal response coupling in plants. Plant Cell 14(Suppl.), S389–S400. doi: 10.1105/tpc.001115
Luo (2016). Positional Cloning of Rice Panicle Apical Development-Related Gene PAA2. Beijing: Chinese Academy of Agricultural Sciences.
Ma, X., Zhang, Q., Zhu, Q., Liu, W., Chen, Y., Qiu, R., et al. (2015). A robust Crispr/Cas9 system for convenient, high-efficiency multiplex genome editing in monocot and dicot plants. Mol. Plant 8, 1274–1284. doi: 10.1016/j.molp.2015.04.007
Ma, Y., Dai, X., Xu, Y., Luo, W., Zheng, X., Zeng, D., et al. (2015). COLD1 confers chilling tolerance in rice. Cell 160, 1209–1221. doi: 10.1016/j.cell.2015.01.046
Ma, Y., Yang, C., He, Y., Tian, Z., and Li, J. (2017). Rice ovate family protein 6 regulates plant development and confers resistance to drought and cold stresses. J. Exp. Bot. 68, 4885–4898. doi: 10.1093/jxb/erx309
Mcsteen, P. (2009). Hormonal regulation of branching in grasses. Plant Physiol. 149, 46–55. doi: 10.1104/pp.108.129056
Mongrand, S., Stanislas, T., Bayer, E. M., Lherminier, J., and Simon-Plas, F. (2010). Membrane rafts in plant cells. Trends Plant Sci. 15, 656–663. doi: 10.1016/j.tplants.2010.09.003
Nakagawa, M., Shimamoto, K., and Kyozuka, J. (2002). Overexpression of RCN1 and RCN2, rice terminal flower 1/Centroradialis homologs, confers delay of phase transition and altered panicle morphology in rice. Plant J Cell Mol. Biol. 29, 743–750. doi: 10.1046/j.1365-313X.2002.01255.x
Ohta, M., Guo, Y., Halfter, U., and Zhu, J. (2003). A novel domain in the protein kinase SOS2 mediates interaction with the protein phosphatase 2C ABI2. Proc. Natl. Acad. Sci. U.S.A. 100, 11771–11776. doi: 10.1073/pnas.2034853100
Oikawa, T., and Kyozuka, J. (2009). Two-step regulation of LAX PANICLE1 protein accumulation in axillary meristem formation in rice. Plant Cell 21, 1095-1108. doi: 10.1105/tpc.108.065425
Pandey, G. K. (2008). Emergence of a novel calcium signaling pathway in plants: CBL-Cipk signaling network. Physiol. Mol. Biol. Plants Int. J. Funct. Plant Biol. 14, 51–68. doi: 10.1007/s12298-008-0005-3
Piao, H. L., Xuan, Y. H., Park, S. H., Je, B. I., Park, S. J., Park, S. H., et al. (2010). OSCIPK31, a CBL-interacting protein kinase is involved in germination and seedling growth under abiotic stress conditions in rice plants. Mol. Cells 30, 19–27. doi: 10.1007/s10059-010-0084-1
Ren, D., Li, Y., Zhao, F., Sang, X., Shi, J., and Wang, N. (2013). Multi-Floret Spikelet1, which encodes an AP2/ERF protein, determines spikelet meristem fate and sterile lemma identity in rice. Plant Physiol. 162, 872–884. doi: 10.1104/pp.113.216044
Sakamoto, T., and Matsuoka, M. (2004). Generating high-yielding varieties by genetic manipulation of plant architecture. Curr. Opin. Biotechnol. 15, 144–147. doi: 10.1016/j.copbio.2004.02.003
Sakamoto, T., and Matsuoka, M. (2008). Identifying and exploiting grain yield genes in rice. Curr. Opin. Plant Biol. 11, 209–214. doi: 10.1016/j.pbi.2008.01.009
Sánchez-Barrena, M. J., Mart Nez-Ripoll, M., and Albert, A. (2012). Structural biology of a major signaling network that regulates plant abiotic stress: the CBL. Int. J. Mol. Sci. 14, 5734–5749. doi: 10.3390/ijms14035734
Senanayake, N., Naylor, R. E. L., Datta, S. K. D., and Thomson, W. J. (1994). Variation in development of contrasting rice cultivars. J. Agric. Sci. 123, 35–39. doi: 10.1017/S0021859600067745
Song, C. P., Agarwal, M., Ohta, M., Guo, Y., Halfter, U., Wang, P., et al. (2005). Role of an Arabidopsis AP2/EREBP-type transcriptional repressor in abscisic acid and drought stress responses. Plant Cell 17, 2384–2396. doi: 10.1105/tpc.105.033043
Tabuchi, H., Zhang, Y., Hattori, S., Omae, M., Shimizu-Sato, S., Oikawa, T., et al. (2011). LAX PANICLE2 of rice encodes a novel nuclear protein and regulates the formation of axillary meristems. Plant Cell 23, 3276–3287. doi: 10.1105/tpc.111.088765
Tan, C., Sun, Y., Xu, H., and Yu, S. (2011). Identification of quantitative trait locus and epistatic interaction for degenerated spikelets on the top of panicle in rice. Plant Breed. 130, 177–184. doi: 10.1111/j.1439-0523.2010.01770.x
Tang, R. J., Liu, H., Yang, Y., Yang, L., Gao, X. S., Garcia, V. J., et al. (2012). Tonoplast calcium sensors CBL2 and CBL3 control plant growth and ion homeostasis through regulating V-Atpase activity in Arabidopsis. Cell Res. 22, 1650–1665. doi: 10.1038/cr.2012.161
Teng, N., Wang, J., Chen, T., Wu, X., Wang, Y., and Lin, J. (2006). Elevated CO2 induces physiological, biochemical and structural changes in leaves of arabidopsis thaliana. New Phytol. 172, 92–103. doi: 10.1111/j.1469-8137.2006.01818.x
Trapnell, C., Roberts, A., Goff, L., Pertea, G., Kim, D., Kelley, D. R., et al. (2012). Differential gene and transcript expression analysis of Rna-seq experiments with TopHat and Cufflinks. Nat. Protoc. 7, 562–578. doi: 10.1038/nprot.2012.016
Tripathi, V., Parasuraman, B., Laxmi, A., and Chattopadhyay, D. (2009). CIPK6, a CBL-interacting protein kinase is required for development and salt tolerance in plants. Plant J. 58, 778–790. doi: 10.1111/j.1365-313X.2009.03812.x
Wang, K., Li, M., and Hakonarson, H. (2010). ANNOVAR: functional annotation of genetic variants from high-throughput sequencing data. Nucleic Acids Res. 38, e164. doi: 10.1093/nar/gkq603
Wang, Y., and Li, J. (2008). Molecular basis of plant architecture. Annu. Rev. Plant Biol. 59, 253–279. doi: 10.1146/annurev.arplant.59.032607.092902
Weinl, S., and Kudla, J. (2009). The CBL-CIPK Ca(2+)-decoding signaling network: function and perspectives. New Phytol. 184, 517–528. doi: 10.1111/j.1469-8137.2009.02938.x
Xiang, Y., Huang, Y., and Xiong, L. (2007). Characterization of stress-responsive CIPK genes in rice for stress tolerance improvement. Plant Physiol. 144, 1416. doi: 10.1104/pp.107.101295
Xu, H., Sun, Y., Zhou, H., and Yu, S. (2007). Development and characterization of contiguous segment substitution lines with background of an elite restorer line. Acta Agronomica Sinica 33, 979–986.
Yadeta, K. A., Elmore, J. M., and Coaker, G. (2013). Advancements in the analysis of the Arabidopsis plasma membrane proteome. Front. Plant Sci. 4:86. doi: 10.3389/fpls.2013.00086
Yamagishi, J., Miyamoto, N., Hirotsu, S., Laza, R. C., and Nemoto, K. (2004). QTLS for branching, floret formation, and pre-flowering floret abortion of rice panicle in a temperate japonica × tropical japonica cross. Theor. Appl. Genet. 109, 1555–1561. doi: 10.1007/s00122-004-1795-5
Zhang, D., and Yuan, Z. (2014). Molecular control of grass inflorescence development. Annu. Rev. Plant Biol. 65, 553–578. doi: 10.1146/annurev-arplant-050213-040104
Zhang, H., Lv, F., Han, X., Xia, X., and Yin, W. (2013). The calcium sensor PECBL1, interacting with PECIPK24/25 and Pecipk26, regulates Na+/K+ homeostasis in Populus euphratica. Plant Cell Rep. 32, 611–621. doi: 10.1007/s00299-013-1394-5
Zhang, H., Yin, W., and Xia, X. (2010). Shaker-like potassium channels in Populus, regulated by the CBL-Cipk signal transduction pathway, increase tolerance to low-K+ stress. Plant Cell Rep. 29, 1007–1012. doi: 10.1007/s00299-010-0886-9
Zhi, W. N. T., Song, S., Wang, Y. Q., Liu, J., and Yu, H. (2014). New insights into the regulation of inflorescence architecture. Trends Plant Sci. 19, 158. doi: 10.1016/j.tplants.2013.11.001
Zhu, K., Tang, D., Yan, C., Chi, Z., Yu, H., Chen, J., et al. (2010). Erect panicle2 encodes a novel protein that regulates panicle erectness in indica rice. Genetics 184, 343–350. doi: 10.1534/genetics.109.112045
Zhu, X., Yin, J., Liang, S., Liang, R., Zhou, X., Chen, Z., et al. (2016). The multivesicular bodies (MVBS)-localized AAA ATPASE LRD6-6 inhibits immunity and cell death likely through regulating MVBS-mediated vesicular trafficking in rice. PLoS Genetics 12:e1006311. doi: 10.1371/journal.pgen.1006311
Keywords: panicle apical abortion, CIPK, apical dominance, IAA, auxin, MAPK signaling, ROS
Citation: Peng Y, Hou F, Bai Q, Xu P, Liao Y, Zhang H, Gu C, Deng X, Wu T, Chen X, Ali A and Wu X (2018) Rice Calcineurin B-Like Protein-Interacting Protein Kinase 31 (OsCIPK31) Is Involved in the Development of Panicle Apical Spikelets. Front. Plant Sci. 9:1661. doi: 10.3389/fpls.2018.01661
Received: 16 February 2018; Accepted: 25 October 2018;
Published: 19 November 2018.
Edited by:
Andy Pereira, University of Arkansas, United StatesReviewed by:
Yuanhu Xuan, Shenyang Agricultural University, ChinaXiaoli Jin, Zhejiang University, China
Copyright © 2018 Peng, Hou, Bai, Xu, Liao, Zhang, Gu, Deng, Wu, Chen, Ali and Wu. This is an open-access article distributed under the terms of the Creative Commons Attribution License (CC BY). The use, distribution or reproduction in other forums is permitted, provided the original author(s) and the copyright owner(s) are credited and that the original publication in this journal is cited, in accordance with accepted academic practice. No use, distribution or reproduction is permitted which does not comply with these terms.
*Correspondence: Xianjun Wu, d3V4akBzaWNhdS5lZHUuY24=; d3V4anNhdUAxMjYuY29t