 Marco Bizzarri1
 Massimo Delledonne2
 Alberto Ferrarini2
 Paola Tononi2
 Elisa Zago2
 Doriano Vittori1
 Francesco Damiani3
 Francesco Paolocci3*
- 1Department of Science and Technology for Agriculture, Forests, Nature and Energy (DAFNE), University of Tuscia, Viterbo, Italy
- 2Department of Biotechnology, University of Verona, Verona, Italy
- 3Institute of Bioscience and Bioresources (IBBR), National Research Council (CNR), Perugia, Italy
Helianthus tuberosus L., known as the Jerusalem artichoke, is a hexaploid plant species, adapted to low-nutrient soils, that accumulates high levels of inulin in its tubers. Inulin is a fructose-based polysaccharide used either as dietary fiber or for the production of bioethanol. Key enzymes involved in inulin biosynthesis are well known. However, the gene networks underpinning tuber development and inulin accumulation in H. tuberous remain elusive. To fill this gap, we selected 6,365 expressed sequence tags (ESTs) from an H. tuberosus library to set up a microarray platform and record their expression across three tuber developmental stages, when rhizomes start enlarging (T0), at maximum tuber elongation rate (T3), and at tuber physiological maturity (Tm), in “VR” and “K8-HS142”clones. The former was selected as an early tuberizing and the latter as a late-tuberizing clone. We quantified inulin and starch levels, and qRT-PCR confirmed the expression of critical genes accounting for inulin biosynthesis. The microarray analysis revealed that the differences in morphological and physiological traits between tubers of the two clones are genetically determined since T0 and that is relatively low the number of differentially expressed ESTs across the stages shared between the clones (93). The expression of ESTs for sucrose:sucrose 1-fructosyltransferase (1-SST) and fructan:fructan 1-fructosyltransferase (1-FFT), the two critical genes for fructans polymerization, resulted to be temporarily synchronized and mirror the progress of inulin accumulation and stretching. The expression of ESTs for starch biosynthesis was insignificant throughout the developmental stages of the clones in line with the negligible level of starch into their mature tubers, where inulin was the dominant polysaccharide. Overall, our study disclosed candidate genes underpinning the development and storage of carbohydrates in the tubers of two H. tuberosus clones. A model according to which the steady-state levels of 1-SST and 1-FFT transcripts are developmentally controlled and might represent a limiting factor for inulin accumulation has been provided. Our finding may have significant repercussions for breeding clones with improved levels of inulin for food and chemical industry.
Introduction
Although starch is the most common reserve carbohydrate in higher plants, about 15% of all flowering plant species store fructans. These are linear and branched polymeric fructose extensions of sucrose (Suc) (Suzuki and Chatterton, 1993). Widespread in cereals (i.e., barley, wheat, and oat) (Pollock and Cairns, 1991), vegetables (i.e., chicory, onion, and lettuce), ornamentals (i.e., Dahlia spp. and tulip), and forage grasses (i.e., Lolium and Festuca) (Hendry, 1993), fructans are located in the vacuole and are water-soluble. Conversely, starch is insoluble and stored in the amyloplasts, or temporarily, in the chloroplast.
The storage capacity of vacuoles may be larger than that of the plastids, accounting for up to 95% of the protoplast volume. Therefore, the storage capacity of fructans is higher than that of starch (Brocklebank and Hendry, 1989), primarily when associated with the formation of specialized organs such as succulent stems, bulbs, and tubers.
Inulin is a fructan that displays mostly or exclusively the linear 2→1 fructosyl-fructose linkage between the β-D-fructosyl units (Glu 1←2 Fru 1←2 Frun, where n ranges from 1 to 33) (Suzuki and Chatterton, 1993). Usually, it is formed in plant organs of species belonging to the order Asterales and within grasses. Asterales include species that produce inulin-rich biomass either in roots as it occurs in Cichorium intybus (Li et al., 1997) or in auxotrophic stems and tubers as in Helianthus tuberosus L. (Kays and Nottingham, 2007; De Pace et al., 2010). The former is by far the most commonly used source of inulin by the food industry for its interesting nutritional, health-promoting, and technological properties (Flamm et al., 2001; Schaafsma and Slavin, 2015). However, inulin as much as other fructans can be converted into bioethanol through microbial fermentation (Martel et al., 2010).
Fructan-accumulating species that produce biomass with low input of fertilizers, pesticides, and carbon footprint are thus ecologically sustainable candidates to replace staple and starch-rich crops for bioethanol production.
H. tuberosus, also known as the Jerusalem artichoke (2n=6x=102), is a perennial rhizomatous species, adapted to low-nutrient soils. It exhibits high nitrogen and water-use efficiency (Mecella et al., 1996; Zhao et al., 2005; Kays and Nottingham, 2007), good competitive ability against weeds (Wall et al., 1987; Paolini and De Pace, 1997; Kays and Nottingham, 2007), and tolerance to diseases (Cassels and Walsh, 1995). These features coupled to the fact that the content of inulin in the tubers can be up to 30% on a fresh weight make H. tuberosus an ideal feedstock for ethanol production under different cropping systems, particularly in marginal lands (Kays and Nottingham, 2007).
Critical enzymes involved in inulin biosynthesis in H. tuberosus as well as other species are well known. The model of fructan biosynthesis has been reviewed and perfected since 1968 (Edelman and Jefford, 1968; Suzuki and Chatterton, 1993; Bonnett et al., 1994; Vijn and Smeekens, 1999; Altenbach and Ritsema, 2007). Biosynthesis of plant fructans requires specific enzymes like fructosyltransferases, which catalyze in the vacuole the transfer of fructosyl units from a donor substrate (sucrose or fructan oligosaccharides) to an acceptor substrate (sucrose or fructan oligosaccharides). Synthesis is always initiated by the sucrose:sucrose 1-fructosyltransferase (1-SST) from two molecules of sucrose, producing the shortest glucose (Glu)-Fru fructan chain “Glu 1←2 Fru 1←2 Fru” (or GF2), called 1-kestose. In this case, sucrose serves as both a fructosyl donor and acceptor. The second step involves the fructan:fructan 1-fructosyltransferase (1-FFT) which drives the fructan chain elongation by adding a fructose residue from 1-kestose (GF2) or 1,1-nystose (GF3) or a fructan molecule with a degree of polymerization (DP) higher than 3 (GF > 3) to other fructan molecules with DP > 3 (Edelman and Jefford, 1968; Koops and Jonker, 1994; Koops and Jonker, 1996).
The aims of H. tuberosus breeders are primarily to enhance the yield in tubers and the inulin content therein. However, despite the wealth of knowledge on the enzymology of inulin in H. tuberosus, the gene networks underpinning tuber development and inulin accumulation therein have yet to be fully elucidated. There are only few studies aimed at unearthing the transcriptional profiles of genes involved in carbohydrate accumulation and metabolism in these organs (Jung et al., 2014; Jiao et al., 2018).
Because we reasoned that the pattern of storage polysaccharide accumulation is a dynamic process intimately interconnected with those controlling tuber differentiation and growth, here we embarked on transcriptomic profiling of genes credited to affect morphological and physiological transitions throughout tuber growth and the metabolism of storage carbohydrates. To this end, the quantification of inulin was coupled to the microarray analyses on two H. tuberosus clones, “VR” and “K8-HS142,” which differ in their growth habits, at three tuber developmental stages: initial tuberization (T0), maximum elongation rate (T3), and physiological maturity (Tm).
The information we acquired is crucial to breed H. tuberosus clones with increased levels of inulin, which in turn could be used as resources demanding low input either for biofuel production in alternative to staple crops or for the food industry.
Materials and Methods
Plant Materials
The H. tuberosus rhizomes and tubers were harvested from plants of two different clones: the multi-stem “Violet de Rennes” (“VR”), provided by the breeding station at Montpellier, INRA (Institute National de la Recherche Agronomique), France, and the mono-stem “K8-HS142” selected at the University of Tuscia, Viterbo, Italy, from the half-sib progeny of the “K8” variety selected from Germany.
Field Experiments
Plants from the two mentioned H. tuberosus clones were grown in a loam soil at the Experimental Farm of the University of Tuscia, Viterbo (42°25'7''N, 12°6'15''E), Italy, from early spring, when seed tubers were sown, to the late fall of the same year, when tubers were collected.
The clones were planted in field plots arranged according to a randomized block design replicated twice. A plot density of 8 plants m-2 was adopted. Plants were watered at weekly interval by supplying the entire volume of water that was lost in 1 week by evapotranspiration after correction for the rainfall that occurred in that period.
Tuber Phenophases
The carbohydrate content measurement and the RNA purification were carried out from tubers harvested when they displayed the three phenophases illustrated in Figure 1. The length of phenophases was evaluated as the number of days from March 31, when the tubers of “VR” and “K8-HS142” were planted.
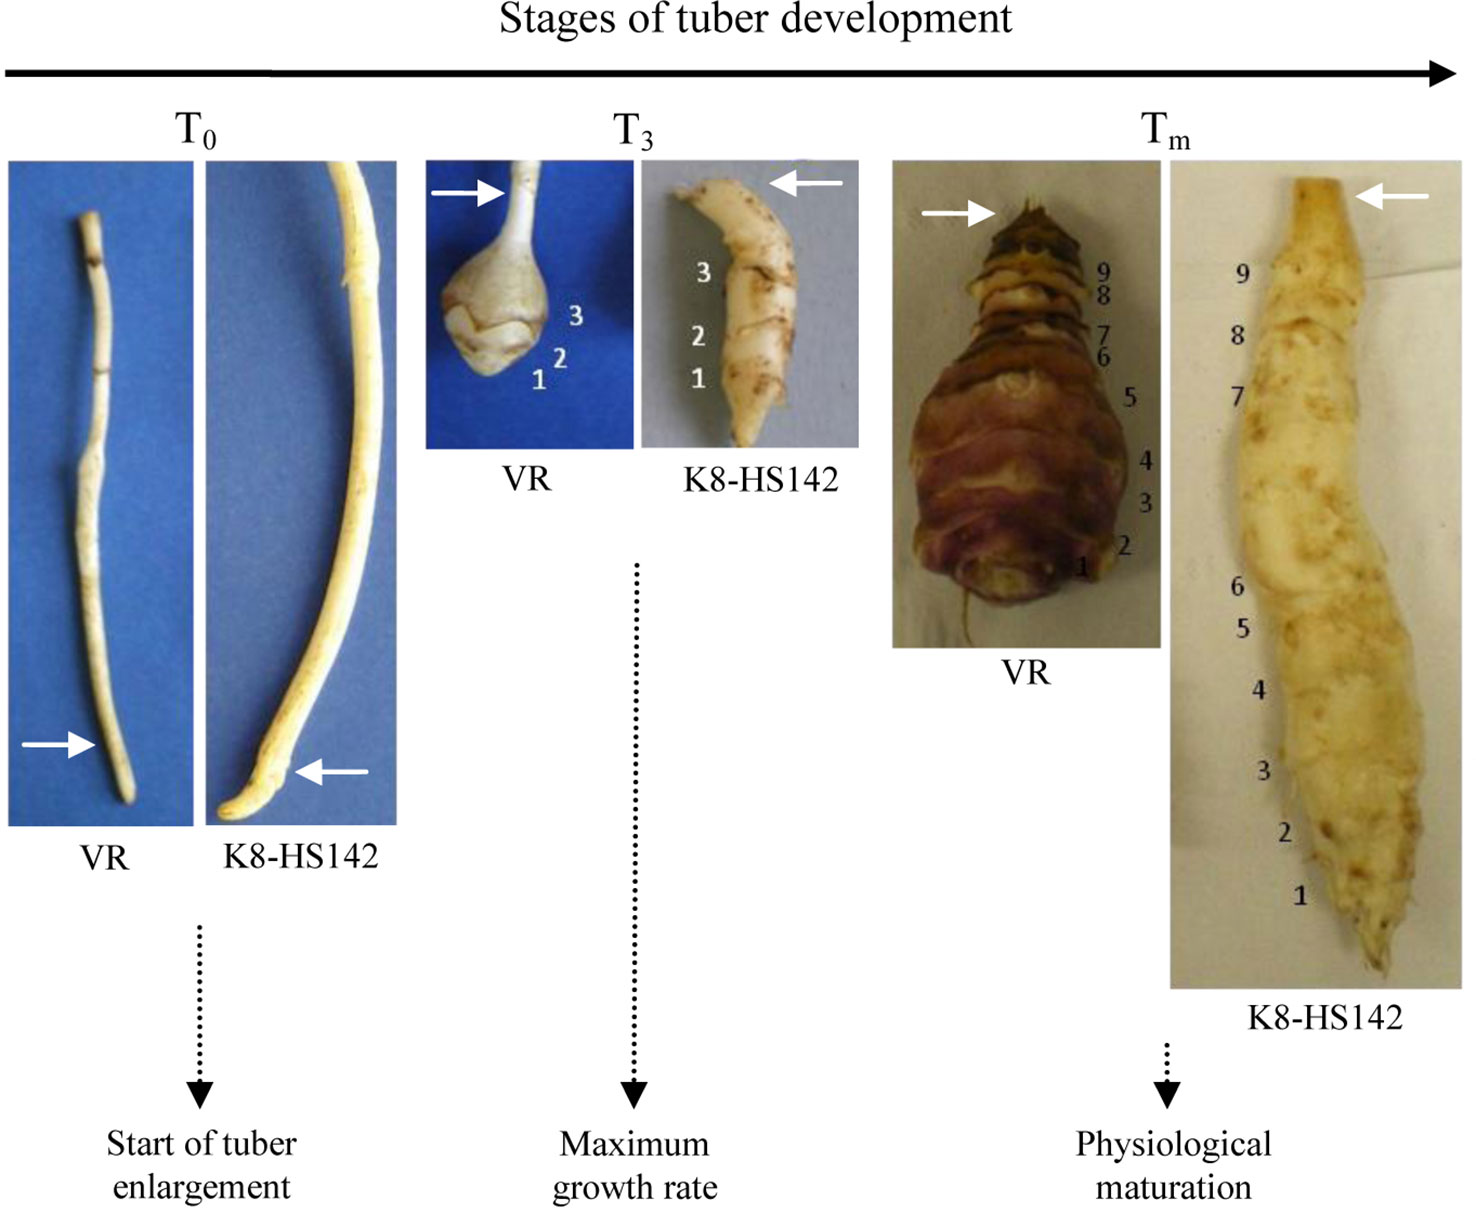
Figure 1 Morphological comparison of the rhizomes of Helianthus tuberosus “VR” and “K8HS142” clones during the tuber development. The white arrows point to the initial part of tuber enlargement. The sizes at the three stages are on scale. The number of nodes is reported.
The three phenophases were identified as follows: T0 (pre-tuberization), T3 (active tuber growth), and Tm (tuber physiological maturity). At the T0 stage, the rhizomatous apex was not yet enlarged and was just going to evolve into tuber (Figure 1). The T3 stage was reached when tubers had three elongated internodes, exhibited the maximum elongation rate, and reached nearly one-third of the final length (Figure 1). At the Tm stage, tubers had nine internodes and reached the physiological maturity (no more increase in weight and length and the final epidermal coloration was expressed entirely). Tuber morphological traits, such as weight and shape, were evaluated at Tm. The length/width ratio of the tuber was used to calculate the shape index according to Pas'ko (1973).
For RNA extraction, subsamples of the freshly harvested rhizome tips (T0) and tubers at T3 and Tm stages were quickly immersed in liquid nitrogen, ground to a fine powder, and stored at -80°C. Other subsamples of the fresh harvested rhizome tips and tubers at T3 and Tm stages were lyophilized and powdered for analyzing the content of fructans and starch.
Student's t-statistics was used to test the null hypothesis that the mean of random samples of tubers from the “VR” and “K8-HS142” clones at the same growth stage differed for a given trait only by chance events. The Statistical Package for Social Sciences (SPSS, IBM) 21.0_Ink software was used for implementing the test.
Carbohydrate Content in Tubers
Inulin content of tubers was assessed at the three developmental stages in both “VR” and “K8-HS142” clones. Lyophilized tubers were powdered using the shredder knives SM 100 (Retsch). Each processed sample was collected in a glass vessel, closed air-tight with its cover, and refrigerated until analyzed for the quantitative determination of the content in free sugars, such as glucose (GluF), fructose (FruF), and sucrose (SucF), as well as complex sugars (inulin). One gram of freeze-dried powder was mixed with 10 ml of water and boiled for 1 h. The resulting samples were then centrifuged at 2,500g for 5 min at room temperature (RT), and the supernatant was recovered. A fraction of the supernatant (unhydrolyzed) was diluted (1:2.5) with water and temporarily refrigerated. This fraction contained GluF, FruF, and SucF together with inulin. A further 2-ml fraction of supernatant was mixed with 0.5 ml of 1N HCl (pH 3.0) and boiled for 20 min to obtain acid hydrolysis of the sucrose and inulin carbohydrates. After neutralization with 0.5 ml NaOH 1N, the hydrolyzate was diluted with 4 ml of water to achieve the same 1:2.5 of supernatant-to-water volume ratio used for preparing the unhydrolyzed fraction. This fraction contained GluF and FruF only. The unhydrolyzed and hydrolyzed fractions of tuber extracts were purified according to the official method AOAC 982.14 (Cunniff, 1995) by using Sep-PAK® C18 cartridges 300 mg (Waters Corporation, USA) and filtrated through cellulose membranes φ 0.20 μM (Agilent Technologies, Germany). The purified fractions were eluted through YMC-pack polyamine II VS 12 S-5 μM, 10 mm × 4 mm (YMC, Japan), and then used for high-performance liquid chromatography (HPLC) analyses using the Agilent 1100/1200 apparatus (Agilent Technologies, Germany). A volume of 0.75 ml of eluate and 2.25 ml of acetonitrile (mobile phase) were mixed to prepare the sample to be injected onto the column which was kept at 25°C during sample flow. Solutions of pure glucose, fructose, and sucrose at known concentrations (Carlo Erba Reagenti, Italy) were injected as controls. The content of the GluF, FruF, and SucF were estimated from the sugar-specific absorbance peaks obtained during HPLC analysis of the unhydrolyzed fraction of the tuber extract. FruF indicates the cumulative fructose content from both the free fructose and the free sucrose in that fraction. GluF indicates the cumulative glucose content from both the free glucose and the free sucrose in that fraction. The total glucose (GluT) and fructose (FruT) contents from the free and inulin carbohydrates were detected by HPLC analysis of the hydrolyzed fraction of the tuber extract. The amount of fructose released by inulin during the hydrolysis (FruH) was calculated as FruT - FruF difference. The amount of glucose, GluH, released by inulin during the hydrolysis, was estimated as GluT - GluF difference.
Based on the above HPLC detection of the quantity of glucose and fructose, the inulin content was estimated according to Prosky and Hoebregs (1999) and Negro et al. (2006) using the following formula: k · (GluH + FruH), where k is a correction factor for water loss during hydrolysis whose numerical value was calculated by means of the following relationship: where n is the average degree of polymerization, with .
The difference between clones for fructan content in the tubers sampled at the three T0, T3, and Tm growth stages was analyzed by a one-way ANOVA analysis (p < 0.05).
Starch Content in Tubers
The Megazyme amylose/amylopectin determination kit (Megazyme International Ireland Ltd, Bray, Ireland) was used according to the manufacturer's instructions to detect the starch content in 25 mg of lyophilized powder of the tuber tissues collected at the Tm stage from both clones. The sample of the lyophilized powder was wholly dispersed by heating in dimethyl sulfoxide (DMSO). Lipids and free D-glucose were removed by precipitating the starch components in 95% ethanol and recovering the precipitate by centrifugation at 2,000g for 5 min. The precipitated sample was dissolved in 2 ml DMSO and placed in boiling water bath for 15 min. An aliquot of 0.5 ml of this solution was mixed with 4 ml of 100 mM sodium acetate buffer, pH 4.5. Then, 0.1 ml of amyloglucosidase/α-amylase solution was added, and the mixture was incubated at 40°C for 10 min to hydrolyze starch to D-glucose. One milliliter of this solution was mixed with 4 ml of a reagent containing glucose oxidase plus peroxidase and 4-amino antipyrine and incubated at 40°C for 20 min. The absorbance of this sample and of the D-glucose controls was read at 510 nm against the reagent blank.
Microarray Experiment
Expressed Sequence Tag Library for Designing the Microarray
A set of 40,361 expressed sequence tags (ESTs) from the Ht_CHT(LMS)_norm library built from H. tuberosus tissues of different plant organs, such as seedlings, leaves, flowers, achenes, and tubers, was obtained from “The Compositae Genome Project” U.S. research consortium website1.
Functional annotation of the EST sequences was performed according to the Gene Ontology (GO) criteria by using tools contained in the mentioned Blast2GO bioinformatics platform.
Putative biological and molecular functions of the retrieved proteins were illustrated by the make combined graph function in Blast2GO. The absolute (AS) and relative (RS) scores were used for calculating the extent to which EST/gene falls within a given GO class at the hierarchical levels 6, 7, and 8. The AS score was provided by Blast2GO, while the relative score (RS) was determined by dividing the AS score related to each GO class by the sum of ASs from all the GO classes. A BlastN analysis built in the Blast2GO package (Götz et al., 2008) was performed on the abovementioned EST query sequences.
In order to elevate the accuracy of the annotation outcome, the accessions identified by the BlastN candidate hits for a given EST queried were further filtered out by discarding those ones with E-value >10-60 and sequence similarity <80% (Figure S2). The EST accessions identified in the final set were eventually used to retrieve protein names and related IDs from UniProt and KEGG Maps. For the purpose of this study, only genes falling within the three main categories of carbohydrate metabolism, gene expression and protein metabolism, and cell development were considered. A further set of 80 ESTs/genes encoding enzymes for fructans in Cynara scolymus, Chicorium intybus, Allium sativum, Festuca arundinacea, Lolium perenne, starch in Solanum tuberosum and Brassica rapa, and cell development in Arabidopsis thaliana were also included. An additional group of 150 different ESTs for housekeeping genes (including genes for actin 11, actin 2/7, adenine phosphoribosyltransferase, β-actin, β-tubulin, cyclophilin, elongation factor 1α, elongation factor 1β, HSP90, polyubiquitin, ubiquitin-like, 18S rRNA, tubulin α-3/α-5 chain, tubulin β-9, rubisco, histone H4, phosphoglycerate kinase, phosphoribulokinase, plastocyanin, EIF4) from different plant species (Prunus persica, Vitis vinifera, Triticum aestivum, Beta vulgaris, Arabidopsis thaliana, Coffea arabica, Lactuca sativa, and others) were also retrieved from NCBI database and used to design the microarray. Features from bacterial species were included as the negative control. Globally, a set of 6,365 EST/genes, mainly including structural genes and some transcription factors related to carbohydrate metabolism and tuber development, were selected for creating the microarray platform (Table 1). The Cell Designer™ v4.2 software tool (Funahashi et al., 2003) was used to map the networks of molecular functions for inulin, starch, and sucrose carbohydrate metabolism (Edelman and Jefford, 1968; Geigenberger, 2011) occurring in the vacuole, amyloplast, and cytosol, respectively, and create a comprehensive scheme.
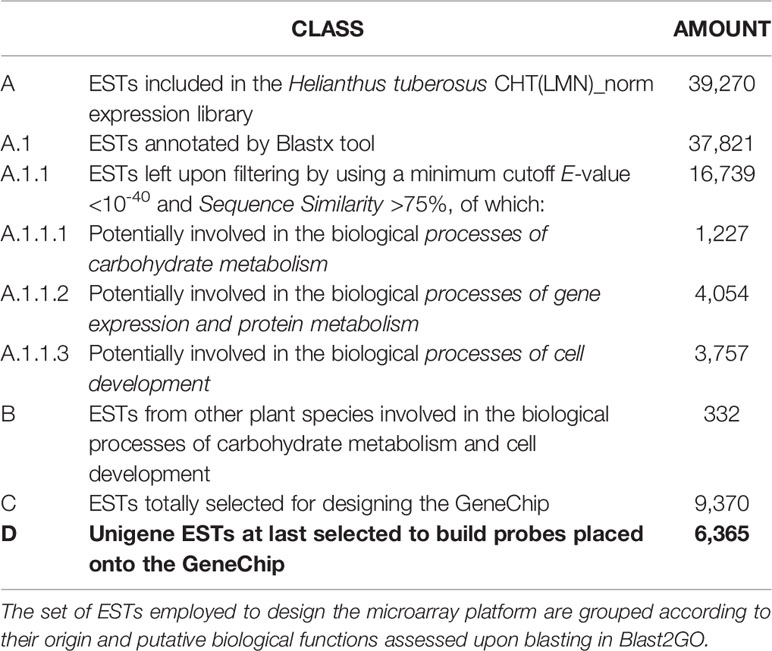
Table 1 Criteria pursued to select the expressed sequence tags (ESTs) spotted on the GeneChip.
Microarray Platform Production
The microarray was produced according to the MIAME guidelines2 by exploiting a Custom Array™ 2 × 40k platform (CombiMatrix®) synthesized at the University of Verona3, Verona, Italy, which contained 40,000 features each consisting of 30–35 mer oligonucleotide probes designed using the OligoArray 2.1 software. Two to four probes were designed for each of the 6,365 selected EST/genes, and each probe was replicated up to four times on the microarray.
RNA Isolation and Microarray Hybridization
RNA from tubers at T0, T3, and Tm growth stages were collected from three different biological replicates for both “VR” and “K8-HS142.” Overall, two sets of RNA, each consisting of 18 RNA preparations (three biological replicates × three stages × two clones) were isolated and processed, one for microarray and the other for qRT-PCR analyses.
Total RNA was purified from each sample starting from 500 to 800 mg of tuber tissue (previously ground in liquid nitrogen) using the TRIzol® reagent (Life Technologies) and the procedure reported by Chomczynski and Sacchi (1987) followed by a DNase I treatment (Ambion) aimed to remove any DNA contamination. Purified RNA samples were controlled for their purity by using a Nanodrop 1000 spectrophotometer (Thermo Scientific) and integrity by means of a Bioanalyzer 2100 (Agilent Technologies) according to Schroeder et al. (2006) upon a proper preparation by the accompanying RNA 6000 Nano Kit (Agilent Technologies).
The RNA ampULSe: Amplification and Labeling Kit (with Cy5 for CombiMatrix arrays) (Kreatech) was used according to manufacturer's instructions to synthesize and clean cDNA and antisense RNA (aRNA), labeling the aRNA with the fluorochrome cyanine Cy5, and to accomplish the fragmentation of labeled aRNA. The microarray was hybridized with 3 μg of labeled aRNA for 16 h at 45°C, then washed using serial washings based on cleaning solutions, such as 6X SSPET, 3X SSPET, 0.5X SSPET, PBST, PBS, and eventually imaged. Each aRNA used for microarray hybridization represented a “Ci” condition of hybridization.
Data Acquisition and Analysis
Using a PerkinElmer 400XL scanner (PerkinElmer), Tagged Image File Format (TIFF) images of the gene spots were obtained, exported to the Microarray Imager 5.8 (CombiMatrix) software for densitometric analysis and imported in LIMMA statistical package (Smith, 2004) by the use of “Read.maimages” function.
The signal observed from a microarray spot resulted from the combination of the true foreground emission from the specific hybridization event and the background emission due to nonspecific hybridization. Therefore, using the “BackgroundCorrect” function, the signals rising from contaminations and imperfections, such as irregular contour, donut shapes, artifacts, and low or heterogeneous expression, were removed, and the accuracy of spot-signal measurement was ameliorated.
To achieve a meaningful comparison of the signals from different biological/technical replicates, the set of emission signal intensities from different arrays were normalized.
The variation across arrays due to sample preparations and array manufacturing and processing (labeling, hybridization, and scanning) was smoothed, adopting the quantile normalization algorithm implemented in the “NormalizeBetweenArrays” function.
With the aim to detect the set of DE EST/genes, the emission signals were analyzed using the core component of the LIMMA package to fit gene-wise linear models on gene expression data. DE was assessed by estimating log intensities for each probe hybridized to the target aRNA samples.
The “model.matrix” function was used to set a matrix of expression levels based on the emission signal intensity from each probe. The different probes were placed in the matrix rows, and the different conditions analyzed in the experiment were allocated to the columns of the matrix. The row-wise probe emission signal intensities were used for linear regression analysis using the “lmFit” function.
Once a linear model was fitted, log2-fold changes of the emission signal intensities on the entire set of a possible pair of Ci conditions for each probe were computed using the “makeContrast” function.
Differentially expressed (DE) ESTs were identified as the ones whose corresponding expression value ratios in the C1 vs. C2 conditions showed at least a two-fold change (FC ≥2). The moderated t-statistics was used to assess the significance of the log2-fold changes of the emission signal intensities for that pair of Ci conditions for a given probe/EST/gene. The moderated t-statistic has the same interpretation as an ordinary t-statistics except that the standard errors have been moderated across genes, squeezed toward a common value, using a simple Bayesian model.
The C1 and C2 conditions were considered significantly different in gene expression levels when log2│I1 I2-1│≥ 1 and padj for the moderated t-statistics <0.05, I1 and I2 representing the mean value of the emission signal intensity from the probe/EST/gene hybridized with the labeled aRNA-Cy5 samples that made the C1 and C2 conditions, respectively.
A one-way ANOVA (p < 0.05) approach was adopted to compare the significance of the emittance differences over all the three growth stages. To sort among DE EST/genes clustered into a specific GO level (=8) those that likely play a more relevant role in either carbohydrate metabolism or tuber growth, the DE EST/genes were then blasted against UNIPROT and KEGG databases.
The data reported in this study have been deposited in NCBI's Gene Expression Omnibus (Edgar et al., 2002) and are accessible through GEO Series accession number GSE132955 (https://www.ncbi.nlm.nih.gov/geo/query/acc.cgi?acc=GSE132955).
Quantitative Real-Time PCR Validations
To validate the differential gene expression values obtained by microarray analysis, quantitative real-time PCR (qRT-PCR) analyses were performed on a subset of four key genes implied in the hexose metabolism [sucrose synthase (SuS), phosphoglucomutase (PGM)] and fructan (1-SST, 1-FFT) biosyntheses. The target genes were among those predicted by microarray analysis to be DE among the three different tuber developmental stages.
A primer pair specific to each target gene was designed using the “OligoExpress” software (Applera Biosystems). Forward and/or reverse primers were designed on the probe emitting the highest hybridization signal from the set of features from a given EST (Table S1).
Three RNA samples for each condition were used for the synthesis of cDNA. For each sample, 3 μg of RNA were reverse transcribed in duplicate using the SuperScript III H-Reverse Transcriptase (Life Technologies) and 100 pmol of random hexamers (Pharmacia Biotech) according to the supplier's instructions. The two replicated reactions were then mixed.
The successful synthesis of cDNA was tested by PCR amplification with 18S and 26S external transcribed spacer (ETS associated with 18S and 26S rDNA) (Table S1). The 25-μl PCR mixture contained 2.5 mM MgCl2, 0.2 mM of each dNTPs, 10 nM of each primer, and 1 U of Taq DNA polymerase (Euroclone). PCR reactions were performed in a 9700 PCR system (Life Technologies), adopting the following thermal profile: 94°C, 2 min followed by 50 cycles of denaturation at 94°C, 5 s, annealing at 60°C, 10 s and extension at 72°C, 30 s, with a final extension at 72°C, 5 min.
An aliquot of 3 μl of 1:10 diluted mixture of cDNA was used in the PCR reaction, which was made up using the Power SYBR-Green PCR core mix (Applied Biosystems) according to the supplier's instructions in 20 μl final volume in the presence of 2.5 pmol of each primer. Four replicates were analyzed for each gene tested in the 18 conditions. Cycling parameters were two initial steps at 50°C, 2 min, and 95°C, 2 min, then 50 cycles each including a step at 95°C, 15 s and a step at 60°C, 1 min, and a final step at 60°C, 10 min. Afterward, the dissociation protocol was performed.
Amplifications were performed into an ABI PRISM 7300 SDS apparatus (Applied Biosystems). For each gene, the average threshold cycle (Ct) was determined. Standard curves for target genes and the housekeeping gene encoding for the elongation factor-1α (EF-1α), employed as internal control, were obtained by the amplification of a serially diluted mixture of cDNA samples, with six dilution points, each one replicated four times to calculate the amplification efficiency of each primer pair. The gene expression quantification method (2^ΔCt) based on the differences between the relative expression of the target and the reference EF-1α gene was adopted in order to compare the relative expression profiles among genes and clones as reported in Passeri et al. (2017).
Significance of the differences between mean values for the relative expression detected by the RT-qPCR for the two clones at the three tuber developmental stages were analyzed by a two-way ANOVA (p < 0.05) procedure embedded in the R statistical package.
Results
Morphological and Physiological Differences Between “VR” and “K8-HS142” Plants and Tubers
Both in “VR” and “K8-HS142” clones, the main stem raised directly from the seed tuber. However, “VR” plants displayed a branched architecture due to the sprouting of the lateral buds from basal nodes on the main stem (Figure S1-A1), whereas the most “K8-HS142” plants were unbranched (Figure S1-B1). The rhizome was shorter in “K8-HS142” than in “VR,” determining denser biomass around the crown area in the tubers of former than of the latter genotype (Figures S1-A2, B2). The number of days from tuber planting to the beginning of flowering varied between about 120 days in “K8-HS142” (flowering during the first half of July) and 190 days in “VR” (flowering at the end of September). As for tuber development, “VR” reached T0 in the middle of June, about 20 days earlier than “K8-HS142” and reached the T3 stage about 40 days earlier than “K8-HS142.” The Tm stage, when tuber ripening ended, occurred at early October in “VR,” about 60 days earlier than “K8-HS142,” but the length of the ripening period was similar between the clones (Figure 2A).
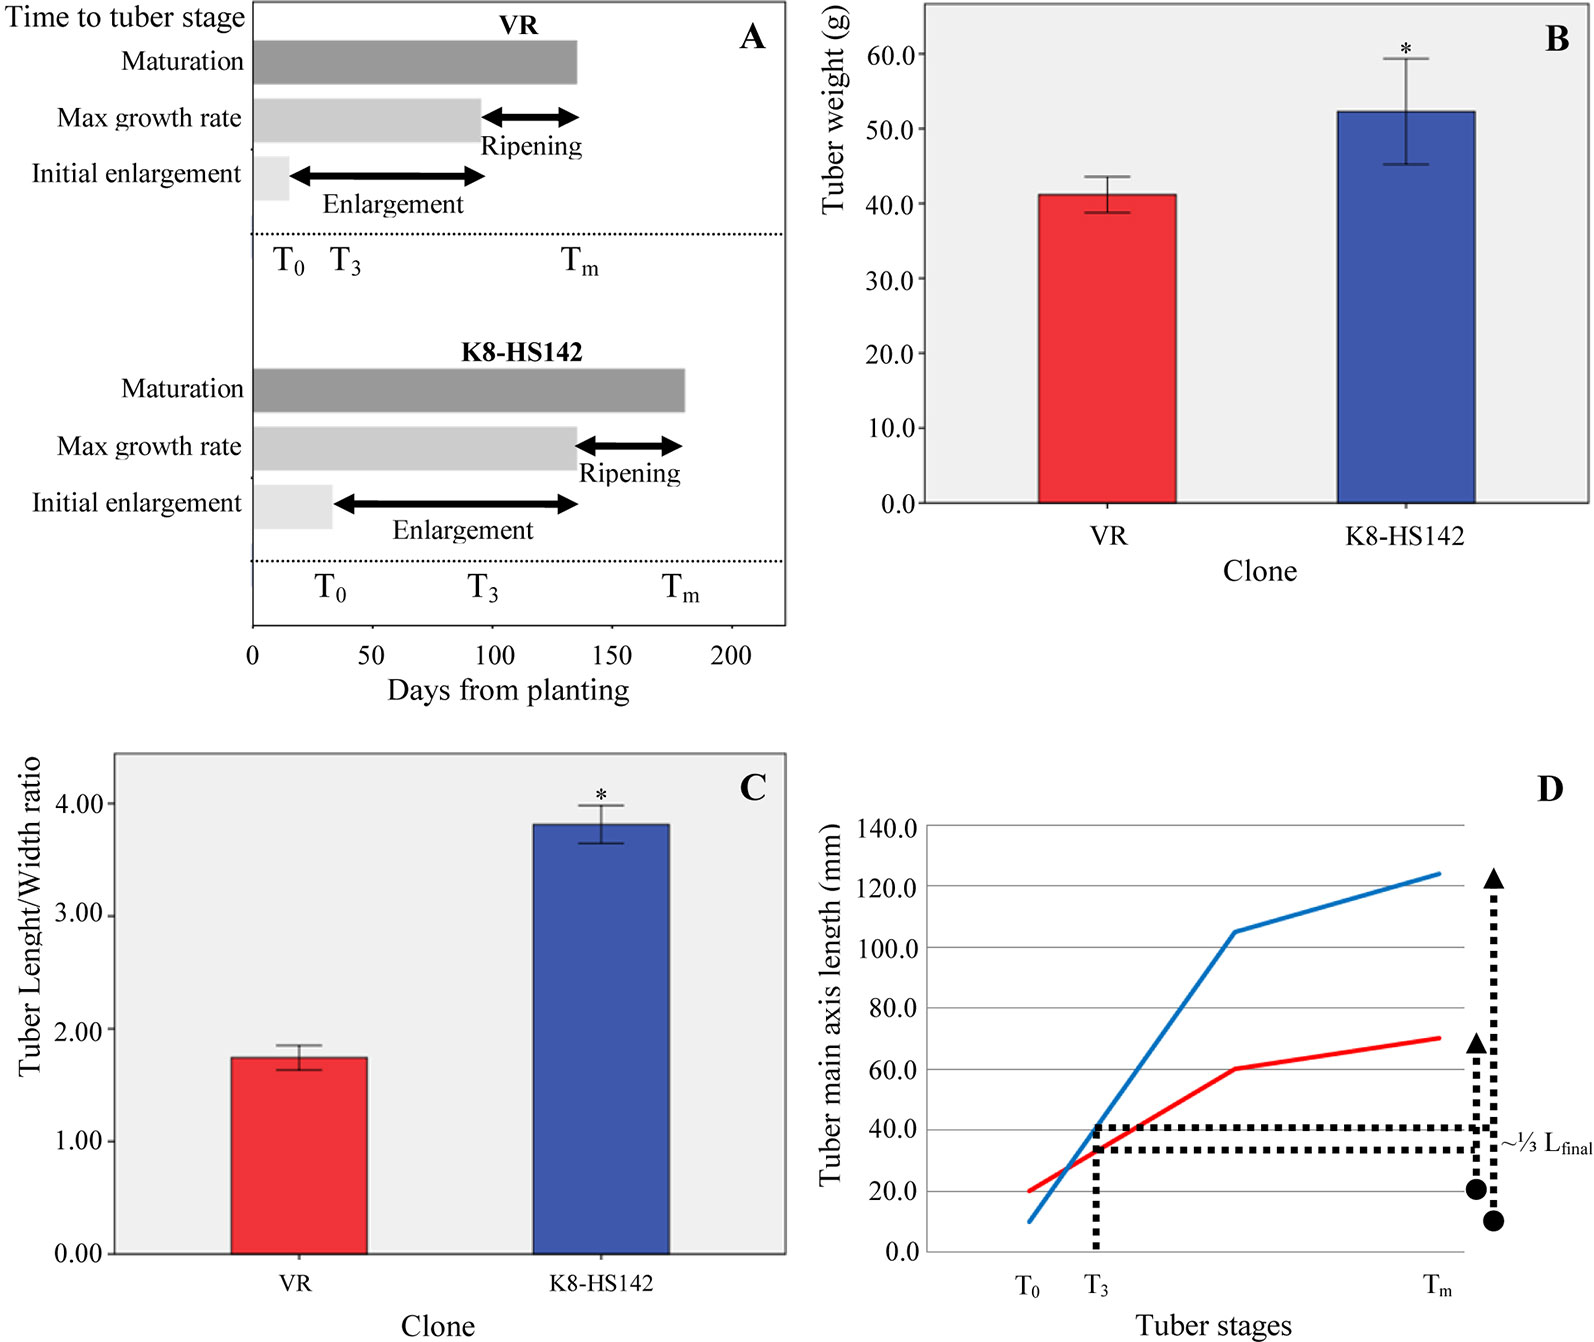
Figure 2 Tuber traits in Helianthus tuberosus “VR” and “K8-HS142” clones. (A) Phases of tuber development. Bars show the duration of each of the three tuber developmental stages, from the onset of tuberization to physiological maturation. The scale starts from the day of planting. Data are from the average of three plants per clone. (B) Tuber weight. Data are from tubers collected from four different plants per clone. (C) Tuber shape. Ratio between length and width in tubers of “VR” and “K8-HS142” clones, collected from four different plants. According to Pas'ko (1973) tubers from “VR” and “K8-HS142” were classified as short pear-shaped and spindle-shaped, respectively (Figure 1; Figure S1). (D) Temporal variation in the length of the main axis (mm) of “VR” (red line) and “K8-HS142” (blue line) tubers. *: Significances (p < 0.05). The bar indicates ±1 standard error.
At Tm, the fresh tuber weight and the length/width ratio were significantly higher in “K8-HS142” than in “VR” (52.27 ± 14.12 g vs. 41.17 ± 4.79 g and 3.81 ± 0.34 vs. 1.74 ± 0.22, respectively) (Figures 2B, C).
From the onset of tuberization to maturation, the main axis length in “VR” and “K8-HS142” increased up to nearly 50 and 115 mm, respectively (Figure 2D).
Based upon these data, the tubers of “VR” and “K8-HS142” were classified as pear- and spindle-shaped (Figure 1; Figures S1-A2, B2), respectively, according to Pas'ko (1973).
The Concentration of Storage Polysaccharides in Developing Tubers
The variation in the content of the main complex carbohydrates was analyzed in developing tubers. The inulin was undetectable in the rhizome tips of both clones at T0. It increased sharply at T3, when “K8-HS142” exhibited a significantly higher content (512.03 ± 24.43 g · kg-1 DW) compared to “VR” (423.49 ± 15.31 g · kg-1 DW). At Tm, the increment of inulin was significant only in “VR,” and both clones had a similar inulin content: 559.32 ± 8.18 (“K8-HS142”) and 555.53 ± 5.78 (“VR”) g · kg-1 (Figure 3).
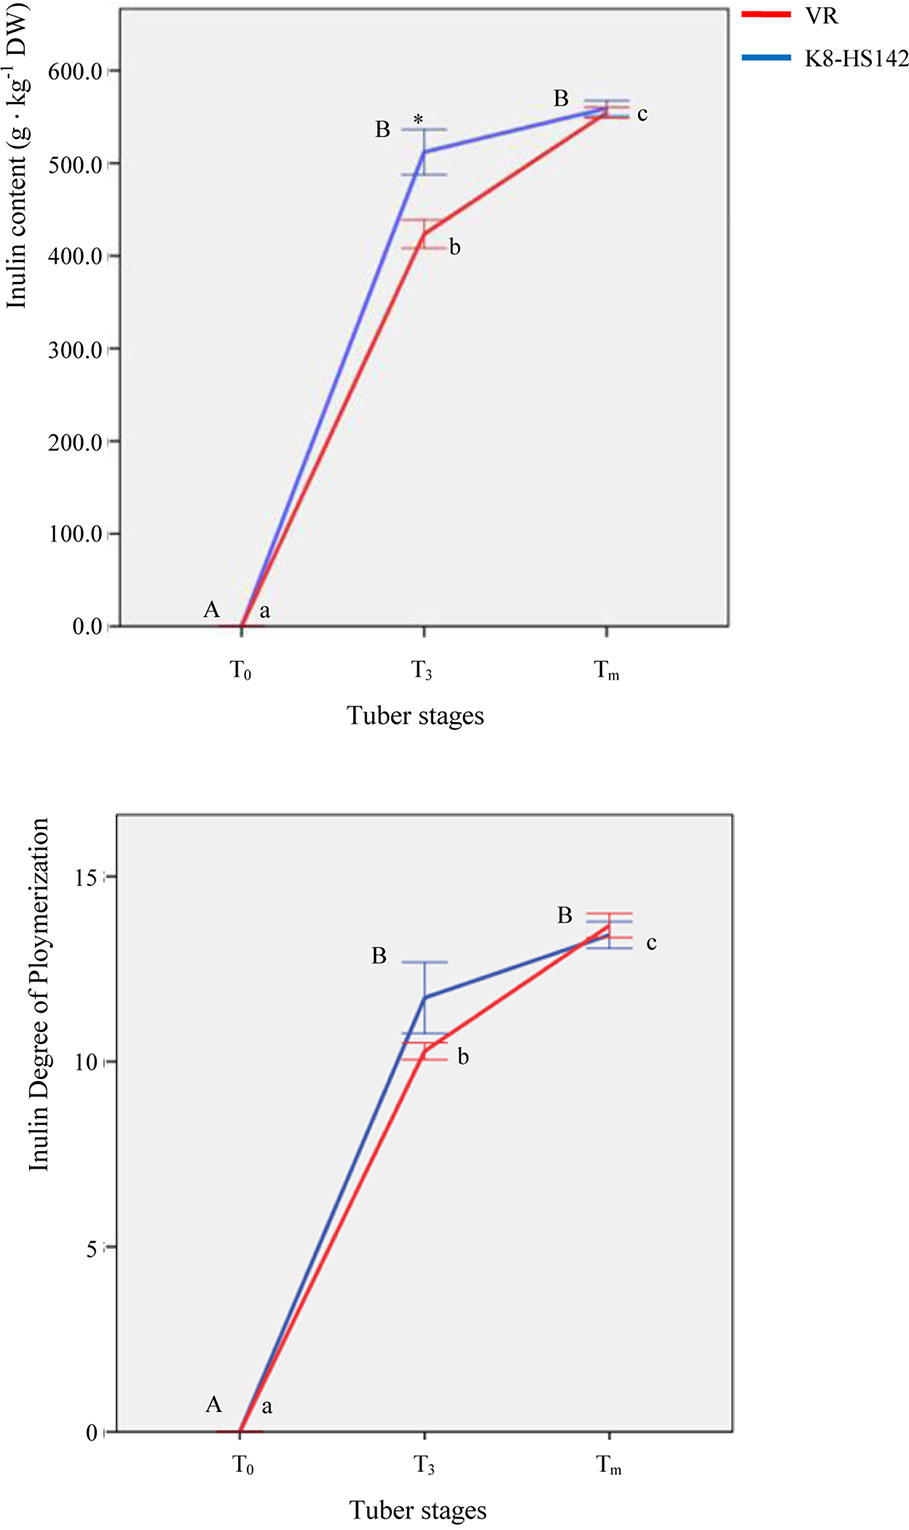
Figure 3 Inulin content and degree of polymerization (DP) in tubers of Helianthus tuberosus “VR” and “K8-HS142” clones. Significantly different values (p < 0.05) at different stages in the same clone are labeled with different letters (lowercase for “VR,” uppercase for “K8-HS142”) and those between clones at the same stage with *. The bar indicates ±1 standard error.
The degree of polymerization basically followed the pattern of total inulin content: at T3, the DP was higher in “K8-HS142” (11.72 ± 0.96) than “VR” (10.28 ± 0.23), whereas at Tm, the DP increased in “VR” (13.67 ± 0.33) but not significantly in “K8-HS142” (13.42 ± 0.36) (Figure 3).
The starch content expressed as percentage of lyophilized tuber weight at Tm was 0.31% ± 0.02% in “VR” and 0.64% ± 0.18% in “K8-HS142”. Therefore, the starch content of tubers at the physiological maturity was insignificant.
Expression Analysis of the Set of Expressed Sequence Tags/Genes on the Microarray Chip
Out of the 6,365 ESTs spotted, significant differential expression between “VR” and “K8-HS142” was detected for 60 and 11 EST/genes at T0 and T3 stages, respectively (Table 2), whereas no significant differences were detected between clones at tuber maturity (Tm).
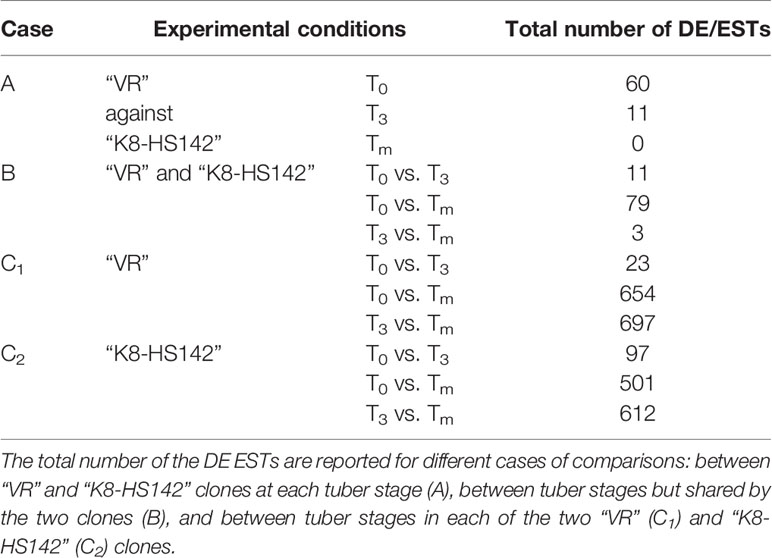
Table 2 Number of differentially expressed (DE)/expressed sequence tags (ESTs).
Within clones, the highest number of DE ESTs (DE/ESTs) occurred when compared T3 vs. Tm for both “VR” (697) and “K8-HS142” (612), whereas the lowest in T0 vs. T3, being 23 and 97 in “VR” and “K8-HS142,” respectively (Table 2). Despite this high number of DE ESTs, those shared between the clones across the different developmental stages were only a few between T0 and T3 (11) and three between T3 and Tm (Table 2), whereas the highest number occurred between T0 and Tm (79).
Differentially Expressed/Expressed Sequence Tags Between “VR” and “K8-HS142” Clones at T0 and T3
Among the 60 DE/ESTs between clones at T0, 8, 26, and 26 were sorted into the macrocategories carbohydrate metabolisms, gene expression/protein metabolism, and cell development, respectively (Table S2). The categories of GO analysis comprised terms such as “Glucose metabolic P,” “Hexose catabolic P,” “Cellular protein Catabolic P,” and “Organ development P,” just to cite a few. Then, in order to focus on ESTs intimately connected to the processes of carbohydrate metabolism and tuber growth, 32 DE/ESTs that yielded a significant match with proteins related to these functions as per UNiProt and KeGG analyses were specifically considered (Tables 3–5 and references therein).
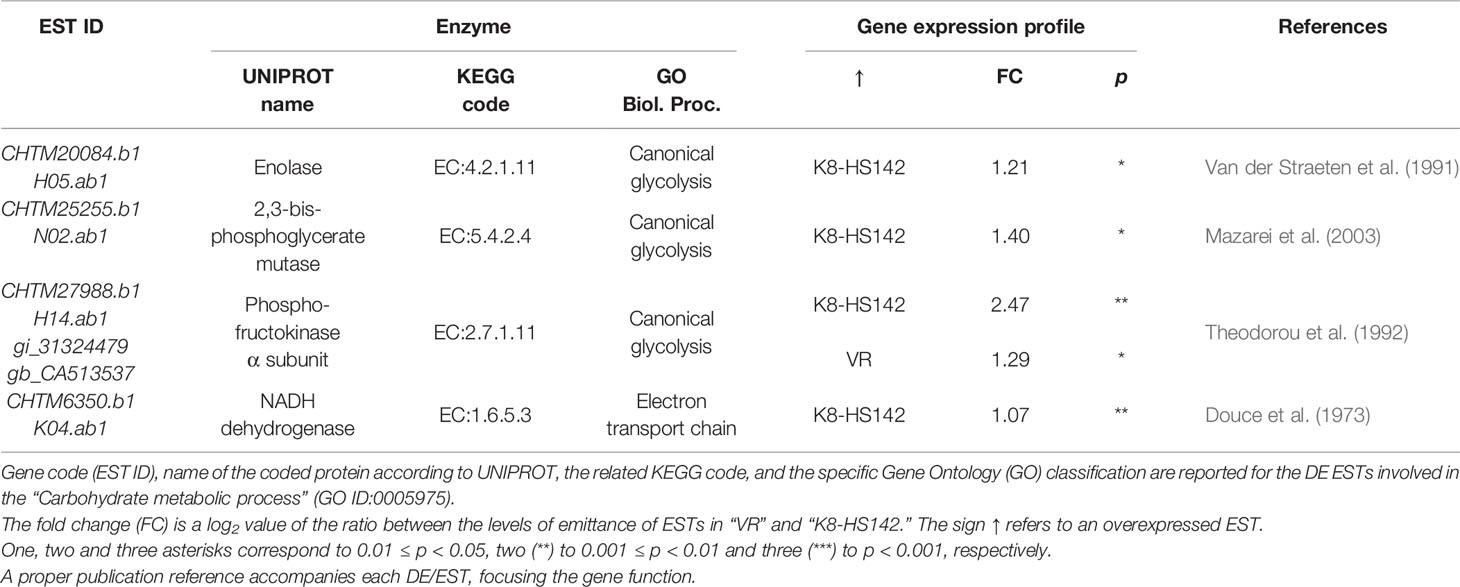
Table 3 Differentially expressed (DE)/expressed sequence tags (ESTs) between clones at T0 taking a role in the carbohydrate metabolism.
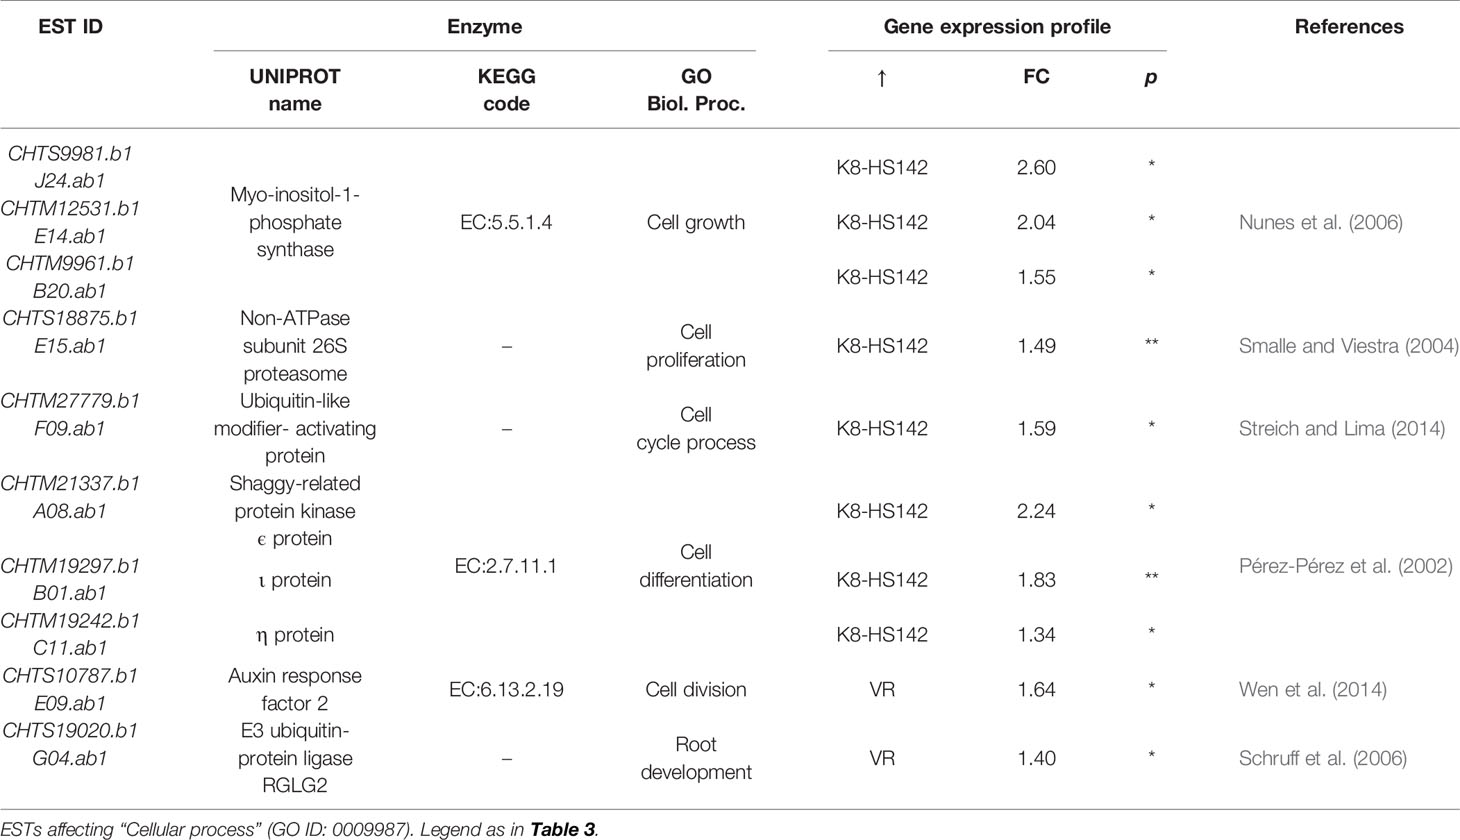
Table 4 DE/ESTs between clones at T0 taking a role in cell development.
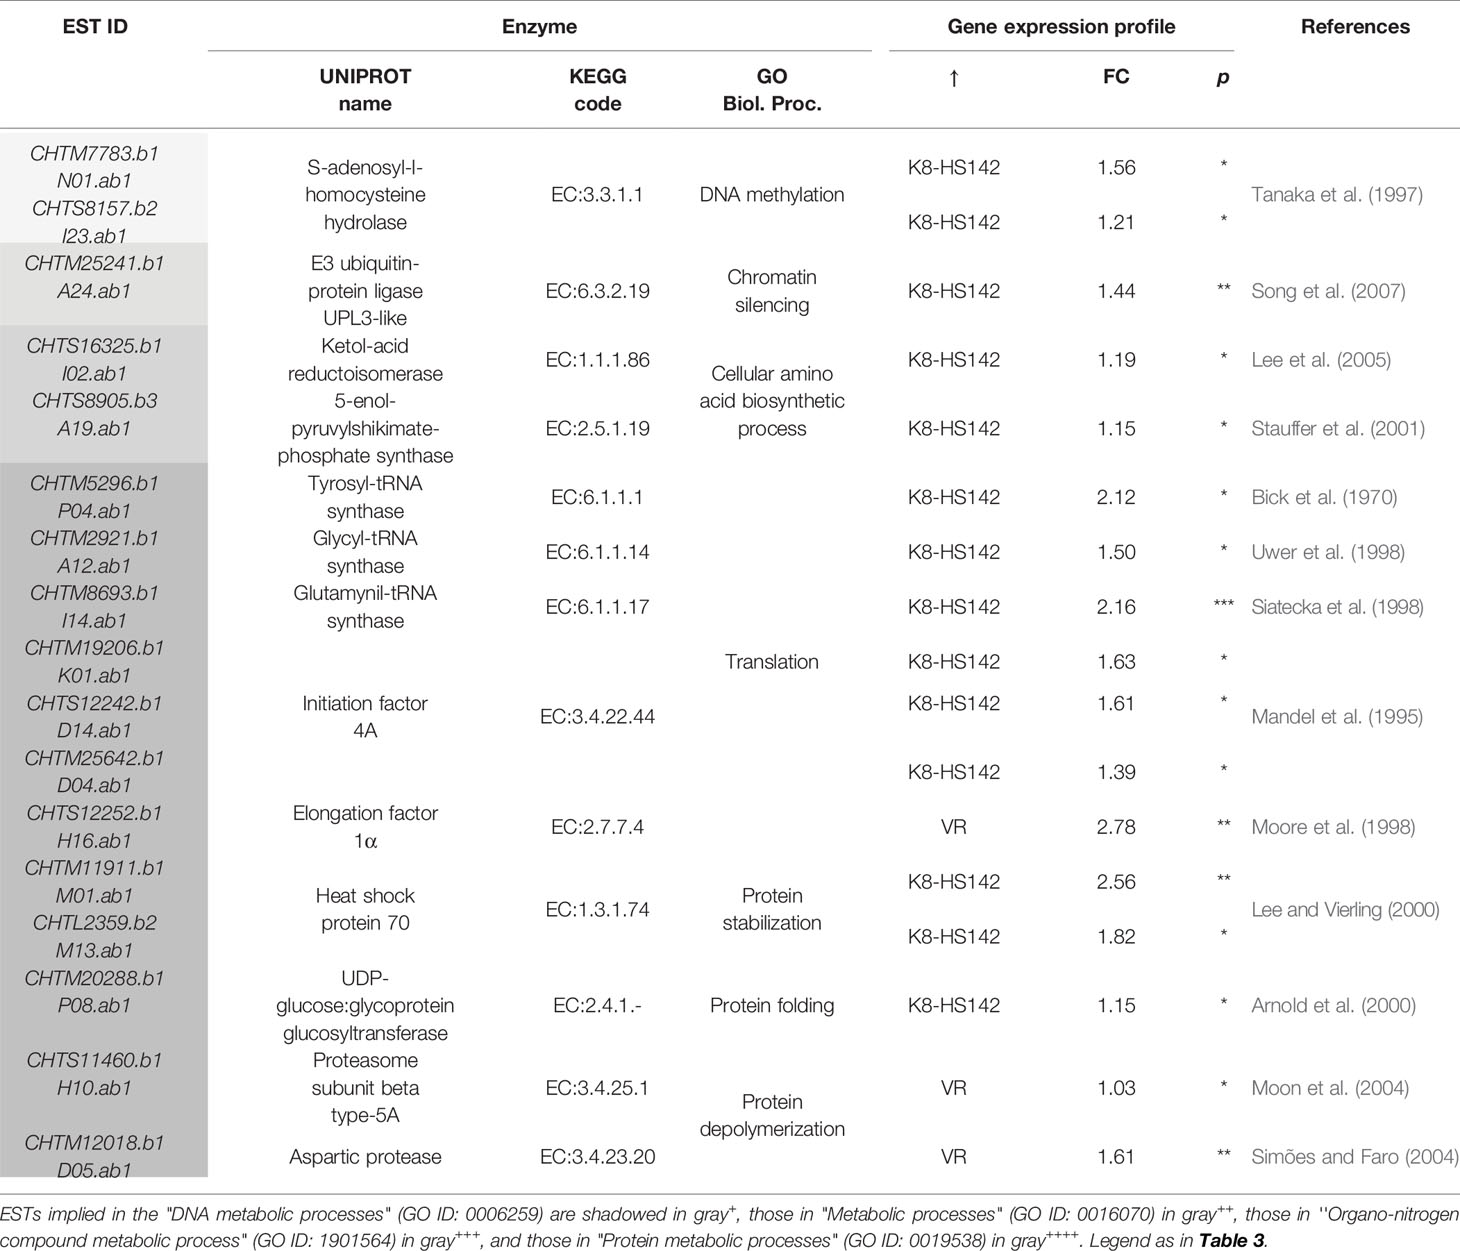
Table 5 Differentially expressed (DE)/expressed sequence tags (ESTs) between clones at T0 taking a role in the metabolism of nucleic acids and proteins.
Out of the five ESTs involved in carbohydrate metabolism, four were upregulated in “K8-HS142”: CHTM20084.b1, encoding for enolase; CHTM25255.b1 for 2,3-bisphoglyceratemutase implied in the canonical glycolysis; CHTM6350.b1, encoding for NADH dehydrogenase, a crucial enzyme for the electron transport chain in the mitochondrial membrane; and an EST native from H. tuberosus (CHTM27988.1) coding an α-subunit of phosphofructokinase. The EST for an α-subunit of phosphofructokinase native from S. tuberosum (CA513537) was conversely upregulated in “VR” (Table 3).
Concerning DE/ESTs for cellular processes, the vast majority were upregulated in “K8-HS142,” among them, those implied in cell cycle process (CHTM27779.b1), cell differentiation (CHTM19297.b1, CHTM21337.b1, and CHTM19242.b1), cell proliferation (HTS18875.b1), and cell growth (CHTM12531.b1, CHTS9981.b1, and CHTM9961). Only two, CHTS10787.b1 and CHTS19020.b1, strictly associated to cell division and cell root development, respectively, were upregulated in “VR” (Table 4). Most of the genes related to gene expression/protein stabilization and folding were upregulated in “K8-HS142” (Table 5). These included ESTs related to: a) translational events, b) aminoacidic biosynthesis, c) protein stabilization, d) protein folding and modification, and e) epigenetic events. Conversly, ESTs related to protein depolymerization were overexpressed in “VR” (Table 5).
Eleven were the DE/ESTs between clones at T3 (Table S3), 10 of them categorized into the macrobiological processes “Primary metabolic P” within which an EST related to carbohydrate biosynthesis and one to protein modification-phosphorylation were upregulated in “VR” and “K8-HS142,” respectively. The remaining ESTs were upregulated either in “K8-HS142” (3) or in “VR” (5). The last DE/EST, upregulated in “K8-HS142,” is involved in cell wall modification. Anyway, after blasting in NCBI database, none of them was really credited to affect carbohydrate metabolism and storage and tuber development.
Differentially Expressed/Expressed Sequence Tags Across the Different Stages of H. tuberosus Tubers
To depict genes most likely associated to stage transition in the tubers of H. tuberosus, DE/ESTs across the three developmental stages were searched by merging the data from “VR” and “K8-HS142” clones.
Seventy-nine ESTs were differentially expressed between the two most extreme stages (T0 and Tm) (Table 2) and were relative to “Cellular P” such as “Organ and shoot development” (33), “Primary metabolic P” such as “Monosaccharide metabolic P” (18), “Cellular protein metabolic and modification P,” “Nucleic acid metabolic P,” (23), and “Transport P” (4) (Table S4). Within the “Cellular P” and “Transport P” groups, the majority of the ESTs (20 and 4, respectively) were upregulated at T0, whereas in the second and third groups, the most of them peaked at Tm (11 and 11, respectively).
More in details, ESTs involved in basic biological processes, such as electron transport, glycolysis, aminoacid biosynthesis, cell growth, cell wall assembly and modification, water entrance into the cell and vacuole, and auxin transport were upregulated at Tm. (Tables 6–8 and references therein). Conversely, ESTs/genes involved in chromatin silencing, translation, and apoptosis together with ESTs involved in the glycolytic process, such as those for aldolase and phospho-glucomutase, were upregulated at Tm.
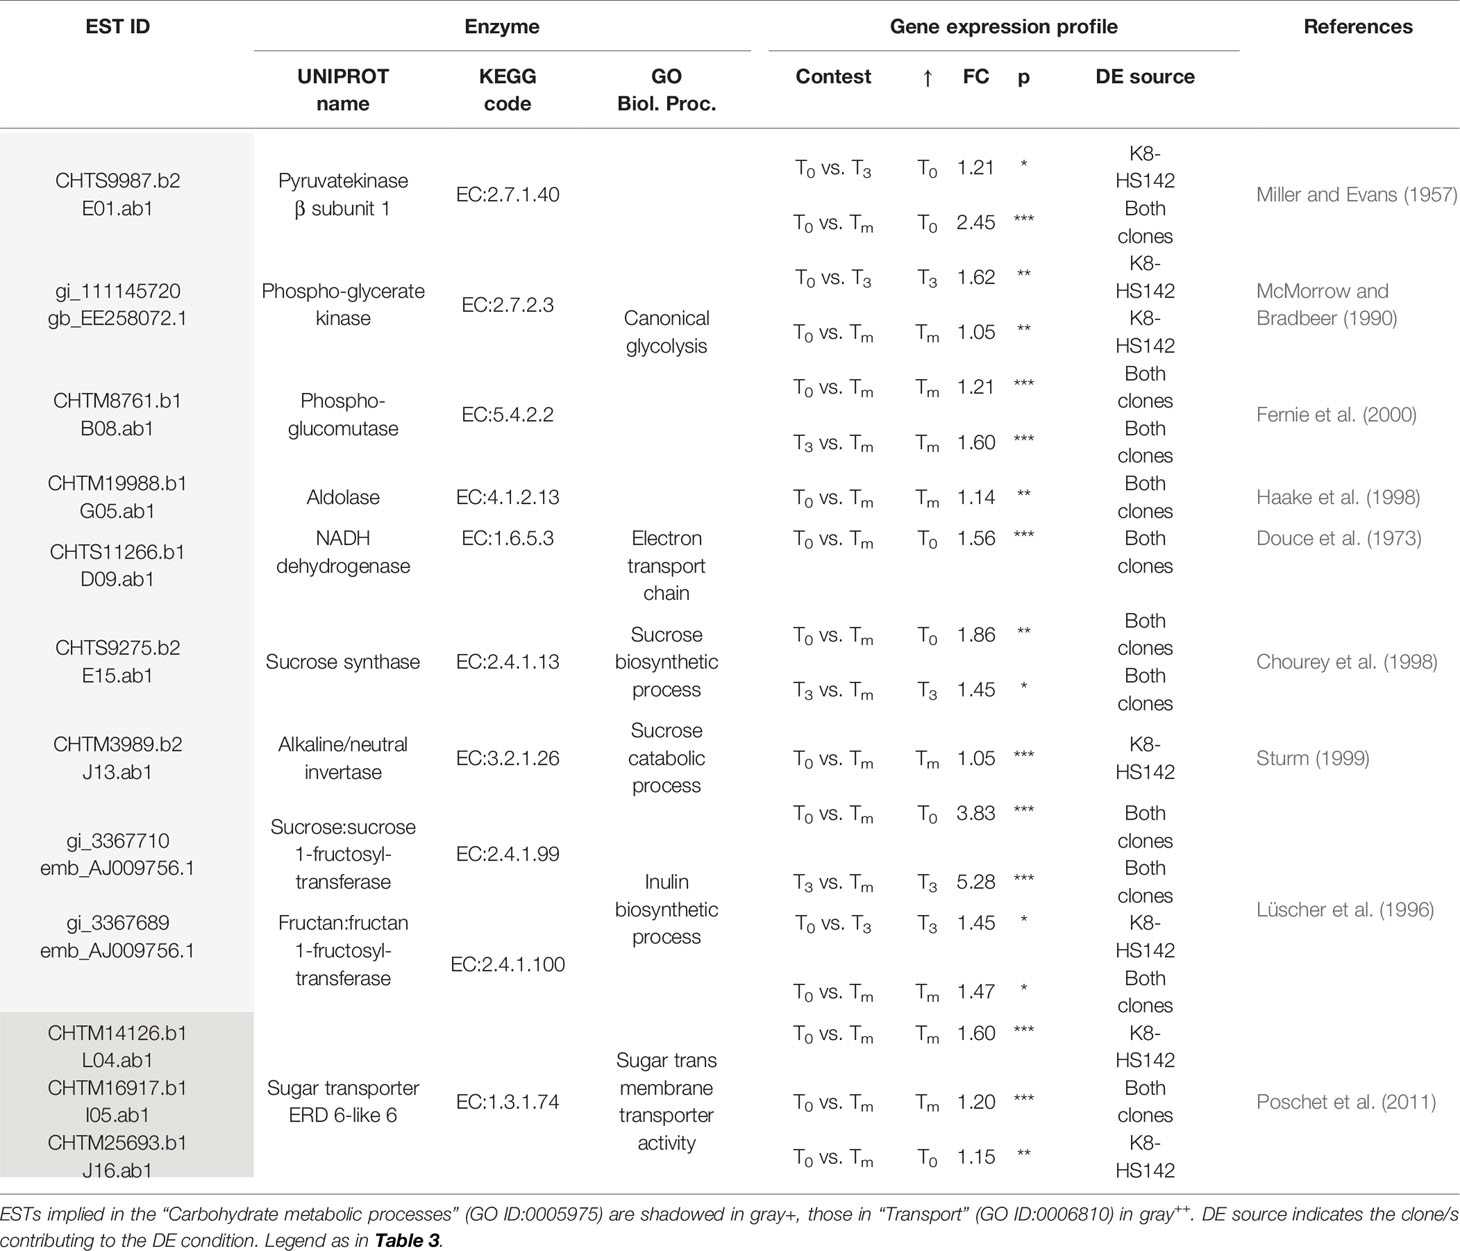
Table 6 Differentially expressed (DE)/expressed sequence tags (ESTs) between tuber stages taking a role in the carbohydrate metabolism and sugar transport.
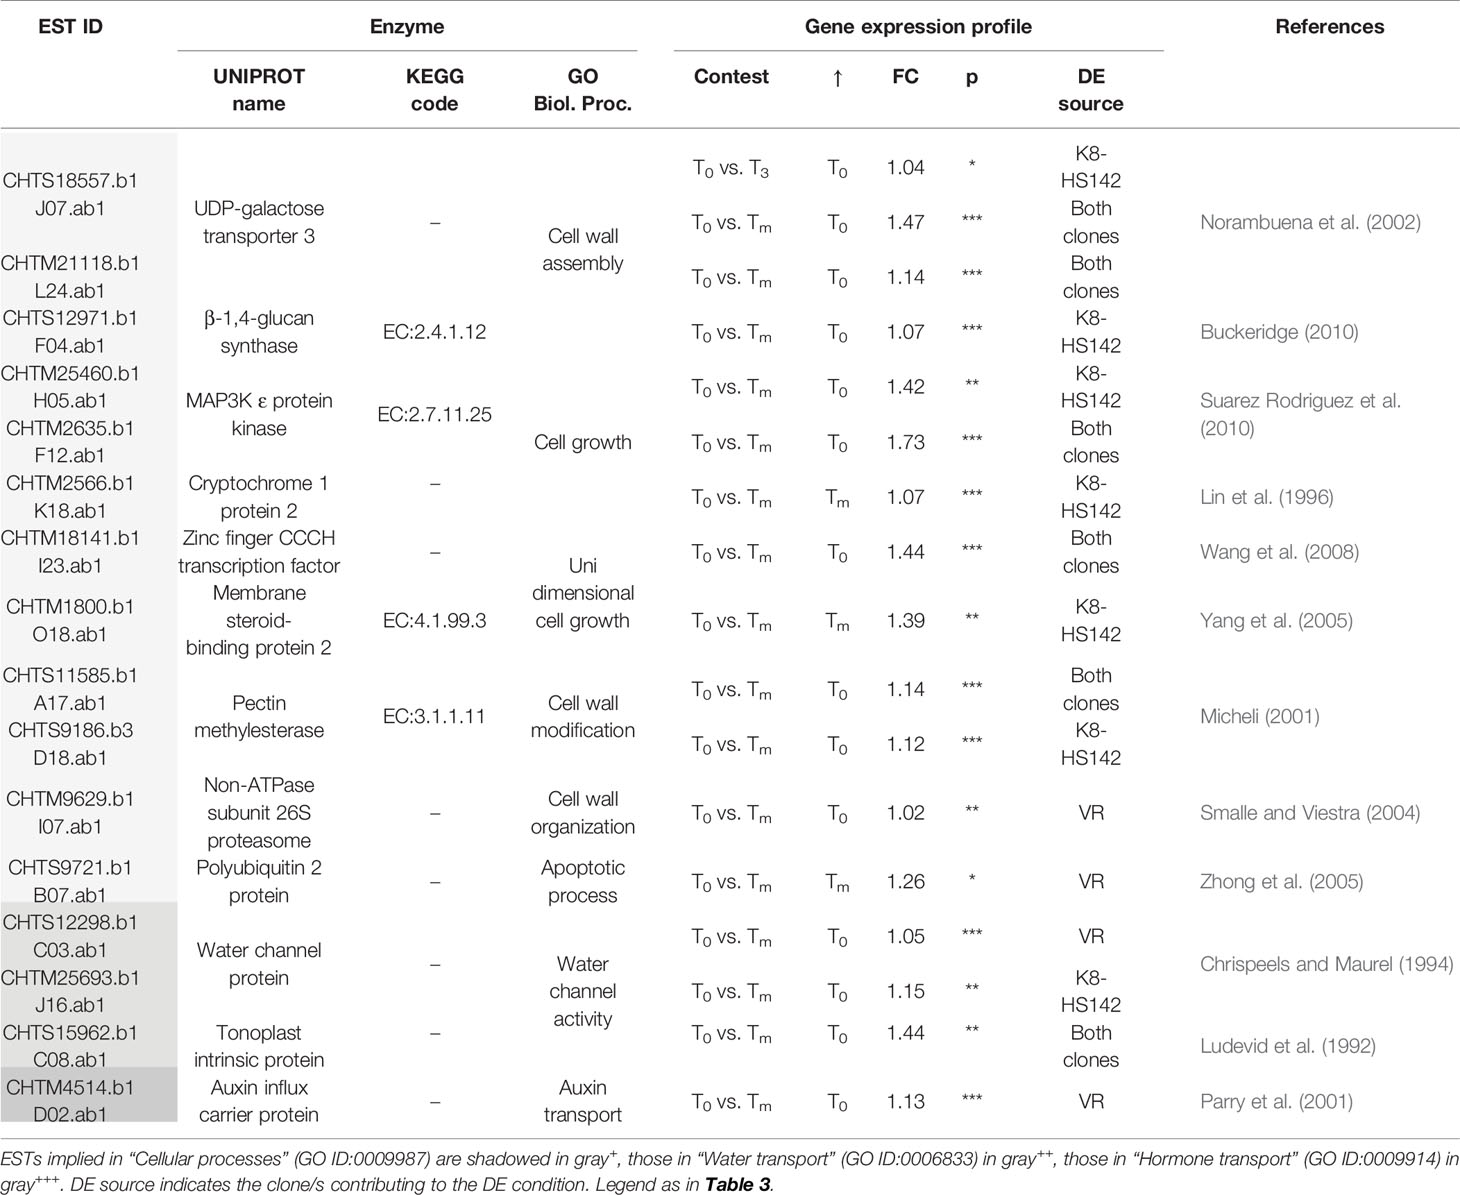
Table 7 Differentially expressed (DE)/expressed sequence tags (ESTs) between tuber stages taking a role in cell development.
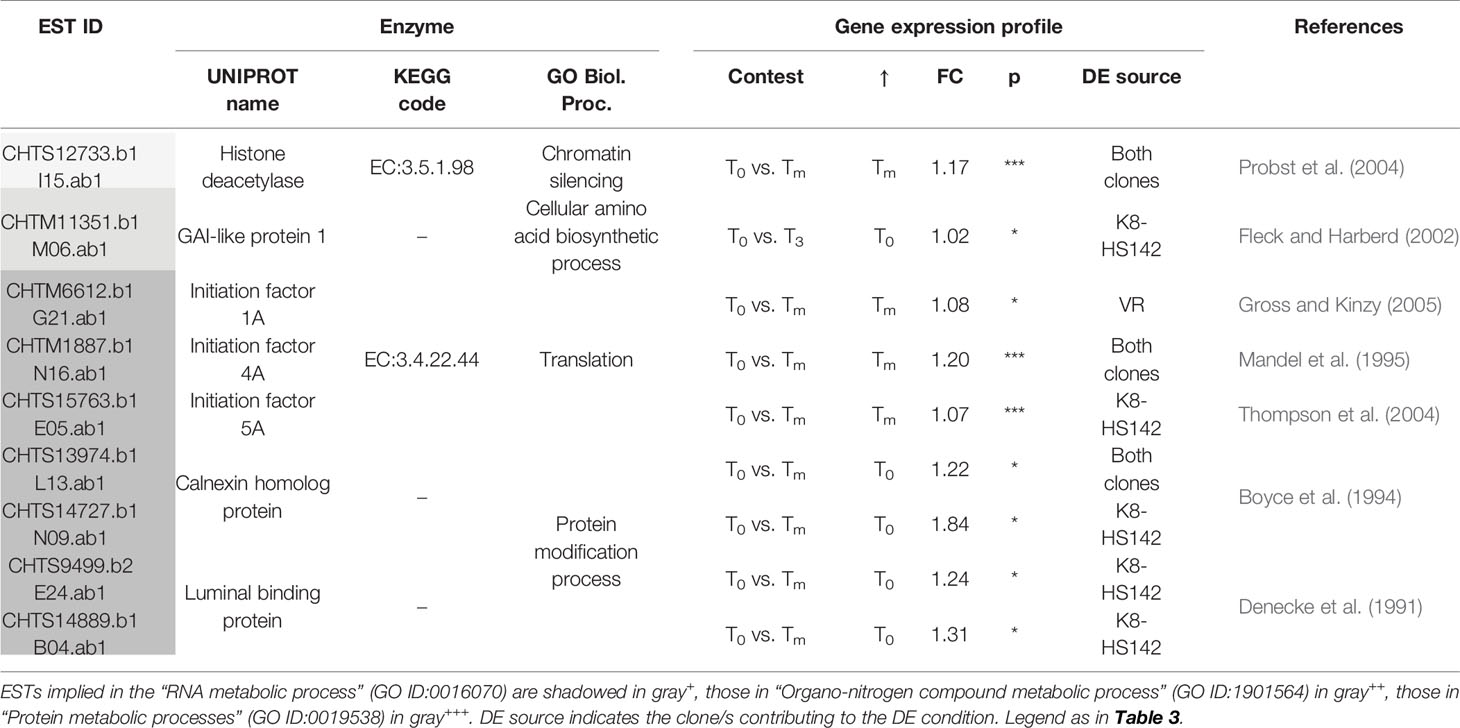
Table 8 Differentially expressed (DE)/expressed sequence tags (ESTs) between tuber stages taking a role the metabolism of nucleic acids and proteins.
Two different ESTs encoding for a sugar transporter ERD 6-like 6 (CHTM14126.b1 and CHTM16917.b1), driving the simple sugars movement through vacuole tonoplast, were upregulated at Tm, while another EST for a sugar transporter ERD 6 (CHTM25693.b1) was upregulated at T0 even though at a lower intensity.
In the transition between T0 and T3, a total of 10 DE/ESTs were found to be implied in the “Primary metabolic P” and one in the “Cellular P” (Table S5). Among the former group, CHTS9987.b2 (β subunit of pyruvatekinase) and CHTS11351.b1 (GAI-like protein), involved in processes such as canonical glycolysis and amino acid biosynthesis were upregulated at T0, while EE258072.1 (phospho-glyceratekinase), active in the canonical glycolysis, was overexpressed at T3 (Tables 6 and 7). With regard to the latter group, CHTS18557.b1 (UDP-galactose transporter 3), involved in the cell wall assembly, was overexpressed at T0.
The Temporal Expression Profiles of Expressed Sequence Tags/Genes Specifically Involved in the Carbohydrate Metabolism
Among the subset of 1,227 ESTs selected for being associated to the “Carbohydrate metabolic process” present in the chip (Table 1), 224 play a specific role in the metabolism of storage carbohydrates (Table S6).
Among them, 76 code for enzymes acting in the pathways of hexose metabolism, 79 in sugar transport through cell membranes, 56 in starch metabolism, and 14 in fructan biosynthesis. A total of 16 of these ESTs showed higher expression levels at one or more tuber stages in either “VR” or “K8-HS142” or both. The relative expression profiles of ESTs linked to specific enzymes operating in the hexose and sucrose metabolism, such as sucrose/H+ symporter (SuSym), alkaline/neutral invertase (INV), PGM, UDPG-pyrophosphorylase (UDPGP), glucokinase (GCK), sucrose phosphatase (SuP), sucrose phosphate-synthase (SuPS) and sucrose synthase (SuS), fructan biosynthesis, such as 1-SST and 1-FFT and starch metabolism, such as glucose 1-P adenylytransferase (AGPase), glucose-6P translocator (G6PT) and starch synthase (SS), are reported in the heat map in Figure 4, whereas in Table S7 are given their absolute expression levels.
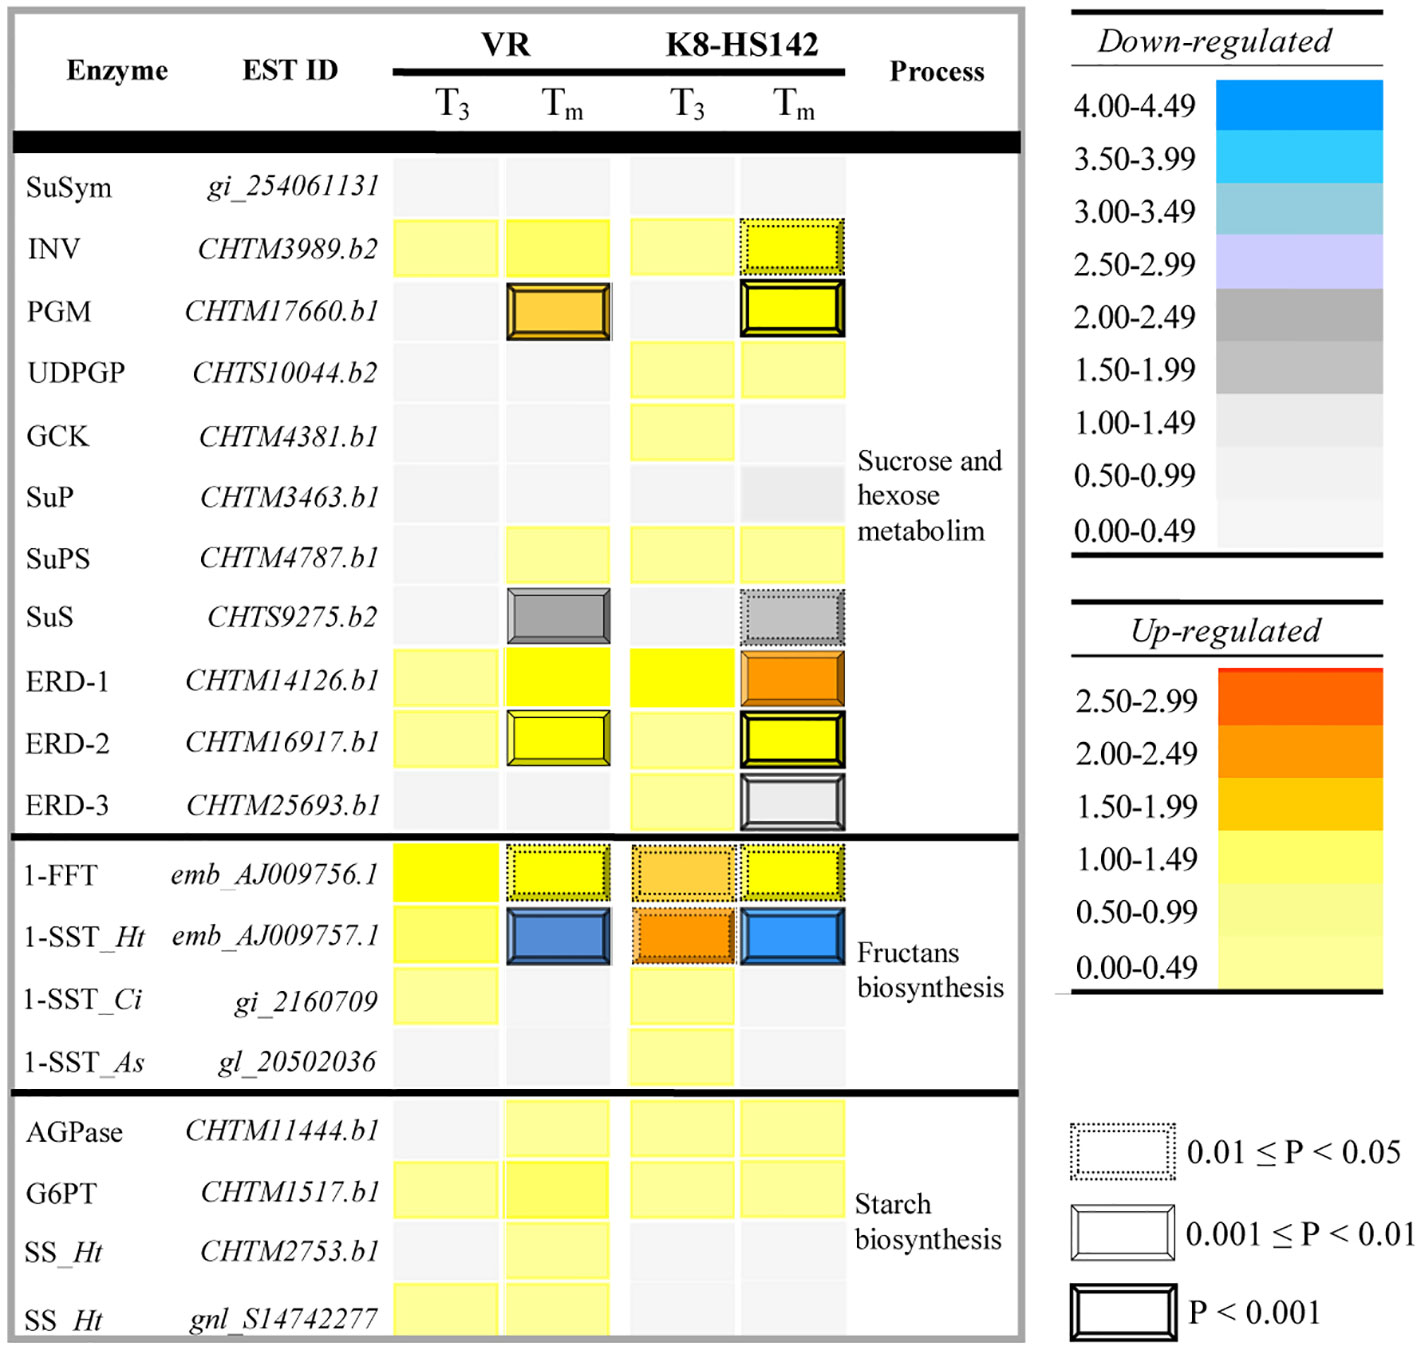
Figure 4 Temporal expression of the expressed sequence tags (ESTs) involved in the metabolism of storage carbohydrates in Helianthus tuberosus “VR” and “K8-HS142” clones. The relative emission levels of ESTs implied in the metabolism of sucrose, fructans, and starch at T3 or Tm compared to T0 reference stage (when tuberization begins), both in “VR” and “K8-HS142,” are displayed through a heat map. Magnitudes and statistical relevance of each EST contest are in the map. The statistical significance of the differences were tested according to the LIMMA. Key to genes. Simple sugars metabolism. SuSym, Sucrose H+/symporter; SuP, Sucrose phosphatase; SuS, Sucrose synthase; INV, Neutral/alkaline invertase; GCK, Glucokinase; PGM, Phosphoglucomutase; UDPGP, UDP-glucose pyrosphorilase; ERD, Early Response to Dehydration 6 - H+/Glucose symporter. Fructan polymerization. 1-SST, Sucrose:sucrose 1-fructosyltransferase; 1-FFT, Fructan:fructan 1-fructosyltransferase. Starch metabolism and polymerization. G6PT, Glucose 6-phosphate translocator; SS, Starch synthase. Ht, Helianthus tuberosus; St, Solanum tuberosum; Ci, Chicorium intybus; As, Allium sativum.
The ESTs for SuS (CHTM9275.b2), PGM (CHTM8761.b1), and INV (CHTM3989.b2) were DE between tuber stages (Table 6; Figure 4). The EST for SuS enzyme, operating in the breakdown of sucrose, was downregulated at Tm in comparison to T0 and T3 in both “VR” and “K8-HS142”, PGM peaked at Tm in both clones while INV only in “K8-HS142” (Figure 4; Table 6).
With regard to the genes for the biosynthesis of fructans, both the ESTs native from H. tuberosus, 1-SST (Ht_1-SST, AJ009757.1) and 1-FFT (AJ009756.1), were DE between T0 and Tm in both clones (Figure 4; Table 6).
Probes for 1-SST-EST from Cichorium intybus (Ci_1-SST, gi_2169709) and Allium sativum (As_1-SST, gl_20502036) also emitted signals (Table S7). These data suggest the presence of multiple but different gene members in H. tuberosus genome acting as sucrose:sucrose 1-fructosyltransferase. On this concern, we note that Ci_1-SST and As_1-SST ESTs showed dissimilarities at the nucleotide level (75.9% and 52.6%, of sequence similarity, respectively) to Ht_1-SST (Table S8).
The 1-FFT-EST was more expressed at T3 and Tm in comparison to T0 in both “VR” (+143% and +205%) and “K8-HS142” (+181% and +174%), although with a different trend: in “VR,” it reached the maximum expression levels at Tm, whereas in “K8-HS142,” it peaked at T3 (Tables 6 and S7; Figure 4).
The EST/genes encoding for the enzymes operating in the starch biosynthesis, such as G6PT (CHTM1517.b1), AGPase (CHTM11444.b1), and SS (CHTM2753.b1 and S14742277.b1), involved in glucose-6P mobilization from cytoplasm to amyloplast, turning glucose-1P into ADP-glucose, and glucose polymerization into starch, respectively, exhibited very low and no significantly different expession levels between either T3 or Tm and T0 (Figure 4; Table S7). At T3, the set of ESTs encoding for enzymes involved in the fructan polymerization (1-FFT, Ht_1-SST, As_1-SST, Ci_1-SST) were expressed to a higher average extent than those implied in the metabolism of hexose and sucrose (SuSym, INV, PGM, UDPGP, GCK, SuP, SuPS, SuS), which, in turn, were more expressed than the ESTs for starch biosynthesis (G6PT, AGPase, SS) (Table S7).
In order to verify the temporal expression profiles of the essential genes implied in the carbohydrate biosynthesis, the ESTs/genes encoding SuS and PGM enzymes acting in the sucrose breakdown and 1-SST and 1-FFT crucial for fructan polymerization were analyzed further by the q-RT-qPCR technique on independent RNA samples.
In keeping with that observed with microarray, the expression level of SuS-EST (CHTS9275.b2) diminished steadily during the entire tuber development in both clones (Figure 5). In line with microarray analysis, the expression of PGM (CHTM8761.b1) decreased slightly from T0 to T3 to significantly increase up to the final stage of maturation (Figure 5). Full concordance between data from qRT-PCR and microarray also emerged for the temporal expression profile of 1-SST-EST (AJ009757.1) and 1-FFT-EST (AJ009756.1) (Figures 4 and 5). Both analyses detected a higher expression level of the latter EST at T3 in “K8-HS142” and a quite linear increase during tuber development in “VR.”
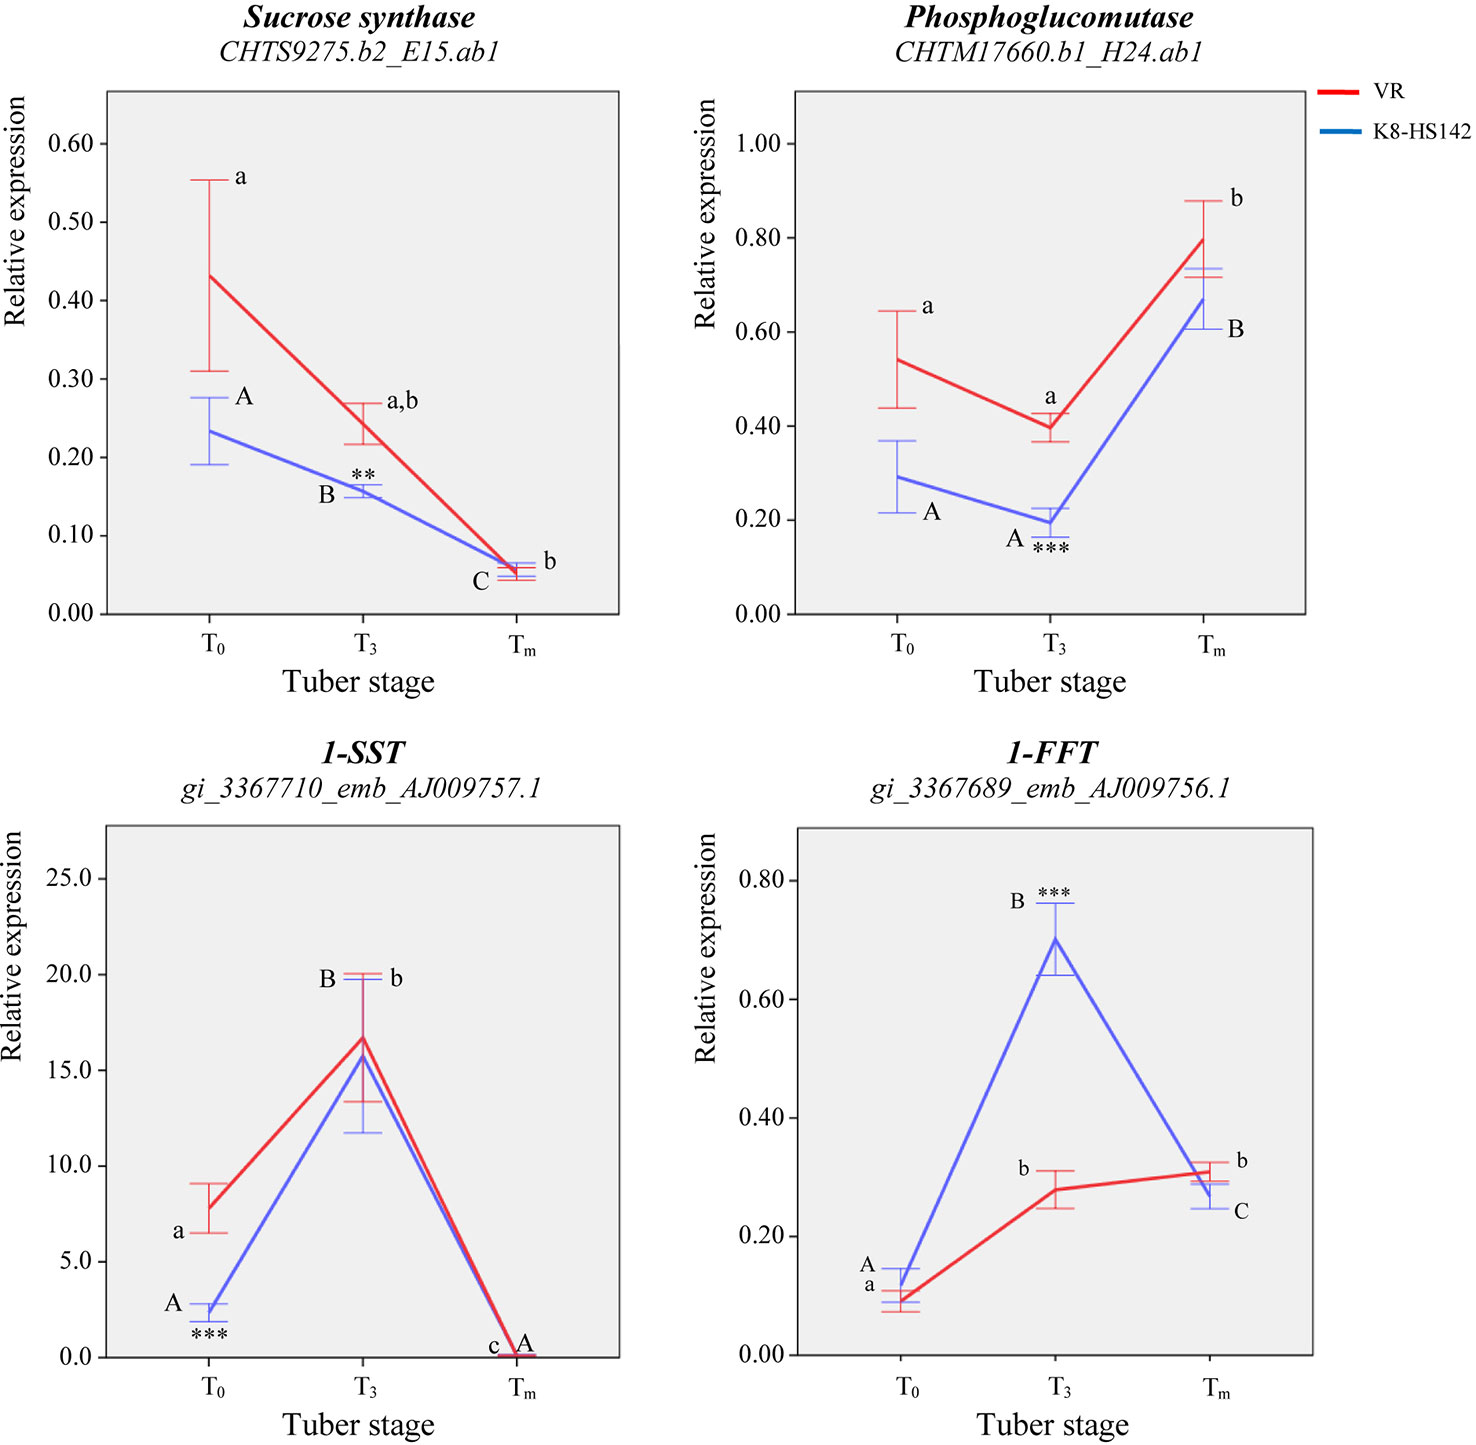
Figure 5 qRT- PCR analysis of key genes ruling the metabolism of storage carbohydrates in developing tubers of Helianthus tuberosus “VR” and “K8-HS142” clones. The temporal expression profiles by means of qRT- PCR at three specific tuber developmental stages (T0, T3, and Tm) of genes implied in the cytoplasmatic metabolism of hexoses such as SuS and PGM, and fructan polymerization, 1-SST and 1-FFT, which were differentially expressed upon microarray analysis, are shown. The relative expression of each gene is calculated using the (2-ΔCt) algorithm. Statistically significant differences were assessed according to a two-way ANOVA between T0, T3, and Tm stages in “VR” and “K8-HS142” (indicated as a, b, c and A, B, C, respectively). Asterisks **, *** indicate the significance of the differences of transcript levels between clones at a given tuber stage (0.01 ≤ p < 0.01 and p < 0.001, respectively). The bars indicate ±1 standard deviation.
Overall, the temporal expression profile of the two critical genes for the polymerization of inulin was similar in “K8-HS142,” where both peaked at T3, while differed in “VR” where 1-SST peaked at T3 to significantly decrease at Tm, whereas 1-FFT steadily increased with tuber maturity.
The qRT-PCR analyses also confirmed that the relative expression of 1-SST-EST was several order of magnitude higher than that of 1-FFT-EST (Figure 5; Table S7).
Discussion
The Jerusalem artichoke is an inulin-rich crop adapted to low-input agro-ecosystems (Cassels and Walsh, 1995; Mecella et al., 1996; Paolini and De Pace, 1997; Zhao et al., 2005; Kays and Nottingham, 2007; De Pace et al., 2010). The enzymatic basis of fructans metabolism and storage (Edelman and Popov, 1962; Dickerson and Edelman, 1966; Edelman and Jefford, 1968; Lüscher et al., 1996), the kinetics of 1-SST and 1-FFT enzymes (Koops and Jonker, 1994; Koops and Jonker, 1996), and genes coding for these enzymes are known for decades (Van der Meer et al., 1998).
A recent study has characterized the transcriptional levels of 1-SST and 1-FFT genes and measured the activity of the enzymes coded by these genes and by fructan exohydrolase (FEHs) genes, essential for inulin degradation, to analyze the sugar metabolism dynamics in tubers and bud eyes/shoots of a cultivar of H. tuberosus during germination (Jiao et al., 2018). The transcriptional profiles of the Jerusalem artichoke FEHs under stress was also investigated (Xu et al., 2015).
Here we analyzed, for the first time, the expression profile of key genetic determinants underlying tuber development, biosynthesis, and storage of complex carbohydrates in the tubers of two clones of H. tuberosus at three developmental stages.
The analysis of the transcriptome carried out here was performed by microarray because at the time the present study started, it was the most common choice of researchers to conduct transcriptional profiling experiments. Despite several superior benefits of RNA-seq over Microarray, RNA-seq technologies at that time were in fact more expensive, and data storage more challenging than microarray (Yan Guo et al., 2013; Zhao et al., 2014). We also note that because of the limited genetic resources available for H. tuberosus, the first assembly and annotation of its transcriptome by RNA-seq has been produced only very recently by Jung et al. (2014) who developed the first transcriptome dataset from five tissues, followed by Zhang et al. (2018) who assessed the transcriptomes in the tubers in response to salt stress.
Our study provides a model according to which the steady-state levels of 1-SST and 1-FFT transcripts are developmentally controlled and might represent a limiting factor for inulin accumulation. Target genes and tuber traits for breeding clones with enhanced levels of inulin have also been identified.
Different Growth Rate and Pattern of Inulin Accumulation Between Jerusalem Artichoke Clones
The two selected clones of the Jerusalem artichoke show different growth habitus both in the epigeous and hypogeous organs. “VR” plants present multiple stems, those of “K8-HS142” are prevalently unbranched, “VR” forms pear-shaped tubers, those of “K8-HS142” are heavier and slender (Figures 2B, C). In “K8-HS142,” tuber differentiation starts later and tuber enlargement is slower than those in “VR” (Figure 2A). Conversely, the ripening phase is similar in length but dissimilar for what concerns the pattern of inulin accumulation. While at T3 the inulin content and its DP are significantly higher in “K8-HS142,” at Tm, there are no differences between the clones (Figures 3). This because in “K8-HS142” inulin increases only slightly during the ripening stage.
Thus, the present study paves the way to agronomic trials to verify whether this pattern of inulin accumulation characterizes all clones with slender tubers and whether slender tubers produce more dry matter than pear-shaped ones at Tm, regardless of farming systems adopted. Should these hypotheses be confirmed, then the target for the breeders would be to select genotypes with slender tubers on which the transcript levels of key genes such as 1-FFT do not drop at Tm to maximize inulin yield (see below).
Finally, as far as starch content in tubers is concerned, only traces are found in mature tubers from both clones, confirming fructans as the dominant storage polysaccharides in H. tuberosus.
Differentially Expressed Genes in the Rhizomes of the two Clones Rule Next Tuber Growth
A total of 60 and 11 DE/ESTs were detected between the two clones at the onset of tuberization and at the active tuber growth stage, respectively, whereas no DE/ESTs were found at the final stage of tuber ripening (Table 2). These data depict a picture where differences in tuber morphology and physiology between the clones are genetically determined since the early stages of rhizome enlargement.
In keeping with this observation, we note that the two clones differ for the expression of several genes related to cell development and growth, which at T0 are significantly more expressed in “K8-HS142” than in “VR” (Tables 3–5).
Much of plant physiology, growth, and development is controlled by the selective removal of short-lived regulatory proteins mediated by the 2-MDa protease complex (Smalle and Viestra, 2004) and we assessed that among DE/ESTs between clones at T0, there are those coding for ubiquitin-like modifier activating protein, shaggy related proteins, and non-ATPase subunit of 26S proteasome, all upregulated in “K8-HS142.” The E3 ubiquitin ligase belongs to the class of cytokinin downregulated genes (Rashotte et al., 2003). Because cytokinins play a fundamental role in promoting the tuber initiation (Palmer and Smith, 1969), the different extent in transcripts for an E3 ubiquitin ligase (CHTS19020.b1) at the initial stage of tuberization between the two clones could contribute to trigger the different precocity in tuber development. Yet, the differential expression of an auxin response factor (CHTS10787.b1) between the clones at T0 points toward the same conclusion.
Also, ESTs/genes controlling protein processes, such as translation, amino acid biosynthesis, protein stabilization, and modification, are upregulated in “K8-HS142” at T0, while those for protein depolymerization (i.e., aspartic protease and proteosome subunit β-type 5A) are downregulated in the same clone at initial tuberization (Table 5). This evidence led us to argue that processes related to protein biosynthesis take place to a different extent between the pear- and slender-shaped clones (Figures 2B, C; Figures S1-A2, B2). At T0, the two clones also differ for the expression of genes related to glycolysis and electron transport chain (Table 3), upregulated in “K8-HS142,” to suggest that a different rate of glycolysis might occur at the beginning of tuber development in “VR” and “K8-HS142” that, in turn, might affect the differences in the morphological and physiological traits of the tubers.
Key Genes Related to the Development of Tubers in the Jerusalem Artichoke
By comparing the expression patterns between different Jerusalem artichoke tissues/organs by RNA-seq, Jung et al. (2014) pointed that the lowest number of DE genes (949) were noted between tubers at initial vs. maturation stage and concluded that “metabolic processes are similar at both stages of tuber development”.
In the present study, we aimed at detecting the genes liable for the processes of development and maturation of the Jerusalem artichoke tubers, regardless of the clone. To this end, we considered the DE/ESTs across the three developmental stages. From these comparisons, it emerges that the higher number of DE/ESTs is between the two extreme stages, T0 and Tm, and these belong to the GO categories of “Cellular process,” including biological events dealing with cell growth, cell wall assembly and modification, water and hormone transport, protein modification, and carbohydrate metabolic processes (Tables 6–8).
In essence, our transcriptomic data fit well with the developmental processes of tubers, which in their initial stage need actively dividing and enlarging cells. Therefore, it makes sense the activation at T0 of genes playing an essential role in the cell growth, cell wall assembly, modification, and organization, water influx into cell and vacuole, and protein modification processes.
The finding that most of the DE/ESTs implied in cell growth (i.e., CHTM25460.b1 and CHTM2635.b1 for MAP3K ϵ protein kinase), cell wall assembly (CHTS18557.b1 and CHTM21118.b1 for UDP-galactose transporter 3), cell wall modification (CHTS11585.b1 for pectin methylesterase), and water intake into the vacuole (CHTS15962.b1 for tonoplast intrinsic protein) are concomitantly upregulated in both clones at this stage (Table 7) suggests them as the major players of these processes in both pear- and spindle-shaped clones. The overexpression at the initial tuberization of one EST for an auxin influx carrier protein is in keeping with what is supposed to occur and the role played by this hormone when tuber begins enlarging. In tobacco cultured cells, three-quarters of auxins enter the cells through the auxin influx carrier (Parry et al., 2001) and auxin in potato is vital for cellular water intake, differentiation and growth of tuber cells (Carlier and Buffel, 1955; Roumeliotis et al., 2012). It is also noteworthy that a member of the Zinc finger CCCH family, known to be a key regulator of plant development and to act at transcriptional and toposttranscriptional level (Wang et al., 2008), is significantly upregulated at T0 in both clones.
Conversely, ESTs encoding for a membrane steroid binding protein, a cryptochrome 1, and a polyubiquitin 2 protein are upregulated at Tm (Table 7). The membrane steroid binding protein has been characterized as a negative regulator of cell elongation in different plant species such as A. thaliana (Yang et al., 2005), cryptochrome 1 is an inhibitor of hypocotyls and plant growth in A. thaliana (Lin et al., 1996), and polyubiquitin is associated with apoptosis (Zhong et al., 2005), all of which are events expected to occur at the final stage of maturation. The concomitant overexpression at Tm of one EST for a histone deacetylase (CHTS12733.b1), operating in the chromatin and gene silencing in both “VR” and “K8-HS142,” also heads to the limitation of cell growth at the final stage of tuber development.
However, ESTs encoding for the initiation factors 1, 4, and 5A (CHTM6612.b1, CHTM1887.b1, CHTS15763.b1), involved in cell morphology (Mandel et al., 1995; Thompson et al., 2004; Gross and Kinzy, 2005) are overexpressed at Tm in both clones. This evidence suggests that the translational processes are fundamental until tuber maturation, regardless of the clone analyzed.
At this stage, among the more expressed ESTs implied in the carbohydrate metabolism there is one coding for an alkaline/neutral invertase and one for an aldolase (Table 6). The alkaline/neutral invertase catalyzes the sucrose breakdown into fructose and glucose. In carrots, the presence of this transcript occurs in all organs with slightly higher levels in developing organs, suggesting a widespread role of this enzyme in growth-related function (Sturm, 1999). The upregulation of an aldolase also fits with what it is expected to occur at the final stage of tuber development, since this enzyme negatively affects plant growth (Haake et al., 1998).
A Model to Explain the Dynamics of Carbohydrate Storage in the Jerusalem Artichoke Tubers
The observed patterns of EST expression during tuber development in H. tuberosus provide new insights on the dynamics of storage carbohydrate accumulation in these auxotrophic organs.
The tuber growth and carbohydrate production depend on sucrose phloematic transport from the leaves and stalk to the rhizomes (Edelman and Popov, 1962; Dickerson and Edelman, 1966). A strong initial sucrose supply is necessary to power a large fructose availability for fructan polymerization, but also to power and sustain the whole tuber growth. The expression level displayed by the EST encoding for the SuSym protein (gi_254061131), fundamental to enter the sucrose into tuber cells from phloem (Figure 6), fits with this model, since it is expressed all over the tuber developmental stages, although its expression is slightly higher at the initial phase of tuberization (Figure 4; Table S7).
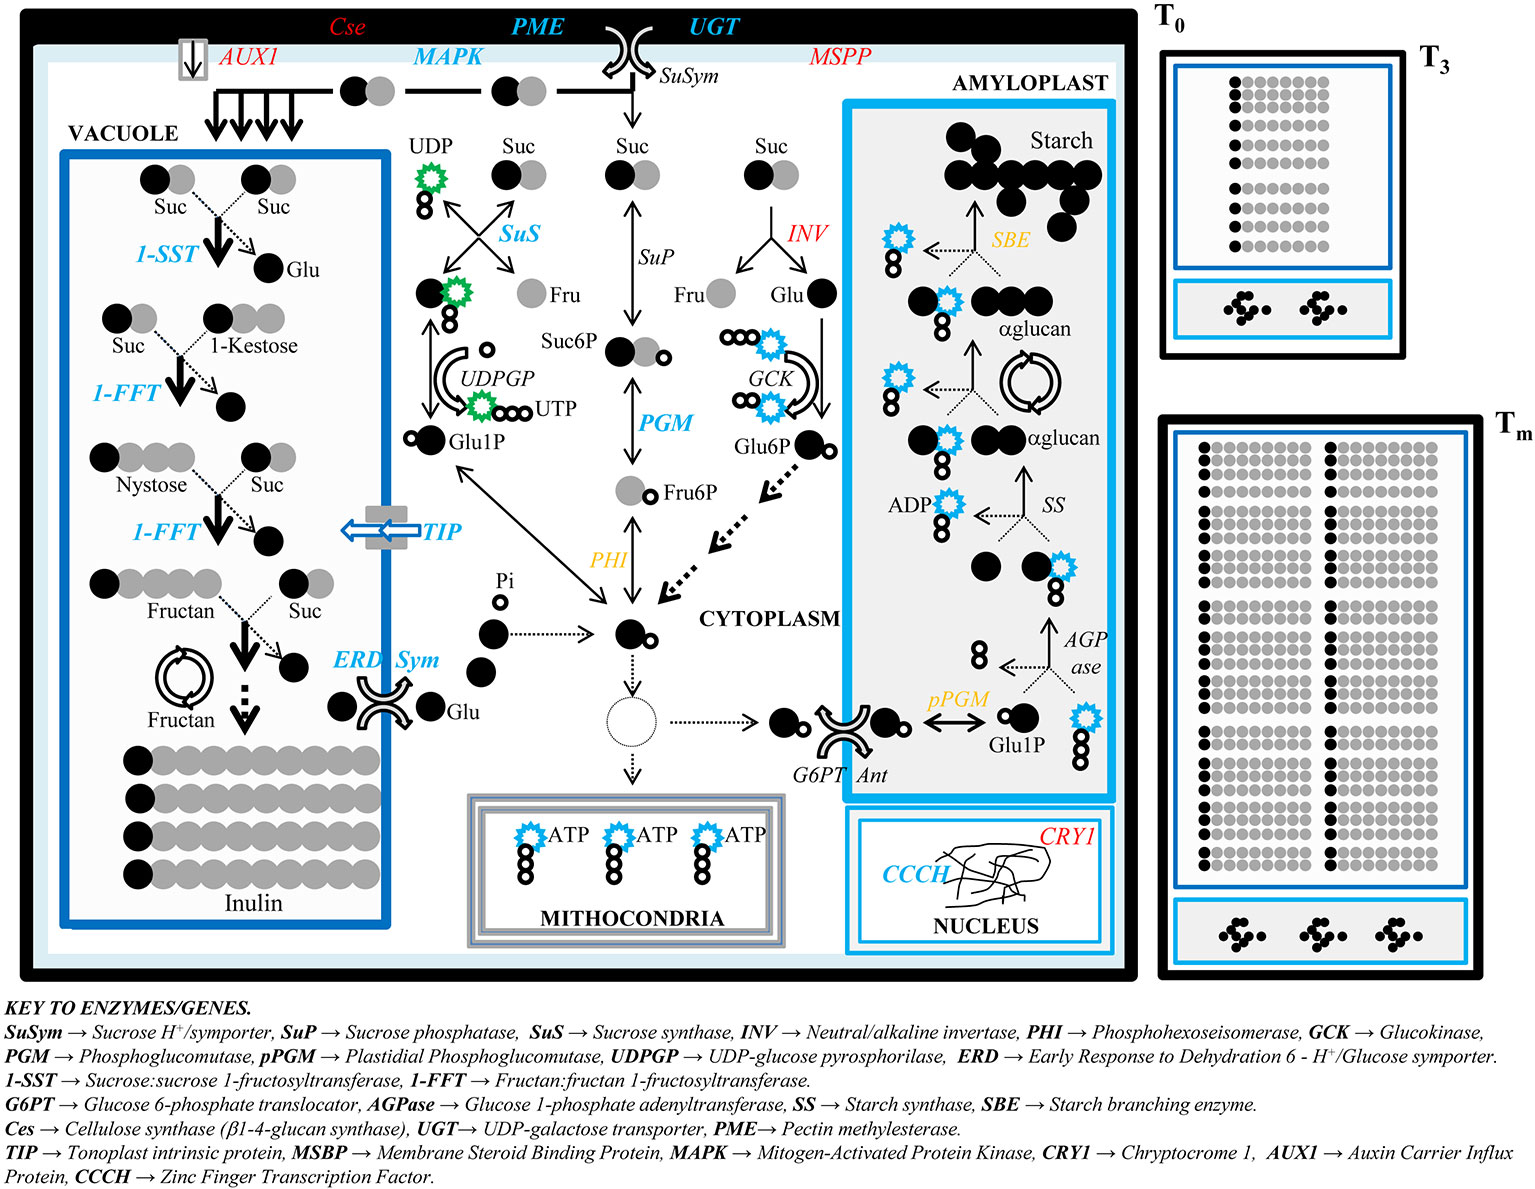
Figure 6 Model of inulin accumulation and cell growth in developing tubers of Helianthus tuberosus. A scheme is proposed to display the metabolic pathways of sucrose breakdown in the cytoplasm, fructan polymerization in the vacuole, and starch biosynthesis in the amyloplast from when rhizome starts enlarging (T0) until the stages of tuberous maximum growth rate (T3) and final tuber maturation (Tm). While cell at T0, regarded as the reference stage in tuber development process, is displayed in the foreground, cells at the two next stages, when inulin deposition takes place moderately (T3) and massively (Tm), are depicted smaller near the T0 cell. The main enzymes affecting the metabolism of carbohydrates as well as cell wall assembling and the overall cell growth are shown and placed in the cell compartments of their action. Emphasized arrows point to massive metabolic pathways. Enzymes whose genes are differentially expressed (DE) between T0 and Tm are reported in bold blue (if DE in both clones) or in red (if DE in one clone). The enzymes indicated in orange have genes not investigated in this study.
The combination of 1-SST and 1-FFT enzymes purified from H. tuberosus can synthesize in vitro long-chain inulins from sucrose according to the classic two-step model (Edelman and Jefford, 1968; Lüscher et al., 1996; Koops and Jonker, 1996). The rate of 1-kestose (GF2) production by 1-SST is a function of the sucrose content in the tuber cells, and the enzyme deploys the upmost activity when the substrate concentration is elevated (around 1 M), as demonstrated by in vitro studies on long-term incubation time (80 h at 25°C). In addition to large amounts of GF2, other oligosaccharides are yielded, although at lower rate, as consequence of self-transfructosylations with GF2 and 1,1-nystose (GF3), such as GF3 and 1,1,1-fructosylnystose (GF4), respectively, all of them employed by 1-FFT to produce inulin (Edelman and Jefford, 1968) (Figure 6A). However, while the 1-SST-mediated GF2 synthesis is favored by high sucrose concentration, the 1-FFT-mediated second phase of fructan synthesis from GF2 to GFn-1 is competitively inhibited by sucrose (Koops and Jonker, 1994).
The expression level of the Ht_1-SST EST (AJ009757.1) keeps up with the progress of fructan accumulation over tuber growth. In fact, both the inulin content (Figure 3) and the expression level of 1-SST peak at T3, as per microarray and qRT-PCR analyses (Table 6; Figure 5). This clear evidence of the tight relationship between the 1-SST gene expression pattern and inulin accumulation rate in H. tuberosus mirrors what has been shown to occur between 1-SST enzyme and other classes of fructans (i.e., inulin neoseries, levans, and mixed-type levans) in other species (Edelman and Jefford, 1968; Vijn et al., 1997; Vijn and Smeekens, 1999).
Microarray results also indicate that two further genes for 1-SST, in addition to the unique 1-SST transcript from the H. tuberosus described so far (Van der Meer et al., 1998), are expressed during tuber development (Figure 4; Table S5). The low sequence similarities with Ht_1-SST (75.9% for Ci_1-SST and 52.6% for As_1-SST) (Table S6) let us to argue that they are contributed by different H. tuberosus ancestral genomes. H. tuberosus is an allopolyploid species (2n=6x=102) derived from the merging of two duplicated genomes provided by the tetraploid Helianthus hirsutus with a third differentiated genome from the diploid Helianthus grosseseratus (Pustovoit et al., 1976; Bock et al., 2014). Our findings would suggest that the three different 1-SST genes reflect as many as genomes contributed to shaping the hexaploid H. tuberosus and that they might be useful markers to trace its origin.
Jung et al. (2014) reported the higher expression levels of both 1-SST and 1-FFT at the tuber maturation stage rather than at the tuberous initial stage in cultivar, “Purple Jerusalem,” but no data relative to the progress of inulin accumulation in this cultivar were provided. The different timing of tuber collection and cultivars employed make it challenging to draw any parallelism between present and Jung et al.'s studies.
However, we note that in the present study the levels of 1-SST transcripts are lower at Tm than any previous stage investigated in both clones and that the EST encoding for 1-FFT (AJ009756.1) increases at T3 in both clones to drop at Tm in “K8-HS142,” although to levels higher than at T0 (Figure 5). Thus, present work provides evidence that 1-SST and 1-FFT genes are regulated differently to each other and throughout the development of tubers, being 1-SST highly transcribed since the beginning of tuberization until the active growth stage and 1-FFT during the next phases of tuber ripening, contributing to inulin accumulation and elongation (Figure 3). The qRT-PCR data also show that the transcript levels of 1-SST (AJ009757.1) are far higher than those of 1-FFT_EST (AJ009756.1) from T0 to T3 (Figures 5C, D).
Since 1-SST and 1-FFT enzymes work in H. tuberosus at comparable activities (Koops and Jonker, 1994), the larger population of 1-SST transcripts than 1-FFT ones assessed during these stages is consistent with the need of high levels of 1-SST enzyme to process large amounts of sucrose to supply inulin stretching by 1-FFT.
Based on the kinetics and substrate specificity assays, the two-step model predicts de facto a synchronized activity of 1-SST and 1-FFT enzymes in H. tuberosus. Also in chicory roots, inulin accumulation results from a combined, but temporarily shifted, activity of 1-SST and 1-FFT: 1-SST activity is prominent in the early vegetative stage and then declines, while 1-FFT remains more or less constant throughout the growing season (Van Laere and Van den Ende, 2002).
Our study extends previous findings in that it points gene transcription and/or RNA turnover as a key regulatory process controlling the dynamics of inulin accumulation in H. tuberosus.
That the activity of the 1-SST and 1-FFT enzymes strictly mirrors the transcriptional levels of the respective genes has been shown in barley leaves, where it was found that 1-SST transcript and enzymatic activity are both subject to a rapid turnover, while the grasses specific fructan-6-fructosyl transferase (6-SFT) transcript and enzymatic activity were found to be much more stable (Nagaraj et al., 2004). Additionally, in the same study, it was shown that in young leaves, sucrose and light appear to be critical factors for the induction of these genes. Barley 1-SST seems to have a lower threshold for the activation by cytosolic sucrose than 6-SFT gene and 1-SST transcripts are rapidly downregulated in the dark likely because of specific sequences in the UTR known to influence transcript stability.
In tubers, light is not expected to play a fundamental role, rather sucrose and other environmental factors might control the transcriptional rate, RNA stability, and/or enzymatic activity of 1-SST and 1-FFT. As an example, in vitro studies have shown that the two H. tuberosus enzymes have different optimal working temperatures, ranging between 20°C–25°C and 25°C–35°C for 1-SST and 1-FFT, respectively (Koops and Jonker, 1994; Koops and Jonker, 1996). At the medium latitudes, the stages of tuber enlargement and complete dimensional development occurs in late spring–early summer, whereas final tuber maturation occurs in summer, under higher temperatures. Thus, it is conceivable that temperature might be one of the drivers that control RNA transcription and turnover and, consequently, the enzymatic activity of 1-SST and 1-FFT.
As far as differences between clones are concerned, we note that the expression profiles for 1-SST are similar, but the steady-state levels of these transcripts are significantly higher in “VR” at T0 (Figure 5). The expression profiles of 1-FFT are conversely dissimilar (Figure 5). In “VR,” 1-FFT markedly increases from T0 to T3 and steadily, albeit not significantly, from T3 to Tm, whereas in “K8-HS142,” it peaks at T3 and drops at Tm at the same levels shown in “VR.” It is worth noting that at T3, both 1-FFT and inulin levels are significantly higher in “K8-HS142” than those in “VR.” The data suggest a clone-specific regulation for 1-FFT and open the avenue for targeted studies aimed at identifying polymorphisms in the regulatory regions of this gene between H. tuberosus clones. On this concern, we are tempted to speculate that 1-FFT gene from “K8-HS142” is more prone than its orthologous in “VR” to a sucrose-mediated inhibition. Whatever are the reasons for 1-FFT dropping at Tm in “K8-HS142,” our results are promising for breeding purposes since it appears conceivable to select and cross clones with the aim to maximize and sustain, up to the final stage of tuber development, the levels of 1-FFT.
Finally, according to our model, the rate of sucrose supplying chain elongation decreases with tuber ripening. Thus, at Tm, sucrose is mainly used to power other cellular processes such as glycolysis. Support to our hypothesis comes from the evidence that, in both clones, two out of three total ESTs for the ERD 6-like 6, peak at Tm (CHTM14126.b1, CHTM16917.b1) (Table 6; Figure 4). The ERD 6-like are H+ proton/symporter exporting glucose from vacuole to cytoplasm (Poschet et al., 2011; Hu et al., 2019). In turn, a high flow of sucrose to the cytoplasm might be responsible for the decreased levels of 1-FFT in “K8-HS142.”
Starch is the principal storage polysaccharide in tuberous species grown worldwide such as potato, where a set of genes encoding for enzymes functioning in the cytoplasm, such as glucokinase (GCK) and glucose 6P/translocator (G6PT), or into the amyloplast, such as AGPase and starch synthase (SS), are switched on during the tuber development (Geigenberger, 2011) (Figure 6). Even though the sucrose imported from phloem into the tuber cells could potentially support the entire starch biosynthetic path in H. tuberosus (Figure 6B), here we show that starch is stored negligibly in its mature tubers. In line with this, we note that the ESTs for starch biosynthesis show emittance levels lower than those for fructans (Table S7), and their expression levels are not significantly different across tuber stages (Figure 4).
The expression profiles of ESTs encoding for SuS (CHTS9275.b2) and PGM (CHTM8761.b1) enzymes could also aid to address the issue of low storage of starch (Figures 4 and 5). In potato tubers, SuS is the major responsible for sucrose breakdown (Zrenner et al., 1995), and the observation that SuS-EST transcripts are accumulated massively at T0 in both H. tuberosus clones let us to argue that at the initial stage of tuberization, the glucose released by this enzymatic activity will propel glycolysis for generating ATP and power cell growth (Figure 6). Notably, of the two corn paralogous genes that encode isoenzymes of SuS, only one is needed for generating precursors for starch biosynthesis, whereas the other provides the substrate for cellulose biosynthesis (Chourey et al., 1998).
On the contrary, the massive expression of PGM at Tm would address the remaining glucose, not more necessary to power tuber development processes via glycolysis, toward the formation of sucrose and inulin, guaranteeing the minimum loss of unexploited glucose. At this regard, we note that in potato tubers, the expression of the StcPGM gene in antisense orientation led to the accumulation of sucrose in the amyloplast and the reduction of starch (Fernie et al., 2000).
Figure 6 provides a model to describe the parallel progresses of inulin accumulation and cell organization throughout the development of H. tuberosus tubers in which are highlighted the DE/ESTs related to carbohydrate metabolism and cell growth and modification between the stages of tuber formation and maturation.
Conclusions
New insights on gene expression and metabolism of storage carbohydrate accumulation in tubers of H. tuberosus stems from the present study, namely:
i. The temporal expression of 1-SST and 1-FFT genes and the dynamics of inulin accumulation are synchronously regulated according to the growth stages.
ii. The presence of three divergent 1-SST genes reflects the allopolyploid origin of the hexaploid H. tuberosus.
iii. The different expression pattern throughout tuber development of 1-FFT between “VR” and “K8-HS142” clones calls for a different regulatory mechanism of inulin accumulation between genotypes differing in tuber morphology and physiology;.
iv. The negligible expression of genes for the starch biosynthesis explains the undetectable starch content in tubers.
v. The dynamics of tuber development is accompanied by the sequential overexpression of genes related to cell growth, proliferation, enlarging, and elongation at the initial phase of differentiation followed by that of negative regulators of these processes at maturation.
vi. The extent to which the expression of genes such as those related to cell growth and protein processing occurs at the initial phase of tuber differentiation is credited to mark the difference between pear- and slender-shaped clones. In turn, this difference might result from a different biosynthetic and/or exploitation rate of glucose between clones.
Overall, the comparison of transcriptomic and inulin profiles between tubers of different shapes throughout their developmental stages allowed us to depict that a small set of genes command relevant differences in timing and extent to which tubers develop and accumulate carbohydrates. These findings set the stage for a more in-depth analysis focused on regulatory genes controlling the different patterns of growth between clones.
Present findings provided a framework not only to understand the molecular mechanisms of tuber development and fructan biosynthesis in H. tuberosus but also to breed inulin-rich clones under low-input farming systems.
Data Availability Statement
The data reported in this study have been deposited in NCBI's Gene Expression Omnibus and are accessible through GEO Series accession number GSE132955 (https://www.ncbi.nlm.nih.gov/geo/query/acc.cgi?acc=GSE132955).
Author Contributions
MB designed the experiments and collected and analyzed the data from the experimental plots. MB and DV isolated and prepared RNA for microarray and qRT-PCR analyses. AF, PT, EZ, and MB under the supervision of MD performed microarray analyses. FP and FD performed qRT-PCR analyses. MB and FP wrote the manuscript with input from the other coauthors.
Funding
This work was financed by the Italian Ministry of Agriculture (MiPAAF) as part of the ENERBIOTOP Project aimed to study “The biomass produce from the Jerusalem Artichoke (Helianthus tuberosus L.) to convert in a sustainable manner into biofuels replacing analog ones from hydrocarbons.”
Conflict of Interest
The authors declare that the research was conducted in the absence of any commercial or financial relationships that could be construed as a potential conflict of interest.
Acknowledgments
This work is dedicated to the memory of our eminent colleague Prof. Ciro De Pace, who conceived this study, earned the grant which supported it, and supervised the doctoral research activity of MB. All the authors are grateful to Prof. Ciro De Pace for his quiet but substantial contribution to research and teaching activities in the field of plant genetics and breeding, to which he was massively devoted.
Thanks also to Dr. Simonetta Moretti, Italian Council of Agricultural Research-Unit for Wine Production in Central Italy (CREA-ENC), Velletri, Italy, who extracted and analyzed the tuber content in simple sugars, fructans, and starch and to Prof. Francesco Rossini, Department of Agriculture, Forest, Nature and Energy of the University of Tuscia, Viterbo, Italy, who ran the agronomic trials.
Supplementary Material
The Supplementary Material for this article can be found online at: https://www.frontiersin.org/articles/10.3389/fpls.2020.00101/full#supplementary-material
Footnotes
- ^ http://cgpdb.ucdavis.edu/database/DatabaseDescription.html
- ^ http://www.mged.org.miame
- ^ http://ddlab.sci.univr.it
References
Altenbach, D., Ritsema, T. (2007). Structure-function relations and evolution of fructosyltransferases. Res. Signpost 37 (661).
Arnold, S. M., Fessler, L. I., Fessler, J. H., Kaufman, R. J. (2000). Two homologues encoding human UDP-glucose:glycoprotein glucosyltransferase differ in mRNA expression and enzymatic activity. Biochemistry-US 39, 2149–2163. doi: 10.1021/bi9916473
Bick, M. D., Liebke, H., Cherry, J. H., Strehler, B. L. (1970). Changes in leucyl- and tyrosyl-tRNA of soybean cotyledons during plant growth. Biochim. Biophys. Acta (BBA) Nucleic Acids Protein Synthesis 204, 175–182. doi: 10.1016/0005-2787(70)90500-9
Bock, D. G., Kane, N. C., Ebert, D. P., Rieseberg, L. H. (2014). Genome skimming reveals the origin of the Jerusalem Artichoke tuber crop species: neither from Jerusalem nor an artichoke. New Phytol. 201, 1021–1030. doi: 10.1111/nph.12560
Bonnett, G. D., Sims, I. M., John, J. A. S., Simpson, R. J. (1994). Purification and characterization of fructans with β-2,1-and β-2,6-glycosidic linkages suitable for enzyme studies. New Phytol. 127, 261–269. doi: 10.1111/j.1469-8137.1994.tb04277.x
Boyce, J. M., Coates, D., Fricker, M. D., Evans, D. E. (1994). Genomic sequence of a calnexin homolog from Arabidopsis thaliana. Plant Physiol. 106, 1691. doi: 10.1104/pp.106.4.1691.
Brocklebank, K. J., Hendry, G. A. F. (1989). Characteristics of plant species which store different types of reserve carbohydrates. New Phytol. 112, 255–260. doi: 10.1111/j.1469-8137.1989.tb02381.x
Buckeridge, M. S. (2010). Seed cell wall storage polysaccharides: models to understand cell wall biosynthesis and degradation. Plant Physiol. 154, 1017–1023. doi: 10.1104/pp.110.158642
Carlier, A., Buffel, K. (1955). Polysaccharide changes in the cell walls of water absorbing potato tuber tissue in relation to auxin action. Acta Bot. Neerl. 4, 551–564. doi: 10.1111/j.1438-8677.1955.tb00354.x
Cassels, A. C., Walsh, M. (1995). Screening for Sclerotinia resistance in Helianthus tuberosus L. (Jerusalem artichoke) varieties, lines and somaclones, in the field and in vitro. Plant Pathol. 44, 428–437. doi: 10.1111/j.1365-3059.1995.tb01665.x
Chomczynski, P., Sacchi, N. (1987). Single-step method of RNA isolation by acid guanidinium-thiocyanate-phenol-chloroform exctraction. Anal. Biochem. 162, 156–159. doi: 10.1016/0003-2697(87)90021-2
Chourey, P. S., Taliercio, E. W., Carlson, S. J. (1998). Genetic evidence that the two isozymes of sucrose synthase present in developing maize endosperm are critical, one for cell wall integrity and the other for starch biosynthesis. Mol. Gen. Genet. 259, 88–96. doi: 10.1007/s004380050792
Chrispeels, M. J., Maurel, C. (1994). Aquaporins: the molecular basis of facilitated water movement through living plant cells? Plant Physiol. 105, 9–13. doi: 10.1104/pp.105.1.9
Cunniff, P. (1995). Official Methods of Analysis of AOAC International Vol. 2 (Washington, DC: Association of Official Analytical Chemists).
De Pace, C., Rossini, F., Del Puglia, S., Vittori, D. (2010). New clones of Helianthus tuberosus enlarge options for the sustainable integration of bioenergy crops in current farming systems of central Italy, in: Proceedings of the 18° Bionmass Congress, Lyon (France), May 3rd-7th 2010.
Denecke, J., Goldman, M. H., Demolder, J., Seurinck, J., Botterman, J. (1991). The tobacco luminal binding protein is encoded by a multigene family. Plant Cell 3, 1025–1035. doi: 10.1105/tpc.3.9.1025
Dickerson, A. G., Edelman, J. (1966). The metabolism of fructose polymers in plants: VI. Transfructosylation in living tissue 3 Helianthus tuberosus L. J. Exp. Bot. 17, 612. doi: 10.1093/jxb/17.3.612
Douce, R., Holtz, B., Benson, A. A. (1973). Isolation and properties of the envelope of spinach chloroplasts. J. Biol. Chem. 248, 7215–7222.
Edelman, J., Jefford, T. ,. J. (1968). The mechanism of fructosan metabolism in higher plants as exemplified in Helianthus tuberosus. New Phytol. 67, 517–531. doi: 10.1111/j.1469-8137.1968.tb05480.x
Edelman, J., Popov, K. (1962). Metabolism of 14CO2 by illuminated shoot of Helianthus tuberosus L., with special reference to fructose polymers. Gr. Acad. Bulg. Sci. 15, 627.
Edgar, R., Domrachev, M., Lash, A. E. (2002). Gene expression omnibus: NCBI gene expression and hybridization array data repository. Nucleic Acids Res. 30, 207–210. doi: 10.1093/nar/30.1.207
Fernie, A. R., Roessner, U., Tretheway, R. N., Willmitzer, L. (2000). The contribution of plastidial phosphoglucomutase to the control of starch synthesis within the potato tuber. Planta 3, 418–426. doi: 10.1007/s004250100521
Flamm, G., Glinsmann, W., Kritchevsky, D., Prosky, L., Roberfroid, M. (2001). Inulin and oligofructose as dietary fieber: a review of the evidence. Crit. Rev. Food. Sci. 41, 353–362. doi: 10.1080/20014091091841
Fleck, B., Harberd, N. P. (2002). Evidence that the Arabidopsis nuclear gibberellin signaling protein GAI is not destabilised by gibberellins. Plant J. 32, 935–947. doi: 10.1046/j.1365-313X.2002.01478.x
Funahashi, A., Tanimura, N., Morohashi, M., Kitano, H. (2003). CellDesigner: a process diagram editor for gene-regulatory and biochemical networks. Biosilico 1, 159–162. doi: 10.1016/S1478-5382(03)02370-9
Götz, S., García-Gómez, J. M., Terol, J., Williams, T. D., Nueda, M. J., Robles, M., et al. (2008). High-throughput functional annotation and data mining with the Blast2GO suite. Nucleic Acid Res. 36, 3420–3435. doi: 10.1093/nar/gkn176
Geigenberger, P. (2011). Regulation of starch biosynthesis in response to a fluctuating environment. Plant Physiol. 155, 1566–1577. doi: 10.1104/pp.110.170399
Gross, S. R., Kinzy, T. G. (2005). Translation elongation factor 1A is essential for regulation of the actin cytoskeleton and cell morphology. Nat. Struct. Mol. Biol. 12, 772–778. doi: 10.1038/nsmb979
Haake, V., Zrenner, R., Sonnewald, U., Stitt, M. (1998). A moderate decrease of plastid aldolase activity inhibits photosynthesis, alters the levels of sugars and starch, and inhibits growth of potato plants. Plant J. 14, 147–157. doi: 10.1046/j.1365-313X.1998.00089.x
Hendry, G. A. F. (1993). Evolutionary origins and natural functions of fructans – a climatological, biogeographic and mechanistic appraisal. New Phytol. 123, 3–14. doi: 10.1111/j.1469-8137.1993.tb04525.x
Hu, B., Huang, W., Liaoliao, D., Shiqiang, L., Yong, Z. (2019). Molecular cloning and functional analysis of a sugar transporter gene (CsTST2) from cucumber Cucumis sativus. Biotechnol. Biotechnol. Equip. 33, 118–127 doi: 10.1080/13102818.2018.1555011
Jiao, J., Wang, J., Zhou, M., Ren, X., Zhan, W., Sun, Z., et al. (2018). Characterization of fructan metabolism during jerusalem artichoke (Helianthus tuberosus L.) germination. Front. Plant Sci. 9, 1384. doi: 10.3389/fpls.2018.01384
Jung, W. Y., Lee, S. S., Kim, C. W., Kim, H. S., Min, S. R., Moon, J. S., et al. (2014). RNA-Seq analysis and de novo transcriptome assembly of jerusalem artichoke (Helianthus tuberosus Linne). PloS One 9 (11), e111982. doi: 10.1371/journal.pone.0111982
Kays, S. J., Nottingham, S. F. (2007). Biology and chemistry of Jerusalem artichoke (Helianthus tuberosus). eds Kays, S.J., Nottingham, S.F. (Boca Raton, FL: CRC Press).
Koops, A. J., Jonker, H. H. (1994). Purification and characterization of the enzymes of fructan biosynthesis in tubers of Helianthus tuberosus Colombia. I. Fructan:fructan 1–fructosyltransferase. J. Exp. Bot. 45, 1623–1631. doi: 10.1093/jxb/45.11.1623
Koops, A. J., Jonker, H. H. (1996). Purification and characterization of the enzymes of fructan biosynthesis in tubers of Helianthus tuberosus Colombia. II. Purification of Sucrose:sucrose 1-fructosyltransferase and reconstitution of fructan synthesis in vitro with purified Sucrose:sucrose 1-fucosyltransferase and Fructan:fructan 1–fructosyltransferase. Plant Physiol. 110, 1167–1175. doi: 10.1104/pp.110.4.1167
Lüscher, M., Erdin, C., Sprenger, N., Hochstrasser, U., Boller, T., Wiemken, A. (1996). Inulin synthesis by a combination of purified fructosyltransferases from tubers of Helianthus tuberosus. FEBS Lett. 385, 39–42. doi: 10.1016/0014-5793(96)00343-2
Lee, G. J., Vierling, E. (2000). A small heat shock protein cooperates with heat shock protein 70 systems to reactivate a heat-denatured protein. Plant Physiol. 122, 189–197. doi: 10.1104/pp.122.1.189
Lee, Y.-T., Ta, H. T., Duggleby, R. G. (2005). Cyclopropane-1,1-dicarboxylate is a slow-, tight-binding inhibitor of rice ketol-acid reductoisomerase. Plant Sci. 168, 1035–1040. doi: 10.1016/j.plantsci.2004.11.020
Li, G. D., Kemp, P. D., Hodgson, J. (1997). Biomass allocation, regrowth and root carbohydrate reserves of chicory (Cichorium intybus) in response to defoliation in glasshouse conditions. J. Agr. Sci. 129, 447–458. doi: 10.1017/S0021859697004875
Lin, C., Ahmad, M., Cashmore, A. R. (1996). Arabidopsis cryptochrome 1 is a soluble protein mediating blue light-dependent regulation of plant growth and development. Plant J. 10, 893–902. doi: 10.1046/j.1365-313X.1996.10050893.x
Ludevid, D., Höfte, H., Himelblau, E., Chrispeels, M. J. (1992). The expression pattern of the tonoplast intrinsic protein γ-TIP in Arabidopsis thaliana is correlated with cell enlargement. Plant Physiol. 100, 1633–1639. doi: 10.1104/pp.100.4.1633
Mandel, T., Fleming, A. J., Krähenbühl, R., Kuhlemeier, C. (1995). Definition of constitutive gene expression in plants: the translation initiation factor 4A gene as a model. Plant Mol. Biol. 29, 995–1004. doi: 10.1007/BF00014972
Martel, C. M., Warrilow, A. G. S., Jackson, C. J., Mullins, J. G. L., Togawa, R. C., Parker, J. E., et al. (2010). Expression, purification and use of the soluble domain of Lactobacillus paracasei b-fructosidase to optimise production of bioethanol from grass fructans. Biores. Technol. 101, 4395–4402. doi: 10.1016/j.biortech.2010.01.084
Mazarei, M., Lennon, K. A., Puthoff, D. P., Rodermel, S. R., Baum, T. J. (2003). Expression of an Arabidopsis phosphoglycerate mutase homologue is localized to apical meristems, regulated by hormones, and induced by sedentary plant-parasitic nematodes. Plant Mol. Biol. 53, 513–530. doi: 10.1023/B:PLAN.000
McMorrow, E. M., Bradbeer, J. W. (1990). Separation, purification, and comparative properties of chloroplast and cytoplasmic phosphoglycerate kinase from barley leaves. Plant Physiol. 93, 374–383. doi: 10.1104/pp.93.2.374
Mecella, G., Scandella, P., Neri, U., Di Blasi, N., Moretti, R., Troisi, A., et al. (1996). The productive and chimical evolution of the Jerusalem artichoke (Helianthus tuberosus L.) under various conditions of irrigation. Agric. Med. 126, 233–239.
Micheli, F. (2001). Pectin methylesterases: cell wall enzymes with important roles in plant physiology. Trends In Plant Sci. 6, 414–419. doi: 10.1016/S1360-1385(01)02045-3
Miller, G., Evans, H. J. (1957). The influence of salts on pyruvate kinase from tissues of higher plants. Plant Physiol. 32, 346–354. doi: 10.1104/pp.32.4.346
Moon, J., Parry, G., Estelle, M. (2004). The ubiquitin-proteasome pathway and plant development. Plant Cell 16, 3181–3195. doi: 10.1105/tpc.104.161220
Moore, R. C., Durso, N. A., Cyr, R. J. (1998). Elongation factor-1α stabilizes microtubules in a calcium/calmodulin-dependent manner. Cytoskeleton 41, 168–180. doi: 10.1002/(SICI)1097-0169(1998)41:2<168::AID-CM7>3.0.CO;2-A
Nagaraj, V. J., Altenbach, D., Galati, V., Lüscher, M., Meyer, A. D., Boller, T., et al. (2004). Distinct regulation of sucrose: sucrose-1-fructosyltransferase (1-SST) and sucrose: fructan-6-fructosyltransferase (6-SFT), the key enzymes of fructan synthesis in barley leaves: 1-SST as the pacemaker. New Phytol. 161, 735–748. doi: 10.1111/j.1469-8137.2003.00995.x
Negro, M. J., Ballesteros, I., Manzanares, P., Oliva, J. M., Sáez, F., Ballesteros, M. (2006). Inulin-containing biomass for ethanol production: carbohydrate extraction and ethanol fermentation. Appl. Biochem. Biotechnol. 129, 922–932. doi: 10.1385/ABAB:132:1:922
Norambuena, L., Marchant, L., Berninsone, P., Hirschberg, C. B., Silva, H., Orellana, A. (2002). Transport of UDP-galactose in plants identification and functional characterization of AtUTr1, an Arabidopsis thaliana UDP-galactose/udp-glucose transporter. J. Biol. Chem. 277, 32923–32929. doi: 10.1074/jbc.M204081200
Nunes, A. C. S., Vianna, G. R., Cuneo, F., Amaya-Farfán, J., de Capdeville, G., Rech, E. L. (2006). RNAi-mediated silencing of the myo-inositol-1-phosphate synthase gene (GmMIPS1) in transgenic soybean inhibited seed development and reduced phytate content. Planta 224, 125–132. doi: 10.1007/s00425-005-0201-0
Pérez-Pérez, J. M., Ponce, M. R., Micol, J. L. (2002). The UCU1 Arabidopsis gene encodes a SHAGGY/GSK3-like kinase required for cell expansion along the proximodistal axis. Dev. Biol. 242, 162–173. doi: 10.1006/dbio.2001.0543
Palmer, C. E., Smith, O. E. (1969). Cytokinins and tuber initiation in the potato Solanum tuberosum L. Nature 221, 279–280. doi: 10.1038/221279a0
Paolini, R., De Pace, C. (1997). Yield response, resource complementarity and competitive ability of Jerusalem artichoke (Helianthus tuberosus L.) and potato (Solanum tuberosum L.) in mixture. Agric. Med. 127, 5–16.
Parry, G., Marchant, A., May, S., Swarup, R., Swarup, K., James, N., et al. (2001). Quick on the uptake: characterization of a family of plant auxin influx carriers. Plant Growth Regul. 20, 217–225. doi: 10.1007/s003440010
Pas'ko, N. M. (1973). Basic morphological features for distinguishing varieties of Jerusalem artichoke. Trudy po Prikladnoy Bot. Gentike i Selektsii 50, 91–101.
Passeri, V., Martens, S., Carvalho, E., Bianchet, C., Damiani, F., Paolocci, F. (2017). The R2R3MYB VvMYBPA1 from grape reprograms the phenylpropanoid pathway in tobacco leaves. Planta 246, 185–199. doi: 10.1007/s00425-017-2667-y
Pollock, C. J., Cairns, A. J. (1991). Fructan metabolism in grasses and cereals. Annu. Rev. Plant Physiol. Plant Mol. Biol. 42, 77–101. doi: 10.1146/annurev.pp.42.060191.000453
Poschet, G., Hannich, B., Raab, S., Jungkunz, I., Klemens, P. A. W., Krueger, S., et al. (2011). A novel Arabidopsis vacuolar glucose exporter is involved in cellular sugar homeostasis and affects the composition of seed storage compounds. Plant Physiol. 157, 1664–1676. doi: 10.1104/pp.111.186825
Probst, A. V., Fagard, M., Proux, F., Mourrain, P., Boutet, S., Earley, K., et al. (2004). Arabidopsis histone deacetylase HDA6 is required for maintenance of transcriptional gene silencing and determines nuclear organization of rDNA repeats. Plant Cell 16, 1021–1024. doi: 10.1105/tpc.018754
Prosky, L., Hoebregs, H. (1999). Methods to determine food inulin and oligofructose. J. Nutrit. 129, 1418S–1423s. doi: 10.1093/jn/129.7.1418S
Pustovoit, V. S., Ilatonsky, V. P., Slyusar, E. L. (1976). Results and prospects of sunflower breeding for group immunity by interspecific hybridization, in: Proceedings of the 7th International Sunflower Conference (Krasnodar, USSR: International Sunflower Association). 600–610.
Rashotte, A. M., Carson, S. D. B., To, J. P. C., Kieber, J. J. (2003). Expression profiling of cytokinin action in Arabidopsis. Plant Physiol. 132, 1998–2011. doi: 10.1104/pp.103.021436
Roumeliotis, E., Kloosterman, B., Oortwijn, M., Kohlen, W., Bouwmeester, H. J., Visser, R. G. F., et al. (2012). The effects of auxin and strigolactones on tuber initiation and stolon architecture in potato. J. Exp. Bot. 63, 4539–4547. doi: 10.1093/jxb/ers132
Schaafsma, G., Slavin, J. L. (2015). Significance of inulin fructans in the human diet. Compr. Rev. Food. Sci. Food Saf. 14, 37–47. doi: 10.1111/1541-4337.12119
Schroeder, A., Mueller, O., Stocker, S., Salowsky, R., Leiber, M., Gassmann, M., et al. (2006). The RIN: an RNA integrity number for assigning integrity values to RNA measurements. BMC Mol. Biol. 7, 3. doi: 10.1186/1471-2199-7-3
Schruff, M. C., Spielman, M., Tiwari, S., Adams, S., Fenby, N., Scott, R. J. (2006). The AUXIN RESPONSE FACTOR 2 gene of Arabidopsis links auxin signalling, cell division, and the size of seeds and other organs. Development 133, 251–261. doi: 10.1242/dev.02194
Siatecka, M., Rozek, M., Barciszewski, J., Mirande, M. (1998). Modular evolution of the Glx-tRNA synthetase family. Rooting of the evolutionary tree between the bacteria and archaea/eukarya branches. Eur. J. Biochem. 256, 80–87. doi: 10.1046/j.1432-1327.1998.2560080.x
Simões, I., Faro, C. (2004). Structure and function of plant aspartic proteinases. FEBS J. 271, 2067–2075. doi: 10.1111/j.1432-1033.2004.04136.x
Smalle, J., Viestra, R. D. (2004). The ubiquitin 26s proteasome proteolytic pathway. Annu. Rev. Plant Biol. 55, 555–590. doi: 10.146/annurev.arplant.55.031903.141801
Smith, K. G. (2004). LIMMA: linear models and empirical Bayes methods for assessing differential expression in microarray experiments. Stat. Appl. Genet. Mol. Biol. 3, 1. doi: 10.2202/1544-6115.1027
Song, X. J., Huang, W., Shi, M., Zhu, M. Z., Lin, H. X. (2007). A QTL for rice grain width and weight encodes a previously unknown RING-type E3 ubiquitin ligase. Nat. Genet. 39, 623–630. doi: 10.1038/ng2014
Stauffer, M. E., Young, J. K., Helms Gregory, L. J., Evans, N. S. (2001). Shikimate-3-phosphate binds to the isolated n-terminal domain of 5-enolpyruvylshikimate-3-phosphate synthase. Biochemistry-US 40, 3951–3957. doi: 10.1021/bi002912j
Streich, F. C., Lima, C. D. (2014). Structural and functional insights to ubiquitin-like protein conjugation. Annu. Rev. Biophys. 43, 357–379. doi: 10.1146/annurev-biophys-051013-022958
Sturm, A. (1999). Invertases. Primary structures, functions, and roles in plant development and sucrose partitioning. Plant Physiol. 121, 1–7. doi: 10.1104/pp.121.1.1
Suarez Rodriguez, M. C., Petersen, M., Mundy, J. (2010). Mitogen-activated protein kinase signaling in plants. Annu. Rev. Plant Biol. 61, 621–649. doi: 10.1146/annurev-arplant-042809-112252
Suzuki, M., Chatterton, N. J. (1993). Science and technology of fructans (NW Boca Raton, Florida (USA): CRC Press).
Tanaka, H., Masuta, C., Uehara, K., Kataoka, J., Koiwai, A., Noma, M. (1997). Morphological changes and hypomethylation of DNA in transgenic tobacco expressing antisense RNA of the S-adenosyl-L-homocysteine hydrolase gene. Plant Mol. Biol. 35, 981–986. doi: 10.1023/A:100589671
Theodorou, M. E., Cornel, F. A., Duff, S. M., Plaxton, W. C. (1992). Phosphate starvation-inducible synthesis of the alpha-subunit of the pyrophosphate-dependent phosphofructokinase in black mustard suspension cells. J. Biol. Chem. 267, 21901–21905.
Thompson, J. E., Hopkins, M. T., Taylor, C., Wang, T.-W. (2004). Regulation of senescence by eukaryotic translation initiation factor 5A: implications for plant growth and development. Trends Plant Sci. 9, 174–179. doi: 10.1016/j.tplants.2004.02.008
Uwer, U., Willmitzer, L., Altmann, T. (1998). Inactivation of a Glycyl-tRNA synthetase leads to an arrest in plant embryo development. Plant Cell 10, 1277–1294. doi: 10.1105/tpc.10.8.1277
Van der Meer, I. M., Koops, A. J., Hakkert, J. C., van Tunen, A. J. (1998). Cloning of the fructan biosynthesis pathway of Jerusalem artichoke. Plant J. 15, 489–500. doi: 10.1046/j.1365-313X.1998.00230.x
Van der Straeten, D., Rodrigues-Pousada, R. A., Goodman, H. M., Van Montagu, M. (1991). Plant enolase: gene structure, expression, and evolution. Plant Cell 3, 719–735. doi: 10.1105/tpc.3.7.719
Van Laere, A., Van den Ende, W. (2002). Inulin metabolism in dicots: chicory as a model system. Plant Cell Environ. 25, 803–813. doi: 10.1046/j.1365-3040.2002.00865.x
Vijn, I., Smeekens, S. (1999). Fructan: more than a reserve carbohydrate? Plant Physiol. 120, 351–359. doi: 10.1104/pp.120.2.351
Vijn, I., van Dijken, A., Sprenger, N., van Dun, K., Weisbeek, P., Wiemken, A., et al. (1997). Fructan of the inulin neoseries is synthesized in transgenic chicory plants (Cichorium intybus L.) harbouring onion (Allium cepa L.) fructan:fructan 6Gfructosyltransferase. Plant J. 11, 387–398. doi: 10.1046/j.1365-313X.1997.11030387.x
Wall, D. A., Kiehn, F. A., Friesen, G. H. (1987). Tolerance of Columbia Jerusalem artichoke to selective herbicides. Can. J. Plant Sci. 67, 835–837. doi: 10.4141/cjps87-118
Wang, L., Xu, Y., Zhang, C., Ma, Q., Joo, S.-H., Kim, S.-K., et al. (2008). OsLIC, a novel CCCH-type zinc finger protein with transcription activation, mediates rice architecture via brassinosteroids signaling. PloS One 10, e3521. doi: 10.1371/journal.pone.0003521
Wen, R., Wang, S., Xiang, D., Venglat, P., Shi, X., Zang, Y., et al. (2014). UBC13, an E2 enzyme for Lys63-linked ubiquitination, functions in root development by affecting auxin signaling and Aux/IAA protein stability. Plant J. 80, 424–436. doi: 10.1111/tpj.12644
Xu, H., Liang, M., Xu, L., Li, H., Zhang, X., Kang, J., et al. (2015). Cloning and functional characterization of two abiotic stress-responsive Jerusalem artichoke (Helianthus tuberosus) fructan 1-exohydrolases (1-FEHs). Plant Mol. Biol. 87, 81–98. doi: 10.1007/s11103-014-0262-1
Yan Guo, Y., Sheng, Q., Li, J., Ye, F., Samuels, D. C., Shyr, Y. (2013). Large scale comparison of gene expression levels by Microarrays and RNAseq using TCGA data. PloS One 8, e71462. doi: 10.1371/journal.pone.0071462
Yang, X. H., Xu, Z. H., Xue, H. W. (2005). Arabidopsis membrane steroid binding protein 1 is involved in inhibition of cell elongation. Plant Cell 17, 116–131. doi: 10.1105/tpc.104.028381
Zhang, A., Han, D., Wang, Y., Mu, H., Zhang, T., Yan, X., et al. (2018). Transcriptomic and proteomic feature of salt stress regulated network in Jerusalem artichoke (Helianthus tuberosus L.) root based on de novo assembly sequencing analysis. Planta 247, 715–732. doi: 10.1007/s00425-017-2818-1
Zhao, G. M., Liu, Z. P., Xia, T. X., Chen, M. D. (2005). Effects of seawater irrigation on soil safety and crop yield in coastal semi-arid area. Ying Yong Sheng Tai Xue Bao 25, 2446–2449.
Zhao, S., Fung-Leung., W.-P., Bittner, A., Ngo, K., Liu, X. (2014). Comparison of RNA-Seq and microarray in transcriptome profiling of activated T cells. PLoSONE 9, e78644. doi: 10.1371/journal.pone.0078644
Zhong, Q., Gao, W., Du, F., Wan, X. (2005). Mule/ARF-BP1, a BH3-Only E3 ubiquitin ligase, catalyzes the polyubiquitination of Mcl-1 and regulates apoptosis. Cell 121, 1085–1095. doi: 10.1016/j.cell.2005.06.009
Keywords: Helianthus tuberosus, tuber phenology, inulin, fructosyltransferases, expressed sequence tags, microarray, qRT-PCR
Citation: Bizzarri M, Delledonne M, Ferrarini A, Tononi P, Zago E, Vittori D, Damiani F and Paolocci F (2020) Whole-Transcriptome Analysis Unveils the Synchronized Activities of Genes for Fructans in Developing Tubers of the Jerusalem Artichoke. Front. Plant Sci. 11:101. doi: 10.3389/fpls.2020.00101
Received: 21 June 2019; Accepted: 23 January 2020;
Published: 21 February 2020.
Edited by:
Kazuki Saito, RIKEN Center for Sustainable Resource Science (CSRS), JapanCopyright © 2020 Bizzarri, Delledonne, Ferrarini, Tononi, Zago, Vittori, Damiani and Paolocci. This is an open-access article distributed under the terms of the Creative Commons Attribution License (CC BY). The use, distribution or reproduction in other forums is permitted, provided the original author(s) and the copyright owner(s) are credited and that the original publication in this journal is cited, in accordance with accepted academic practice. No use, distribution or reproduction is permitted which does not comply with these terms.
*Correspondence: Francesco Paolocci, ZnJhbmNlc2NvLnBhb2xvY2NpQGliYnIuY25yLml0