 Changyang Cai†
 Zhiliang Zhang
 Qiang Zhu
- Basic Forestry and Proteomics Center (BFPC), Fujian Provincial Key Laboratory of Haixia Applied Plant Systems Biology, Haixia Institute of Science and Technology, College of Forestry, Fujian Agriculture and Forestry University, Fujian, China
With the development of sequencing technology, the availability of genome data is rapidly increasing, while functional annotation of genes largely lags behind. In Arabidopsis, the functions of nearly half of the proteins are unknown and this remains one of the main challenges in current biological research. In an attempt to identify novel and rapid abiotic stress responsive genes, a number of salt-up (SUP) regulated genes were isolated by analyzing the public transcriptomic data, and one of them, SUPA, was characterized in this study. The expression of SUPA transcripts was rapidly up-regulated by various abiotic stress factors (<15 min), and SUPA protein is mainly localized in the peroxisome. Overexpression of SUPA in Arabidopsis leads to the elevated accumulation of reactive oxygen species (ROS), strong morphological changes and alternations in abiotic stress tolerance. The transcriptome analysis showed changes in expression of genes involved in stress response and plant development. Interestingly, ectopic overexpression of SUPA in poplar leads to a dwarf phenotype with severely curved leaves and changes in the plant tolerance of abiotic stresses. Our study reinforces the potential roles of SUPA in normal plant growth and the abiotic stress response.
Introduction
As a sessile organism, plants have developed complicated survival mechanisms at physiological, molecular and cellular levels to adapt to the harmful conditions such as drought, cold and salinity. Upon stress, plants rapidly respond within several minutes which provokes global changes in many metabolic molecular and biochemical pathways, such as ROS, calcium waves, electric signals and hydraulic waves (Kollist et al., 2018). Through large transcriptome analyses, it was revealed that in general two groups of genes respond to abiotic stress stimuli, namely regulatory proteins and functional proteins (Shinozaki et al., 2003; Shinozaki and Yamaguchi-Shinozaki, 2006). Regulatory proteins such as various transcription factors, protein kinases, protein phosphatases or proteinases were normally activated rapidly (Lee and Luan, 2012; Khan et al., 2016; Zhu, 2016). Several transcription factor families were involved in the rapid response of plants to different stresses, such as ethylene- responsive element binding factor/APETALA2 (ERF/AP2), WRKY, heat shock factors (HSFs), and MYB (Zhu, 2016). DREB (dehydration responsive element binding) family genes which belong to the AP2/ERF family and govern the expression of many stress-inducible target genes via a specific cis-acting element, the dehydration responsive element/C-repeat (DRE/CRT; A/GCCGAC), are well characterized players in plant responses to salt, drought or freezing conditions (Chew and Halliday, 2011). Upon stress, CBF1/DREB1B and CBF3/DREB1A transcripts start to accumulate 15 min after cold treatment and rapidly increase over the next 90 min (Gilmour et al., 1998; Novillo et al., 2004). WRKY25 and WRKY33 are responsive to salt treatment, and were considered as positive regulators in response to salt stress (Jiang and Deyholos, 2009). These genes normally act as the master regulators that positively or negatively regulate the expression of a wide range of genes involved in the pathways for plant adaption and survival, and the overexpression of the rapid response factors in plants that significantly change plant tolerance to salt (Jiang and Deyholos, 2009; Lata and Prasad, 2011).
The Reactive Oxygen Species (ROS) accumulation was always enhanced when plants suffer environmental constraints (Hossain et al., 2015; Del Rio and Lopez-Huertas, 2016). ROS which is mainly produced in chloroplasts, mitochondria, and peroxisomes is associated with metabolic pathways such as photorespiration and fatty acid β-oxidation (Del Rio and Lopez-Huertas, 2016). Over-accumulation of ROS can damage cellular components, while at low concentration it acts as the signal transduction messenger to regulate developmental processes and stress responses (Sandalio and Romero-Puertas, 2015; Del Rio and Lopez-Huertas, 2016; Kohli et al., 2017). It was proposed that the potential toxicity and the energetic costs associated with their detoxification determine the positive or negative roles of ROS during the abiotic stress response (Choudhury et al., 2017), and upon ROS accumulation exceeding a certain level ROS toxicity could not be prevented by its scavenging system causing, oxidative damage to plant macromolecules and cell structures, leading to the inhibition of plant growth and development (Hossain et al., 2015). In some cases, ROS contributes to the plant stress tolerance by activating the acclimation pathways, and exogenous application of ROS reinforces plant abiotic stress resistance (Hossain et al., 2015).
Peroxisomes which exist in nearly all the eukaryotic cells are one of the major sources of cellular ROS production (Del Rio and Lopez-Huertas, 2016). They are highly dynamic metabolically active organelles that participate in different cellular processes including development, morphogenesis and response to stresses (Hu et al., 2012). It has been reported that peroxisomes could rapidly sense environmental changes and modify their metabolism and dynamics accordingly through the regulation of ROS (Sandalio and Romero-Puertas, 2015; Del Rio and Lopez-Huertas, 2016). In addition, it has been demonstrated that peroxisomes contribute to the ROS-mediated senescence (Giordano and Terlecky, 2012; Jajic et al., 2015). Peroxisomes could also affect transcription and/or translation by altering the function of key regulatory proteins via ROS-derived redox modifications (Foyer and Noctor, 2013).
To date, much progress has been made in deciphering the molecular mechanisms that control abiotic stress signaling pathways (Zhu, 2016; Kohli et al., 2017; Pareek et al., 2017; Kollist et al., 2018). However, the full details of the network are far from clear with large gaps still existing in our understanding of the regulatory networks that control plant response to the adverse environment, especially with regards to the nature and function of plants rapid response to stress (Kollist et al., 2018). It is proposed that by studying the rapid local and systemic responses to stress, novel pathways that may potentially be used in improving the tolerance of plants to stresses can be identified (Zhu, 2016; Kollist et al., 2018). Characterization of the previously functionally unknown genes that were involved in this process will be important for enhancing our knowledge of plants gene regulatory networks that operate in response to stress (Niehaus et al., 2015). In Arabidopsis in 2015, nearly half of all Arabidopsis genes were completely functionally unknown or poorly characterized (Niehaus et al., 2015). These genes could potentially involve critical signaling pathways that have not yet been identified. Numerous attempts to uncover the biological role of proteins of unknown functions, enumerating their functional significance in growth, development, survival, and response to adverse environmental conditions have been reported in a diverse range of organisms (Horan et al., 2008; Luhua et al., 2013; Dhanyalakshmi et al., 2016).
To identify novel proteins that rapidly respond to salt tolerance in Arabidopsis, we analyzed the stress related transcriptome profiling and searched for genes that rapidly respond to exogenous abiotic stress. Salt UP-regulated gene A (SUPA) was a candidate for further characterization in this study. We showed that SUPA rapidly responds to abiotic stress at the transcriptional level, while localized in the peroxisome. Overexpression of SUPA gene causes strong morphological alternations and plant tolerance to abiotic stresses in Arabidopsis and poplar. Our results expand our understanding of the rapid responses to abiotic stress in plants.
Materials and Methods
Plant Materials and Growth Conditions
Arabidopsis (Arabidopsis thaliana cv Columbia) seeds were sterilized and placed on AM + medium [solid half strength Murashige and Skoog (MS) medium (Murashige and Skoog, 1962] with 0.5 g/l MES, 10 g/l Sucrose and 0.8% agar), and stratified for 2–4 days at 4°C before being placed in the growth chamber (22°C, 16 h light/8 h darkness 100 μmol m–2 s–1, and a relative humidity of 70%).
To generate SUPA-overexpression lines, SUPA genomic DNA fragment (At5G65300) was generated by PCR using the primers (F: 5′-GGGGACAAGTT TGTACAAAAAAGC AGGCTTAATGGAATGCAGAAAACAC-3′) and (R: 5′- GGG GACCACTTTGTACAAGAAAGCTGGGTATTAATAAACTCG TTGCCG-3′), then sub-cloned into the PDONR207-vector for sequence confirmation. The genomic DNA fragment of SUPA was inserted into the pK7WG2 vector via gateway technology (Karimi et al., 2002). To construct the SUPA promoter: GUS line, the 5′-flanking DNA of the SUPA coding region was amplified with SUPA-specific primers (F: 5′-GGGGACAAGTTTGT AC AAAAAAGCAGGCTTACATCTTTTATCAACACAATCAC TTT-3′; and R: 5′- GGGGACCACTTTGTACAAGAAAGCTGG GTATTTTCTATCTTCTTCGTTCTCTTTT -3′). The 1,526 bp PCR fragment was cloned into the pBGWFS7 vector for sequence confirmation. The coding sequence (CDS) of SUPA was also infused with GFP at the N- or C- terminal by using pK7WGF2 and pK7FWG2 vectors via gateway technology, respectively (Karimi et al., 2002). The CDS of SUPA was inserted into the pEarlyGate301 vector via gateway technology to generate the transgenic lines expressing SUPA-HA infusion construct (Karimi et al., 2002). All the constructions were transformed into Arabidopsis Col-0 by Agrobacterium mediated transformation as described in Clough and Bent, 2010. After selection and molecular verification, we obtained a total of 7 independent SUPA-overexpressing lines, 8 SUPA promoter: GUS lines, 5 GFP-SUPA expressing lines, 6 SUPA-GFP expressing lines and 8 SUPA-HA expressing lines.
The supa mutant (SALK_069313) was obtained from the Arabidopsis stock center (TAIR). The identification of a homozygous mutant was performed as described previously (Brown et al., 2005), and the primers used in this analysis are listed in Supplementary Table 12.
For ectopic expression of SUPA in poplar, Shanxin yang (P. davidiana × P. bolleana) transformation was performed as previously described (Wang et al., 2011). The 35S: SUPA vector generated above was used for transformation, as well as obtained 10 SUPA-overexpression poplar lines.
GUS Straining
Histochemical staining for GUS activity in transgenic plants and various issues was performed as the protocol described in Jefferson et al. (1987).
Plant Stress Treatment
The Arabidopsis SUPA expression analysis in response to ABA, NaCl, cold or osmotic stresses, treatments were performed as described in Zhu et al. (2010). Briefly, 7 days old seedlings were immersed in 1 μM ABA, 150 mM NaCl, 300 mM mannitol or transferred to 4°C, and the materials were harvested for RNA extraction at the time indicated. All the experiments were repeated independently at least three times.
For the Arabidopsis seed germination assay in stress conditions, approximately 100 seeds each for the wild type and SUPA overexpression lines were planted on AM + medium supplemented with various concentrations of ABA or NaCl, respectively, and were kept at 4°C for 2 days before being moved to the growth chamber. Germination (emergence of radicles) was scored daily for 10 days. The vertical germination and growth assays were performed in a similar manner, except that the plates were placed vertically on a rack. Plant growth was monitored and photographed after 7 days. All the experiments were repeated at least three times.
For preparation the samples that were used to measure the concentration of H2O2 and the level of total anti-oxidative capacity (T-AOC), 7 days old Col-0 and SUPA overexpression lines seedlings were treated with different concentration of NaCl (100 mM NaCl or 150 mM NaCl) and ABA (0.5 μM ABA and 1 μM ABA) for 3 h, and the seedlings incubated with water were used as control. After treatments, all samples were immediately frozen in liquid nitrogen and stored at −80°C for further experiments.
For Arabidopsis growth assays in different light conditions, seeds grown on the AM+ plates were placed in white light, blue light, far red light or dark for growth. Plant growth was monitored and photographed after 7 days. All experiments were repeated three times independently, and the average means were calculated.
For the poplar NaCl tolerance assay, the regenerated plantlets were grown on 0.1 mg/L naphthylacetic acid (NAA) containing MS medium with various concentrations of NaCl (50, 100, and 150 mM, respectively), and pictures were taken 21 days after treatment. For adult poplar plant NaCl treatments, 1-month-old poplars grown in soil were watered with 150 mM NaCl every 2 days. For drought treatments, water was withdrawn from 1-month-old seedlings grown in the soil. Plant growth was monitored and pictures were taken at day 32 for drought and salt stress treatments. All experiments were repeated three times independently, and the average data was calculated.
For preparation the samples that used for measuring the concentration of H2O2 and the level of T-AOC in Populus, wild type and SUPA overexpression lines were grown on MS medium with 0.1 mg/L naphthylacetic acid (NAA) for 3-weeks. All experiments were repeated three times independently, and the average data was calculated.
RNA-Seq Analysis
Total RNA from wild type Col-0 and two SUPA-overexpression lines were purified using the Plant RNA Kit (OMEGA; R6827-01) according to the manufacturer’s instructions. 10 μg total RNA was used for RNA-Seq analysis using the BGISEQ-500 platform (BGI, China) with paired-end sequencing, and 3 independent biological repeats were performed. In total, 9 strand-specific RNA-Seq libraries were sequenced in this study using the dUTP method (Parkhomchuk et al., 2009). The paired-end reads were aligned to the Arabidopsis thaliana genome using tophat-2.0.11 with an anchor length of more than 8nt for spliced alignments (Kim, 2013). Only reads that could be uniquely aligned were retained for subsequent analysis. The expression levels of each gene were normalized as fragments per kilobase of transcript per million mapped reads (FPKM) (Trapnell et al., 2010). A cutoff with expression fold change > 2 and p < 0.05 was used for identifying the differentially expressed genes. The data were deposited in NCBI Sequence Read Archive (SRA)1 with accession number PRJNA634204. To verify the RNA-Seq results, qPCR was used as previously described (Zhu et al., 2012). The primers used for qPCR are listed in the Supplementary Table 12.
RNA Extraction, Reverse Transcriptase-PCR and Quantitative Real-Time PCR Analyses
Total RNA was extracted using the Plant RNA Kit (OMEGA), as instructed by the manufacture. RNA concentration and purity were determined using NANODROP ONE (Thermo Fisher Scientific, United States). For quantitative real-time PCR, materials were harvested and the cDNA was synthesized with the Prime ScriptTM RT reagent Kit with gDNA Eraser (TaKaRa, Japan) and qPCR was performed with TB GreenTM Premix Ex TaqTM II (TaKaRa). The gene specific primers are listed in Supplementary Table 12. The relative mRNA was determined by normalizing the PCR threshold cycle number with Actin, which optimized in the previous study (Czechowski et al., 2005). All RT-qPCR was conducted in triplicate biological replications and subjected to statistical analysis. The delta-delta Ct method was used for analyzing the relative gene expression as described previously (Yuan et al., 2006). At least three independent biological repeats were performed for each data set. Data represent mean values and standard errors (SE).
Subcellular Localization of SUPA Protein
Arabidopsis expressing SUPA-HA were crossed with the peroxisome marker PX-YK Arabidopsis line (Nelson et al., 2007), and the F1 progeny were used for immunostaining using the protocol from Sauer et al. (2006) with minor modifications. Briefly, 4-day old seedlings were fixed in solution containing 4% paraformaldehyde (Sigma, cat. no. P6148) in 1 × PBS supplemented with 0.1% Triton X-100 (Carl Roth, cat. no. 3051.2) in vacuum desiccator for 60 min at room temperature, and then washed two times for 30 min with 1 × PBS at room temperature. After chlorophyll was removed, the samples were incubated with 2% Driselase (Sigma, cat. no. D9515), and 3% IGEPAL CA-630 (Sigma, cat. no. I3021) subsequently, and washed with 1 × PBS for 30-60 min after each incubation. The materials were immersed in 3% BSA for 60 min at room temperature. The primary antibody solution (usually 100–150 μL) was then added to the 3% BSA solution and incubated at 37°C for at least 240 min or overnight at 4°C. The samples were washed two times for 30 min with 1 × PBS at room temperature. The secondary antibody (1:2,000) was added and incubated with the sample for 3 h at 37°C. The samples were harvested after being washed for 30 min with 1 × PBS at room temperature, and then observed using a Zeiss, LSM880 microscope. The antibodies used in this study include rabbit anti-HA (1:1,000; Gene Tex; GTX73046), mouse anti-GFP (1:1,000; TRANS; HT801-01), mouse anti-RFP (1:1,000; Eno Gene; E12-011), Goat anti-Mouse IgG (H + L) Cross-Adsorbed Secondary Antibody, Alexa Fluor 546 (Thermo Fisher Scientific; A11008) and Goat anti-Rabbit IgG (H + L) Cross-Adsorbed Secondary Antibody, Alexa Fluor 488 (Thermo Fisher Scientific; A11003). Pictures were taken using a Zeiss LSM 880 confocal scanning microscopes with Airyscan (Huff, 2016).
ROS Staining and Quantitative Measurements
DAB and NBT staining were used to detect different ROS based on the protocol of Zhu et al. (2013). Briefly, Arabidopsis or poplar leaves at the same stage and positions were submerged into 1 mg/mL DAB or 2 mg/mL NBT solution for 4 h in the dark, and then observed under the microscope after bleaching. Hydrogen peroxide was determined using the Micro Hydrogen Peroxide (H2O2) Assay Kit (Solarbio, China) as described by the manufacturer. T-AOC was determined using the Micro Total Antioxidant Capacity (T-AOC) Assay Kit (Solarbio, China) as described by the manufacturer.
Results
SUPA Is Rapidly Induced by ABA and Abiotic Stress Conditions
Previously, a systematic study on the transcriptional response to high salinity of differential cell layers and developmental stages of Arabidopsis was performed (Dinneny et al., 2008). To identify the novel stress-responsive genes, firstly we queried their transcriptomic dataset, and focused on the genes that previously uncharacterized but rapidly respond to salt stress (< 30 min). Secondly, the selected genes were further analyzed in the public transcriptomic database Genevestigator (Hruz et al., 2008) to check their expression changes in response to other stresses and stress related phytohormones, such as abscisic acid (ABA), salicylic acid (SA),indole-3-acetic acid (IAA), P. syringae and drought. At5g65300 (SUPA), which is one of the candidates that rapidly and strongly respond to those stresses, is further functionally characterized in this study.
The expression of SUPA gene is rapidly up-regulated by several biotic and abiotic factors, such as abscisic acid (ABA), P. syringae, indole-3-acetic acid (IAA), salicylic acid (SA), salt and drought based on the data from Genevestigator (Figure 1A), indicating potential roles in plant stress responses. Based on the public large-scale transcriptomic data (Kreps et al., 2002; Kilian et al., 2007; Dinneny et al., 2008), the SUPA gene rapidly responds to salt treatment within 30 min, and this expression pattern was similar to the already characterized rapid stress-response transcription factors DREB1A, DREB2A, and WRKY33 (Figure 1B). To confirm the results above, we treated the samples under various stress over time, then performed qPCR analysis. Our results showed that SUPA transcripts could be up-regulated within 15 min of salt treatment, reached a maximum at 30 min, and then gradually reduced (Figure 1C). After ABA treatment SUPA transcripts increased to a maximum level within 15 min and then decreased (Figure 1D). The accumulation of SUPA transcripts increased 15 min after cold treatment, and remained at a high level for 60 min (Figure 1E). Under osmotic treatment, SUPA transcripts rapidly accumulated to a maximal level within 15 min, and a peak in accumulation was observed at 45 min, with levels subsequently reducing (Figure 1F). These results showed clearly that SUPA gene could be rapidly and transiently activated at the transcriptional level by ABA, salt, osmotic and cold stress treatments, indicating it may be involved in plant response to abiotic stresses.
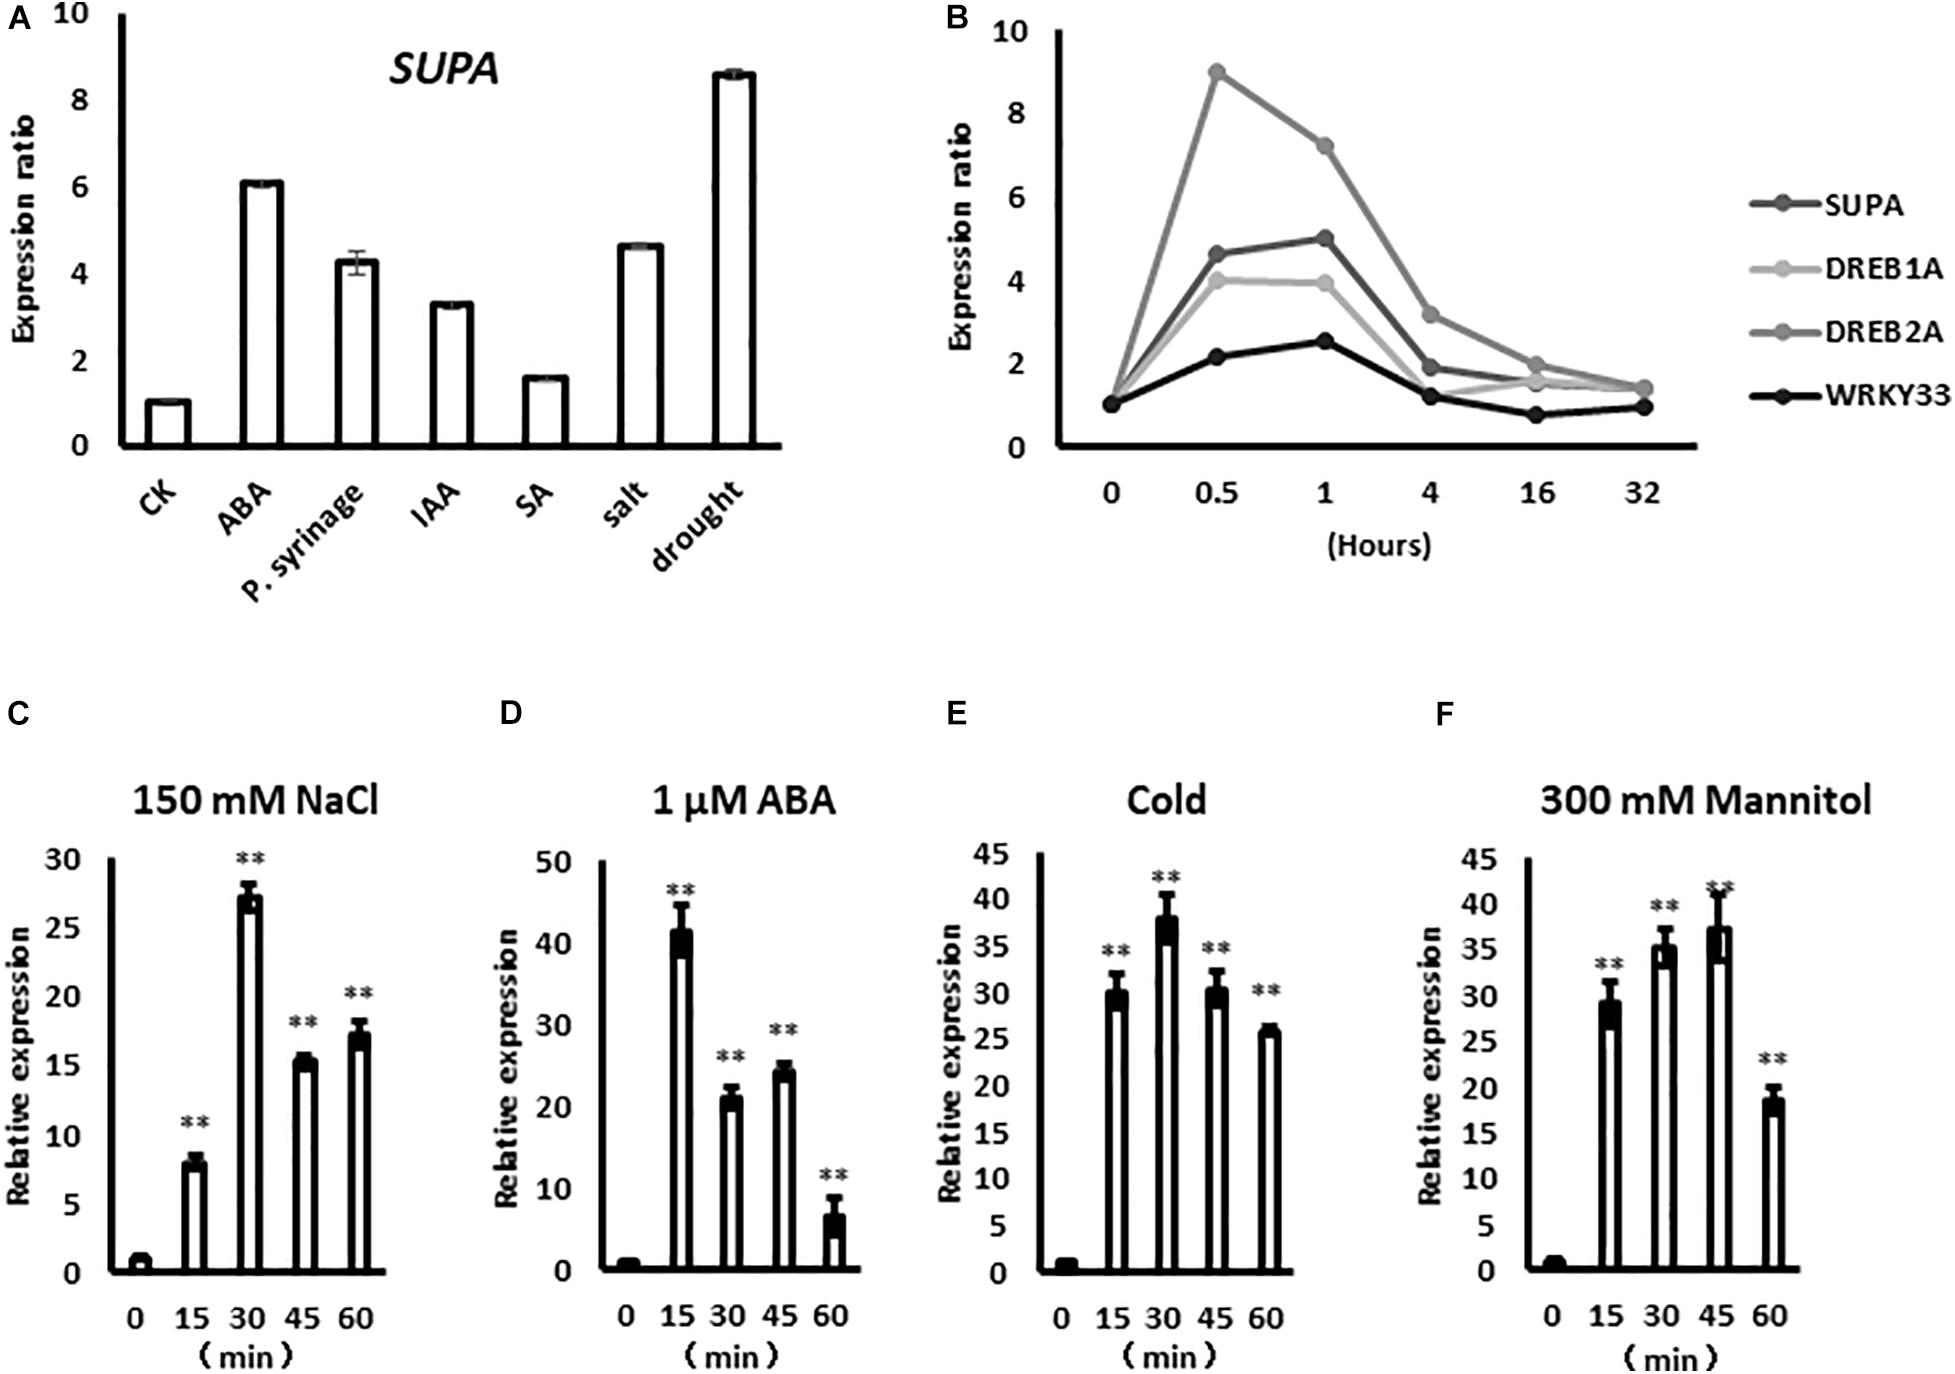
Figure 1. SUPA responds rapidly to abiotic stresses. (A) SUPA transcript is induced by various stress factors based on the data from Genevestigator. For ABA treatment, 2-week old Arabidopsis Col-0 were treated with 50 μM ABA for 90 min; for P. syringae treatment, leaves of 4-week old Col-0 plants with 10e5 cfu*cm–2 bacteria for 24 h; for IAA treatment, 7-day old Col-0 seedlings with 1 μM for 1 h; for SA treatment, leaves from 3-week old Col-0 grown on soil were treated with 1 mM SA for 6 h; for salt treatment, 16-day old Col-0 seedlings were treated with 150 mM NaCl for 3 h; for drought treatment, 2-week old Col-0 seedlings were exposed to a stream of air in a clean bench for 4 h; after treatments, RNA were extracted and used for gene expression analysis. The control was set as 1, and the expression levels of each treatments were calculated compared with the gene expressions of their untreated samples, respectively. (B) The expression level of SUPA in response to NaCl at different time points based on the public stress-related transcriptomic data. The expression data of some well-characterized salt responsive factors, such as DREB1A, DREB2A, and WRKY33 were also shown as positive controls. In this report, seedlings were planted on AM + medium for 5 days, then were transferred to AM + medium with 140 mM NaCl for 0, 30 min, 1, 4, 16, and 32 h, respectively. (C–F) qRT-PCR analysis of SUPA expression pattern in response to ABA and various abiotic stresses. Seven-days-old seedlings grown on AM + medium were treated with 150 mM NaCl (C), 1 μM ABA (D), 4°C (E), and 300 mM Mannitol (F). Samples were collected at the indicated time after the initiation of the treatment. Total RNA was extracted from whole seedlings, and real-time PCR analyses were performed with SUPA gene specific primers. The relative expression was calculated by using Actin as an internal reference. The unstressed expression level was assigned a value of 1. Data represents the average of three independent experiments ± SE. **P < 0.01.
SUPA Proteins and Its Homologs in Arabidopsis
SUPA protein is composed of 150 amino acids, and at present it was classified as a functionally unknown protein (Data from TAIR). Three of the phylogenetically closest genes were identified through a BLAST search of the full amino acid sequence of SUPA against the complete Arabidopsis genome database, but they showed low similarities (identity < 30%) (Supplementary Figure 1A). Further alignment analysis showed that the three proteins contain several conserved domains, including a “CkKH∗kHrqspGvCslCL∗ekLSrl” domain at the N-terminal (domain I), serine-rich domain in the middle (domain II), and lysine-rich domain at C-terminal (domain III) (Supplementary Figure 1C). We performed a further search using the above conserved domains as the query, and no additional proteins containing such domains in Arabidopsis genome were identified. More importantly, all three SUPA homologs could also be induced by salt, ABA, cold and osmotic stress within 15 min, suggesting their potential roles in plant stress-response (Supplementary Figure 2). We also searched the SUPA homologous in other plant species such as poplar. By using the full amino acid sequence of Arabidopsis SUPA against the complete poplar genome database2 with BLAST tools, we found that the gene with the highest identity as Arabidopsis SUPA protein shared more than 50% similarity (Supplementary Figure 1B), moreover, POPTR_0005s07300.1 is Highly homologous with SUPA in Arabidopsis. and we do find the typical conserved domain as in Arabidopsis (Supplementary Figure 1D). Further experimental work is required to check these genes have similar functions.
SUPA Gene Is Mainly Expressed in the Above-Ground Tissues
To determine the possible function of the SUPA gene, we first examined its expression patterns in various tissues and different developmental stages. We generated SUPA-promoter: GUS transgenic plants and SUPA was analyzed using GUS staining. The positive signal was detected at a very early stage (1-day after germination) (Figure 2A), and became strong mainly in the hypocotyl and cotyledon of the 2-, 3-, and 5-days-old seedlings, but not in the root (Figures 2B–D). Interestingly, we did not detect the GUS activity in the root in both light (Figure 2D) and dark conditions (Figure 2E). A GUS signal was also detected in the rosette leaves and cauline leaves of 1-month old plant (Figures 2F,G). In the flowers, expression was detected in the sepal and ovules (Figure 2H). Further qRT-PCR confirmed that the high expression of SUPA exist in stem, leaf, flower and siliques while quite low expression levels in roots (Figure 2I), indicating SUPA may mainly play its function in the above-root tissues.
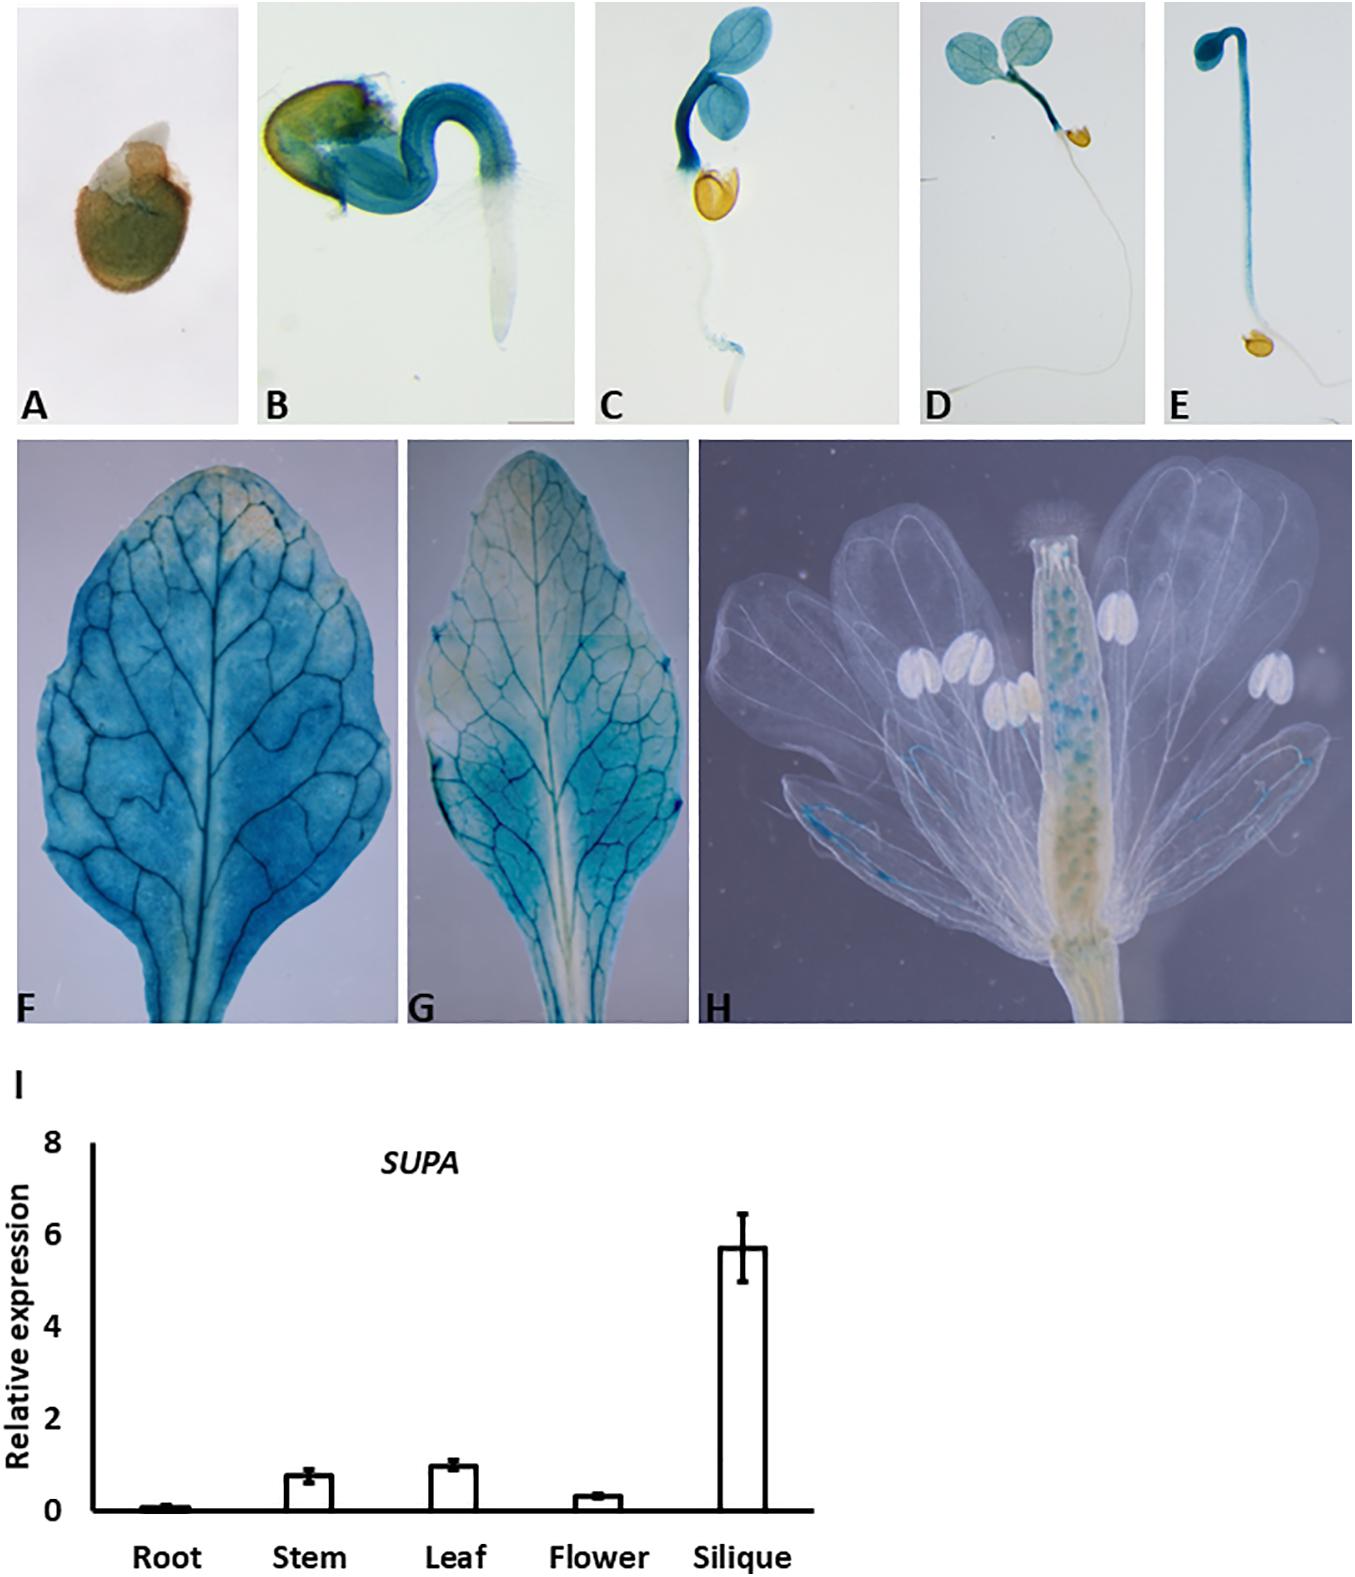
Figure 2. Expression patterns of SUPA gene. (A–H) SUPA promoter activity analyses by GUS staining. Transgenic plants expressing GUS driven by 1.5 kb SUPA promoter were constructed, and the GUS activity was analyzed and measured in 1-day old seedlings (A), 2-day seedlings (B), 3-day old seedlings (C), 5-day old seedlings grown in light (D) and in darkness (E), cauline leaves of 1-month old plant (F), rosette leaves of 1-month old plant (G), flowers (H). (I) qRT-PCR analyses of SUPA transcripts in different organs of Arabidopsis plants. Total RNA was isolated from various tissues (root, stem, rosette leaf, flower, and silique) of 5-week-old Arabidopsis (ecotype Col-0). qRT-PCR was performed with SUPA-specific primers. Expression of Actin was analyzed as the control. SUPA expression level in the stem was assigned a value of 1. The data shown represents mean values and standard errors obtained from three independent experiments.
Overexpression of SUPA Leads to Various Morphological Alterations in Arabidopsis Under Normal Conditions
To investigate the function of SUPA, we generated transgenic Arabidopsis overexpressing SUPA, and observed their growth under normal growth conditions. At the seedling stage, the overexpression lines showed much longer hypocotyl, more curved cotyledons and longer cotyledon petioles compared with wild type under white light (Figure 3A and Supplementary Figures 3A–C). Those phenotypic changes also exist under the far-red light (Supplementary Figures 3A,D,E) and more obvious under the blue light (Supplementary Figures 3A,F,G), while these phenotypic changes disappear in the dark (Supplementary Figures 3A,H). These results showed SUPA plays a role in plant growth and development in a light-dependent manner at the seedling stage.
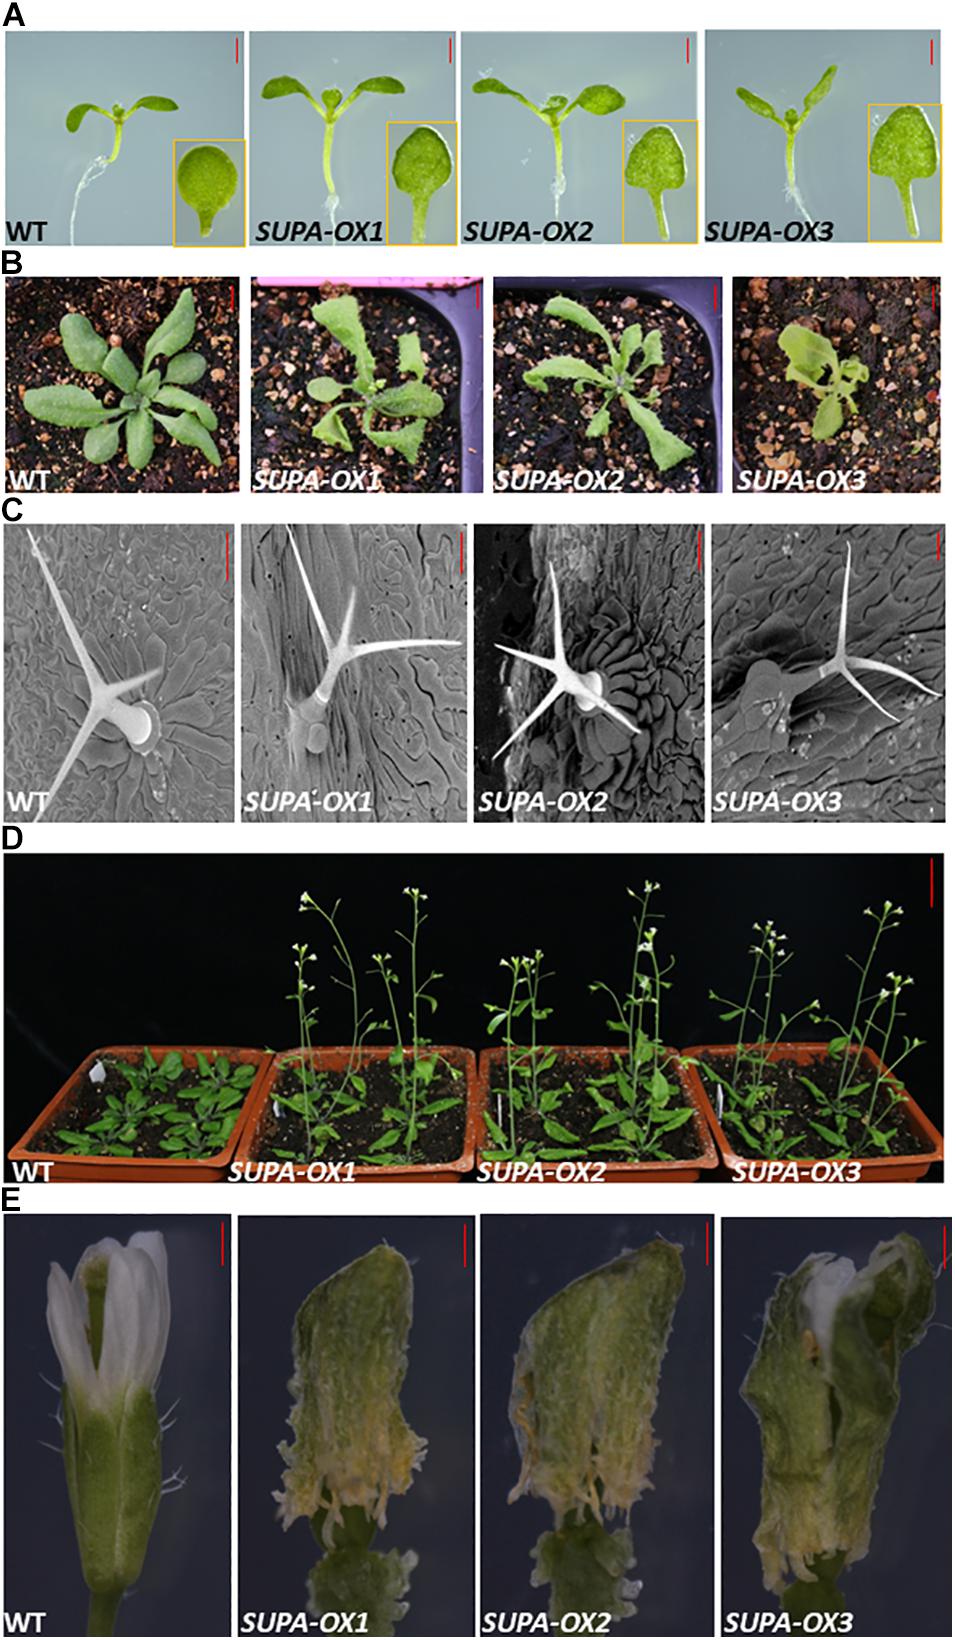
Figure 3. Overexpression of SUPA leads to various morphological alterations in Arabidopsis. (A) SUPA-OX lines have longer hypocotyls and petioles compared to wild type under white light. Photographs were taken from 7 days old seedlings, and the representative pictures are shown. Bar = 1 mm. (B) Phenotypes of the soil-grown plants. Photographs were taken from 3-week old seedlings grown in the soil, and the representative pictures are shown. Bar = 5 mm. (C) Trichrome phenotypes. Photographs were taken with a SEM, and the representative pictures are shown. Bar = 100 μm. (D) Effects of SUPA overexpression on Arabidopsis flowering time. 35S: SUPA transgenic lines flower earlier than wild type. Pictures were taken 5-weeks after sowing. Bar = 2.5 cm. (E) Effects of SUPA overexpression on flower opening. Photographs from the flowers of 4-week old plants are shown. Bar = 25 μm.
Transgenic Arabidopsis overexpressing SUPA grown in the soil at the 3-week-old stage, had curled leaves comparison to wild type (Figure 3B). Additional data from the scanning electron microscope (SEM) showed that the basal cells below the trichrome protruded from the epidermal cells and have distinctive shapes compared to the regular epidermal cells (Figure 3C).
We also observed that overexpression of SUPA leads to the early flowering phenotype in Arabidopsis. All 15 transgenic lines generated produced visible inflorescences approximately 7–14 days earlier than wild type (Figure 3D). The flower structures of the transgenic lines do not change compared to wild type. However, the sepal surface of the SUPA-OX lines was not as smooth as wild type (Supplementary Figure 4A). At the age of 15 days, the sepal of transgenic lines was not able to open as in wild type and therefore the petal, the carpel, the pistil and the anther remained enclosed inside (Figure 3E and Supplementary Figure 4B). Results from SEM at stage 15 showed that wild type flowers were open at this stage whereas in the overexpression lines the upper parts of the sepal remained closed. (Supplementary Figure 4C), and the basal parts of their sepals were ruptured (Supplementary Figure 4D), which lead to the deformed and twisted petals (Supplementary Figure 4B). The papilla cells of the stigma are much shorter in SUPA-OX lines compared to wild type (Supplementary Figure 4E). More importantly, most anthers of the SUPA-OX lines did not contact the stigma and this is thought to be due to physical prevention from the enclosed sepal which resulted in most pollen being spread within the carpel instead of the stigma as normally occurs. This lead poor fertilization in transgenic lines. Interestingly, fertilization was successfully restored after manual self-pollination, indicating that the flower has a normal physiological function while anatomical constraints due to the sepal being enclosed inhibits fertilization (Supplementary Figures 4F,G). Our results clearly showed that overexpression of SUPA leads to broad phenotypic changes in Arabidopsis under normal growth conditions, indicating that the expression of SUPA needs to be tightly controlled to maintain normal growth and development.
The T-DNA insertion line for SUPA gene was obtained from the Arabidopsis Biological Resource Center (ABRC), and genotyping results revealed the T-DNA fragment was inserted in the exon of the gene, leading to the termination of SUPA protein translation (Supplementary Figures 5A,B). We performed phenotypic analysis, and we did not find any changes between wild type and supa mutant both under normal and stress conditions (Supplementary Figure 5C). These results suggested that SUPA together with other 3 proteins may have functional redundancy, possibly explaining why the supa single mutant does not generate any phenotypes. In the future, further detailed investigations including generation of double and multiple mutants will help to revile the function of this gene cluster.
SUPA Protein Is Localized in the Peroxisome
To determine SUPA subcellular localization in native Arabidopsis cells, we firstly fused the CDS of SUPA with GFP at the N- or C- terminal, to generate stable transgenic lines. We found that the SUPA-GFP transgenic lines have more twisted root structures, and do not showed the complete same phenotype compared with the SUPA-overexpressing lines (Supplementary Figures 6A,B), suggesting that SUPA-GFP fusion protein may not cause exactly the same effects as SUPA protein alone. For GFP-SUPA, we observed that this line gave no fluorescence under confocal microscope. Therefore, both SUPA-GFP and GFP-SUPA lines could not be used for determining its subcellular localization.
We speculate that the SUPA protein structure maybe disrupted when fused to GFP given that SUPA is a small protein (16.4 kDa) compared to GFP (26.9 kDa). To solve this issue of size we fused the SUPA gene with an HA tag and generated transgenic lines. We observed that the phenotypes of SUPA-HA transgenic lines were comparable to the SUPA transgenic line (Supplementary Figures 6A,B), indicating SUPA-HA fusion protein is expressed and functioned in a manner comparable to the SUPA protein alone.
To reveal the subcellular localization of SUPA protein, we crossed SUPA-HA overexpression lines with several well-characterized cell organelle marker lines, including 35s:GFP-8a for Lysosome, Mt-RK for mitochondria, and PX-YK for peroxisomes (Nelson et al., 2007). The F1 progeny were used for immunolocalization studies using HA- and GFP/RFP- specific antibodies (Sauer et al., 2006). Our results showed that the HA signal exclusively co-localized with the signal from the peroxisome marker PX-YK, both in the cells of root and hypocotyl (Figure 4), but not co-localized with the signal of Lysosome marker 35s:GFP-8a and mitochondria marker Mt-RK (Supplementary Figure 7). These result indicated that SUPA protein mainly localized to the peroxisomes of plant cells.
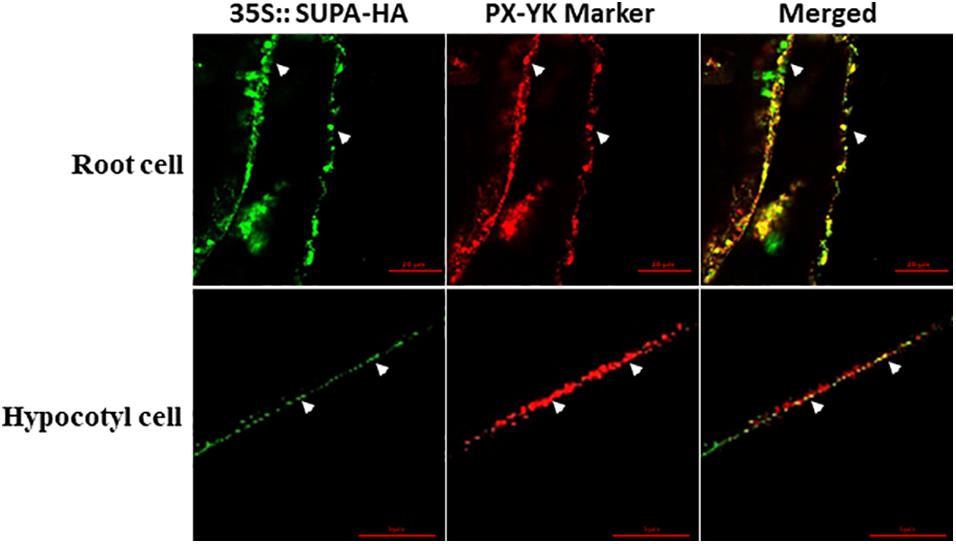
Figure 4. SUPA protein is localized in peroxisomes. Arabidopsis expressing the SUPA-HA construct was crossed with the peroxisome marker PX-YK expressing Arabidopsis line. The root cell (up panel) and the hypocotyl cell (low panel) of the 7-day old seedlings from the F1 progeny were used for immunostaining with anti-HA (green) and anti-GFP (red) antibody. Pictures were taken using a Zeiss LSM 880 confocal scanning microscopes with Airyscan. In the up panel, Bar = 20 μm, and in the low panel, Bar = 5 μm.
Overexpression of SUPA Leads to the Accumulation of ROS
Since SUPA protein is localized in the peroxisomes that are important sites for ROS production, we predicted that ROS levels may be altered in the transgenic lines. To test this hypothesis, we stained the seedlings of SUPA-overexpression lines and wild type with diaminobenzidine (DAB, for H2O2) and nitroblue tetrazolium (NBT, for superoxide) which indicate the presence of ROS. The results showed that the transgenic lines had much stronger signals with both stains compared to wild type (Figures 5A,B). The following quantitative measurements of the H2O2 levels corroborated these observations (Figure 5C). These results showed that SUPA overexpression leads to the ROS over-accumulation in the transgenic Arabidopsis under normal growth conditions.
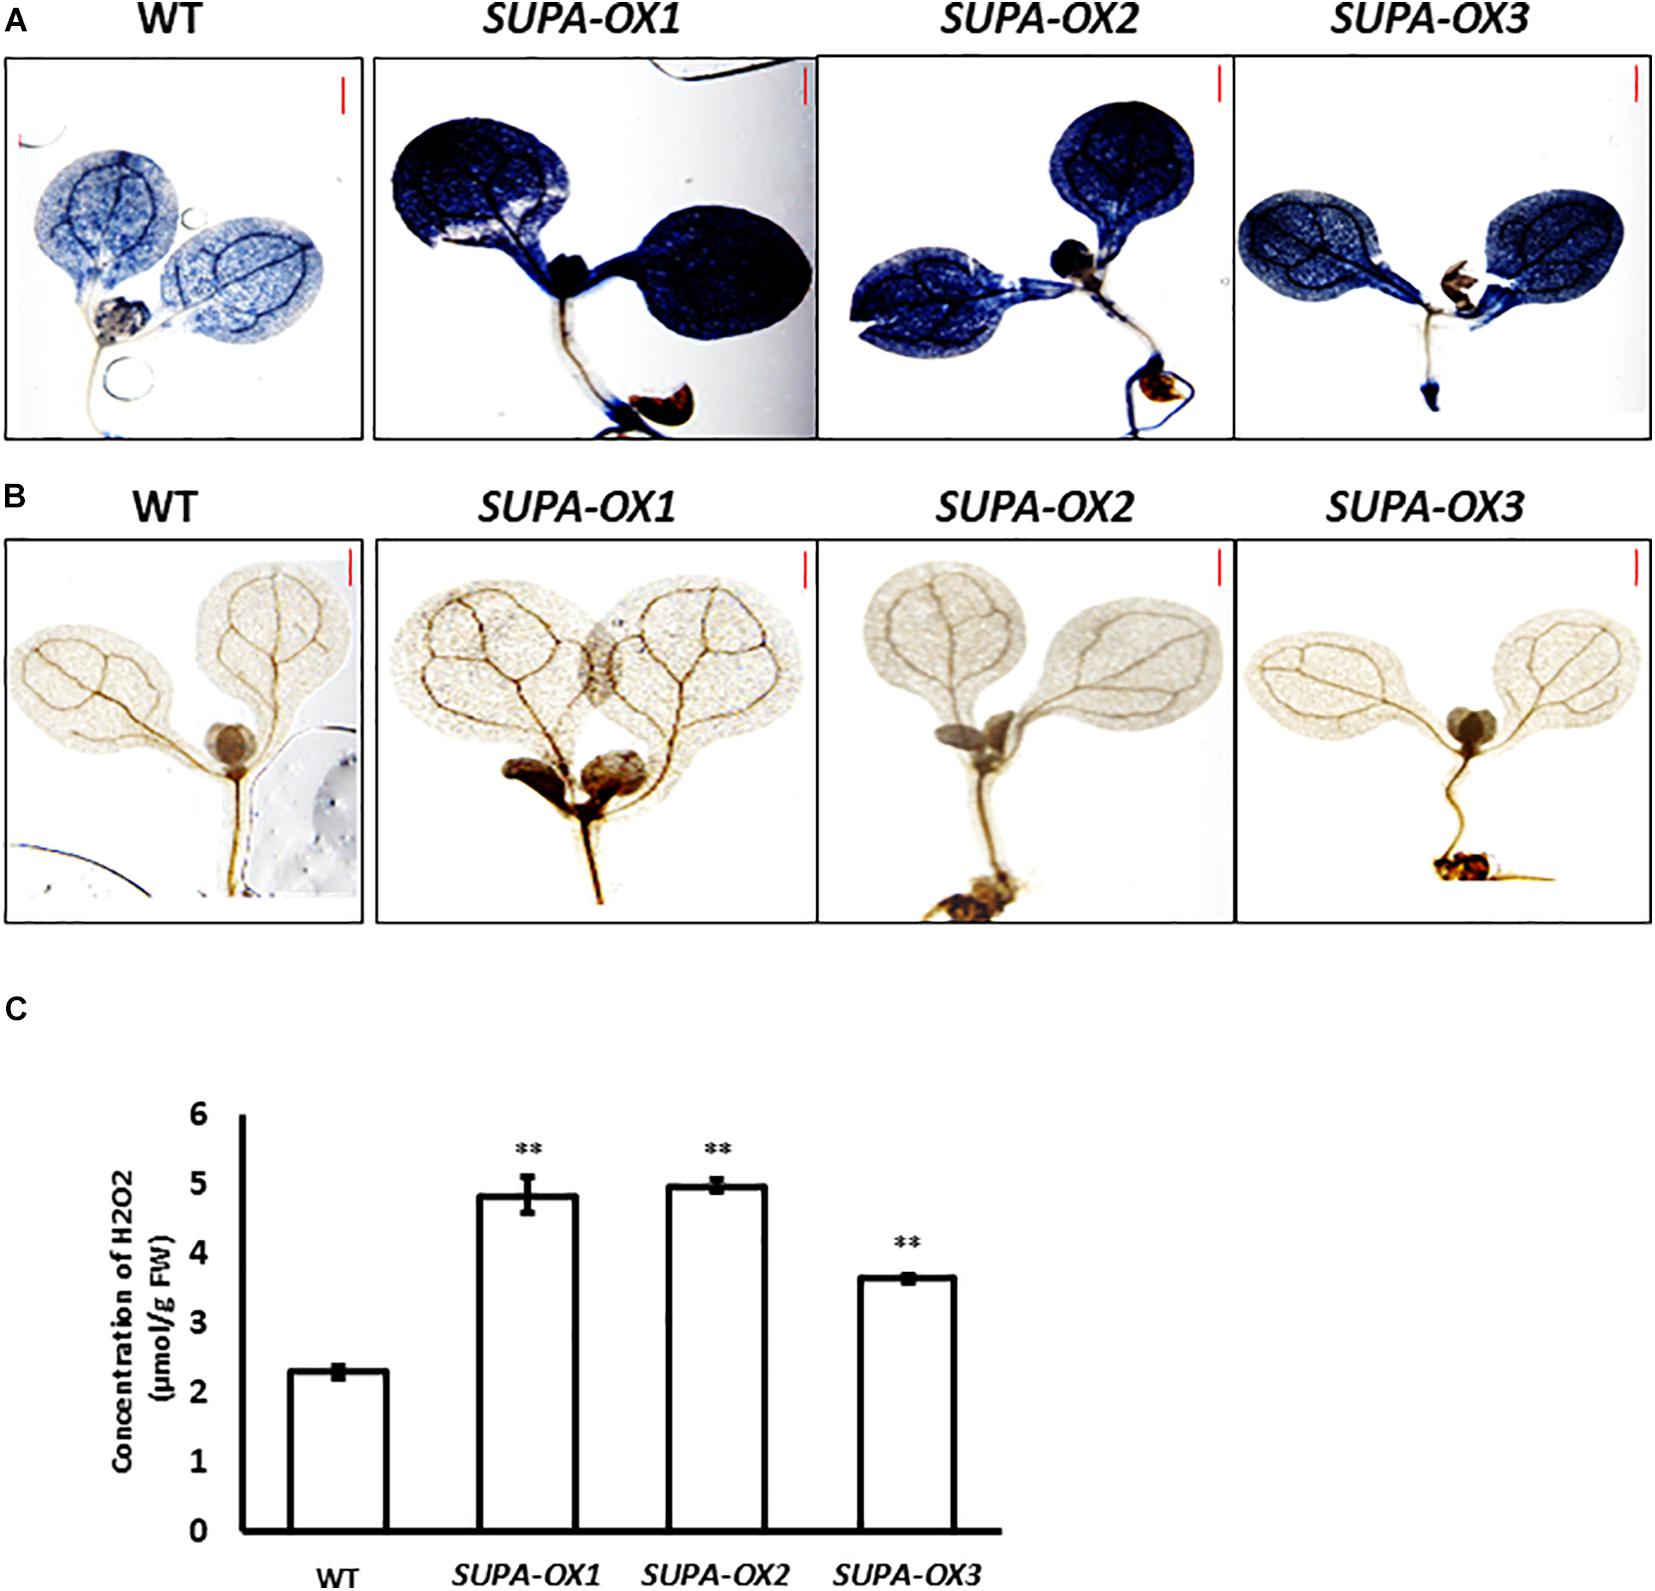
Figure 5. Overexpression of SUPA leads to enhanced ROS levels. (A) NBT staining for superoxide in WT and SUPA-OX lines. 7-day old seedlings were used for staining. Bar = 0.5 mm. (B) DAB staining for hydrogen peroxide in WT and SUPA-OX lines. 7-day old seedlings were used for staining. Bar = 0.5 mm. (C) Quantitative measurements of ROS content in WT and SUPA-OX lines. Data represent the mean ± SE of three independent measurements. **p < 0.01.
Heat Shock Proteins Had Enhanced Expression at the Transcription Level
ROS has emerged as major regulatory molecules in plants (Waszczak et al., 2018), and can effectively induce the heat shock proteins (HSP), which belong to one of the major transcription factor families that respond to various environmental stresses (Zhu, 2016; Jacob et al., 2017). Our results showed that overexpression of SUPA leads to the accumulation of ROS (Figure 5). We further checked the expressions of genes coding for the heat shock proteins. Real-time qPCR results showed that all the HSPs we checked, including Hsp70, Hsp90.1, Hsp17.4, Hsp17.6A, Hsp23.6-M, Hsp20-like protein (At1g53540 and At1g07400), have enhanced transcript levels in the SUPA overexpression lines compared with wild type (Figure 6), which is probably due to the increased ROS levels.
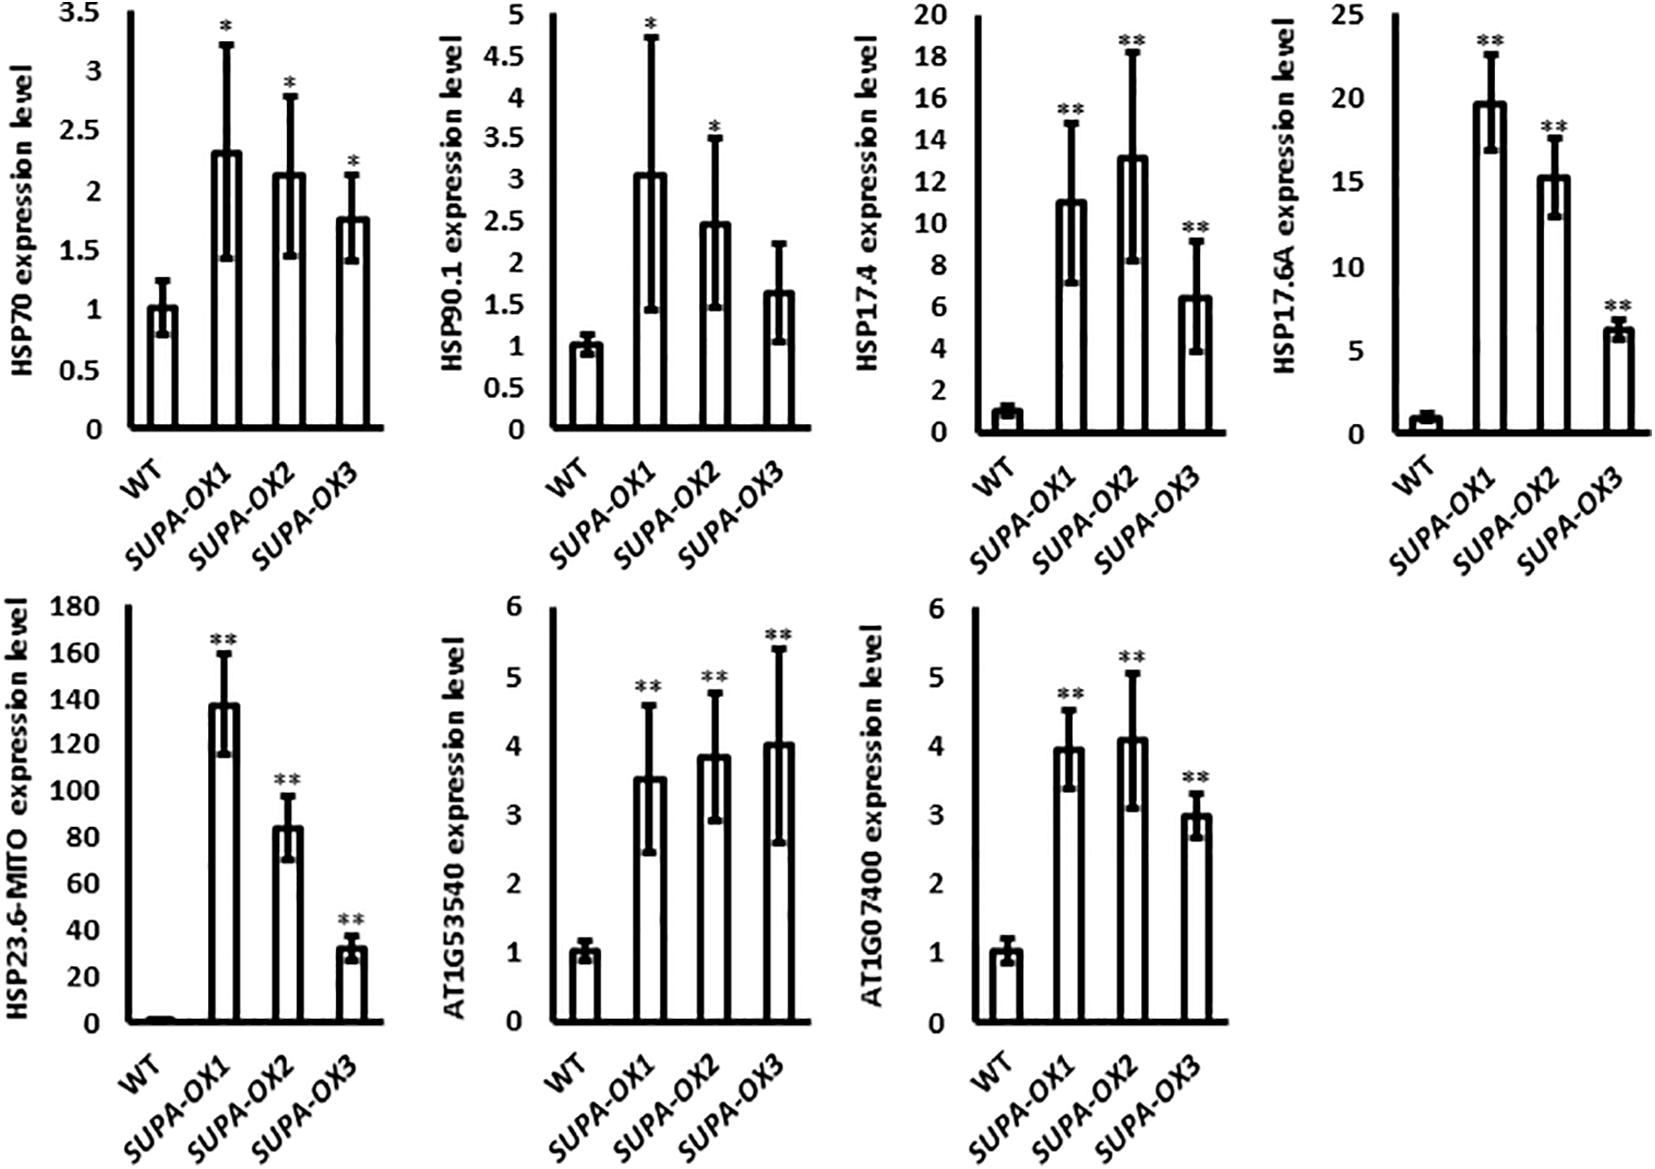
Figure 6. Expression of heat shock protein family genes in wild type and SUPA-overexpression lines. 7-day old seedlings grown in normal conditions were used in this experiment. HSP-gene specific primers were used and the Actin gene specific primers were used as the control. The gene expression levels in WT were set as 1. Data represents the average of three independent experiments ± SE. *p < 0.05. **P < 0.01.
Overexpression of the SUPA Gene Changed the Plant Response to Abiotic Stresses
ROS play key roles in plant acclimation to abiotic stresses (Choudhury et al., 2017). It was reported that moderate accumulation of ROS within cells or the exogenous application of H2O2 significantly enhanced plant tolerance to abiotic stresses (Ozaki et al., 2009; Ishibashi et al., 2011; Sun et al., 2016). Since SUPA overexpression leads to the over-accumulation of ROS and constitutively induces many heat shock protein family genes, the hypothesis was that transgenic lines may change their response to abiotic stresses. To test this hypothesis, we investigated the seed germination and early seedling growth under various stress conditions in transgenic lines vs. wild type. Under normal growth condition, wild type and transgenic plants had similar germination ratios and displayed healthy growth (Figures 7A,B,E). Regarding ABA treatment, the germination ratios between wild type and transgenic lines are comparable (Figures 7F,G), while the post-growth of the seedlings were different. As shown in Figure 7, the SUPA-OX lines were more insensitive to the ABA (Figures 7A,C). Under salt treatment, the germination ratio of SUPA-OX lines was higher and post-germination growth was higher than wild type, especially on medium containing 150 mM NaCl (Figures 7A,D,H,I). These results indicated that overexpression of SUPA conferred plant tolerance to ABA and salt at the early seedling stage of growth.
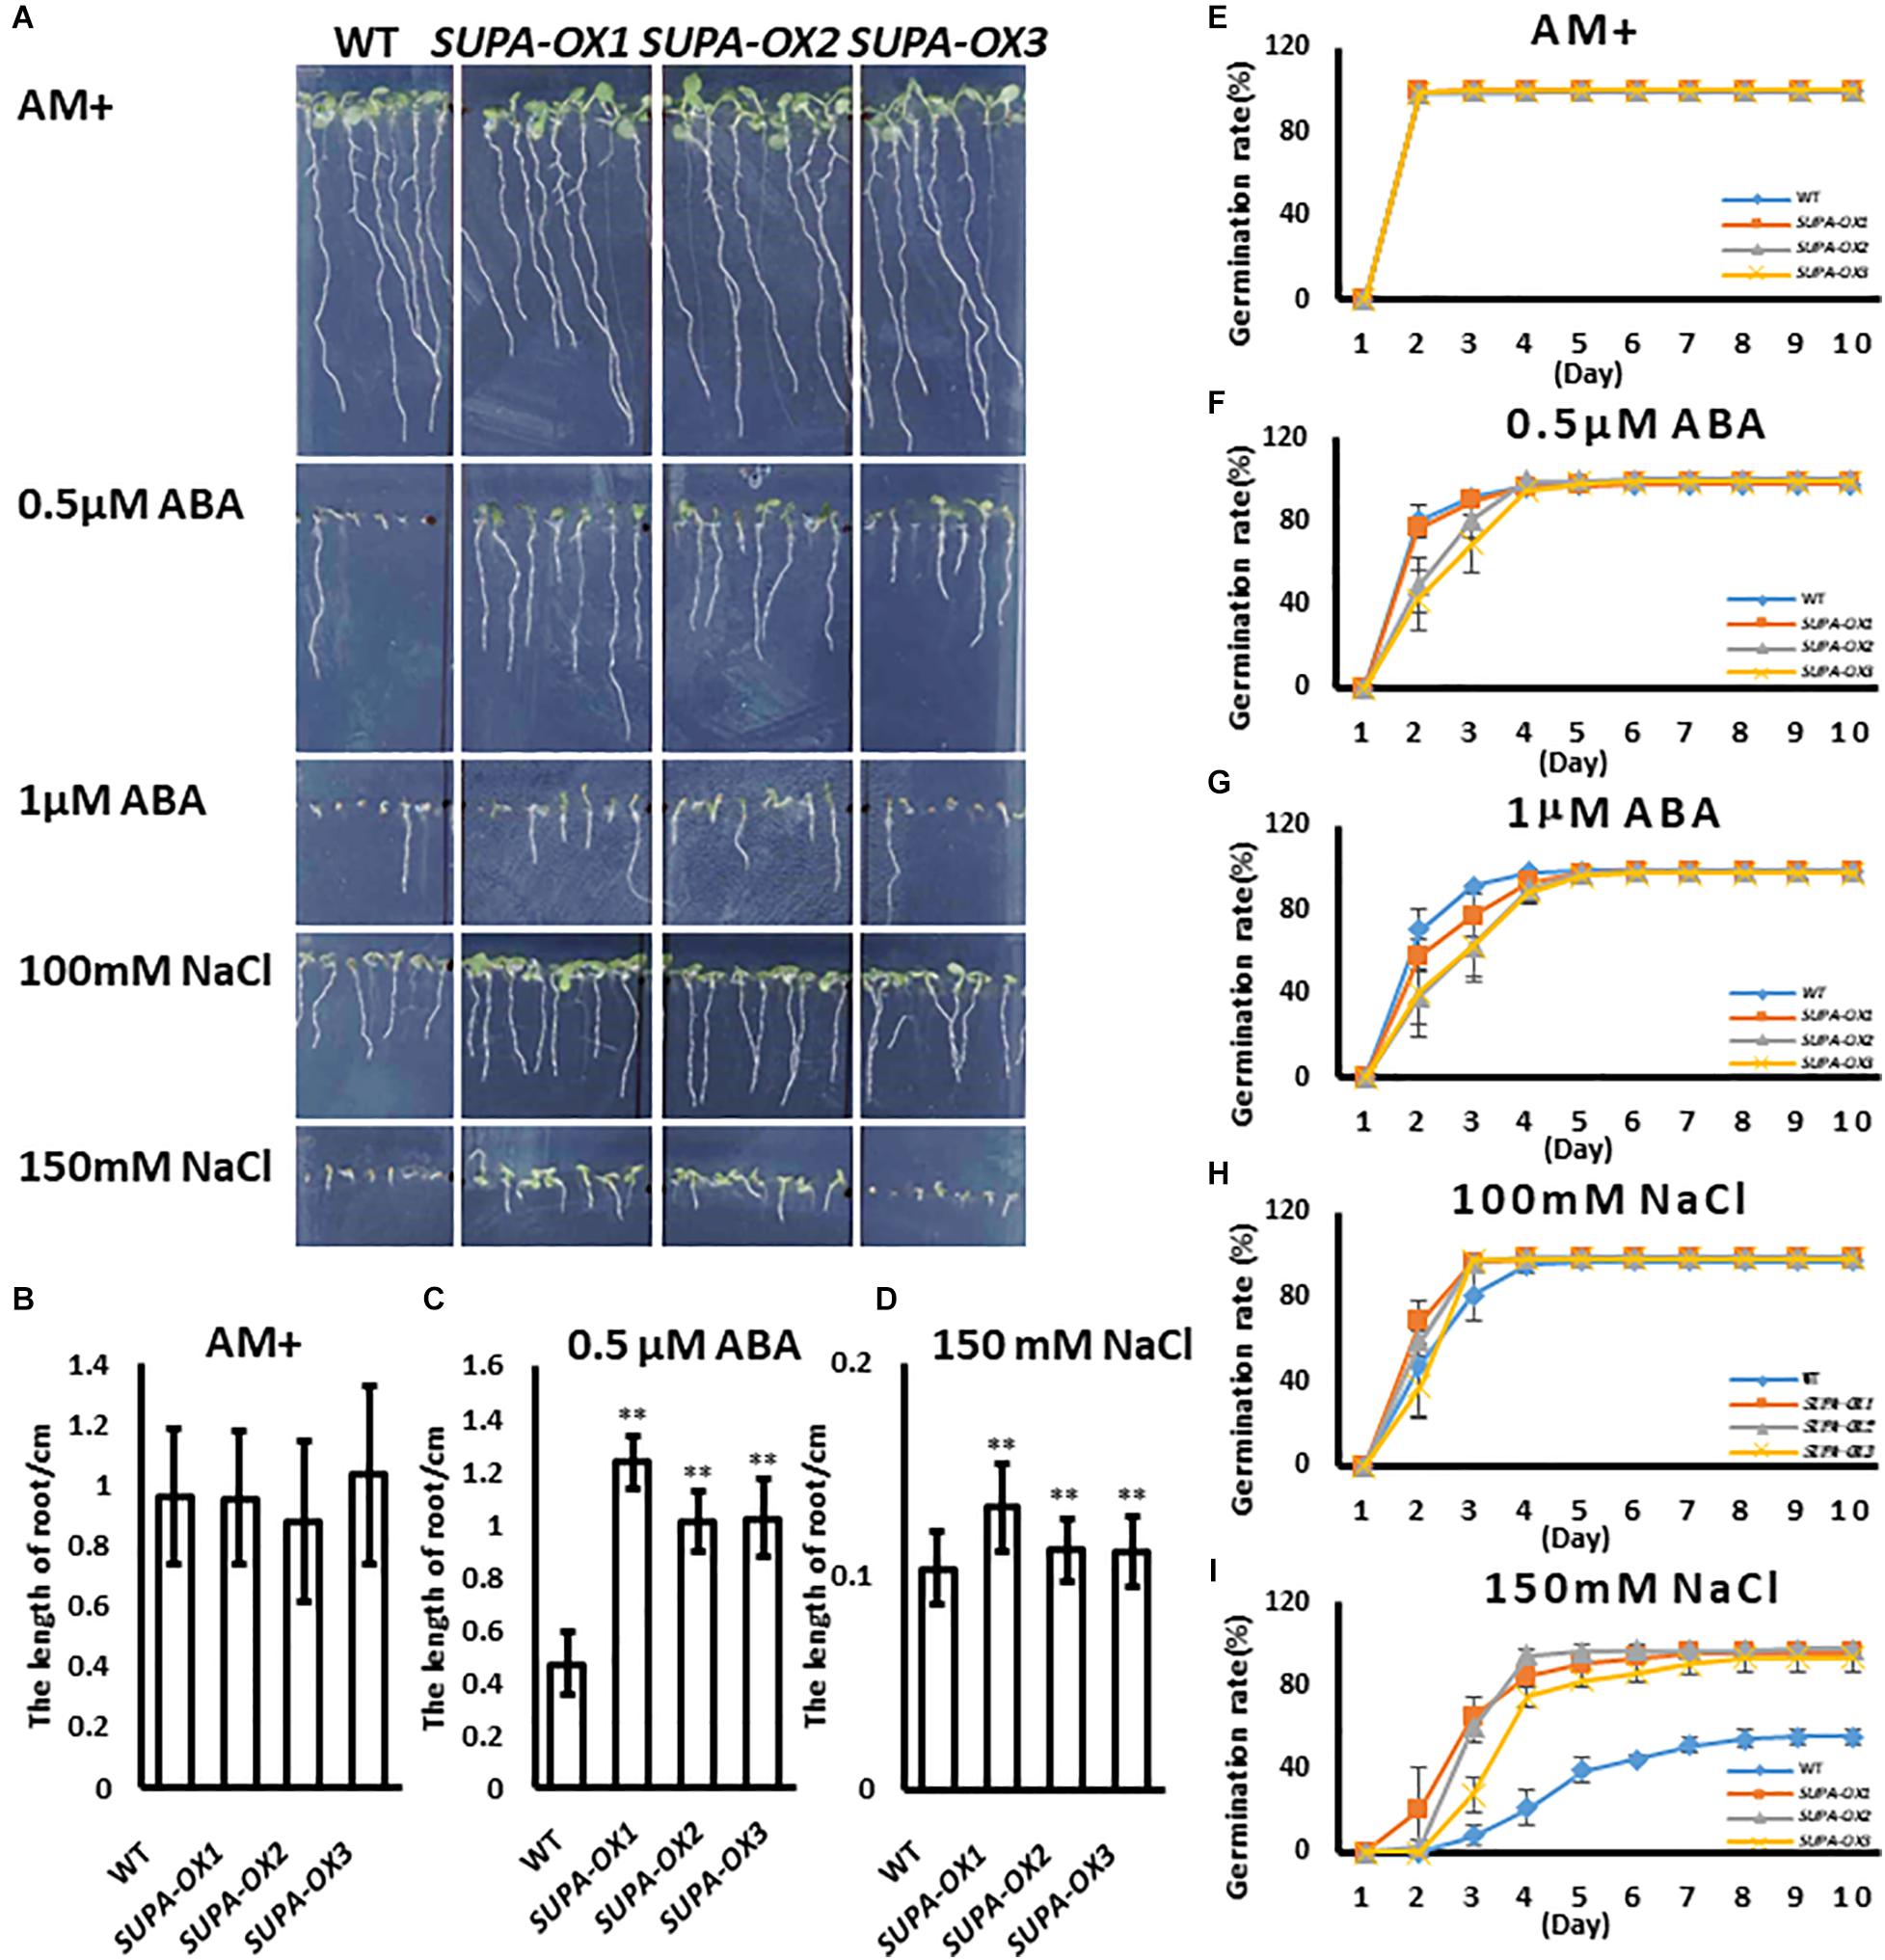
Figure 7. Overexpression of SUPA enhances Arabidopsis response to abiotic stresses at seedling stage. (A) SUPA-overexpression lines were insensitive to ABA and salt stress. Wild type and three SUPA-overexpression lines were grown vertically on AM + medium with or without ABA or NaCl, and photos were taken on day 7 after stratification. Representative images from the three independent experiments are shown. (B–D) Statistically analysis of root length. The root length of seedlings grown with or without (B) ABA (C) and NaCl (D) were measured using image J and statistically analyzed. Results are presented as means and standard errors from three independent experiments (n > 15), *p < 0.05, **p < 0.01. (E–I) Effects of ABA and NaCl on seed germination. Wild type and SUPA overexpression line seeds were sown on AM + medium (E), or AM + medium containing. 0.5 μM ABA (F), 1 μM ABA (G), 100 mM NaCl (H), 150 mM NaCl (I), Germination (emergence of radicles) was scored daily for 10 days. All results are presented as means and standard errors from three independent experiments (about 100 seeds for each repeat).
H2O2 Concentration and Total Antioxidant Capacity (T-AOC) Level Was Altered After Stress Treatment
ROS plays a key role in plant response to abiotic stresses (Choudhury et al., 2017). We measured the H2O2 levels of wild type and transgenic lines after stress treatment. Our results showed that under normal conditions the ROS levels in transgenic lines were much higher than wildtype (Supplementary Figure 8). However, compared with wildtype, transgenic lines accumulate lower ROS levels after ABA or NaCl treatment, particularly after ABA treatment (Supplementary Figure 8). In addition, the total antioxidant capacity of all transgenic lines was higher than wild type plants in stress conditions (Supplementary Figure 8), which showed that the transgenic lines had a stronger free radical scavenging capability than the wild type plants.
Overexpression of SUPA Leads to the Broad Transcriptomic Changes
SUPA overexpression leads to strong morphological changes under both normal and stress conditions, which is indicative of broad gene expression changes at the molecular level. To test this hypothesis, we performed RNA-Seq analysis using the hypocotyls and cotyledons from wild type and two SUPA-OX lines (SUPA-OX1 and SUPA-OX2). The results revealed 757 and 921 differentially expressed genes (DEGs) in two independent SUPA-overexpression lines, respectively, using a threshold fold change > 2 and a significance level of p < 0.05 (Rosenwasser et al., 2011). Of these DEGs, 388 genes were found to be present in both overexpression lines, with 121 genes being up-regulated (31.2%) and 267 genes being down-regulated (68.8%) (Figures 8A,B and Supplementary Table 1). These 388 genes were regarded as SUPA-regulated genes. Gene Ontology (GO) enrichment analysis showed that overrepresented categories were molecular functions related to plant stress response (such as oxidation-reduction process, defense response, defense response and defense response), plant development (such as programmed cell death, ethylene biosynthetic process, fruit ripening, plant-type cell wall modification, wax biosynthetic process and regulation of seed development), and metabolic pathways (such as cellular alkene metabolic process, ornithine metabolic process, lipoprotein catabolic process, regulation of anthocyanin biosynthetic process and neutral lipid metabolic process) (Figure 8C and Supplementary Table 2), which is consistent with the morphological observations. We also noticed that 369 and 533 DEGs were specifically expressed in SUPA-OX1 and SUPA-OX2 transgenic line, respectively (Figure 8A). GO analysis indicated that genes specifically expressed in SUPA-OX1 was enriched in response to mechanical stimulus, oxidative stress, and chitin, lipid binding and localization, and ethylene metabolic pathways (Supplementary Table 3). For DEGs that are specifically expressed in SUPA-OX2, enrich categories were mainly related to lipid transport, reduction and localization, as well as oxidative reduction and transitional metal ion transport were significantly enriched (Supplementary Table 4).
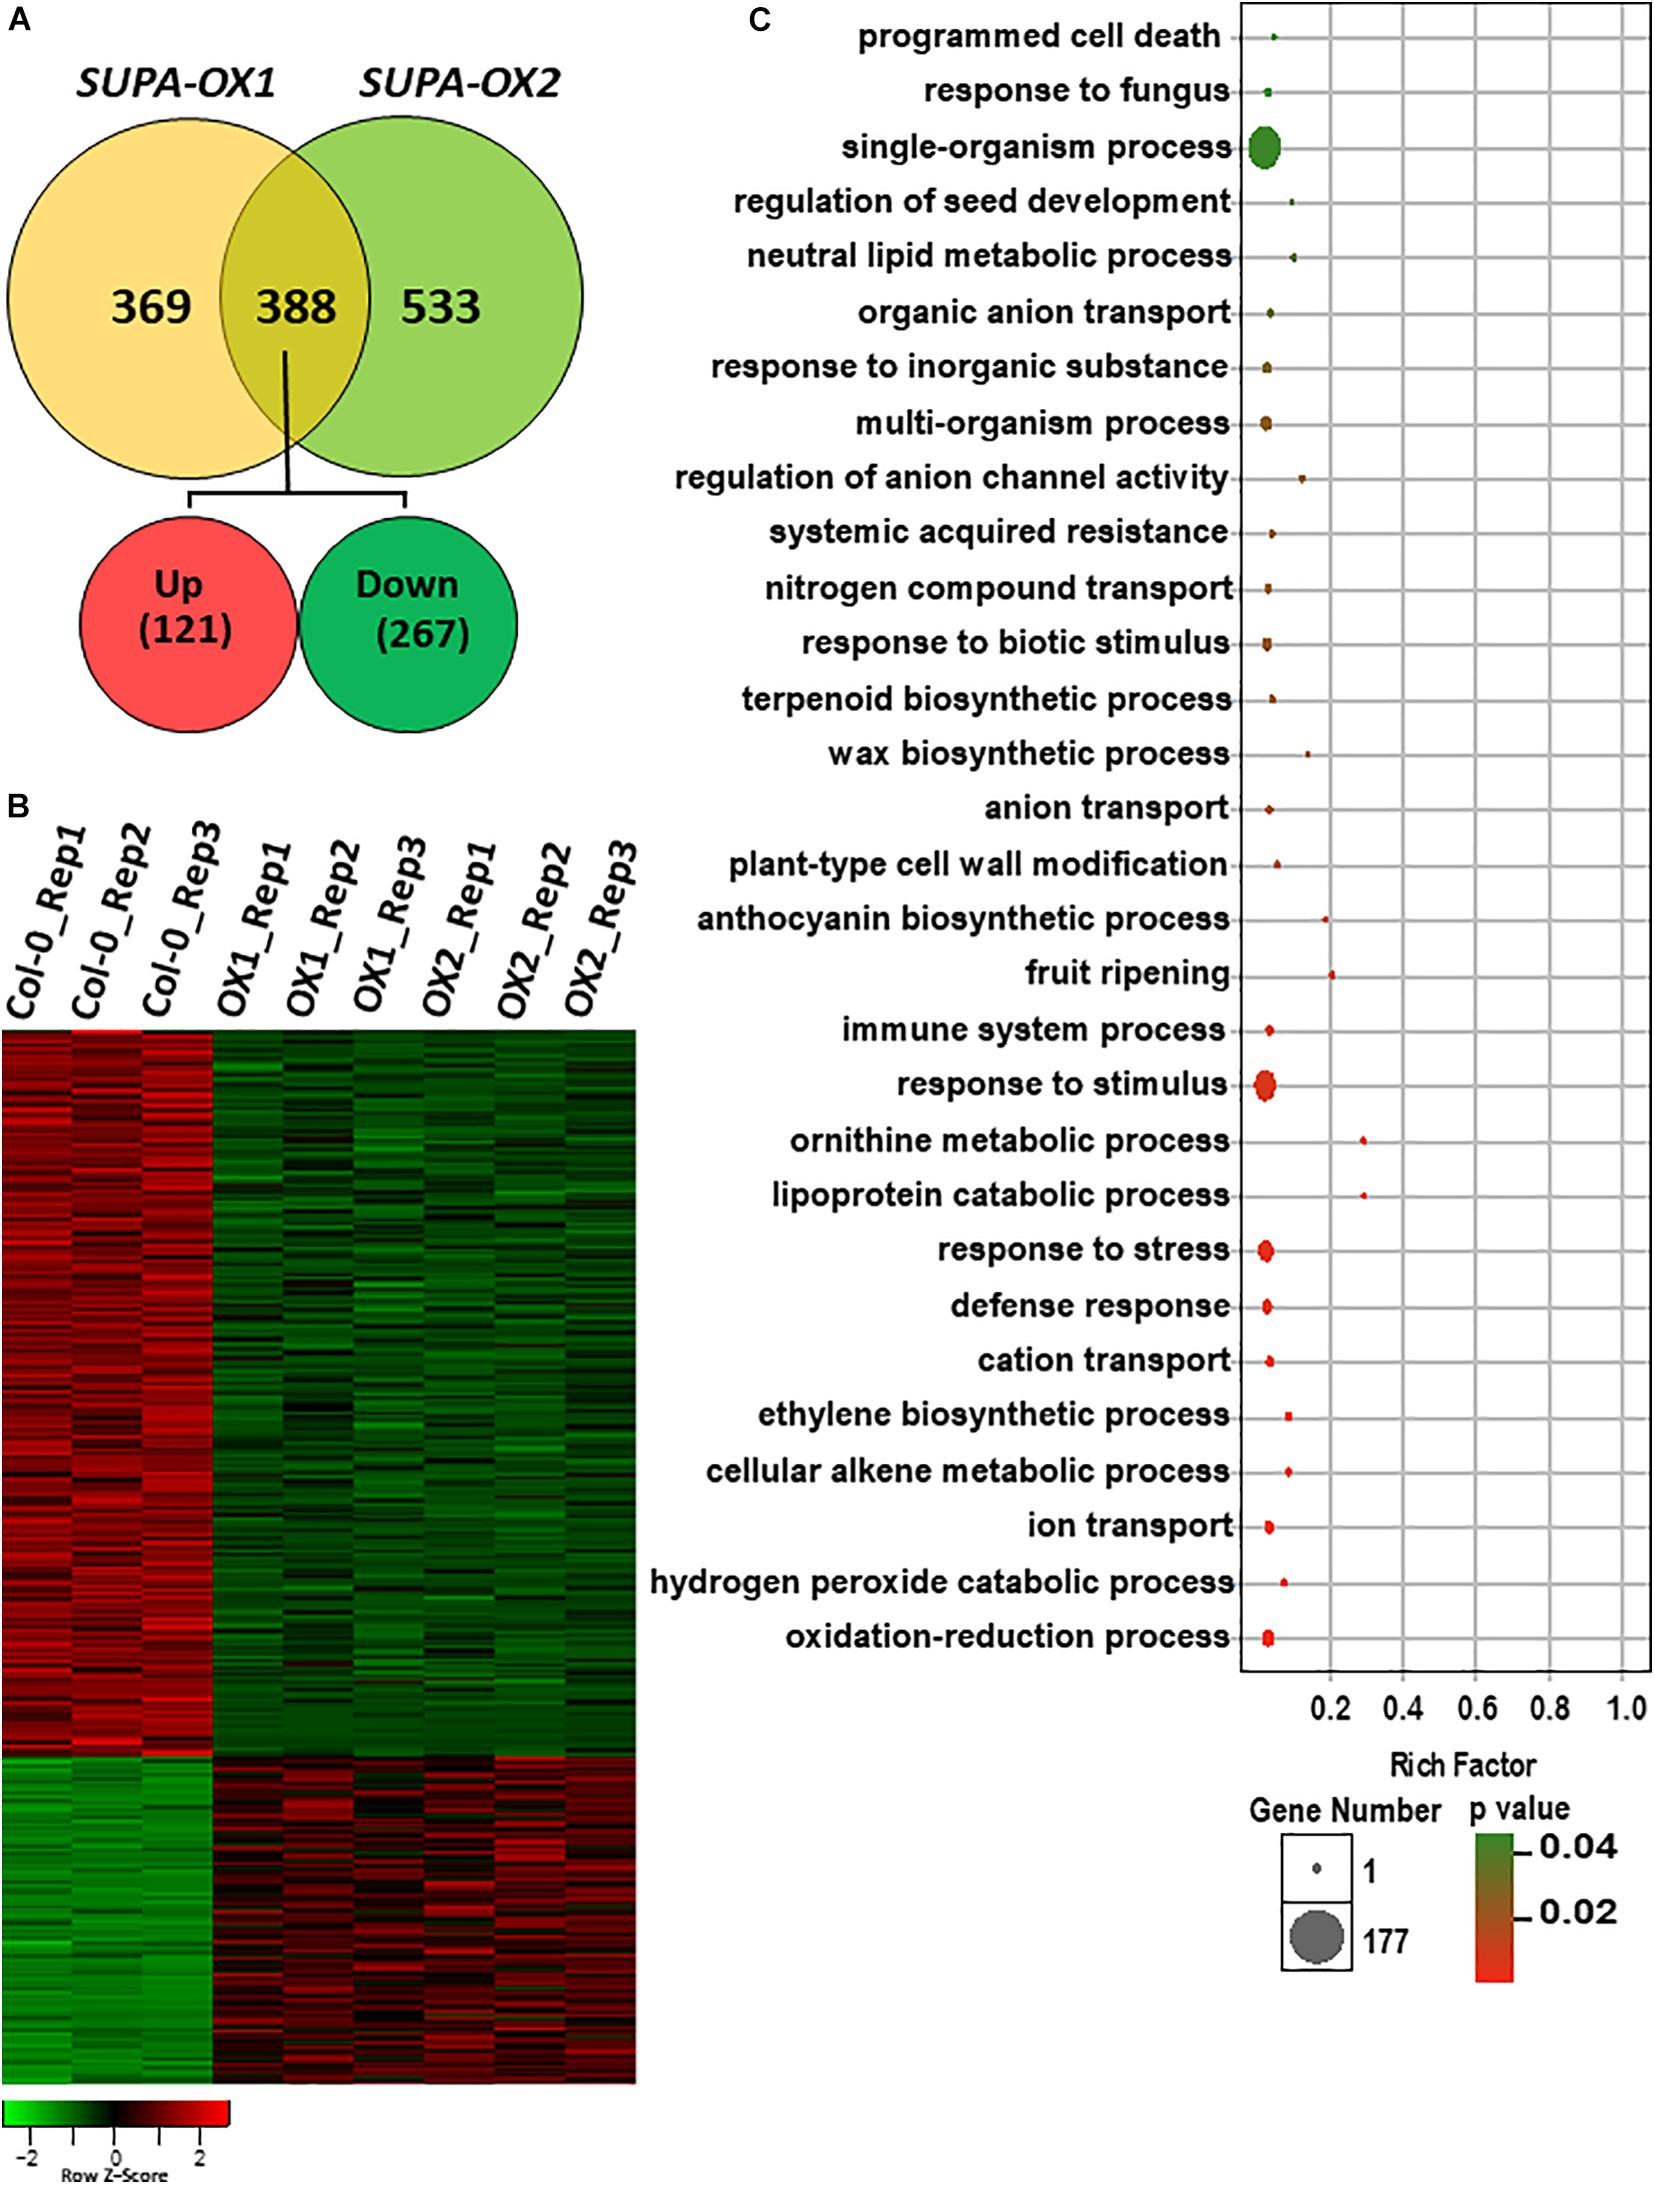
Figure 8. Overexpression of SUPA leads to broad transcriptomic changes. (A) Venn diagram showing the overlap of DEGs between two SUPA-overexpression lines. 388 DEGs were presented in both SUPA-overexpression lines, with 121 up-regulated and 267 down-regulated. (B) Heat map representation of the differentially expressed genes. Numbers on the nodes display major gene groups based on expression patterns. Color scale shows log2 signal intensity values. (C) Go analysis of the differentially expressed genes. The top 30 significant GO terms of differential expressed genes are presented graphically. The X-axis represents the value of –log10 (p-value). The Y-axis indicates the name of the GO term. The size of each point is proportional to the differentially expressed genes associated with the GO terms.
Since SUPA is localized in the peroxisome, we analyzed the peroxisomal related genes that differentially expressed in both SUPA-OX lines. Of the peroxisomal genes defined previously (Ebeed et al., 2018), a total of 20 genes (7 upregulated and 13 down regulated) were differentially expressed in SUPA overexpression (Supplementary Table 5). Gene Ontology (GO) enrichment analysis showed that overrepresented categories related to response to oxidative stress, peroxidase activity, and cofactor binding were significantly enriched (Supplementary Table 6).
In summary, overexpression of SUPA leads to broad gene expression changes at the transcriptional level, which may result in the phenotypic changes in the transgenic lines.
Overexpression of SUPA in Poplar Leads to Strong Morphological Alterations
Overexpression of SUPA changes the leaf shape and increases plant tolerance to abiotic stresses in Arabidopsis, and we further investigated if this gene functions in other plant species such as poplar. We ectopically expressed Arabidopsis SUPA gene in poplar, and 10 independent transgenic lines were obtained. We analyzed expression level by q-PCR with leaves, the results showed that SUPA expressions in transgenic lines were significantly higher than WT, of which data from 3 representative lines are shown (Figure 9A). The transgenic lines exhibited dwarf phenotypes with severe morphological alterations under normal growth conditions (Figure 9B). All the SUPA-OX lines display shorter internodes (Figure 9C), and their leaves are dramatically wrinkled and curved upward (Figures 9D,E), which likely results from the differential development of the right and left sides of the leaf blade. We also observed that the basal cells below the trichrome of transgenic poplar were disformed, and they protruded from the epidermal cells and have distinctive shapes compared to the regular epidermal cells, which is quite similar as we observed in Arabidopsis (Figures 9F,G). Such phenotypes appear from the tissue culture stage, and remain after being transplanted to soil. These results suggested that some conserved signaling pathways may be activated which result in similar phenotypes when Arabidopsis SUPA is overexpressed in Arabidopsis and poplar.
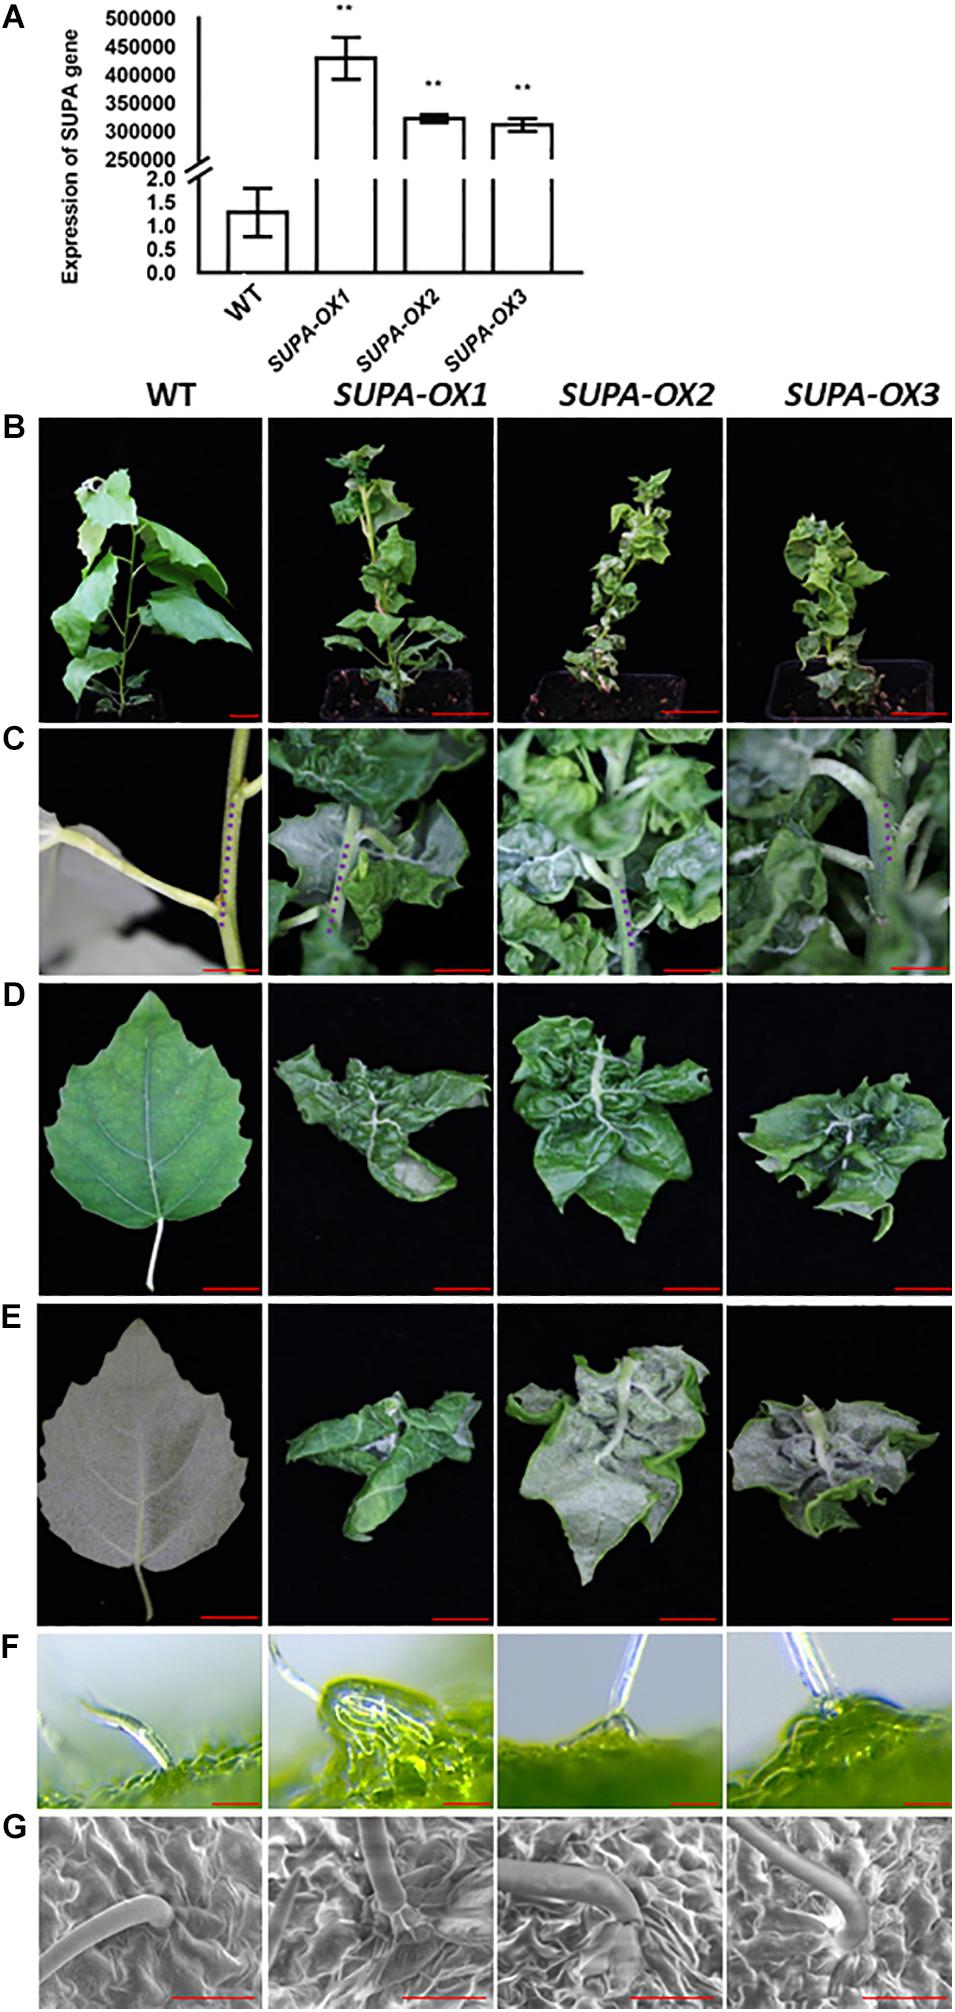
Figure 9. Overexpression of SUPA in poplar leads to multiple phenotypic changes under normal growth conditions. (A) qRT-PCR verification of the transgenic poplars overexpressing the SUPA gene. Leaves from 3-week old plants were harvested and used for RNA extraction, and the qPCR analysis was performed with SUPA-gene specific primers. Data represents the average of three independent experiments ± SE. **P < 0.01. (B–G) Phenotypic categories of transgenic plants overexpressing SUPA genes. 2-month old wild type and transgenic poplars are shown in (B) Bar = 4 cm; compared with wild type, the internodes of the SUPA overexpression plants are much shorter (C) Bar = 2 cm, blue dots indicate the length of the internode; the front side (D) Bar = 1.5 cm; back side (E) Bar = 1.5 cm and the trichrome observed with Stereo fluorescence microscope (Leica M205FA) (F) or by SEM (G) of the wild type and transgenic lines are shown. Bar = 50 μm in the (F,G).
SUPA Overexpression Leads to Multiple Abiotic Stresses Alterations in Poplar
Our results showed that enhanced expression of SUPA in Arabidopsis leads to the over-accumulation of ROS, and enhances plant tolerance to abiotic stresses (Figure 5 and Supplementary Figure 8). We therefore tested if the ROS levels and stress tolerance properties were changed in transgenic poplar. We first checked the H2O2 levels of wildtype and transgenic lines grown under normal growth conditions. As in Arabidopsis, higher accumulation of ROS was observed in the SUPA-overexpression poplar transgenic lines, revealed by our DAB and NBT staining, as well as H2O2 measurements (Supplementary Figures 9A,B), and the total antioxidant capacity was also increased (Supplementary Figure 9C), indicating the transgenic poplar may also change their stress tolerance. We further performed drought or salt treatment. For drought treatments, 100% of the SUPA-overexpression lines grew well and maintained green coloration, while 95% wild type plants were withed and dead after 32 days of water withdrawal (Figures 10A,C). Interestingly, results from water-loss measurements showed that the water-loss rate from detached leaves were much higher in the transgenic lines (Figure 10D), indicating the drought tolerant phenotype of the SUPA-OX lines was not due to reduced water loss from the leaves, and other yet-to-known molecular mechanism may contribute to the increased drought tolerance. Further investigation of the metabolic and molecular changes is required to fully explain these results.
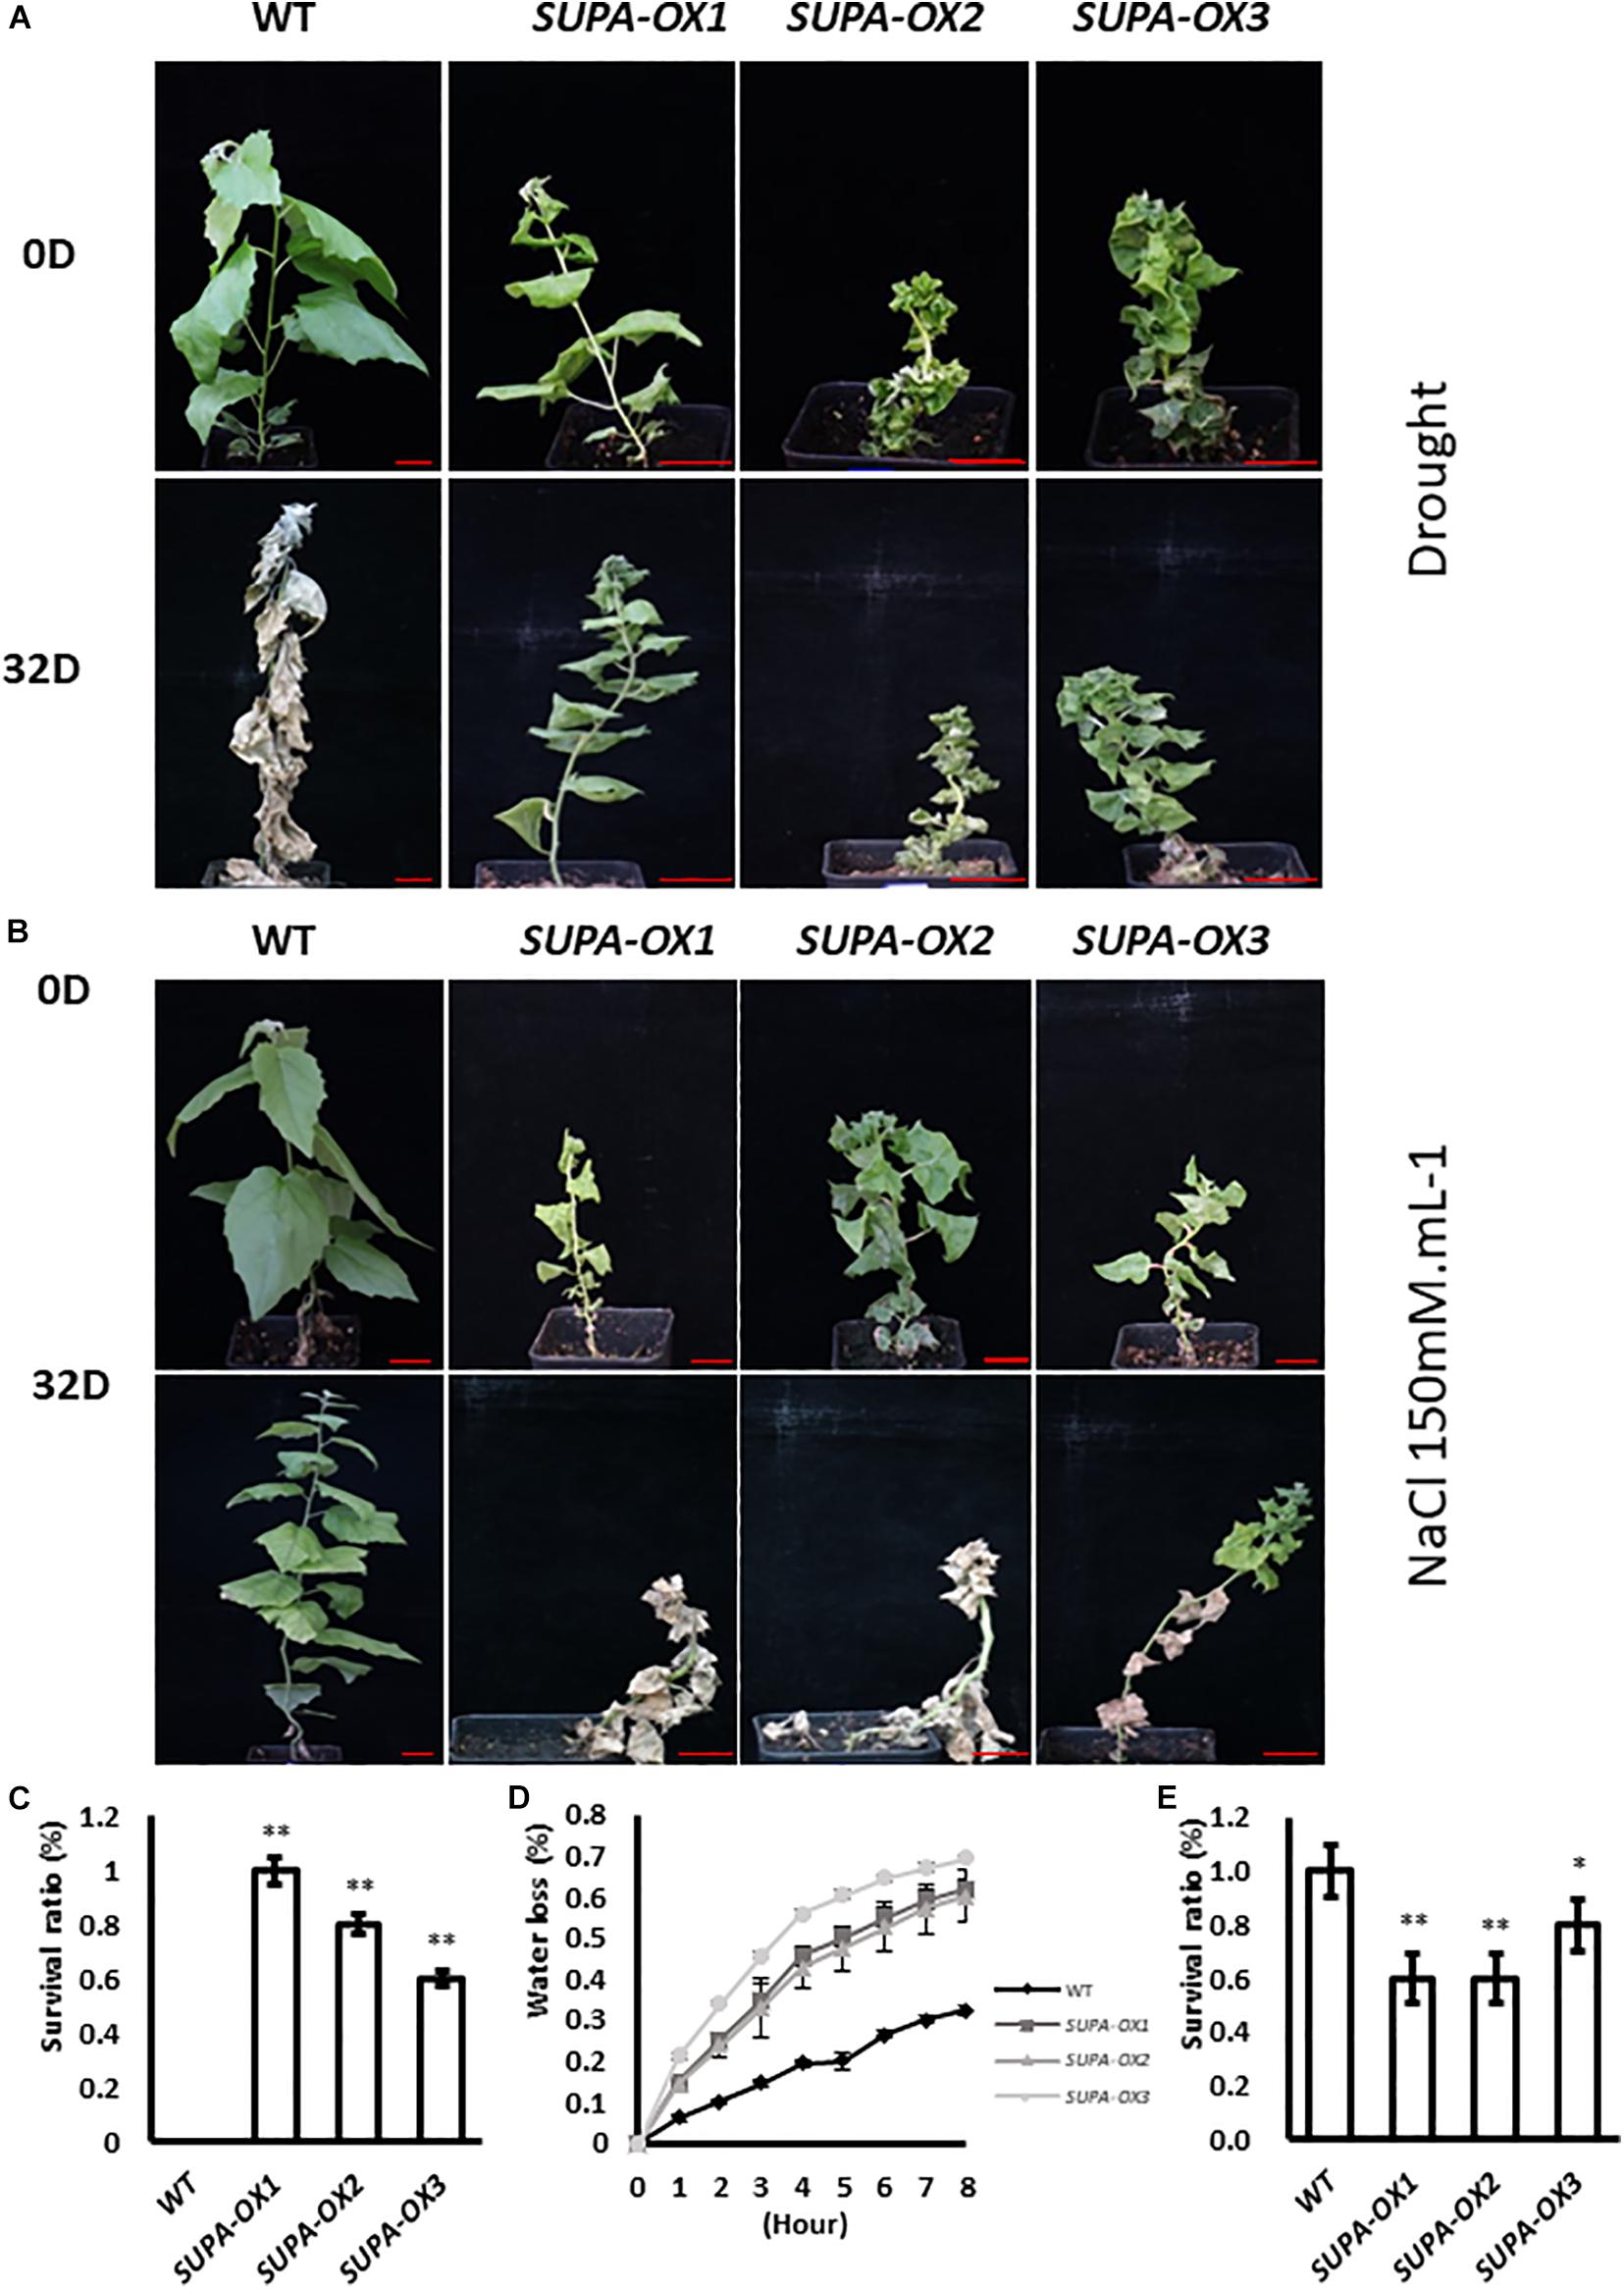
Figure 10. Ectopic expression of SUPA gene in poplar alters plant tolerance to salt and drought. (A,B) Growth of wild type and three independent transgenic poplars before and after salt or drought treatment. 1-month old poplar plants were treated with water withdrawal (A) or 150 mM NaCl (B), pictures were taken before and after 32-day treatment. 4 independent repeats were performed and the representative plants were shown. Bar = 4 cm. (C–E) Statistical analysis of the survival between wild type and three independent transgenic lines after salt treatment (C) or drought treatment (E), and the water loss rate (D). The water loss rates of cut leaves were measured at the indicated times after their excision. The water loss was calculated as the percentage of initial fresh mass. The results are presented as means and standard errors from three independent experiments. *p < 0.05. **P < 0.01.
Regarding salt treatment, the overexpression lines remained alive but became withered when grown on 50 or 100 mM NaCl-containing medium at the tissue culture stage, while the wild type plants grow normally (Supplementary Figure 10). For the soil-grown plants, after 32 days treatment with 150 mM NaCl, 50% of the transgenic lines were dead, whereas 100% of wild type plants were alive (Figures 10B,E). These results highlight that unlike the SUPA-mediated stress-tolerant phenotypes displayed in Arabidopsis, the overexpression of SUPA in poplar dramatically reduced plant tolerance to salt (Figure 10B and Supplementary Figure 10).
Discussion
Plants have evolved complicated mechanisms to cope with abiotic stresses, however, our knowledge of the molecular mechanisms behind these processes are still limited. In Arabidopsis, still nearly one-half of all Arabidopsis genes are functional unknown, and it is possible and extremely important to identify the novel genes that play important roles in plant stress tolerance.
Peroxisomes are highly versatile and assist plants in adapting to changing environments through cellular metabolic adjustments, such as adjustments in photorespiration and fatty acid ß-oxidation, ureide, and phytohormone (auxin and jasmonic acid) metabolic rates (Hu et al., 2012). Peroxisomes are also the major sites of intracellular ROS production (Del Rio and Lopez-Huertas, 2016), which has both positive and negative effects on plant tolerance to stresses depending on ROS concentration. It was reported that peroxisomes could rapidly respond to stress, and rapidly accumulate ROS and induce downstream stress-related gene expressions (Rodríguez-Serrano et al., 2016). However, the molecular mechanism is unclear. To the best of our knowledge, until now no single peroxisome-localized protein that was able to rapidly respond to stress (within 15 min) and contribute to the accumulation of ROS has been reported.
In this study, we identified a novel peroxisome-localized factor SUPA which rapidly responds to ABA and abiotic stresses at the transcriptomic level. Overexpression of SUPA in both Arabidopsis and poplar significantly enhanced their ROS levels, and the transgenic lines dramatically changed their phenotypes both under normal growth and stress conditions.
SUPA Is Rapidly Responsive to Abiotic Stresses When Localized in the Peroxisome
When encountering stresses, plants respond within several seconds to minutes -, and the genes involved in this rapid response are vital, as they initiate transcriptional and metabolic responses leading to improved survival. Until now, our knowledge of the nature and function of the rapid and systemic responses to abiotic stresses in plants has been limited and only a few key genes involved in this process were isolated and functionally characterized (Kollist et al., 2018). SUPA expression rapidly responds to abiotic stresses, within 15 min, which may lead to the broad transcriptomic changes. Whereas elevated SUPA expression, does not directly change the downstream gene expression of other master stress-responsive transcription factors such as DREBs or WRKYs as it is localized in peroxisomes. Peroxisomes are an important source of signaling molecules that function in plant growth and development under both normal and stress conditions (Hu et al., 2012; Sandalio and Romero-Puertas, 2015). It has been reported that peroxisomes could rapidly sense environmental changes and adjust the level of ROS accordingly, which then enables ROS-mediated nuclear gene expression, although the molecular mechanisms involved in these processes are still unknown (Queval et al., 2007; Mittler et al., 2011). SUPA maybe involve in this process, as it rapidly responds to abiotic stresses, induces the ROS accumulation and the subsequent gene expression. However, the question still remains of how SUPA protein affects ROS level at molecular level.
ROS Is Accumulated by SUPA Overexpression, Which Confers Differing Plant Stress Tolerance Abilities in Different Species
ROS accumulation mediated by the overexpression of SUPA could be observed in both Arabidopsis and poplar, and they share some similar phenotypes such as curved leaves and smaller plant size when grown under normal conditions. However, their responses to stresses are opposite. Transgenic Arabidopsis had enhanced tolerance to abiotic stress whereas transgenic poplars had a decreased tolerance to salt, and increased tolerance to water deficit. Several possibilities may lead to these results. Firstly, ROS could act as signaling molecular only at low concentration, while causing oxidative stress at high concentration, and different plant species may respond to similar concentrations of ROS differently. In the future, more species overexpressing the SUPA gene will be used to investigate plant tolerance changes to abiotic stress to test this hypothesis. Secondly, ROS production and scavenging are both important in controlling ROS levels. In Arabidopsis, ROS could effectively be induced by SUPA accumulation, although there must be a regulatory mechanism that could trigger the cessation of SUPA expression when not required so that ROS levels can return to normal. In poplar, such anti-SUPA-function mechanisms may not work effectively, leading to the over-accumulation of ROS and reduced plant stress tolerance. Thirdly, maybe there were some unknown mechanism that contribute to the observed phonotype exist in poplar. Further detailed functional analysis of SUPA protein will be performed in the future.
Important Factors That May Contribute the SUPA-OX Phenotypes
In our study, 18 transcription factors with at least twofold change in expression were identified (Supplementary Table 7). Remarkably, most of these transcription factors were reported to be involved in plant stress responses (Wang et al., 2016; Zhu, 2016). Overexpression of some transcription factors such as WRKY30 (Scarpeci et al., 2013), ZFP1 (Tang et al., 2013), HSFB3 (Scharf et al., 2012) effectively enhanced plant tolerance to abiotic stresses, and therefore the enhanced expressions of these transcription factors in both SUPA-OX lines may also contribute to the plant stress resistance phenotypes. Moreover, 77 stress responsive genes were identified among the DEGs (Supplementary Table 8) and 24 of these genes were involved in plant defense response (Supplementary Table 9), indicating the potential role of SUPA in the plant defense response.
SUPA-overexpression lines display early flowering phenotypes, and corroborating these results, we identified the following flower development related transcription factors with alternations in gene expression. MAF4 (AT5G65070) which was previously identified as a MADS-domain containing FLC paralog represses flowering (Gu et al., 2009, 2013), and overexpression of MAF4 leads to delayed flowering (Ratcliffe et al., 2003). AHL22 (At2g45430) which encodes a nuclear localized AT-hook domain containing protein binds to an AT-rich sequence stretches in the FT locus (Yun et al., 2012). Overexpression of AHL22 leads to delayed flowering, while the alh22 mutant showed earlier flowering times compared with wild type (Xiao et al., 2009; Yun et al., 2012). In SUPA overexpression lines, both genes were significantly down-regulated (Supplementary Table 7) and those results correlated with the early flowering phenotype of the SUPA-OX lines.
SUPA overexpression leads to strong morphological alternations, and we identified 36 developmental related genes among the DEGs (Supplementary Table 10). Among them, 3 ethylene biosynthesis genes (ACS1, ACS2, and ACS4) and 6 auxin pathway genes (LBD16, SAUR72, AT4G12980, WAG2, WAG1, SAUR72) had significant changes in the overexpression lines, indicating both hormones may be involved in the SUPA-mediated phenotypes. 25 cell wall related genes were identified (Supplementary Table 11), indicating SUPA overexpression may change the cell wall properties and contribute to the observed phenotypes. The correlations between SUPA and these factors will be further investigated in the future.
Based on our data, we hypothesize that in Arabidopsis the expression of SUPA could be rapidly activated by abiotic stress stimuli, and SUPA protein would accumulates in the peroxisome which would leads to the over-production of ROS through currently unknown mechanisms. The increased levels of ROS act as the signaling molecule to activate the stress responsive genes and thereby improve Arabidopsis tolerance to abiotic stresses. In transgenic poplar, a more complex mechanism is suggested, as SUPA-overexpression also leads to the enhanced ROS level, which, in addition to the ROS signaling effect leading to poplar tolerance to water deficit, also causes oxidative stresses and reduces tolerance to salt stress (Figure 11). These findings will largely improve our understanding of plant physiology, and the further study of regulatory mechanisms of SUPA gene expression and the mechanisms of action of SUPA protein will enable a greater and more complete understanding of its molecular functions.
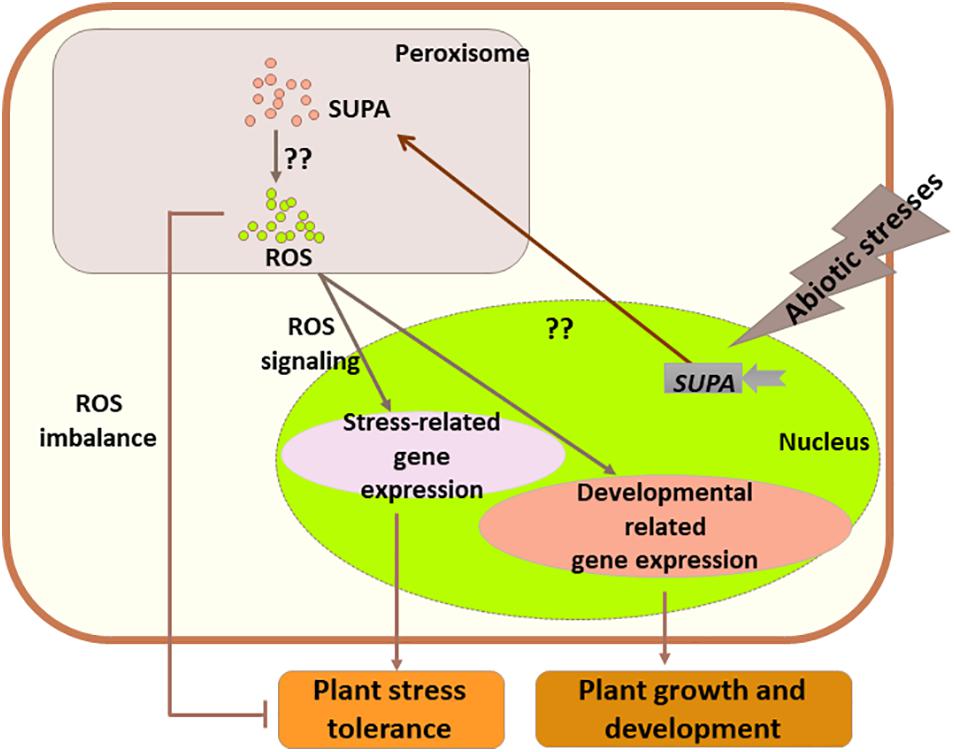
Figure 11. Working model for the role of SUPA in normal growth and stress conditions. Abiotic stresses rapidly activate the transcription of SUPA, and enhanced SUPA protein accumulation in peroxisomes, which leads to the increased level of ROS through unknown mechanisms. In some species such as Arabidopsis, the SUPA-mediated ROS acts as signaling component, and alters plant morphology and plant abiotic stress tolerance through the expression changes of the genes involved in plant stress response and development. In poplars, overexpression of SUPA results in higher ROS concentration than its tolerance threshold, which causes the imbalance of ROS level, and thereby reduced plant stress tolerance.
Data Availability Statement
The data were deposited in NCBI Sequence Read Archive (SRA, http://www.ncbi.nlm.nih.gov/sra) with accession number PRJNA634204.
Author Contributions
QZ conceived this project, designed the experiments, and interpreted the results. CC and WW performed the experiments. SY, CW, and MX helped to collect and analyze the data. ZZ helped to analyzed the RNA-seq data. QZ wrote the manuscript. All authors contributed to the article and approved the submitted version.
Funding
This work was supported by the Natural Science Foundation of Fujian Province (No. 2016J01099), Program for Scientific and Technological Innovation Team for Universities of Fujian Province (No. 118/KLA18069A), and Fujian Innovative Center for Germplasm Resources and Cultivation of Woody Plants (No. 125/KLA15001E) to QZ.
Conflict of Interest
The authors declare that the research was conducted in the absence of any commercial or financial relationships that could be construed as a potential conflict of interest.
Acknowledgments
We thank the International Magnesium Institute for its financial support to WW, and Dr. R. Thaniarasu from Fujian Agriculture and Forestry University for the critical reading of the manuscript.
Supplementary Material
The Supplementary Material for this article can be found online at: https://www.frontiersin.org/articles/10.3389/fpls.2020.560985/full#supplementary-material
Supplementary Figure 1 | Phylogenetic analysis of SUPA and its homologues. (A) Phylogenetic analysis of SUPA and proteins shared the highest similarities in Arabidopsis. The protein sequences of SUPA (AT5G65300) and proteins shared the highest similarities (AT1G35210, AT1G72240, and AT1G22470) were downloaded from TAIR, and the neighbor-joining method of the MEGA5 program was used to construct the phylogenetic tree. Bootstrap values from 1000 replicates are indicated at each branch. (B) Phylogenetic analysis of SUPA and its homologues in poplar. The protein sequences of SUPA (AT5G65300) and proteins shared the highest similarities (POPTR_0007s05020.1, POPTR_0005s07300.1, and POPTR_0005s17370.1) were downloaded from poplar genome database (http://www.plantgdb.org/PtGDB/), and the neighbor-joining method of the MEGA5 program was used to construct the phylogenetic tree. Bootstrap values from 1000 replicates are indicated at each branch. (C) Alignment of the amino acid sequence of SUPA and proteins shared the highest similarities. Alignment profiles of SUPA (AT5G65300) and proteins with the highest (AT1G35210, AT1G72240, AT1G22470) with Clustal-W program are shown. The shading indicates identical and conserved amino acid residues. The three conserved domains are underlined (Domain I-Domain III). (D) Alignment of the amino acid sequence of SUPA and proteins shared the highest similarities. Alignment profiles of SUPA (AT5G65300) and proteins with the highest (POPTR_0007s05020.1, POPTR_0005s07300.1, and POPTR_0005s17370.1) with Clustal-W program are shown. The shading indicates identical and conserved amino acid residues. The three conserved domains are underlined (Domain I-Domain III).
Supplementary Figure 2 | The transcripts of SUPA homologues rapidly respond to ABA and abiotic stresses. The expression of AT1G22470, AT1G72240, and AT1G35210 in response to ABA and various abiotic stresses were analyzed by qRT-PCR. 7-day-old seedlings grown on AM+ medium were treated with 150 mM NaCl, 1 μM, 4 °C, and 300 mM Mannitol. Samples were collected at the indicated time after the initiation of treatment. Total RNA was extracted from whole seedlings, and real-time PCR analyses were performed with the gene specific primers listed in Supplementary Table 8. The relative expression was calculated using Actin as an internal reference. The unstressed expression level was assigned a value of 1. Data represents the average of three independent experiments ± SE.
Supplementary Figure 3 | Overexpression of SUPA leads to various phenotypic alterations in light but not in dark. (A) Phenotypes of seedlings grown in different types of light. Seeds were germinated and grown under the light indicated on the left, the results were recorded at day 7. Bar = 0.5 mm. (B–G) Statistical analysis of the hypocotyl length and petiole grown in various light conditions. Hypocotyl length under white light (B); Petiole length under normal light (C); Hypocotyl length in far red light (D); Petiole length in far red light (E); Hypocotyl length of blue light (F); Petiole length under blue light (G); Hypocotyl length under dark (H).
Supplementary Figure 4 | Effects of SUPA overexpression on Arabidopsis flower growth. (A) Sepal phenotypes of wild type and three SUPA-overexpression lines at stage 12. Images were taken of 5-week old plants. Flowers were selected before opening and images were taken. Bar = 25 μm. (B) Carpel phenotypes of wild type and three SUPA-overexpression lines at stage 12. The sepals and petals from were carefully removed with forceps, and pictures of carpels were taken. Bar = 25 μm. (C) SEM images of the upper part of sepals at stage 15. The sepals and petals are open with the development of carpels, while the sepals of the SUPA overexpression lines keep closed. Bar=150 μm. (D) SEM images of the basal part of sepals at the stage 16. The basal parts of WT remain together, while in SUPA overexpression lines, the sepals rupture as the carpel develops. Bar=150 μm. (E) SEM images of the ovary at the stage 15. Bar=150 μm. (F,G) SUPA-OX lines have normal siliques after self-pollination. Pictures of the siliques grown from SUPA-OX lines without self-pollination (F), and after self-pollination (G).
Supplementary Figure 5 | The supa mutant does not cause any phenotypic alternation under both normal growth and stress conditions. (A) SUPA gene in Arabidopsis. SUPA has one exon with a nucleotide length of 453 bp, the T-DNA fragment of supa mutant (SALK_069313) was inserted 55 bp from start code, as shown in the schematic. (B) RT-PCR verification of supa mutant. 7-day old seedling was used for RT-PCR analysis with SUPA gene specific primers, with the expression level of Actin as the control. (C) supa mutant is comparable to wild type in both normal growth and stress conditions. Seeds of wild type (WT) and supa mutant were sown on AM+ medium (A), or AM+ medium containing 1 μm ABA (B), 150 mM NaCl (C), 300 mM mannitol (D), photos were taken 7 days after stratification, and the representative images from three independent experiments are shown here. Bar = 0.3 cm. (E) 1-month old wild type and supa mutants grown on the soil.
Supplementary Figure 6 | The phenotypes of SUPA, SUPA-HA, and SUPA-GFP overexpression lines. Phenotypes of seedlings of WT, SUPA-OX1 and SUPA-HA. Seeds were germinated and seedlings were grown in the white light, and 7-day old seedlings were imaged. (A) Cotyledon and hypocotyl; (B) Seedlings. Bar = 0.5 mm.
Supplementary Figure 7 | SUPA protein is not co-localized with Lysosome and Mitochondria. Arabidopsis expressing the SUPA-HA construct was crossed with the Lysosome marker 35S::GFP-8a or Mitochondria marker Mt-RK expressing Arabidopsis line. The Lysosome marker (up panel) and the Mitochondria marker (low panel) of the 7-day old seedlings from the F1 progeny were used for immunostaining with anti-HA (green) and anti-RFP (red) antibody. Pictures were taken using a Zeiss LSM 880 confocal scanning microscopes with Airyscan. In the up panel, Bar = 5 μm, and in the low panel, Bar = 2 μm.
Supplementary Figure 8 | The concentration of H2O2 and the level of T-AOC under different stress conditions in the Arabidopsis. Quantitative measurements of H2O2 content (A) and T-AOC level (B) in WT and SUPA-OX lines under different stress conditions in Arabidopsis. Data represent the mean ± SE of three independent measurements. **p < 0.01.
Supplementary Figure 9 | Ectopic expression of SUPA in poplar alters the content of ROS. (A) NBT staining (upper panels) and DAB staining (lower panels) show the superoxide and H2O2 levels respectively. The 3rd leaves from the top of the 1-month old poplar were used for staining. The experiments were repeated at least 3 times, and representative data is shown here. Bar = 1.5 cm. (B,C) Quantitative measurements of H2O2 content (B) and T-AOC level (C) in WT and SUPA-OX lines under normal conditions in poplar. Data represent the mean ± SE of three independent measurements. **p < 0.01.
Supplementary Figure 10 | Overexpression of SUPA in poplar reduces plant salt tolerance. Wild type poplars and three SUPA-overexpression transgenic lines were grown on 1/2 MS medium with various concentration of NaCl (50 mM, 100 mM and 150 mM). The pictures before (Day 0) and after (Day 21) salt treatment were recorded, and representative data is presented. Three biological repeats were performed for all experiments.
Supplementary Table 1 | List of all the DEGs.
Supplementary Table 2 | GO annotations of the DEGs between wildtype and SUPA-overexpression lines.
Supplementary Table 3 | GO annotations of the DEGs between wildtype and SUPA-overexpression lines especially in SUPA-OX1.
Supplementary Table 4 | GO annotations of the DEGs between wildtype and SUPA-overexpression lines especially in SUPA-OX2.
Supplementary Table 5 | List of the peroxisome localized genes among DEGs between wildtype and SUPA-overexpression lines.
Supplementary Table 6 | GO annotations of the DEGs between wildtype and SUPA-overexpression lines that localized in peroxisomes.
Supplementary Table 7 | List of the transcription factors among the DEGs between wildtype and the SUPA-overexpression lines.
Supplementary Table 8 | List of the stress related genes among DEGs between wildtype and SUPA-overexpression lines.
Supplementary Table 9 | List of the defense related genes among DEGs between wildtype and SUPA-overexpression lines.
Supplementary Table 10 | List of the developmental related genes among DEGs between wildtype and SUPA-overexpression lines.
Supplementary Table 11 | List of the cell wall related genes among DEGs between wildtype and SUPA-overexpression lines.
Supplementary Table 12 | List of primers used for analysis.
Footnotes
References
Brown, D. M., Zeef, L. A., Ellis, J., Goodacre, R., and Turner, S. R. (2005). Identification of novel genes in Arabidopsis involved in secondary cell wall formation using expression profiling and reverse genetics. Plant Cell 17, 2281–2295. doi: 10.1105/tpc.105.031542
Chew, Y. H., and Halliday, K. J. (2011). A stress-free walk from Arabidopsis to crops. Curr. Opin. Biotechnol. 22, 281–286. doi: 10.1016/j.copbio.2010.11.011
Choudhury, F. K., Rivero, R. M., Blumwald, E., and Mittler, R. (2017). Reactive oxygen species, abiotic stress and stress combination. Plant J. 90, 856–867. doi: 10.1111/tpj.13299
Clough, S. J., and Bent, A. F. (2010). Floral dip: a simplified method for Agrobacterium-mediated transformation of Arabidopsis thaliana. Plant J. 16, 735–743. doi: 10.1046/j.1365-313x.1998.00343.x
Czechowski, T., Stitt, M., Altmann, T., Udvardi, M. K., and Scheible, W.-R. (2005). Genome-wide identification and testing of superior reference genes for transcript normalization in Arabidopsis. Plant Physiol. 139, 5–17. doi: 10.1104/pp.105.063743
Del Rio, L. A., and Lopez-Huertas, E. (2016). ROS generation in peroxisomes and its role in cell signaling. Plant Cell Physiol. 57, 1364–1376.
Dhanyalakshmi, K. H., Naika, M. B., Sajeevan, R. S., Mathew, O. K., Shafi, K. M., Sowdhamini, R., et al. (2016). An approach to function annotation for proteins of unknown function (PUFs) in the transcriptome of Indian mulberry. PLoS One 11:e0151323. doi: 10.1371/journal.pone.0151323
Dinneny, J. R., Long, T. A., Wang, J. Y., Jung, J. W., Mace, D., Pointer, S., et al. (2008). Cell identity mediates the response of Arabidopsis roots to abiotic stress. Science 320, 942–945. doi: 10.1126/science.1153795
Ebeed, H. T., Stevenson, S. R., Cuming, A. C., and Baker, A. (2018). Conserved and differential transcriptional responses of peroxisome associated pathways to drought, dehydration and ABA. J. Exp. Bot. 69, 4971–4985. doi: 10.1093/jxb/ery266
Foyer, C. H., and Noctor, G. (2013). Redox signaling in plants. Antioxid. Redox Signal. 18, 2087–2090. doi: 10.1089/ars.2013.5278
Gilmour, S. J., Zarka, D. G., Stockinger, E. J., Salazar, M. P., Houghton, J. M., and Thomashow, M. F. (1998). Low temperature regulation of the Arabidopsis CBF family of AP2 transcriptional activators as an early step in cold-induced COR gene expression. Plant J. 16, 433–442. doi: 10.1046/j.1365-313x.1998.00310.x
Giordano, C. R., and Terlecky, S. R. (2012). Peroxisomes, cell senescence, and rates of aging. Biochim. Biophys. Acta 1822, 1358–1362. doi: 10.1016/j.bbadis.2012.03.013
Gu, X., Jiang, D., Wang, Y., Bachmair, A., and He, Y. (2009). Repression of the floral transition via histone H2B monoubiquitination. Plant J. 57, 522–533. doi: 10.1111/j.1365-313x.2008.03709.x
Gu, X., Le, C., Wang, Y., Li, Z., Jiang, D., Wang, Y., et al. (2013). Arabidopsis FLC clade members form flowering-repressor complexes coordinating responses to endogenous and environmental cues. Nat. Commun. 4, 1947–1947.
Horan, K., Jang, C., Bailey-Serres, J., Mittler, R., Shelton, C., Harper, J. F., et al. (2008). Annotating genes of known and unknown function by large-scale coexpression analysis. Plant Physiol. 147, 41–57. doi: 10.1104/pp.108.117366
Hossain, M. A., Bhattacharjee, S., Armin, S. M., Qian, P., Xin, W., Li, H. Y., et al. (2015). Hydrogen peroxide priming modulates abiotic oxidative stress tolerance: insights from ROS detoxification and scavenging. Front. Plant Sci. 6:420. doi: 10.3389/fpls.2015.00420
Hruz, T., Laule, O., Szabo, G., Wessendorp, F., Bleuler, S., Oertle, L., et al. (2008). Genevestigator v3: a reference expression database for the meta-analysis of transcriptomes. Adv. Bioinformatics 2008:420747.
Hu, J., Baker, A., Bartel, B., Linka, N., Mullen, R. T., Reumann, S., et al. (2012). Plant peroxisomes: biogenesis and function. Plant Cell 24, 2279–2303. doi: 10.1105/tpc.112.096586
Huff, J. (2016). The fast mode for ZEISS LSM 880 with Airyscan: high-speed confocal imaging with super-resolution and improved signal-to-noise ratio. Nat. Methods 13, i–ii.
Ishibashi, Y., Yamaguchi, H., Yuasa, T., Iwaya-Inoue, M., Arima, S., and Zheng, S.-H. (2011). Hydrogen peroxide spraying alleviates drought stress in soybean plants. J. Plant Physiol. 168, 1562–1567. doi: 10.1016/j.jplph.2011.02.003
Jacob, P., Hirt, H., and Bendahmane, A. (2017). The heat-shock protein/chaperone network and multiple stress resistance. Plant Biotechnol. J. 15, 405–414. doi: 10.1111/pbi.12659
Jajic, I., Sarna, T., and Strzalka, K. (2015). Senescence, stress, and reactive oxygen species. Plants 4, 393–411. doi: 10.3390/plants4030393
Jefferson, R. A., Kavanagh, T. A., and Bevan, M. W. (1987). GUS fusions: beta-glucuronidase as a sensitive and versatile gene fusion marker in higher plants. EMBO J. 6, 3901–3907. doi: 10.1002/j.1460-2075.1987.tb02730.x
Jiang, Y., and Deyholos, M. K. (2009). Functional characterization of Arabidopsis NaCl-inducible WRKY25 and WRKY33 transcription factors in abiotic stresses. Plant Mol. Biol. 69, 91–105. doi: 10.1007/s11103-008-9408-3
Karimi, M., Inze, D., and Depicker, A. (2002). GATEWAY vectors for Agrobacterium-mediated plant transformation. Trends Plant Sci. 7, 193–195. doi: 10.1016/s1360-1385(02)02251-3
Khan, M. S., Khan, M. A., and Ahmad, D. (2016). Assessing utilization and environmental risks of important genes in plant abiotic stress tolerance. Front. Plant Sci. 7:792. doi: 10.3389/fpls.2016.00792
Kilian, J., Whitehead, D., Horak, J., Wanke, D., Weinl, S., Batistic, O., et al. (2007). The AtGenExpress global stress expression data set: protocols, evaluation and model data analysis of UV-B light, drought and cold stress responses. Plant J. 50, 347–363. doi: 10.1111/j.1365-313x.2007.03052.x
Kim, D. (2013). TopHat2: accurate alignment of transcriptomes in the presence of insertions, deletions and gene fusions. Genome Biol. 14:R36.
Kohli, S. K., Handa, N., Gautam, V., Bali, S., Sharma, A., Khanna, K., et al. (2017). “ROS signaling in plants under heavy metal stress,” in Reactive Oxygen Species and Antioxidant Systems in Plants: Role and Regulation under Abiotic Stress, eds M. I. R. Khan and N. A. Khan (Singapore: Springer), 185–214. doi: 10.1007/978-981-10-5254-5_8
Kollist, H., Zandalinas, S. I., Sengupta, S., Nuhkat, M., Kangasjärvi, J., and Mittler, R. (2018). Rapid responses to abiotic stress: priming the landscape for the signal transduction network. Trends Plant Sci. 24, 25–37. doi: 10.1016/j.tplants.2018.10.003
Kreps, J. A., Wu, Y., Chang, H. S., Zhu, T., Wang, X., and Harper, J. F. (2002). Transcriptome changes for Arabidopsis in response to salt, osmotic, and cold stress. Plant Physiol. 130, 2129–2141. doi: 10.1104/pp.008532
Lata, C., and Prasad, M. (2011). Role of DREBs in regulation of abiotic stress responses in plants. J. Exp. Bot. 62, 4731–4748. doi: 10.1093/jxb/err210
Lee, S. C., and Luan, S. (2012). ABA signal transduction at the crossroad of biotic and abiotic stress responses. Plant Cell Environ. 35, 53–60. doi: 10.1111/j.1365-3040.2011.02426.x
Luhua, S., Hegie, A., Suzuki, N., Shulaev, E., Luo, X., Cenariu, D., et al. (2013). Linking genes of unknown function with abiotic stress responses by high-throughput phenotype screening. Physiol. Plant. 148, 322–333. doi: 10.1111/ppl.12013
Mittler, R., Vanderauwera, S., Suzuki, N., Miller, G., Tognetti, V. B., Vandepoele, K., et al. (2011). ROS signaling: the new wave? Trends Plant Sci. 16, 300–309.
Murashige, T., and Skoog, F. (1962). A revised medium for rapid growth and bio assays with tobacco tissue cultures. Physiol. Plant. 15, 473–497. doi: 10.1111/j.1399-3054.1962.tb08052.x
Nelson, B. K., Cai, X., and Nebenfuhr, A. (2007). A multicolored set of in vivo organelle markers for co-localization studies in Arabidopsis and other plants. Plant J. 51, 1126–1136. doi: 10.1111/j.1365-313x.2007.03212.x
Niehaus, T. D., Thamm, A. M., de Crecy-Lagard, V., and Hanson, A. D. (2015). Proteins of unknown biochemical function: a persistent problem and a roadmap to help overcome it. Plant Physiol. 169, 1436–1442.
Novillo, F., Alonso, J. M., Ecker, J. R., and Salinas, J. (2004). CBF2/DREB1C is a negative regulator of CBF1/DREB1B and CBF3/DREB1A expression and plays a central role in stress tolerance in Arabidopsis. Proc. Natl. Acad. Sci. U.S.A. 101, 3985–3990. doi: 10.1073/pnas.0303029101
Ozaki, K., Uchida, A., Takabe, T., Shinagawa, F., Tanaka, Y., Takabe, T., et al. (2009). Enrichment of sugar content in melon fruits by hydrogen peroxide treatment. J. Plant Physiol. 166, 569–578. doi: 10.1016/j.jplph.2008.08.007
Pareek, A., Khurana, A., Sharma, A. K., and Kumar, R. (2017). An overview of signaling regulons during cold stress tolerance in plants. Curr. Genomics 18, 498–511.
Parkhomchuk, D., Borodina, T., Amstislavskiy, V., Banaru, M., Hallen, L., Krobitsch, S., et al. (2009). Transcriptome analysis by strand-specific sequencing of complementary DNA. Nucleic Acids Res. 37:e123. doi: 10.1093/nar/gkp596
Queval, G., Issakidis-Bourguet, E., Hoeberichts, F. A., Vandorpe, M., Gakiere, B., Vanacker, H., et al. (2007). Conditional oxidative stress responses in the Arabidopsis photorespiratory mutant cat2 demonstrate that redox state is a key modulator of daylength-dependent gene expression, and define photoperiod as a crucial factor in the regulation of H2O2-induced cell death. Plant J. 52, 640–657. doi: 10.1111/j.1365-313x.2007.03263.x
Ratcliffe, O. J., Kumimoto, R. W., Wong, B. J., and Riechmann, J. L. (2003). Analysis of the Arabidopsis MADS AFFECTING FLOWERING gene family: MAF2 prevents vernalization by short periods of cold. Plant Cell 15, 1159–1169. doi: 10.1105/tpc.009506
Rodríguez-Serrano, M., Romero-Puertas, M. C., Sanz-Fernández, M., Hu, J., and Sandalio, L. M. (2016). Peroxisomes extend peroxules in a fast response to stress via a reactive oxygen species-mediated induction of the peroxin PEX11a. Plant Physiol. 171, 1665–1674. doi: 10.1104/pp.16.00648
Rosenwasser, S., Rot, I., Sollner, E., Meyer, A. J., Smith, Y., Leviatan, N., et al. (2011). Organelles contribute differentially to reactive oxygen species-related events during extended darkness. Plant Physiol. 156, 185–201. doi: 10.1104/pp.110.169797
Sandalio, L. M., and Romero-Puertas, M. C. (2015). Peroxisomes sense and respond to environmental cues by regulating ROS and RNS signalling networks. Ann. Bot. 116, 475–485. doi: 10.1093/aob/mcv074
Sauer, M., Paciorek, T., Benkova, E., and Friml, J. (2006). Immunocytochemical techniques for whole-mount in situ protein localization in plants. Nat. Protoc. 1, 98–103. doi: 10.1038/nprot.2006.15
Scarpeci, T. E., Zanor, M. I., Mueller-Roeber, B., and Valle, E. M. (2013). Overexpression of AtWRKY30 enhances abiotic stress tolerance during early growth stages in Arabidopsis thaliana. Plant Mol. Biol. 83, 265–277. doi: 10.1007/s11103-013-0090-8
Scharf, K. D., Berberich, T., Ebersberger, I., and Nover, L. (2012). The plant heat stress transcription factor (Hsf) family: structure, function and evolution. Biochim. Biophys. Acta 1819, 104–119. doi: 10.1016/j.bbagrm.2011.10.002
Shinozaki, K., and Yamaguchi-Shinozaki, K. (2006). Gene networks involved in drought stress response and tolerance. J. Exp. Bot. 58, 221–227. doi: 10.1093/jxb/erl164
Shinozaki, K., Yamaguchi-Shinozaki, K., and Seki, M. (2003). Regulatory network of gene expression in the drought and cold stress responses. Curr. Opin. Plant Biol. 6, 410–417. doi: 10.1016/s1369-5266(03)00092-x
Sun, Y., Wang, H., Liu, S., and Peng, X. (2016). Exogenous application of hydrogen peroxide alleviates drought stress in cucumber seedlings. S. Afr. J. Bot. 106, 23–28. doi: 10.1016/j.sajb.2016.05.008
Tang, L., Cai, H., Ji, W., Luo, X., Wang, Z., Wu, J., et al. (2013). Overexpression of GsZFP1 enhances salt and drought tolerance in transgenic alfalfa (Medicago sativa L.). Plant Physiol. Biochem. 71, 22–30. doi: 10.1016/j.plaphy.2013.06.024
Trapnell, C., Williams, B. A., Pertea, G., Mortazavi, A., Kwan, G., van Baren, M. J., et al. (2010). Transcript assembly and quantification by RNA-Seq reveals unannotated transcripts and isoform switching during cell differentiation. Nat. Biotechnol. 28, 511–515. doi: 10.1038/nbt.1621
Wang, H., Wang, C., Liu, H., Tang, R., and Zhang, H. (2011). An efficient Agrobacterium-mediated transformation and regeneration system for leaf explants of two elite aspen hybrid clones Populus alba x P. berolinensis and Populus davidiana x P. bolleana. Plant Cell Rep. 30, 2037–2044. doi: 10.1007/s00299-011-1111-1
Wang, H., Wang, H., Shao, H., and Tang, X. (2016). Recent advances in utilizing transcription factors to improve plant abiotic stress tolerance by transgenic technology. Front. Plant Sci. 7:67. doi: 10.3389/fpls.2016.00067
Waszczak, C., Carmody, M., and Kangasjarvi, J. (2018). Reactive oxygen species in plant signaling. Annu. Rev. Plant Biol. 69, 209–236.
Xiao, C., Chen, F., Yu, X., Lin, C., and Fu, Y. F. (2009). Over-expression of an AT-hook gene, AHL22, delays flowering and inhibits the elongation of the hypocotyl in Arabidopsis thaliana. Plant Mol. Biol. 71, 39–50. doi: 10.1007/s11103-009-9507-9
Yuan, J. S., Reed, A., Chen, F., and Stewart, C. N. (2006). Statistical analysis of real-time PCR data. BMC Bioinformatics 7:85. doi: 10.1186/1471-2105-7-85
Yun, J., Kim, Y. S., Jung, J. H., Seo, P. J., and Park, C. M. (2012). The AT-hook motif-containing protein AHL22 regulates flowering initiation by modifying FLOWERING LOCUS T chromatin in Arabidopsis. J. Biol. Chem. 287, 15307–15316. doi: 10.1074/jbc.m111.318477
Zhu, J. K. (2016). Abiotic stress signaling and responses in plants. Cell 167, 313–324. doi: 10.1016/j.cell.2016.08.029
Zhu, Q., Dugardeyn, J., Zhang, C., Muhlenbock, P., Eastmond, P. J., Valcke, R., et al. (2013). The Arabidopsis thaliana RNA editing factor SLO2, which affects the mitochondrial electron transport chain, participates in multiple stress and hormone responses. Mol. Plant 7, 290–310. doi: 10.1093/mp/sst102
Zhu, Q., Dugardeyn, J., Zhang, C., Takenaka, M., Kühn, K., Craddock, C., et al. (2012). SLO2, a mitochondrial pentatricopeptide repeat protein affecting several RNA editing sites, is required for energy metabolism. Plant J. 71, 836–849. doi: 10.1111/j.1365-313x.2012.05036.x
Keywords: abiotic stress, peroxisome, ROS, poplar, Arabidopsis, morphological alternations
Citation: Cai C, Wang W, Ye S, Zhang Z, Ding W, Xiang M, Wu C and Zhu Q (2020) Overexpression of a Novel Arabidopsis Gene SUPA Leads to Various Morphological and Abiotic Stress Tolerance Alternations in Arabidopsis and Poplar. Front. Plant Sci. 11:560985. doi: 10.3389/fpls.2020.560985
Received: 11 May 2020; Accepted: 21 October 2020;
Published: 12 November 2020.
Edited by:
Eric Ruelland, UMR 7618 Institut d’Écologie et des Sciences de l’Environnement de Paris (IEES), FranceReviewed by:
Marie-Noëlle Vaultier, Université de Lorraine, FranceTetiana Kalachova, Laboratory of Pathological Plant Physiology, Institute of Experimental Botany (ASCR), Czechia
Copyright © 2020 Cai, Wang, Ye, Zhang, Ding, Xiang, Wu and Zhu. This is an open-access article distributed under the terms of the Creative Commons Attribution License (CC BY). The use, distribution or reproduction in other forums is permitted, provided the original author(s) and the copyright owner(s) are credited and that the original publication in this journal is cited, in accordance with accepted academic practice. No use, distribution or reproduction is permitted which does not comply with these terms.
*Correspondence: Qiang Zhu, emh1cWlhbmdAZmFmdS5lZHUuY24=
†These authors have contributed equally to this work