 Yuanyi Hu1,2†
 Bigang Mao1,3†Yumei Xia1,3†Yan Peng1,4Dan Zhang1Li Tang1Ye Shao1,4Yaokui Li1,4Bingran Zhao1,3,4*
- 1State Key Laboratory of Hybrid Rice, Hunan Hybrid Rice Research Center, Changsha, China
- 2Molecular Breeding Laboratory, National Innovation Center of Saline-Alkali Tolerant Rice in Sanya, Sanya, China
- 3Long Ping Branch, Graduate School of Hunan University, Changsha, China
- 4College of Agricultural, Hunan Agricultural University, Changsha, China
Genetic diversities or favorable genes within distantly related species are the important resources for crop genetic improvement and germplasm innovation. Spike-Stalk injection method (SSI) has long been applied in rice genetic improvement by directly introducing genetic materials from non-mating donor species, while its inheritance patterns and the underlying mechanisms are poorly elucidated. In this study, a rice variant ERV1 with improved yield-related traits was screened out in the way of introducing genomic DNA of Oryza eichingeri (2n=24, CC genome) into RH78 (Oryza sativa L. 2n=24, AA genome) using SSI method. Genome-wide comparison revealed that the genomic heterozygosity of ERV1 was approximately 8-fold higher than RH78. Restriction-site associated DNA sequencing technology (RAD-seq) and association analysis of the ERV1 inbred F2 population identified 5 quantitative trait loci (QTLs) regions responsible for these yield-related traits, and found that genomic heterozygosity of ERV1 inbred lines was significantly lower than ERV1, while spontaneous mutation rate of the ERV1 inbred lines was significantly higher than ERV1. Our results preliminarily uncovered the inheritance patterns of SSI variant rice, and the potential genomic regions for traits changes, which yielded novel insights into the mechanisms of SSI method, and may accelerate our understanding of plant genome evolution, domestication, and speciation in nature.
Introduction
Rice (Oryza sativa L.) is one of the most important food crops in the world, providing 21% of the total calorie intake of the global population and up to 76% of calorie intake in Southeast Asia(Fitzgerald et al., 2009; Chen, 2010). Increasing rice yield is therefore of great importance to global food security. Two breakthroughs in rice yield that led to major increases in rice productivity over the last century (Yuan and Virnani, 1989) include the application of semi-dwarf rice varieties in the 1950s–1960s (Peng, 1994; Ashikari et al., 2005), and the development of Three-line and Two-line hybrid rice (Zhou et al., 2012; Chen and Liu, 2014), which were commercially developed in the 1970s and 1990s, respectively. These breakthroughs were mainly due to the discovery and application of new genes or novel alleles from wild rice species (Brar and Khush, 1997; Zhao et al., 2007). Genetic diversities or favorable genes from distantly related species are therefore crucial for genetic improvement and germplasm innovation in rice, and can help guarantee the sustained growth of rice yield in the future (Gill et al., 2011).
Transferring genetic materials from wild relatives of rice into modern cultivated rice is a promising way to use genetic information and favorable genes (Zamir, 2001; Wang et al., 2017). In the genus Oryza, the wild species can be used to genetically improve rice because they have abundant genetic variation with many agronomical useful genes (Chen, 2010; Jena, 2010). Generally, researchers have relied on distant hybridization to introduce “exotic” allelic diversity, or on genetic engineering to introduce “foreign” genes (Zhou et al., 1983; Zhao et al., 2005) from wild rice. Over the last few decades, several genes, or QTLs controlling traits of economic importance, such as cytoplasmic male sterility (CMS), yield-related QTLs, resistance of bacterial leaf blight, blast and brown plant-hopper, have been tagged or cloned (Wang et al., 2005), and transferred from wild rice into elite rice cultivars by means of distant hybridization and genetic engineering. However, several incompatibility barriers such as low crossability, linkage drag, and limited recombination between chromosomes of wild and cultivated species limit the application of distant hybridization. The limited number of cloned genes or QTLs controlling traits of economic importance, and the security of genetically modified food also hampered the development and large-scale application of genetic engineering.
In the past three decades, a large number of new crop germplasms with improved characteristics in yield, plant type, grain quality, and stress tolerance have been created in China (Hu et al., 2014; Peng et al., 2016), benefiting from a widely used series of methods called Exogenous DNA Transfer (EDT) methods, mainly including pollen tube pathway method (Zhou et al., 1983; Wang et al., 2005), seed immersion method (Luo and Wu, 1989), and the Spike-Stalk Injection method (de la Peña et al., 1987; Zhao et al., 2007). Researchers previously proved that genomic DNA of wild species could be introduced into the rice panicle at the differentiation stage, the ovary at the meiosis stage, or into dry seeds at the water absorbency stage (Zhao et al., 2007). Zhao et al. (2005) analyzed a genetically stable variant, YVB, that was developed from a mutant of V20B (a rice maintainer line) through transformation of genomic DNA of wild rice (Oryza minuta). They found high DNA polymorphisms between YVB and V20B, and preliminary confirmed the integration of special DNA fragment from O. minuta in YVB genome. Meanwhile, they identified the genes responsible for the trait changes in YVB relative to V20B, and revealed that allelic variation might be the main factor contributing to the abundant phenotypic changes of this variant (Peng et al., 2016). However, the possible molecular mechanisms underlying trans-species transfer of genetic information, especially genome-wide genetic variation and inheritance of variants in the early generations compared to the recipients, are poorly elucidated.
Comparative genomic analyses among closely related species have allowed for insight into plant gene and genome evolution (Bennetzen, 2007; Paterson et al., 2010). For instance, studies of yeast, Drosophila, and human genomes have revealed mechanisms of gene and genome evolution in fungi and animals (Scannell et al., 2006; Clark et al., 2007). Meanwhile, comparison of O. nivara, O. glaberrima, O. barthii, O. glumaepatula, and O. meridionalis genomes unveiled how morphological and reproductive diversity have arisen in specific lineages as a result of expansions or contractions of gene families, providing more evidence for the processes of adaptation and speciation (Zhang et al., 2014). However, current comparative genomic analyses mainly focus on the comparison between different varieties, or between closely related species of flowering plants; few are carried out to query the fundamental rules of inheritance from the parent to the offspring by means of horizontal and/or vertical transmission, especially in the early generations.
In this study, we conducted whole-genome sequencing and comparative genomic analysis of ERV1, an original variant with greatly improved yield traits, and an inbred ERV1 population. ERV1 was derived from an indica variety RH78 by transferring genomic DNA of O. eichingeri to the recipient rice RH78 through the SSI method. Our results would accelerate the process for unveiling the possible mechanisms underlying SSI method, and may enhance our understanding of plant genome evolution, domestication, and speciation in nature.
Materials and Methods
Spike-Stalk Injection Method
SSI method is a modified technique based on the procedure invented by Pena (de la Peña et al., 1987). To perform the technique, we waited until recipient rice had just undergone meiosis (up to 2–4 days after meiosis) and selected spikes that had a distance of 1–5 cm from the petiole of the flag leaf to the top of the 2nd leaf. Part of the leaf sheath of the top 3rd leaf was removed, and the uppermost internode was exposed. Donor DNA (50–100 μl) at a concentration of about 500 ng/μl was mixed with 0.2×SSC solution, and 0.02 M CaCl2 solution was then injected into the internode with a microsyringe at an inclined angle of about 30–45°. The injected spike was immediately bagged with parchment (to avoid the pollution of exogenous pollen) until harvest. The harvested seeds were planted uniparted. From initial heading stage to the maturity stage, rice plants with significant trait differences from recipient rice were considered variant rice.
Plant Materials and Traits Measurement
The variant ERV1 was discovered in the experimental field of the Hunan Hybrid Rice Research Center, Changsha, in September 2013. The recipient rice RH78 was planted in the same field at the same time, and with the same management to compare agronomic traits. ERV1 was selfed to generate the F2 selfing population. ERV1, five mature plants of RH78, and 216 ERV1 inbred F2 lines were sampled to determine mean values of yield characters, including heading stage (HS), flag leaf length (FLL), flag leaf width (FLW), plant height (PH), effective tiller number (TN), main panicle length (PL), spikelet per panicle (SP), seed setting rate (SSR), and 100-grain weight (GW). HS refers to the time from seed sowing to first-earing phase. FLL and FLW represent the maximum length and width of the flag leaf measured by an electronic digital caliper. PH refers to the distance from the ground to the highest point of one plant. TN is the number of tillers that can develop mature panicles. SP is the spikelet number of the main panicle. SSR is the number of filled grains divided by the spikelet number of the main panicle. GW refers to the weight of 100 filled grains of the main panicle. Student’s t-tests were used for all trait data of ERV1 and RH78 to identify significant differences.
DNA Extraction and Genome Sequencing
Genomic DNA of ERV1, RH78, and 216 ERV1 inbred F2 lines were extracted following the standard procedure of a PureLink™ Genomic Plant DNA Purification Kit (Invitrogen). For genome re-sequencing, the genomic DNA of RH78 and ERV1 were extracted, and then fragmented randomly. The DNA fragments of desired length (500 base pairs) were visualized with agarose gel electrophoresis, adapter primers were added to generate DNA clusters, and DNA clusters were subjected to HiSeq 2000 paired-end sequencing. For RAD-seq of ERV1 inbred F2 lines, the genomic DNA of each of the 216 inbred lines was digested with the TaqI restriction endonuclease, and DNA fragments between the sizes of 300 and 700 bp were isolated with agarose gel electrophoresis. Adapters were ligated to the isolated DNA fragments for cluster preparation, and then subjected to the HiSeq 2000 platform for 100 base paired-end sequencing (Davey et al., 2011).
Bioinformatics Analysis Process for Re-Sequencing
The raw data generated by the HiSeq 2000 sequencer was subjected to a series of filters to generate a high-quality data set (Huang et al., 2009; Gu et al., 2013). The high-quality data was then aligned to the Nipponbare genome (allowing three mismatches) in silico using the SOAPaligner software (Yu et al., 2001; Ouyang et al., 2005). Sequencing coverage and depth of each sample were calculated based on the alignment result. Based on the consensus sequence between the reference and each of the sequenced samples, single nucleotide polymorphisms (SNPs) in ERV1, RH78, and each of the ERV1 F2 inbred lines relative to the Nipponbare genome were identified using the SOAPsnp software with the following filtering steps: mapping quality > 20; coverage depth between 1 and 300; distance of adjacent variation > 5 bp; and copy number < 2. According to the filtered SNPs set, SNPs between ERV1 and RH78 were further identified with the following filter steps: target mapping quality > 20; the sequencing depth of homologous site should be > 2; and the sequencing depth of heterozygous sites should be > 6. The final SNP set was then annotated according to the reference genome sequence of the japonica cultivar Nipponbare.
Bioinformatics Analysis Process for RAD-Seq
The sequencing reads from each line were obtained according to the sequence tag, and then mapped to the Nipponbare genome sequence for alignment using the SOAPaligner software (Gu et al., 2013). The results of SOAP alignment were then transformed and subjected to SAMtools (Li et al., 2009) to generate the input files suitable for realSFS software (version 0.983). Nucleotide sites with the likelihood of a genotype for each line with a probability higher than 0.95 and a total population depth higher than 40 were extracted as candidate SNPs. The recombination breakpoints of the F2 population were then identified according to the method developed by the research group of Huang et al. (2009) with some modification (Duan et al., 2013). The Bin map of each line was constructed using a PERL script, and QTLs were identified by composite interval mapping using MapQTL5 software.
Estimate of Genomic Heterozygosity and Spontaneous Mutation Rate
Mutation sites in ERV1 refer to the genotype in ERV1 that was different from the genotype of RH78. For example, if the genotype of RH78 was A, and ERV1 was homologous G, or C, or T, this genotype was defined as a homologous SNP; if the ERV1 was heterozygous A/G, A/C, A/T, this genotype was defined as a heterozygous SNP; if the genotype of ERV1 was T/C, or T/G, or C/G, we defined it as a mutation SNP. The genomic heterozygosity was calculated as the number of heterozygous SNPs divided by the length of covered bases for the sequencing sample. One site where the genotype of >20 F2 line was not identical to the genotype of RH78 and/or ERV1 was defined as a spontaneous mutation. The spontaneous mutation rate of the ERV1 inbred line was calculated as the number of spontaneous mutations (>20 lines) in the F2 population divided by the length of covered bases for the sequencing sample.
Results
Trait Comparison Between ERV1 and RH78
A large proportion of traits in ERV1 were the intermediate forms between the recipient RH78, and the donor O. eichingeri. This made ERV1 seems to be a hybrid F1 cross between RH78 and O. eichingeri (Figure 1A). We surveyed the main agronomic characters of RH78 and ERV1 in the mature stage and found that ERV1 had higher PH (Figure 1B), longer inflorescence length (Figure 1C), longer and wider flag leaves (Figures 1D, E), larger panicles (Figure 1F), and a higher SSR (Figure 1G) compared to RH78. The spikelet number and SSR of ERV1 were significantly higher than RH78, while the TN and GW of ERV1 were almost equal to RH78 (Table S1), meaning that ERV1 has a higher yield potential in breeding practice.
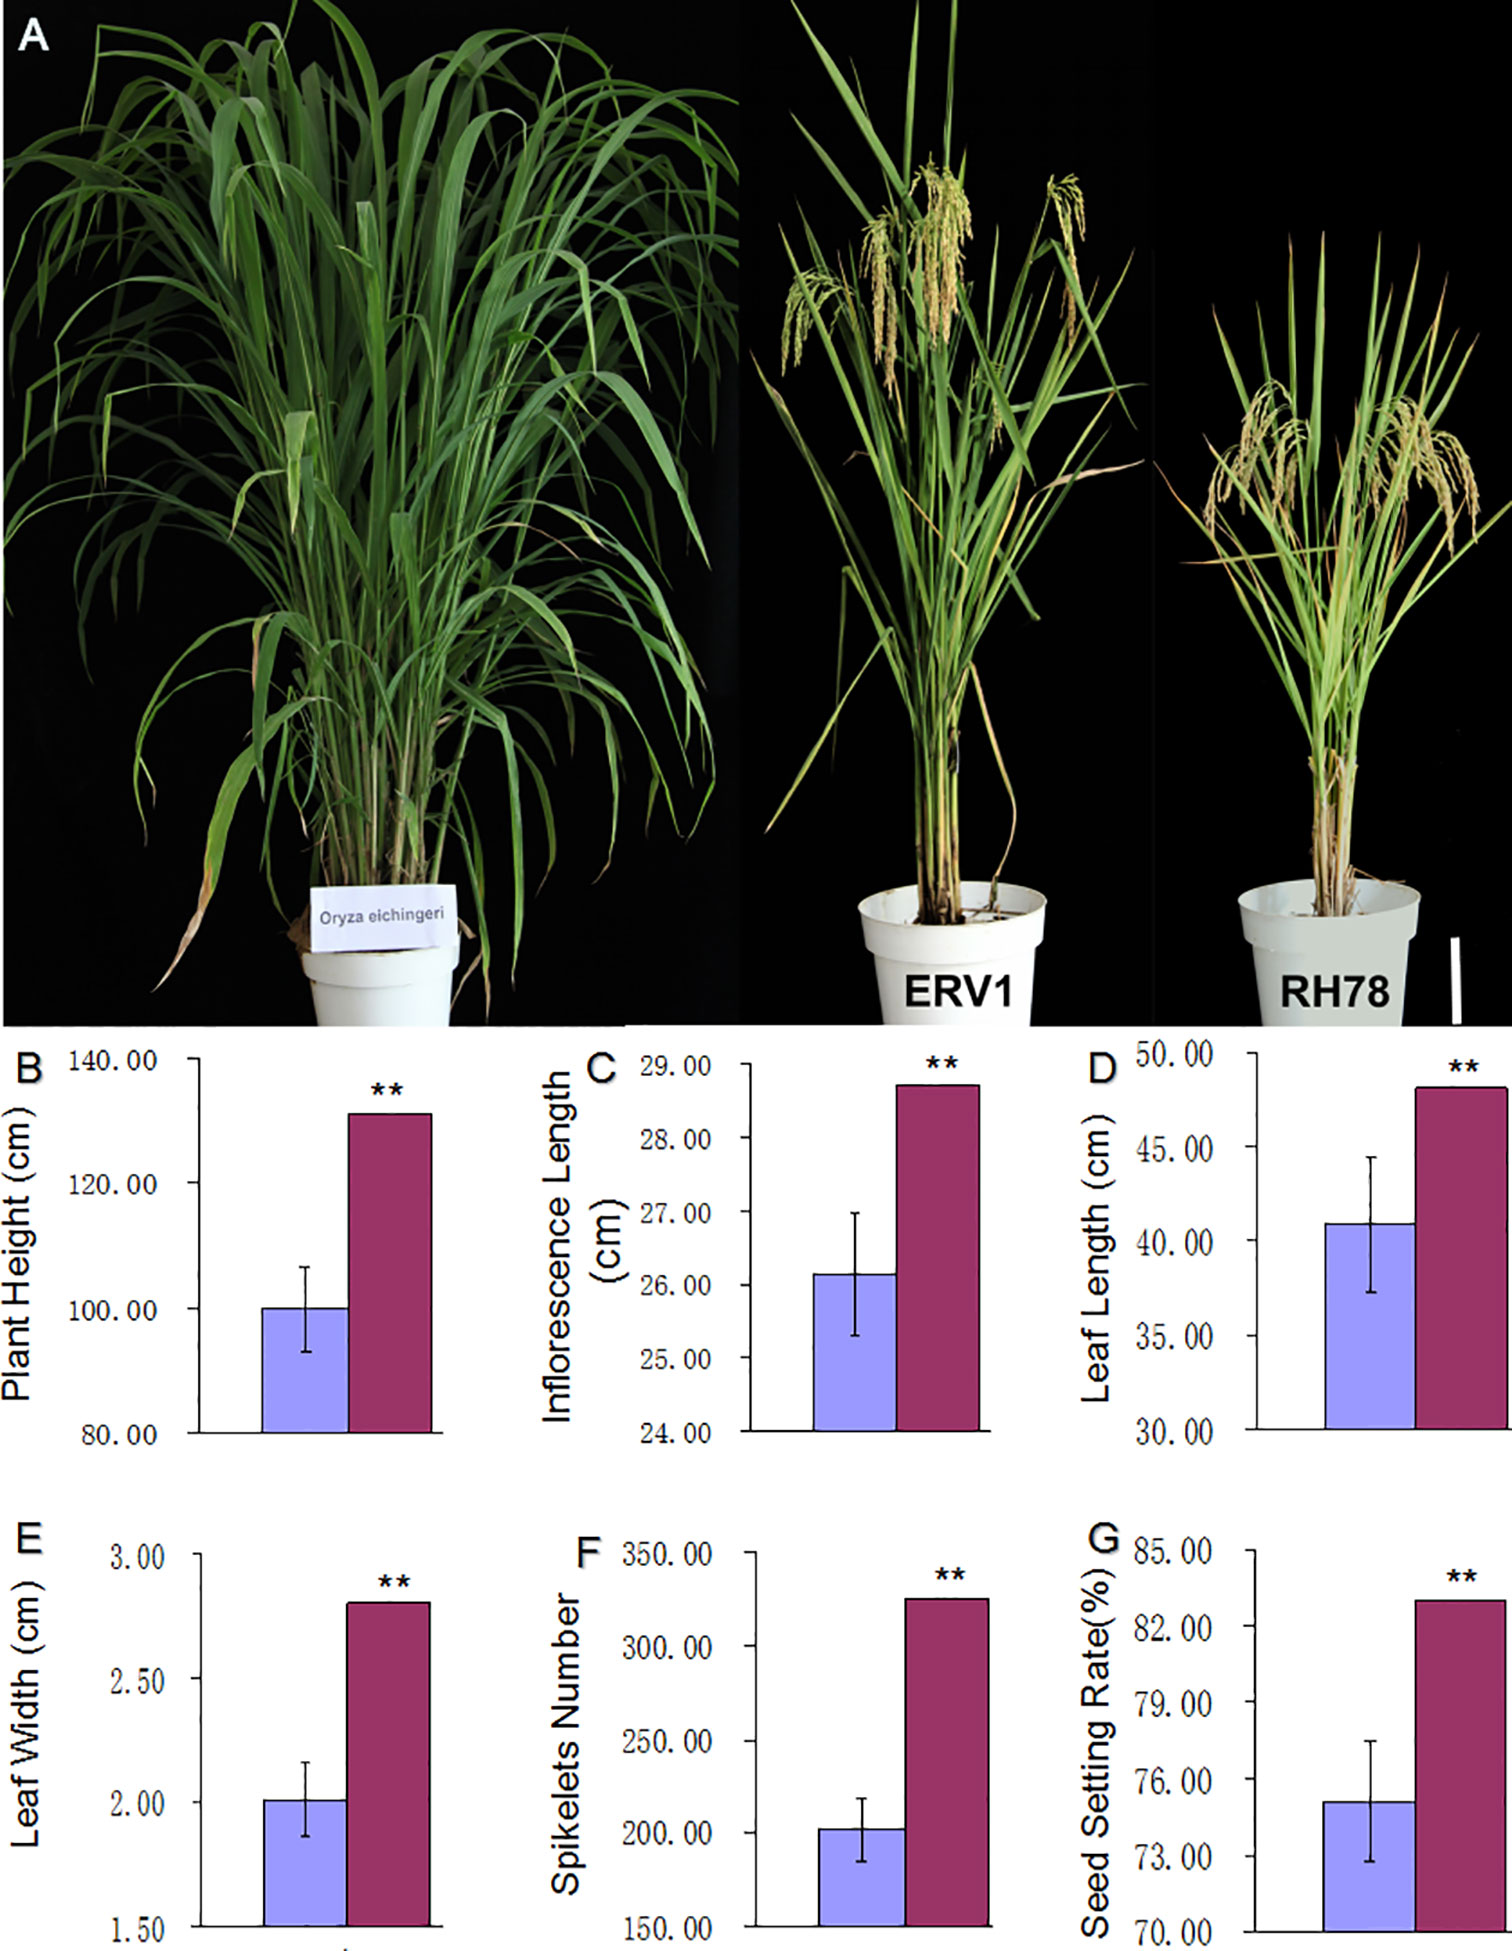
Figure 1 Trait comparison of ERV1 and RH78. (A) Plant phenotype of the donor rice O. eichingeri (left), the recipient rice RH78 (right), and the variant rice ERV1 (middle), the white bar = 20 cm. (B–G) is the comparison of main agronomic characters of RH78 and ERV1 in the mature stage; (B) plant height, (C) inflorescence length, (D) flag leaf length, (E) flag leave width, (F) spikelet number, and (G) seed setting rate. The main agronomic characters of RH78 and ERV1 were compared and analyzed by one-way ANOVA method, and the symbol “**” indicate significant difference detected by LSD tests at P < 0.01.
Genome Sequencing of ERV1 and RH78
Using Illumina sequencing technology with a whole-genome shotgun sequencing approach, a total of 11.4 and 10.2 G bases (Gb) of raw sequencing data were generated for ERV1 and RH78, respectively (Raw sequence data of ERV1 and RH78 have been deposited in the NCBI Short Read Archive with access number SRA7923627). After a series of corrections and filters, 10.81 Gb and 10.10 Gb clean data for ERV1 and RH78, respectively, were retained for downstream analysis. The clean data were then aligned to the Nipponbare genome, a high-quality rice reference genome with an effective genome size of 372,317,567 base pairs (bp), for whole-genome comparison using the SOAPaligner software algorithm (SOAP2, version 2.20). The ERV1 and RH78 clean data covered 312,397,330 bp (83.66%) and 303,082,602 bp (81.06%) of the Nipponbare reference genome, providing an effective sequencing depth of 29.03-fold for ERV1 and 27.14-fold for RH78 (Table 1).
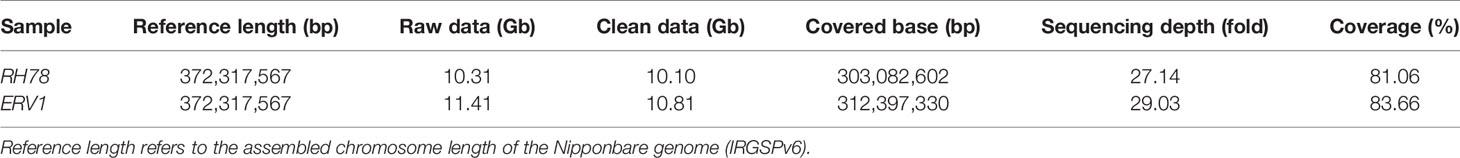
Table 1 Statistics of the sequencing data of ERV1 and RH78.
Identification and Annotation of SNPs
The wide genomic coverage and high sequencing depth of ERV1 and RH78 sequencing data were considered suitable for use in the identification of single nucleotide polymorphisms (SNPs). After a series of corrections and filtering steps, a total of 1,397,635 SNPs, including 1,257,597 homozygous SNPs (homo-SNPs), and 101,822 heterozygous SNPs (hetero-SNPs) were detected in RH78 compared to Nipponbare genome sequence. Hetero-SNPs accounted for 7.29% of the total SNPs, and the genomic heterozygosity of RH78 genome was 3.36 × 10⁻⁴ (Table S2). For ERV1, 1,898,506 SNPs, including 1,087,532 homo-SNPs and 810,974 hetero-SNPs were identified relative to Nipponbare genome. The proportion of hetero-SNPs was 42.72% of the total SNPs, and the genomic heterozygosity of ERV1 was as high as 25.96 × 10⁻⁴ (Table S3), approximately 8-fold higher than that of RH78.
The distribution patterns of SNPs in ERV1 and RH78 genomes were presented using the SNP density, which was calculated as the total number of SNPs divided by the total covered bases in each chromosome. The average total SNP density across the whole genome was 4.65 SNPs/kb in the RH78 genome (Table S2), slightly lower than 6.15 SNPs/kb in the ERV1 genome (Table S3). While, the density of hetero-SNPs in ERV1 (2.64 hetero-SNPs/kb) was much higher than that in RH78 (0.34 hetero-SNPs/kb). At the chromosome level, the highest density of total SNPs and homo-SNPs was identified in chromosome 11 for both RH78 and ERV1, and the lowest in chromosome 5 for RH78 and chromosome 4 for ERV1. The highest density of hetero-SNPs was discovered in chromosome 11 for RH78, but in chromosome 12 for ERV1, and the lowest in chromosome 1 for RH78 and chromosome 11 for ERV1 (Figure 2). To answer whether these SNPs in ERV1 came from O. eichingeri, 2 DNA fragments (less than 1000 bp) in each chromosome of Nipponbare genome that were simultaneous covered by the sequencing reads of RH78, ERV1, and O. eichingeri were randomly selected, but only 6 DNA fragments were simultaneous amplified in RH78, ERV1, and O. eichingeri using PCR amplification method (Figure 3A), of which only one DNA fragment was sequenced with good quality. Comparing the sequencing data of this DNA fragment among RH78, ERV1, and O. eichingeri found that 3 heterozygous SNPs in ERV1 relative to RH78 were totally identical to O. eichingeri (Figure 3B), which partially proved that these SNPs in ERV1 came from O. eichingeri. However, more experiments are needed.
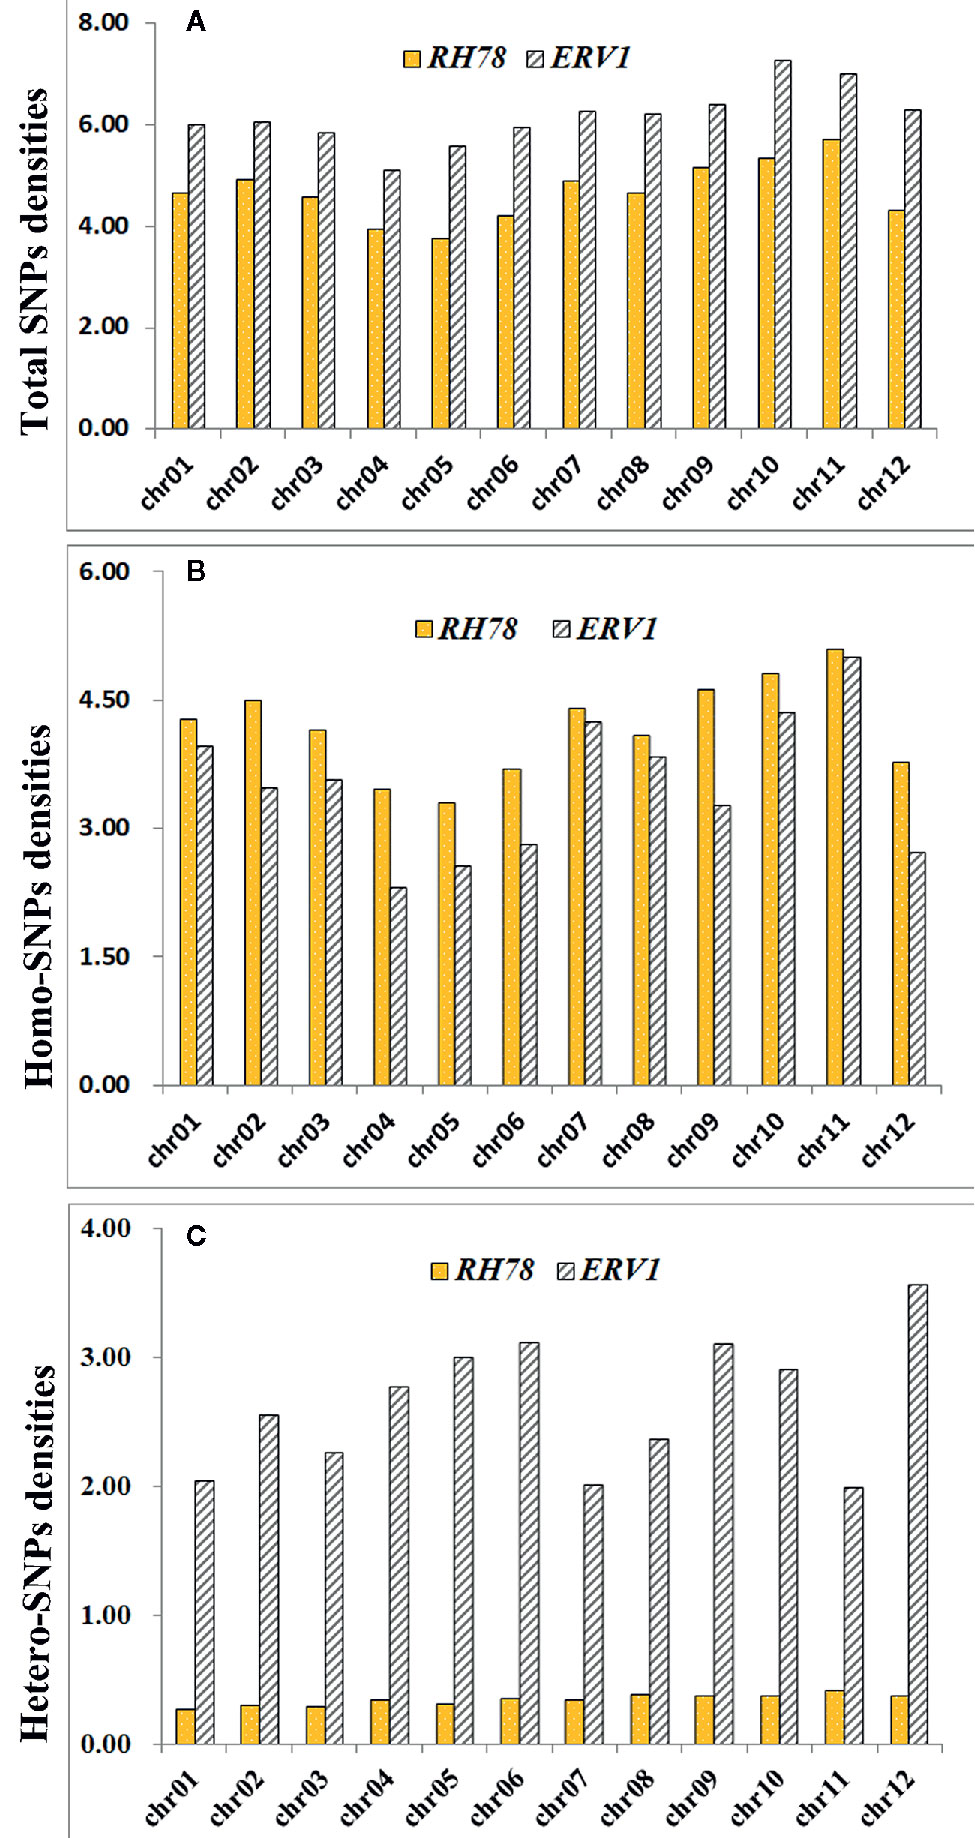
Figure 2 Distribution of single nucleotide polymorphism (SNP) densities of ERV1 and RH78 compared to the Nipponbare genome in all chromosomes. (A) Total SNPs densities of RH78 (yellow bars) and ERV1 (gray bars) in 12 chromosomes; (B) homo-SNPs densities of RH78 (yellow bars) and ERV1 (gray bars) in 12 chromosomes; (C) hetero-SNPs densities of RH78 (yellow bars) and ERV1 (gray bars) in 12 chromosomes. All horizontal axes of (A–C) represent the chromosome number, and the vertical axes of (A–C) represent the SNP densities on each chromosome.
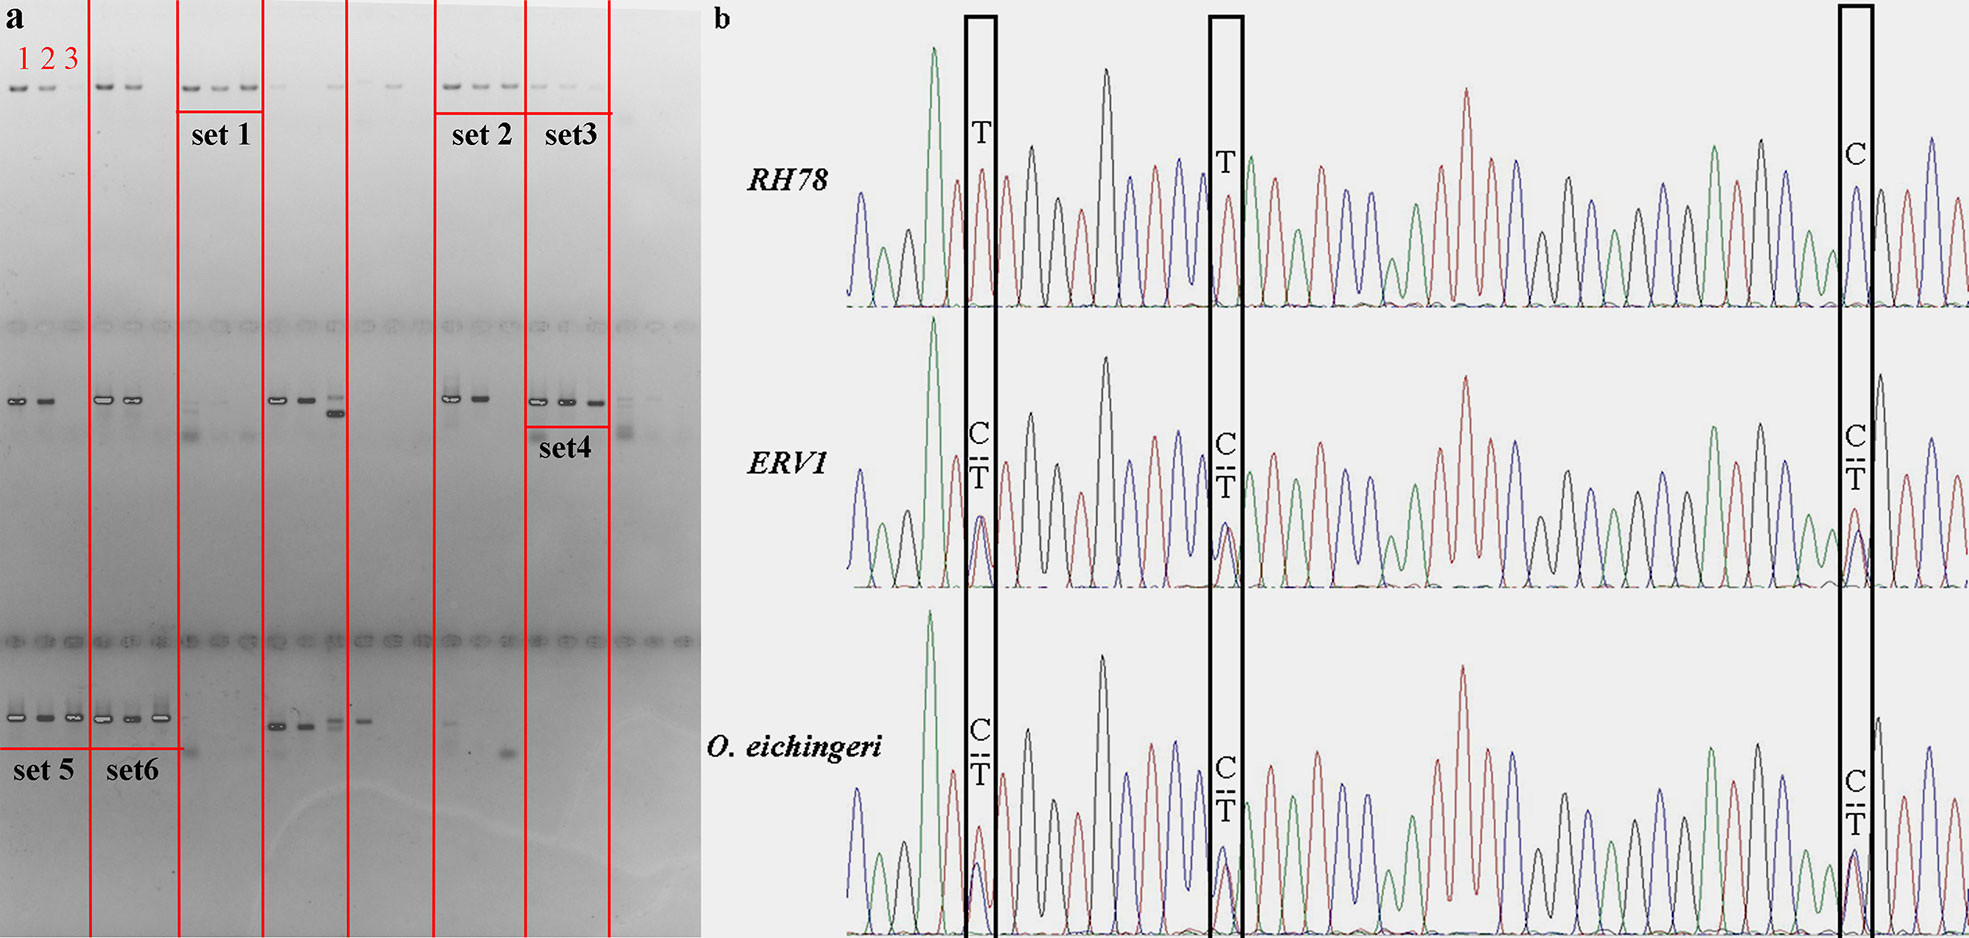
Figure 3 PCR amplification, Sanger sequencing and comparison of the homologous sequences among RH78, ERV1, and O. eichingeri. (A) PCR amplification of 24 randomly selected DNA fragments in RH78, ERV1, and O. eichingeri. The PCR bands in each set were presented with the same order as number 1 for RH78, number 2 for ERV1 and number 3 for O. eichingeri. The 6 DNA fragments that were simultaneous amplified in RH78, ERV1 and O. eichingeri were noted as set1, set2, set3, set4, set5, and set6, and only PCR products of set4 were sequenced with good quality. (B) Result of Sanger sequencing and comparison of the set4 sequences. The single nucleotide polymorphisms (SNPs) or mutations among RH78, ERV1, and O. eichingeri were labeled with black boxes.
The genome-wide SNPs in ERV1 compared to RH78 were filtered out from the SNP data mentioned above. A total of 455,244 SNPs were identified in ERV1, of which 98.79% (449,726) SNPs were heterozygous (Figure S1); only 5,518 (1.21%) SNPs were homozygous (Table 2). The hetero-SNPs in ERV1 were annotated according to the reference genome sequence of japonica cultivar Nipponbare because they were a very high proportion (98.79%) out of the total SNPs. After filtering, a total of 14,955 Non-synonymous hetero-SNPs (Ns-hetero-SNPs) that might affect the expression and function of the allele were identified in 7,325 genes (Table S4), of which 94.67% (6,934) genes had less than 5 Ns-hetero-SNPs. These genes were then functionally annotated using gene ontology (GO) classification (http://www.geneontology.org) and were categorized into 39 functional groups based on sequence homology. In each of the three main categories (biological process, molecular function, and cellular component) of the GO classification, there were 19, 11, and 9 functional groups, respectively (Figure 4).
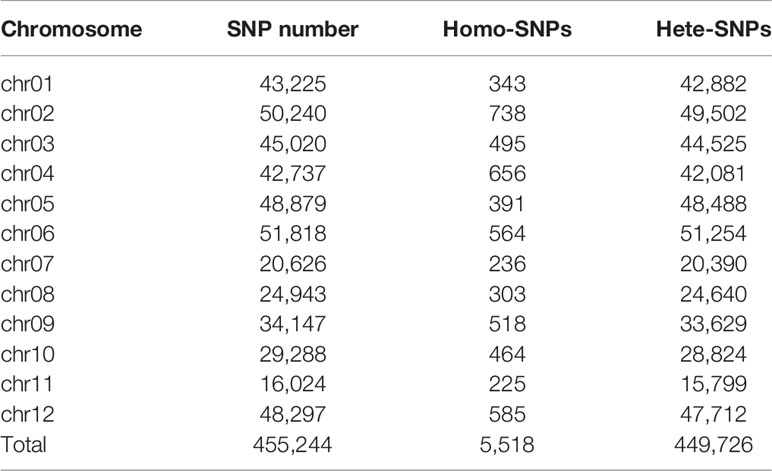
Table 2 Statistics of single nucleotide polymorphisms (SNPs) in ERV1 relative to RH78.
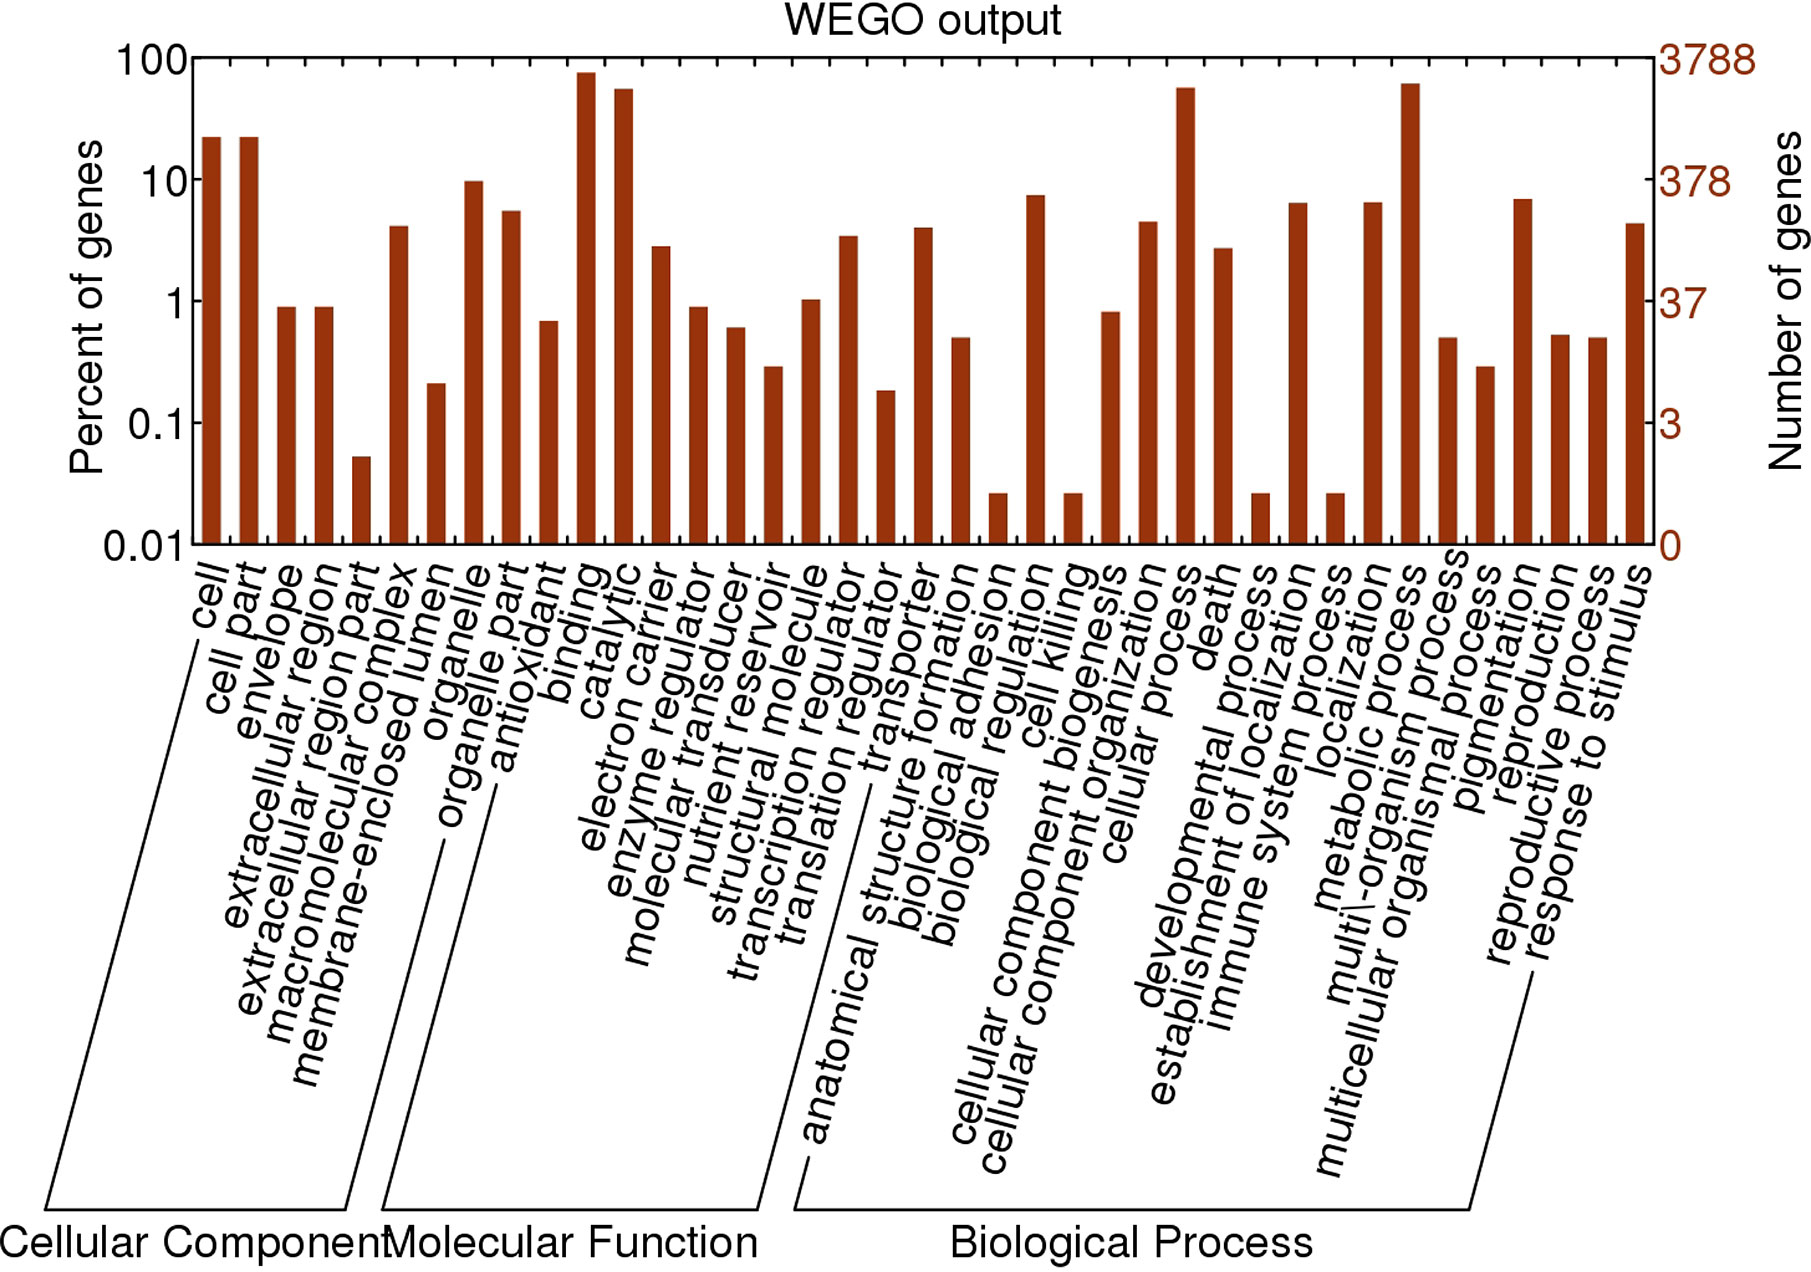
Figure 4 Gene Ontology (GO) classification of the genes affected by Non-synonymous hetero-SNPs in ERV1 compared to RH78. The horizontal axis represents the GO items, including cellular component, molecular function, and biological process. The left vertical axis represents the percent of genes affected by Non-synonymous hetero-SNPs of the corresponding GO item, and the right vertical axis represents the number of genes affected by Non-synonymous hetero-SNPs of the corresponding GO item.
Sequencing and Association Analysis of the ERV1 Inbred F2 Population
Restriction-site associated DNA sequencing technology (RAD-seq) was carried out on the ERV1 inbred F2 population. The RAD-seq data were then used to construct a genetic linkage map with high-density SNPs for use in association analysis exploring genotype-phenotype relationships at the whole-genome level.
RAD-seq libraries of 216 ERV1 F2 inbred lines were constructed, yielding approximately 30.85 Gb raw sequencing data (Table S5, Raw sequence data of ERV1 F2 inbred lines have been deposited in the NCBI Short Read Archive with access number SRA7923627), and providing an average sequencing coverage of 5.97%, and a mean sequencing depth of 3.23-fold for each F2 line. After manual filtration, a total of 32,644 population SNPs were selected for the F2 inbred population (Table 3). The distribution of the population SNPs along the chromosomes was uneven, with high-density and low-density regions (Figure S2). The genotype and bin information of each line of the F2 population was identified according to the recombination breakpoints. Using Joinmap 4.1 software, a total of 1,465 bins were used to construct the genetic map (Table 3). The size of the genetic map was 1489.7 centimorgans (Figure S3).
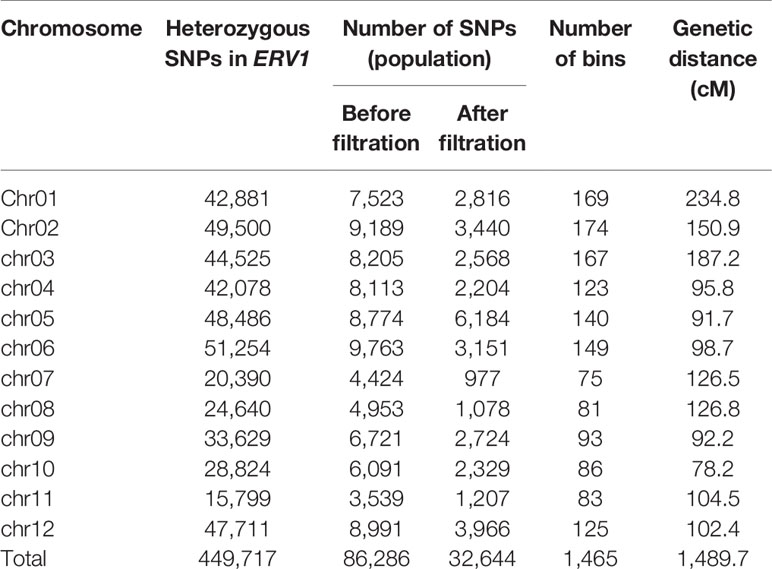
Table 3 Single nucleotide polymorphisms (SNPs) used for genotyping and bin number and genetic distance on 12 rice chromosomes for the F2 population.
According to the genetic map and the phenotypic data of the F2 population (Table S6), gene mapping of the 9 yield-related traits was carried out in QTLcartographer software using the composite interval mapping method. A total of 5 QTLs were detected (Table 4). The numbers of QTLs, as well as their contributions to phenotypic variance are summarized in Table 4. One QTL region, located at bin22, had an LOD value of 4.1, explained 8.4% of the PH variation, and was detected on chromosome 1. One QTL for PL was discovered on chromosome 2; it had a LOD score of 3.55 and explained 7.3% of the phenotypic variation. One QTL for GW was identified on chromosome 4, located at bin 525, had a LOD score of 3.55, and explained 7.3% of the phenotypic variation. Two QTLs for TN were discovered on chromosome 2, and 11, separately. The first QTL was located at bin260, had an LOD score of 3.9, and explained 8% of the phenotypic variation; the other QTL for TN was located at bin1207, had an LOD score of 3.53, and explained 6.8% of the phenotypic variation.
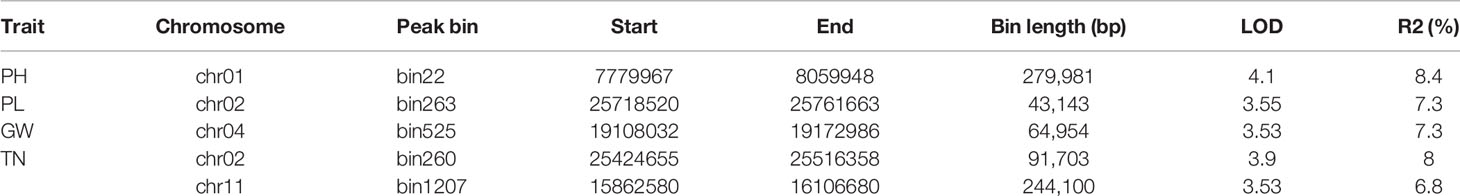
Table 4 Summary of quantitative trait loci (QTL) information of all traits.
Genomic Heterozygosity and Spontaneous M in the ERV1 Inbred F2 Lines
RAD-seq data of the ERV1 inbred F2 population provided us the opportunity for detailed analysis of the genomic condition of each F2 line. We first analyzed the ratio of homo-SNPs out of total population SNPs for each ERV1 inbred F2 line. After manual filtering, the genotypes of 135 F2 lines were estimated (Table S7). The average proportion of homo-SNPs was 83.49% of the total SNPs, much higher than the theoretical value of 75%; 3.7% (n=5) F2 lines ranged from 63.99%–70%, 26.67% (n=36) ranged from 70%–80%, 49.63% (n=67) ranged from 80%–90%, and 20% (n=27) ranged from 90%–96.02%. The lowest ratio (63.99%) of homo-SNPs was discovered in F2 line 147, and the highest ratio (96.02%) was identified in line 163.
The genomic heterozygosity of each ERV1 inbred F2 line was then analyzed by comparing the sequencing data with the Nipponbare reference genome. After excluding abnormal values, sequencing data of 196 lines out of 216 ERV1 inbred F2 lines were left for in-depth study (Table S8). The mean genomic heterozygosity of the 196 lines was approximately 1.68×10⁻⁴, of which 30.61% F2 lines (n=60) ranged from 0.16×10⁻⁴-0.98×10⁻⁴, 32.14% lines (n=63) ranged from 1.0×10⁻⁴-1.96×10⁻⁴, 23.98% lines (n=47) ranged from 2.04×10⁻⁴-2.99×10⁻⁴, 11.73% lines (n=23) ranged from 3.00×10⁻⁴-3.81×10⁻⁴, and 1.53% lines (n=3) ranged from 4.08×10⁻⁴-4.57×10⁻⁴. The lowest genomic heterozygosity (0.16×10⁻⁴) was identified in line 139, and the highest value (4.57×10⁻⁴) in line 167.
The spontaneous mutation rate of the ERV1 inbred F2 lines were further estimated using the comparison results. Only the SNPs that were covered by the sequencing data of over 20 F2 lines were considered as candidate sites of spontaneous mutation (Table S8). After a series of filtering and screening, the average spontaneous mutation rate of the ERV1 inbred F2 lines was approximately 5.94×10⁻⁴, approximately 3.5-fold higher than the mean genomic heterozygosity of the ERV1 inbred F2 population, of which 1.53% D2 lines (n=3) ranged from 3.91×10⁻⁴- 4.98×10⁻⁴, 55.61% lines (n=109) ranged from 5.05×10⁻⁴-5.99×10⁻⁴, 42.35% lines (n=83) ranged from 6.00×10⁻⁴-6.97×10⁻⁴, and one line had a mutation rate of 7.01×10⁻⁴. The lowest spontaneous mutation rate (3.91×10⁻⁴) was identified in line 4, and the highest value (7.01×10⁻⁴) in line 30.
Discussion
A series of previous studies have documented that SSI could induce extensive genomic variations, and result to phenotypic changes of important traits (Zhou et al., 1983; de la Peña et al., 1987; Zhao et al., 2007). They also experimently confirmed the integration of donor DNA fragments in variant genomes (Liu et al., 2000; Miao et al., 2000; Xing et al., 2004), and revealed that allelic variation of important genes might be the main factor for phenotypic changes of variant plants (Wang et al., 2013; Peng et al., 2016). Nevertheless, these studies mainly based on limited molecular markers such as RFLP, RAPD, AFLP and SSR (Shan et al., 2005; Wang et al., 2010), the extent and distribution pattern of the induced variations in a genome-wide scale and its inheritance patterns were largely obscure.
People used to use introgressive hybrid added with embryo rescue to overcome the cross incompatibility between the wild species of genus Oryza and cultivated rice, and to generate interspecific hybrids (Ramanujam, 1937; Nayar, 1973). Notably, the rice variant ERV1 from SSI method seemed to a hybrid F1 cross between RH78 and O. eichingeri, the latter belongs to the wild species of genus Oryza, has 2n=24 chromosomes representing CC genome, and is incompatible with O. sativa genome (Brar and Khush, 1997). This proved that SSI method could realize the exchange or transfer of genetic materials without the effects of reproductive isolation. Meanwhile, the values of plant height, panicle length, spikelet number, and length and width of flag leaf of the rice variant ERV1 in this study are all higher than the rice recipient RH78 but lower than the donor O. eichingeri, and the genomic heterozygosity of ERV1 was approximately 8-fold higher than RH78. This phenomenon was similar to the introgressive hybridization by pollens of alien sexually incompatible species (Hongyan et al., 2009; Dowen et al., 2012), which would provoke genome-wide and extensive genomic changes, and even results in important phenotypic novelties (Wang et al., 2013; Sakai et al., 2013; Schiestl and Johnson, 2013). We also noted that the genomic heterozygosity rapidly decreased from as high as 25.96 × 10⁻⁴ in ERV1 to an average of approximately 1.68×10⁻⁴ in ERV1 inbred F2 lines, this was much different from introgressive hybridization, and indicated that the novel phenotypes or traits of these rice variants generated by SSI method could be quickly fixed, and utilized in crop genetic improvements.
Spontaneous mutation is an important factor in genome evolution and phenotypic variation (Zhang et al., 2016). In this study, we identified a total of 5,518 homozygous SNPs in ERV1 relative to RH78, resulting in a spontaneous mutation rate of 0.182×10⁻⁴ in ERV1. The average spontaneous mutation rate of ERV1 inbred F2 lines was estimated to be approximately 5.94×10⁻⁴, significantly increased compared to ERV1, and approximately 3.5-fold higher than the mean genomic heterozygosity of the ERV1 inbred F2 lines. This interesting phenomenon implies a highly un-purified genetic background, and high genetic variability of the ERV1 genome.
In conclusion, our study presented a method that could quickly and comprehensively improve important agronomic traits of cultivated rice, and preliminarily unveiled the fundamental rules of the genetic variation and inheritance of variation in the early generation via multi-omics strategies and comparative genomic analysis. The results enhanced our understanding of SSI methods, and may accelerate our understanding of plant genome evolution, domestication, and speciation in nature.
Data Availability Statement
The original contributions presented in the study are publicly available. This data can be found here: https://www.ncbi.nlm.nih.gov/bioproject/PRJNA658863.
Author Contributions
YH, BM, and YX extracted DNA, identified the genotype of F2 population, and wrote the manuscript. YP, DZ and YS performed SNP data analysis and QTL detecting. LT and YL validated some results of the bioinformatics analysis. BZ designed the experiments and supervised the study. All authors contributed to the article and approved the submitted version.
Funding
This research was financially supported by the Natural Science Foundation of Hunan province (2020JJ5399), the National Major Special Project on New Varieties Cultivation for Transgenic Organisms (Grant No. 2016ZX08001-004), the Major Science and Technology Projects of Hunan province (2018NK1020, 2018NK1010), and the 2020 Research Program of Sanya Yazhou Bay Science and Technology City (Grant No.202002006).
Conflict of Interest
The authors declare that the research was conducted in the absence of any commercial or financial relationships that could be construed as a potential conflict of interest.
Supplementary Material
The Supplementary Material for this article can be found online at: https://www.frontiersin.org/articles/10.3389/fpls.2020.575373/full#supplementary-material
References
Ashikari, M., Sakakibara, H., Lin, S., Yamamoto, T., Takashi, T., Nishimura, A., et al. (2005). Cytokinin Oxidase Regulates Rice Grain Production. Science 309 (5735), 741–745. doi: 10.1126/science.1113373
Bennetzen, J. L. (2007). Patterns in grass genome evolution. Curr. Opin. Plant Biol. 10 (2), 176–181. doi: 10.1016/j.pbi.2007.01.010
Brar, D. S., Khush, G. S. (1997). Alien introgression in rice. Plant Mol. Biol. 35 (1-2), 35–47. doi: 10.1023/A:1005825519998
Chen, L., Liu, Y. G. (2014). Male sterility and fertility restoration in crops. Annu. Rev. Plant Biol. 65 (1), 57–71. doi: 10.1146/annurev-arplant-050213-040119
Chen, Z. J. (2010). Molecular mechanisms of polyploidy and hybrid vigor. Trends Plant Sci. 15 (2), 57–71. doi: 10.1016/j.tplants.2009.12.003
Clark, A.G., Eisen, M. B., Smith, D. R., Bergman, C. M., Oliver, B., Markow, T. A., et al. (2007). Evolution of genes and genomes on the Drosophila phylogeny: Drosophila 12 Genomes Consortium. Nature 450, 203.
Davey, J. W., Hohenlohe, P. A., Etter, P. D., Boone, J. Q., Catchen, J. M., Blaxter, M. L., et al. (2011). Genome-wide genetic marker discovery and genotyping using next-generation sequencing. Nat. Rev. Genet. 12 (7), 499–510. doi: 10.1038/nrg3012
de la Peña, A., Ouml, H., Schell, J. (1987). Transgenic rye plants obtained by injecting DNA into young floral tillers. Nat. (London) 325, 274–276. doi: 10.1038/325274a0
Dowen, R. H., Pelizzola, M., Schmitz, R. J., Lister, R., Ecker, J. R. (2012). Widespread dynamic DNA methylation in response to biotic stress. Proc. Natl. Acad. Sci. U. States America 109 (32), E2183–E2191. doi: 10.1073/pnas.1209329109
Duan, M., Sun, Z., Shu, L., Tan, Y. N., Yuan, D. Y., Sun, X. W., et al. (2013). Genetic analysis of an elite super-hybrid rice parent using high-density SNP markers. Rice 6 (1), 1–15. doi: 10.1186/1939-8433-6-21
Fitzgerald, M. A., Mccouch, S. R., Hall, R. D. (2009). Not just a grain of rice: the quest for quality. Trends Plant Sci. 14 (3), 133–139. doi: 10.1016/j.tplants.2008.12.004
Gill, B. S., Friebe, B. R., White, F. F. (2011). Alien introgressions represent a rich source of genes for crop improvement. Proc. Natl. Acad. Sci. U.S.A. 108 (19), 7657–7658. doi: 10.1073/pnas.1104845108
Gu, S., Fang, L., Xu, X. (2013). Using SOAPaligner for Short Reads Alignment. Curr. Protoc. Bioinf. 44, 11.11.1–17. doi: 10.1002/0471250953.bi1111s44
Hongyan, W., Wang, H. Y., Chai, Y., Chu, X. C., Zhao, Y. Y., Wu, Y., et al. (2009). Molecular characterization of a rice mutator-phenotype derived from an incompatible cross-pollination reveals transgenerational mobilization of multiple transposable elements and extensive epigenetic instability. BMC Plant Biol. 9, 63. doi: 10.1186/1471-2229-9-63
Hu, Y., Mao, B., Peng, Y., Sun, Y. D., Pan, Y. L, Xia, Y. M., et al. (2014). Deep re-sequencing of a widely used maintainer line of hybrid rice for discovery of DNA polymorphisms and evaluation of genetic diversity. Mol. Genet. Genomics 289 (3), 303–315. doi: 10.1007/s00438-013-0807-z
Huang, X., Feng, Q., Qian, Q., Zhao, Q., Wang, L., Wang, A., et al. (2009). High-throughput genotyping by whole-genome resequencing. Genome Res. 19 (6), 1068–1096. doi: 10.1101/gr.089516.108
Jena, K. K. (2010). The species of the genus Oryza and transfer of useful genes from wild species into cultivated rice, O. sativa. Breed Sci. 60 (5), 518–523. doi: 10.1270/jsbbs.60.518
Li, H., Handsaker, B., Wysoker, A., Fennell, T., Ruan, J., Homer, N., et al. (2009). The Sequence Alignment/Map (SAM) Format and SAMtools. Bioinform 25 (16), 2078–2079. doi: 10.1093/bioinformatics/btp352
Liu, Z., Dong, Y., Liu, B. (2000). Isolation of Zizania latifolia Species_specific DNA Sequences and Their Utility in Identification of Z. latifolia DNA Introgressed into Rice. J. Integr. Plant Biol. 42 (3), 324–326. doi: 10.1016/S0168-9452(99)00223-X
Luo, Z., Wu, R. (1989). A simple method for the transformation of rice via the pollen-tube pathway. Plant Mol. Biol. Rep. 7 (3), 240–240. doi: 10.1007/BF02668692
Miao, J., Zhao, M., Li, W. (2000). Molecular proof of wheat transformed by total DNA of leymus racemosus. J. Genet. Genomics (7), 621–627.
Nayar, M. M. (1973). Origin and cytogenetics of rice. Adv. Genet. 17, 153–292. doi: 10.1016/S0065-2660(08)60172-8
Ouyang, S., Liu, J., Jones, K. M., Gansberger, K., Moffat, K., Hill, J., et al. (2005). The map-based sequence of the rice genome. Nature 436 (7052), 793–800. doi: 10.1038/nature03895
Paterson, A. H., Freeling, M., Tang, H., Wang, X. (2010). Insights from the comparison of plant genome sequences. Annu. Rev. Plant Biol. 61 (1), 349–372. doi: 10.1146/annurev-arplant-042809-112235
Peng, Y., Hu, Y., Mao, B., Xiang, H. T., Shao, Y., Pan, Y. L., et al. (2016). Genetic analysis for rice grain quality traits in the YVB stable variant line using RAD-seq. Mol. Genet. Genomics 291 (1), 297–307. doi: 10.1007/s00438-015-1104-9
Peng, S. (1994). Evolution of the new plant ideotype for increased yield potentia[C] Breaking the yield barrier. Proceedings of a workshop on rice yield potential in favorable environments, IRRI.
Ramanujam, S. (1937). Cytogenetical studies in Oryzeae. III. Cytogenetical behaviour of an interspecific hybrid in Oryza. J. Genet. 35, 223–258. doi: 10.1007/BF02982352
Sakai, S., Kawakita, A., Ooi, K., Inoue, T. (2013). Variation in the strength of association among pollination systems and floral traits: Evolutionary changes in the floral traits of Bornean gingers (Zingiberaceae). Am. J. Bot. 100 (3), 546–555. doi: 10.3732/ajb.1200359
Scannell, D. R., Byrne, K. P., Gordon, J. L., Wong, S., Wolge, K. H. (2006). Multiple rounds of speciation associated with reciprocal gene loss in polyploid yeasts. Nature 440, 341–345.
Schiestl, F. P., Johnson, S. D. (2013). Pollinator-mediated evolution of floral signals. Trends Ecol. Evol. 28 (5), 307–315. doi: 10.1016/j.tree.2013.01.019
Shan, X. H., Liu, Z. L., Dong, Z. Y., Wang, Y. M., Chen, Y., Lin, X. Y., et al. (2005). Mobilization ofthe active MITE transposons mPing and Pong in rice by introgressionfrom wild rice (Zizania latifolia Griseb.). Mol. Biol. Evol. 22, 976–990. doi: 10.1093/molbev/msi082
Wang, Y. M., Dong, Z. Y., Zhang, Z. J., Lin, X. Y., Shen, Y., Zhou, D. W., et al. (2005). Extensive de Novo genomic variation in rice induced by introgression from wild rice (Zizania latifolia Griseb.). Genetics 170 (4), 1945–1956. doi: 10.1534/genetics.105.040964
Wang, N. N., Wang, H. Y., Wang, H., Zhang, D., Wu, Y., Ou, X. F., et al. (2010). Transpositional reactivation of the Dart transposon family in rice lines derived from introgressive hybridization with Zizania latifolia. BMC Plant Biol. 10, 190. doi: 10.1186/1471-2229-10-190
Wang, Z. H., Zhang, D., Bai, Y., Zhang, Y. H., Liu, Y., Wu, Y., et al. (2013). Genomewide Variation in an Introgression Line of Rice-Zizania Revealed by Whole-Genome re-Sequencing[J]. PloS One 8 (9), e74479. doi: 10.1371/journal.pone.0074479
Wang, C., Hu, S., Gardner, C., Lübberstedt, T. (2017). Emerging Avenues for Utilization of Exotic Germplasm. Trends Plant Sci. 22 (7), 624–663. doi: 10.1016/j.tplants.2017.04.002
Xing, Q., Zhao, B. R., Xu, K., Yang, H. H., Liu, X., Wang, S. W., et al. (2004). Test of agronomic characteristics and amplified fragment length polymorphism analysis of new rice germplasm developed from transformation of genomic DNA of distant relatives. Plant Mol. Biol. Rep. 22 (2), 155–164. doi: 10.1007/BF02772722
Yu, J., Hu, S., Wang, J., Wong, G. K. S., Li, S. G., Liu, B., et al. (2001). A draft sequence of the rice (Oryza sativa ssp. indica) genome. science 46 (23), 1937–1942. doi: 10.1126/science.1068275
Yuan, L. P., Virnani, S. S. (1989). Status of hybrid rice research and development. International Rice Research Institute, Los Baños, pp. 7–24.
Zamir, D. (2001). Improving plant breeding with exotic genetic libraries. Nat. Rev. Genet. 2 (12), 983–989. doi: 10.1038/35103590
Zhang, Q. J., Zhu, T., Xia, E. H., Shi, C., Liu, Y. L., Zhang, Y., et al. (2014). Rapid diversification of five Oryza AA genomes associated with rice adaptation. Proc. Natl. Acad. Sci. U.S.A. 111 (46), E4954. doi: 10.1073/pnas.1418307111
Zhang, J., Chen, L. L., Xing, F., David, A. K., Zhang, Q. F. (2016). Extensive sequence divergence between the reference genomes of two elite indica rice varieties Zhenshan 97 and Minghui 63. Proc. Natl. Acad. Sci. U.S.A. 113 (35), E5163. doi: 10.1073/pnas.1611012113
Zhao, B. R., Xing, Q. H., Xia, H. A., Yang, H. H., Jin, D. M., Liu, X., et al. (2005). DNA Polymorphism Among Yewei B, V20B, and Oryza minuta J. S. Presl. ex C. B. Presl. 植物学报(英文版) J. Integr. Plant Biol. 47 (12), 1485–1492. doi: 10.1111/j.1744-7909.2005.00122.x
Zhao, C., Zhao, B., Ren, Y., Tong, W., Wang, J. Q., Zhao, K., et al. (2007). Seeking transformation markers: an analysis of differential tissue proteomes on the rice germplasm generated from transformation of Echinochloa crusgalli genomic DNA. J. Proteome Res. 6 (4), 1354–1363. doi: 10.1021/pr0605015
Zhou, G., Weng, J., Zeng, Y., Huang, J. G., Liu, G. L. (1983). Introduction of exogenous DNA into cotton embryos. Methods Enzymol. 101 (6), 433–481. doi: 10.1016/0076-6879(83)01032-0
Keywords: rice, genome sequencing, genetic diversity, exogenous DNA transfer, quantitative trait locus mapping
Citation: Hu Y, Mao B, Xia Y, Peng Y, Zhang D, Tang L, Shao Y, Li Y and Zhao B (2020) Spike-Stalk Injection Method Causes Extensive Phenotypic and Genotypic Variations for Rice Germplasm. Front. Plant Sci. 11:575373. doi: 10.3389/fpls.2020.575373
Received: 23 June 2020; Accepted: 08 September 2020;
Published: 25 September 2020.
Edited by:
Jaime Prohens, Universitat Politècnica de València, SpainReviewed by:
Kejian Wang, Chinese Academy of Agricultural Sciences, ChinaDejun Li, Chinese Academy of Tropical Agricultural Sciences, China
Copyright © 2020 Hu, Mao, Xia, Peng, Zhang, Tang, Shao, Li and Zhao. This is an open-access article distributed under the terms of the Creative Commons Attribution License (CC BY). The use, distribution or reproduction in other forums is permitted, provided the original author(s) and the copyright owner(s) are credited and that the original publication in this journal is cited, in accordance with accepted academic practice. No use, distribution or reproduction is permitted which does not comply with these terms.
*Correspondence: Bingran Zhao, YnJ6aGFvaGhycmNyaWNlQDE2My5jb20=
†These authors have contributed equally to this work