 Joaquim Bellvert1*
 Héctor Nieto2
 Ana Pelechá1Christian Jofre-Čekalović1Lourdes Zazurca3
 Xavier Miarnau3
- 1Efficient Use of Water in Agriculture Program, Institute of Agrifood Research and Technology, Fruitcentre, Parc Científic i Tecnològic Agroalimentari de Lleida, Lleida, Spain
- 2Complutum Tecnologías de la Información Geográfica, Madrid, Spain
- 3Fruit Production Program, Institute of Agrifood Research and Technology, Fruitcentre, Parc Científic i Tecnològic Agroalimentari de Lleida, Lleida, Spain
One of the objectives of many studies conducted by breeding programs is to characterize and select rootstocks well-adapted to drought conditions. In recent years, field high-throughput phenotyping methods have been developed to characterize plant traits and to identify the most water use efficient varieties and rootstocks. However, none of these studies have been able to quantify the behavior of crop evapotranspiration in almond rootstocks under different water regimes. In this study, remote sensing phenotyping methods were used to assess the evapotranspiration of almond cv. “Marinada” grafted onto a rootstock collection. In particular, the two-source energy balance and Shuttleworth and Wallace models were used to, respectively, estimate the actual and potential evapotranspiration of almonds grafted onto 10 rootstock under three different irrigation treatments. For this purpose, three flights were conducted during the 2018 and 2019 growing seasons with an aircraft equipped with a thermal and multispectral camera. Stem water potential (Ψstem) was also measured concomitant to image acquisition. Biophysical traits of the vegetation were firstly assessed through photogrammetry techniques, spectral vegetation indices and the radiative transfer model PROSAIL. The estimates of canopy height, leaf area index and daily fraction of intercepted radiation had root mean square errors of 0.57 m, 0.24 m m–1 and 0.07%, respectively. Findings of this study showed significant differences between rootstocks in all of the evaluated parameters. Cadaman® and Garnem® had the highest canopy vigor traits, evapotranspiration, Ψstem and kernel yield. In contrast, Rootpac® 20 and Rootpac® R had the lowest values of the same parameters, suggesting that this was due to an incompatibility between plum-almond species or to a lower water absorption capability of the rooting system. Among the rootstocks with medium canopy vigor, Adesoto and IRTA 1 had a lower evapotranspiration than Rootpac® 40 and Ishtara®. Water productivity (WP) (kg kernel/mm water evapotranspired) tended to decrease with Ψstem, mainly in 2018. Cadaman® and Garnem® had the highest WP, followed by INRA GF-677, IRTA 1, IRTA 2, and Rootpac® 40. Despite the low Ψstem of Rootpac® R, the WP of this rootstock was also high.
Introduction
The study of the behavior of Prunus cultivars grafted on different rootstocks in fruit production serves to adapt cultivars to different edaphic and environmental conditions and to enhance sustainable crop production. The selection of a suitable scion-rootstock combination is the first step to monitor the vegetative growth, yield and fruit composition parameters of the scion (Caruso et al., 1996; Mestre et al., 2017; Font i Forcada et al., 2020; Reig et al., 2020). There is growing interest in selecting and breeding new rootstocks and cultivars with a higher water use efficiency (WUE) in order to improve water productivity and better adapt fruit production to future climate changes (Solari et al., 2006; Xiloyannis et al., 2007; Díez-Palet et al., 2019). In almonds [Prunus dulcis (Mill.) DA Webb], with the recent introduction of high-density planting systems, particular attention has been paid to using dwarf rootstocks in order to control canopy vigor and facilitate mechanical harvesting (Pinochet, 2009; Casanova-Gascón et al., 2019). In addition, with the introduction of new dwarfing rootstocks and hybrids coming mainly from the peach sector, the paradigm has changed since information about their response to drought or a limited water supply is scant.
For many years, breeding programs for fruit crop rootstocks, as well as for obtaining scion cultivars, have used similar evaluation methods based on both agronomic and molecular traits. Some of the commonly measured agronomic traits are trunk cross-sectional area (TCSA), plant height, tree canopy vigor, phenology, yield parameters, and fruit quality attributes (Reighard et al., 2011; Font i Forcada et al., 2012; Legua et al., 2012; Lordan et al., 2019). However, most of these agronomic traits are a consequence of differences in the root system architecture or the hydraulic properties of a rootstock, which contribute in influencing the transpiration rate through their effects on the stem water potential (Ψstem) and the control of stomatal conductance (Hernandez-Santana et al., 2016). On the other hand, the development of markers to help select individuals with traits that are complex to evaluate should speed up the development of new rootstocks that are resistant or tolerant to multiple biotic or abiotic stresses (Cantini et al., 2001; Arismendi et al., 2012; Jiménez et al., 2013; Guajardo et al., 2015). However, the types of methodology required for this remain fairly time-consuming, costly and, in some cases, are still scarce.
In recent years, proximal and remote sensing (RS) technologies have increasingly been used to assess vegetation in the context of field-based phenotyping (FBP) (Deery et al., 2014; Araus and Kefauver, 2018). These technologies have shown the potential to reduce labor requirements in the assessment of “breeder-preferred” traits and, in some cases, can deliver more detailed information about the biophysical crop parameters. Usually, most efforts in this field are focused on using low-cost RGB (visible), multispectral/hyperspectral, light detection and ranging (LIDAR) or thermal infrared imaging sensors. Detailed information can be found in the literature about different applications for field phenotyping using these sensors (Araus and Cairns, 2014; Deery et al., 2014; Araus et al., 2018). For example, applications of digital RGB sensors in FBP include visible imaging to estimate leaf color, crop ear counting, canopy cover, or canopy height (Kefauver et al., 2015; Holman et al., 2016; Fernandez-Gallego et al., 2019). Spectral imaging sensors are normally used to derive the spectral response of the vegetation and their biophysical traits such as leaf water content, chlorophyll and xanthophyll levels, biomass or the leaf area index (LAI) (Li et al., 2014; Mazis et al., 2020). Thermal imaging has been used to estimate plant water status (Romano et al., 2011; Prashar and Jones, 2014), and LIDAR point clouds to estimate vegetation structural parameters (Madec et al., 2017; Jimenez-Berni et al., 2018). However, most of the breeding programs focused on these targets have tended to use RS technologies to phenotype annual crops. Such studies are rarely performed in woody crops. To the best of our knowledge, only Virlet et al. (2014); Ampatzidis et al. (2019); Coupel-Ledru et al. (2019); Gutiérrez-Gordillo et al. (2020), and López-Granados et al. (2019) have used RS imagery for FBP in woody crops such as apple, citrus and almond.
As previously mentioned, there is an urgent need to identify rootstocks with improved WUE, which, for instance, could be planted in drylands or to cope with scarce water supplies. For this purpose, it is critical to develop tools capable of determining actual transpiration rates at canopy level which can be widely used in breeding programs. Until now, the field phenotyping response of woody crops to water use constraints has constituted a bottleneck for breeding programs due to the complexity of measuring actual transpiration or water status in a large number of trees (Virlet et al., 2014). The few studies that have been published were conducted using high-throughput phenotyping platforms deployed in greenhouses and under controlled conditions, which have the advantage that plants in pots can be weighed and biomass estimated from imagery (Pereyra-Irujo et al., 2012; Lopez et al., 2015).
In recent years, improvements in computational performance, open-source programming languages, lower data requirements, and the simplification of different complex approaches used to estimate actual crop evapotranspiration (ETa) through RS have contributed, at least in part, to reducing the existing gap between RS physical modeling methods and agricultural applications. Among the different methods, the surface energy balance (SEB) models are probably the most complex to run, but at the same time provide high accuracy and robustness in estimating ETa in different environments (Norman et al., 1995; Bastiaanssen et al., 1998; Mecikalski et al., 1999; Allen et al., 2007; Boulet et al., 2015). These models have mostly been used for assessing the spatial and temporal variability of ETa at regional and field scale using satellite imagery (Semmens et al., 2016; He et al., 2017; Knipper et al., 2019), although some of them have also been used with very high-resolution aircraft imagery (Hoffman et al., 2016; Xia et al., 2016; Nieto et al., 2019). Among the different SEB models, the two-source energy balance (TSEB) modeling scheme allows the possibility to estimate transpiration and evaporation separately (Norman et al., 1995), by using the Priestley-Taylor approach (Priestley and Taylor, 1972) when radiometric temperature (Trad) is obtained from satellite imagery (e.g., Knipper et al., 2019), or through a contextual approach if high-resolution thermal imagery is available, in which case it is possible to directly obtain soil (Ts) and canopy (Tc) surface temperatures (Nieto et al., 2019). The TSEB is a two-source model built on the Shuttleworth-Wallace (S-W) energy combination model which can be used to estimate potential evapotranspiration (ETp) and its partition components separately (Shuttleworth and Wallace, 1985).
Based on the hypothesis that the ratio between ETa and ETp can be used as a crop water stress indicator, this paper aims to demonstrate the potential of the TSEB and S-W models for phenotyping and breeding purposes in woody crops. Differences in the amount of evapotranspired water and water status will be explored in the almond cultivar “Marinada” grafted onto a collection of 10 rootstocks irrigated under different water regimes. Different RS approaches to determine certain biophysical traits of the vegetation are also explored and the values obtained are used as inputs of the TSEB and S-W models.
Materials and Methods
Study Site and Experimental Design
The study was carried out in an experimental almond orchard located at the experimental station of IRTA (Institute of Research and Technology, Food and Agriculture) in Les Borges Blanques, Spain (41°30′31.89″N; 0°51′10.70″E, 323 m elevation) during the 2018 and 2019 growing seasons (Figure 1). The climate in the area is Mediterranean, with annual rainfall of 535 and 377 mm for 2018 and 2019, respectively. The orchard is the result of a rootstock trial planted in 2010 which used cv. “Marinada” as the scion cultivar (Vargas et al., 2008) and the following rootstocks: Adesoto, Cadaman®, Garnem®, INRA GF-677, IRTA 1, IRTA 2, Ishtara®, Rootpac® R, Rootpac® 40, and Rootpac® 20 (Table 1). Trees were planted at a spacing distance of 4.5 m with 5.0 m between rows, and trained to an open vase system.
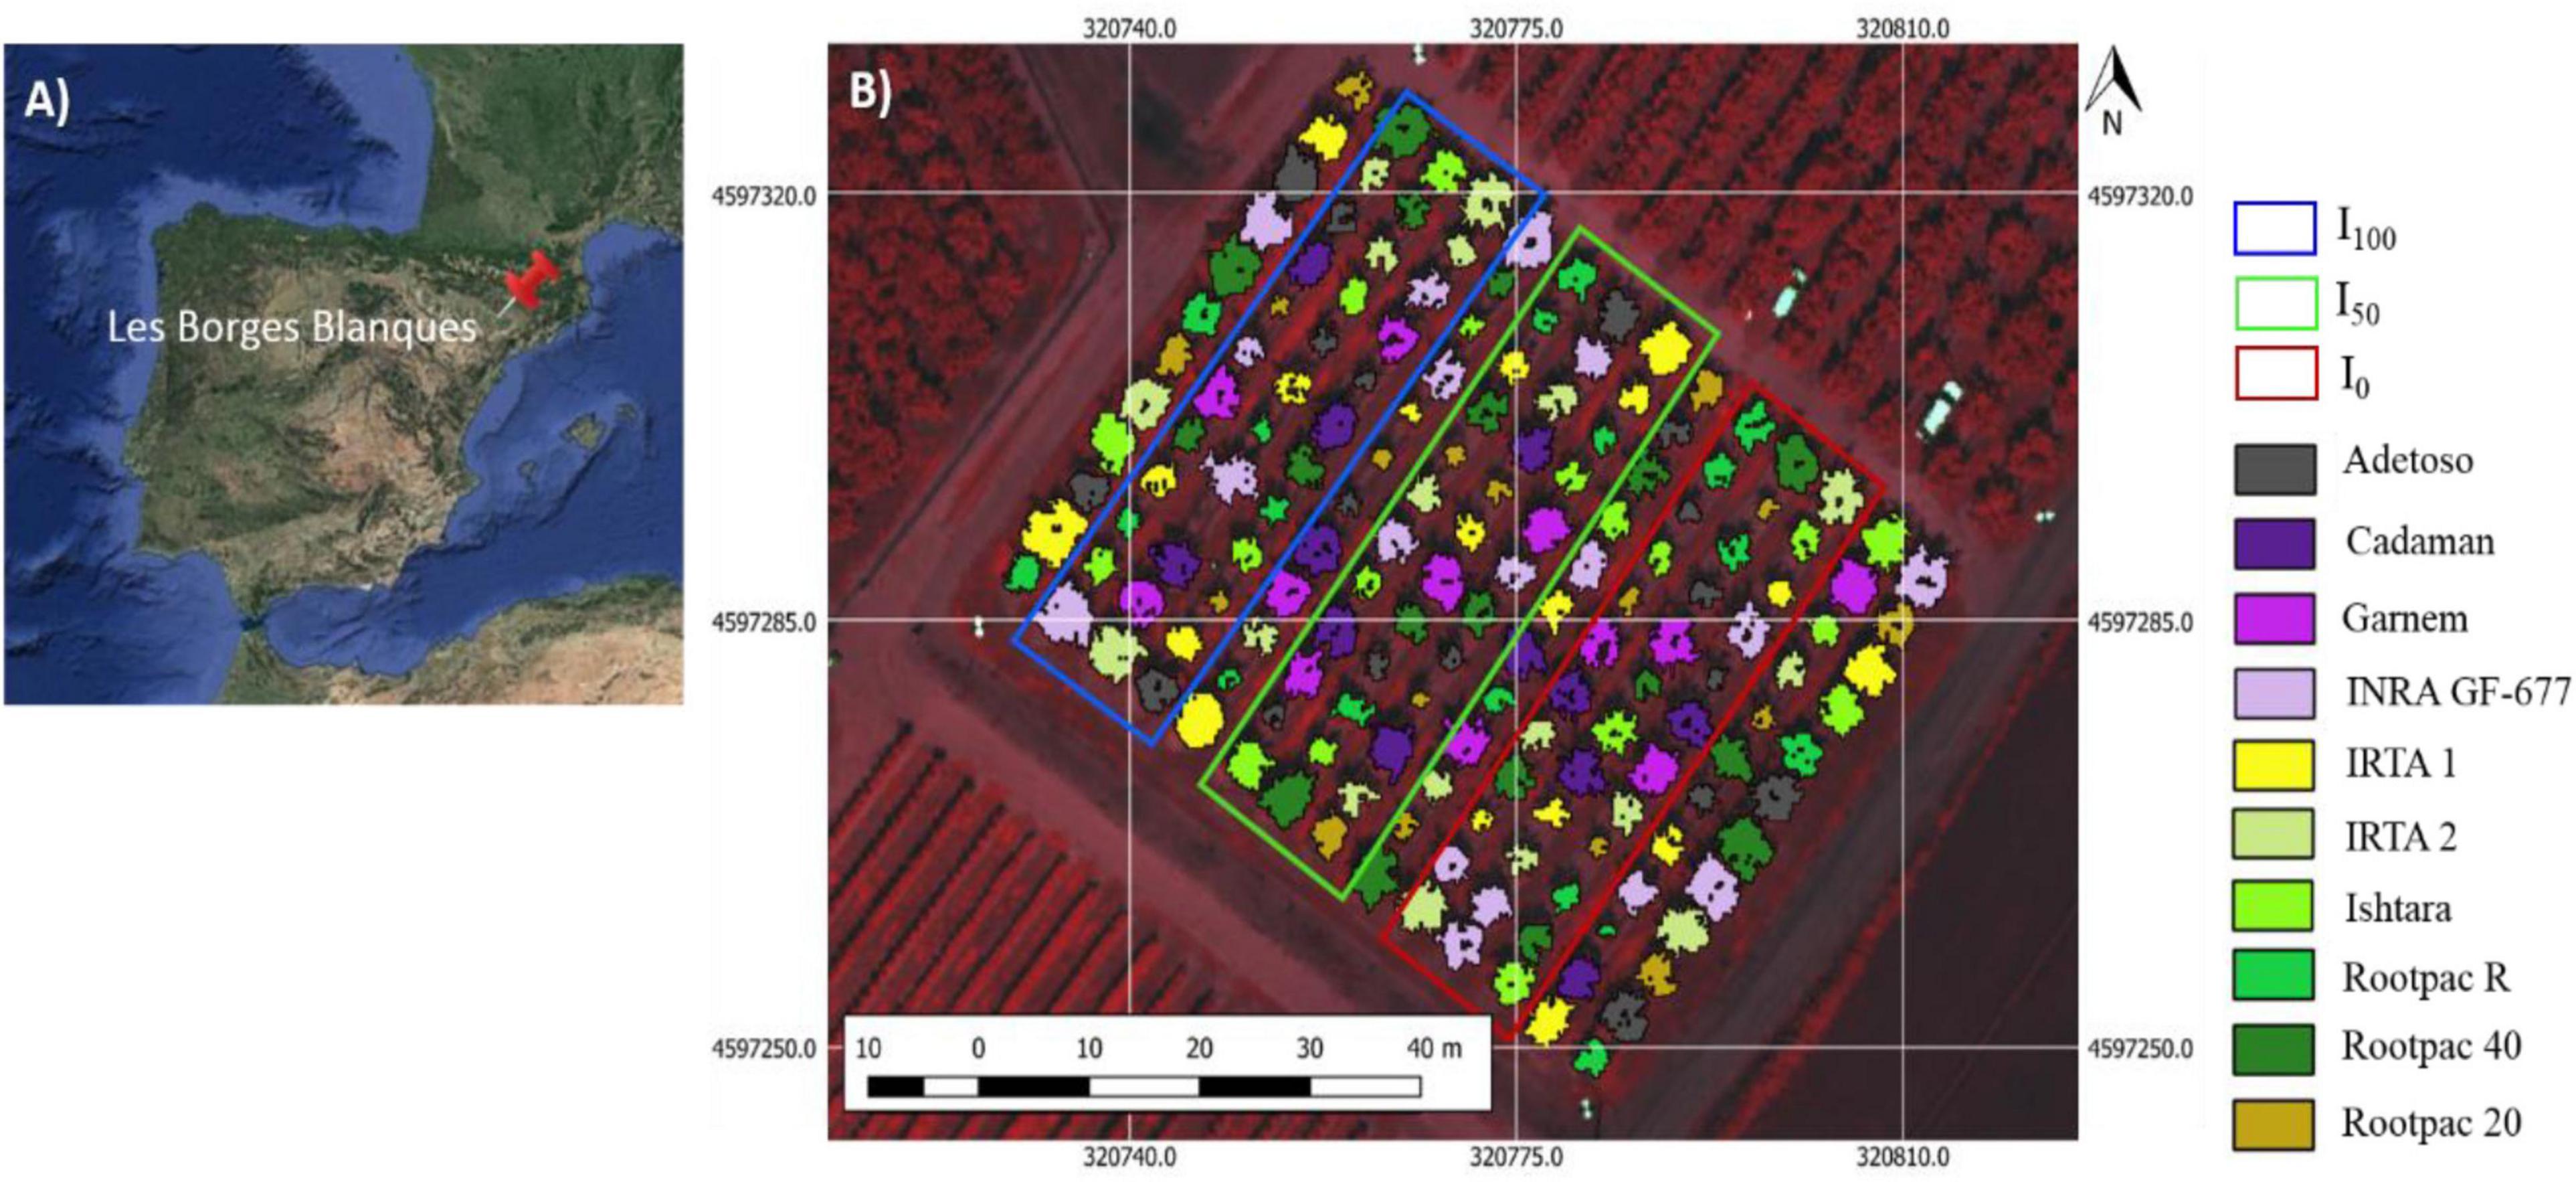
Figure 1. Location of the field experiment, observing in (A) the study site located at the IRTA experimental station in Les Borges Blanques (Lleida, Spain), and (B) design of the almond rootstock trial with three irrigation treatments (I100, I50, and I0).
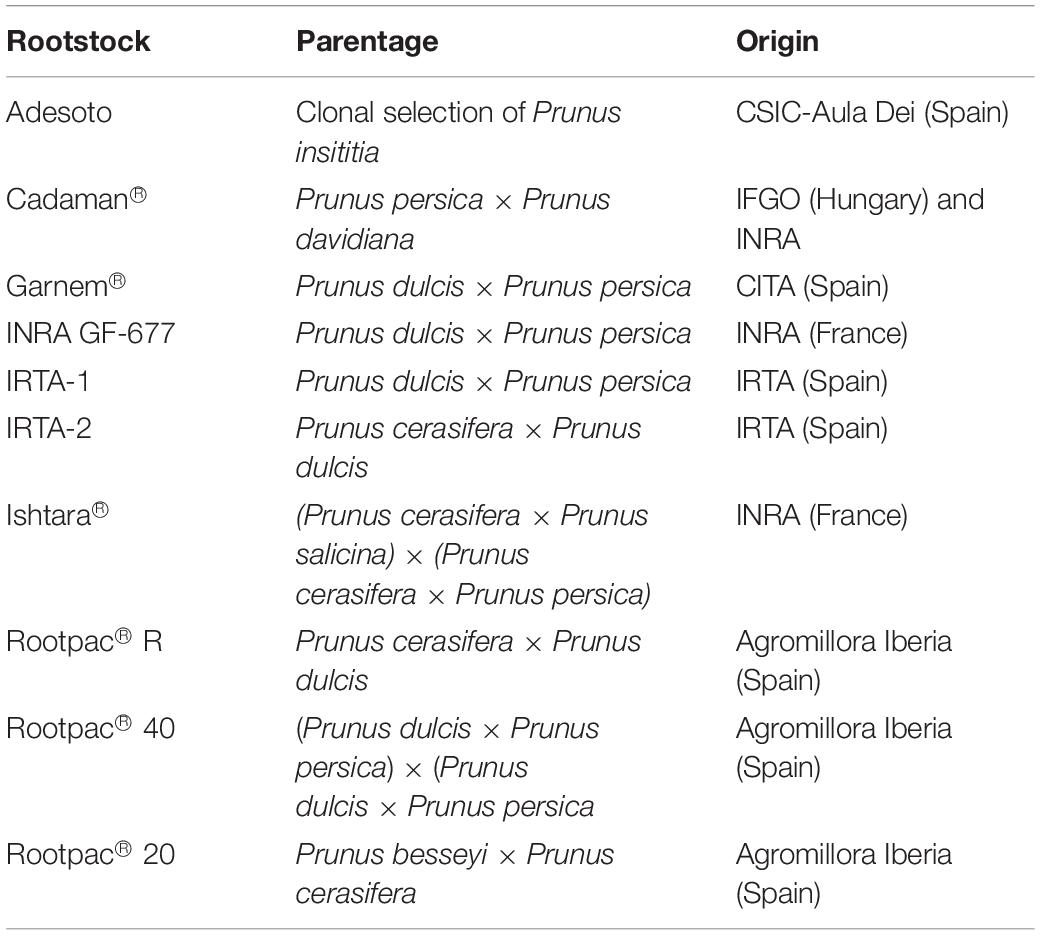
Table 1. List of evaluated rootstock, parentage, origin and tested cultivar.
The study followed a split-plot design, where irrigation treatment is the main plot and the rootstocks are the sub-plots. The trial consisted of three irrigation treatments: (i) conventional irrigation (I100), receiving 100% of ETc during the whole irrigation season; (ii) half irrigation (I50), receiving 50% of ETc during the whole irrigation season, and (iii) deficit irrigation (I0), which received 100% of ETc during the whole irrigation season except for ∼30 days before the airborne campaign when irrigation was halted. The total amount of water applied in I100 throughout the growing season (from April to October) was 652 mm and 618 mm in 2018 and 2019, respectively. Each treatment had three repetitions, each in a row, with the 10 different rootstocks in each row. Rootstock distribution within each row followed a randomized design. One additional row was included between treatments for protection.
Trees were irrigated on a daily basis calculating water requirements through a water balance method for replacing crop evapotranspiration (ETc) as follows: ETc = (ETo x Kc)–effective rainfall. The ETo was collected from the public network of weather stations closest to the study site (Xarxa Agrometeorològica de Catalunya (XAC), and Servei Meterorològic de Catalunya., 2020), which uses the Penman-Monteith method (Allen et al., 1998) to calculate it. Annual ETo was 1061 and 1133 mm in 2018 and 2019, respectively. The Kc used were derived from Goldhamer (2012): Kc1 = 0.70 (April), Kc2 = 0.95 (May), Kc3 = 1.09 (June), Kc4 = 1.15 (July), Kc5 = 1.17 (August), and Kc6 = 1.12 (September). Effective rainfall was estimated as half of the rainfall for a single event-day with more than 10 mm of precipitation; otherwise was considered to be zero. The irrigation system consisted of two drip lines, with fifteen drippers per tree (3.5 L h–1 per dripper). Soil texture was clay-loam and the effective soil depth was ∼150 cm. Tree management for pruning, diseases and pests control, soil management and fertilization was based on Spanish integrated production management practices (BOE, 2002).
Image Collection
The airborne campaign was conducted on 24th July and 28th of August 2018, and on 24th July 2019. Air temperature (Ta) and vapor pressure deficit (VPD) at the moment of image acquisition were, respectively, 33.4°C and 2.9 kPa for 24th July 2018, 31.3°C and 2.2 kPa for 28th August 2018, and 34.4°C and 3.6 kPa for 24th July 2019. Flights were conducted at 12:00 solar time (14:00 local time) with a thermal (FLIR SC655, FLIR Systems, Wilsonville, OR, United States) and multispectral sensor (MACAW, Tetracam, Chatsworth, CA, United States) on board a manned aircraft. Flight altitude was ∼200 m above ground level, providing thermal and multispectral images at ∼0.25 and 0.03 m pixel–1 average resolution, respectively. The thermal sensor has a spectral response in the range of 7.5–13 μm and an image resolution of 640 × 480 pixels. The optical focal length is 13.1 mm, yielding an angular field of view of 45°. The sensor has a focal plane array based on uncooled microbolometers. The MACAW sensor has 1.4 mega-pixel complementary metal-oxide semiconductor (CMOS) sensors with a 9.6 mm fixed lens. These provide images of 1,280 × 1,024 pixels. The sensor contains six user-selectable narrow band filters at 10 nm full width at half maximum (FWHM), with center wavelengths at 515.3, 570.9, 682.2, 710.5, 781.1, and 871.8 nm. The thermal sensor was connected to a laptop via ethernet, and the multispectral camera via USB 3.0 protocol. All thermal and multispectral images were radiometrically, atmospherically and geometrically corrected. The radiometric calibration of the thermal sensor was assessed in the laboratory using a blackbody (model P80P, Land Instruments, Dronfield, United Kingdom). The radiometric calibration of the multispectral sensor was conducted through an external incident light sensor which measured the irradiance levels of light at the same bands as the MACAW multispectral sensor. In addition, in situ spectral measurements in ground calibration targets were performed using a Jaz spectrometer (Ocean Optics, Inc., Dunedin, FL, United States). The Jaz has a wavelength response from 200 to 1,100 nm and an optical resolution of ∼0.3–10.0 nm. During spectral collection, spectrometer calibration measurements were taken with a reference panel (white color Spectralon) and dark current before and after taking readings from radiometric calibration targets. In addition, a range of field calibrations were conducted through in situ surface temperature measurements in ground calibration targets using a portable IR gun (Fluke 62 mini IR thermometer, Everett, WA, United States). Geometric correction was conducted using ground control points (GCP), and measuring the position in each with a handheld GPS (Global Positioning System) (Geo7×, Trimble GeoExplorer series, Sunnyvale, CA, United States) with a precision of ∼0.20 cm. All images were mosaicked using the Agisoft Metashape Professional software (Agisoft LLC., St. Petersburg, Russia) and geometrically and radiometrically terrain corrected with QGIS 3.4 (QGIS 3.4.15). Figure 2 shows the flowchart of the procedures used to process the images and obtain the information of the different parameters.
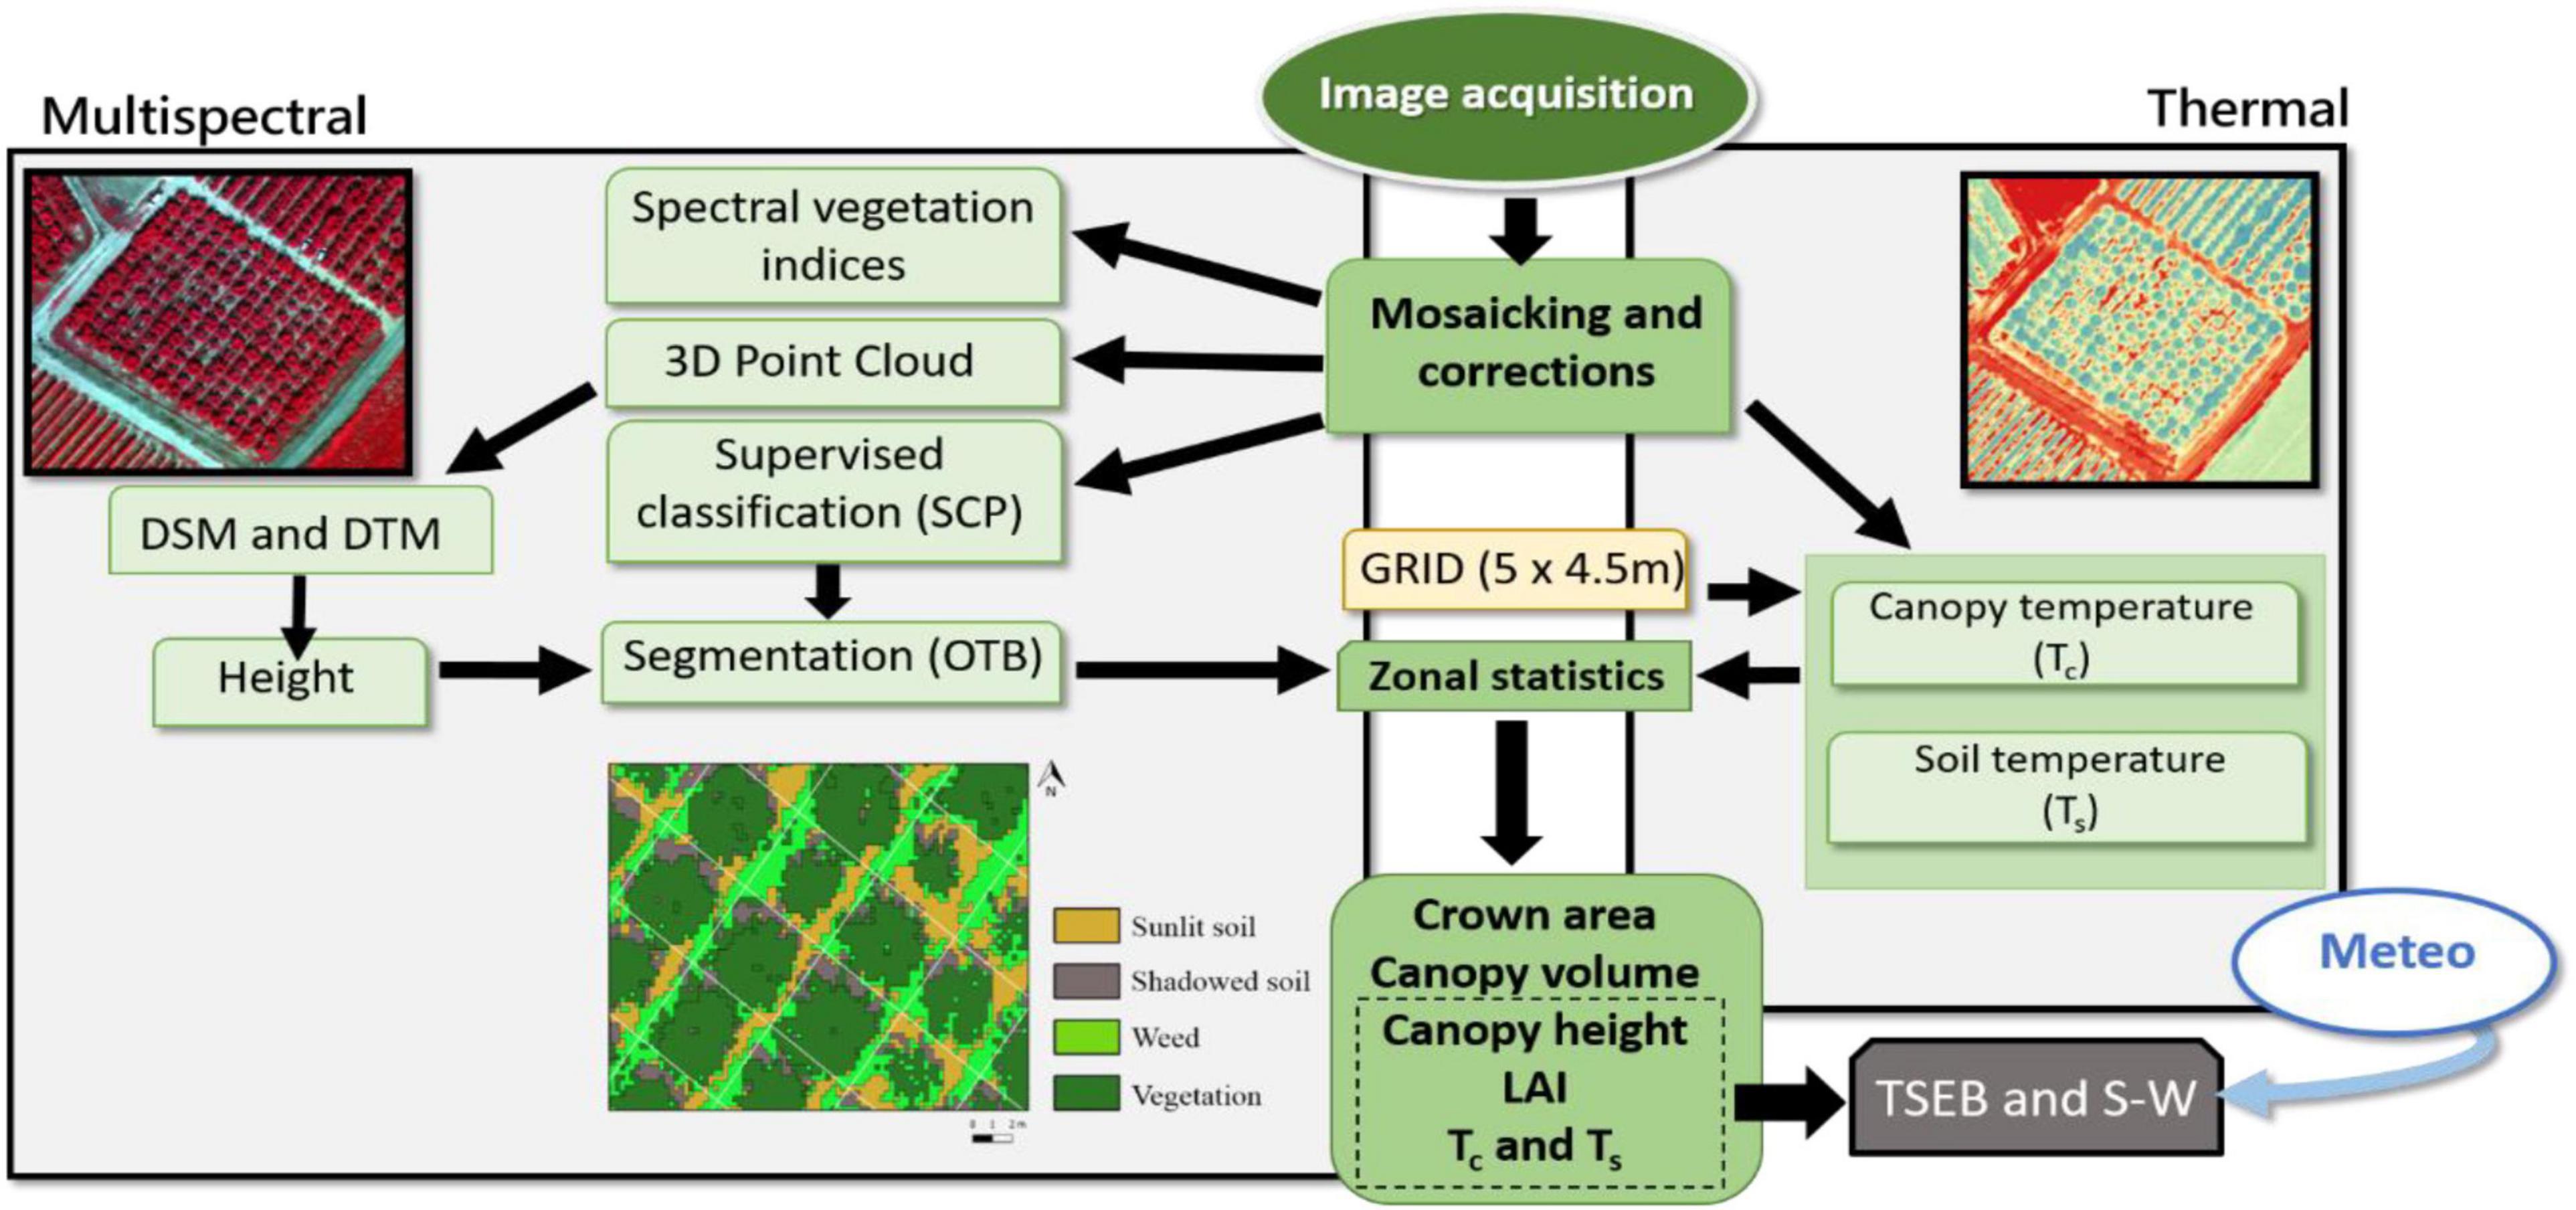
Figure 2. Flowchart of the procedures used for processing the multispectral and thermal images in order to obtain the different biophysical variables of the vegetation and some of the inputs for the two-source energy balance (TSEB) and Shuttleworth and Wallace (S-W) models.
Field Measurements
The fraction of photosynthetically active radiation (PAR) intercepted by the canopy (fiPAR) was measured on the same clear days as image acquisition from 11:00 to 14:00 h (local time) using a portable linear ceptometer (AccuPAR model LP-80, Decagon Devices Inc., Pullman, WA, United States). Incident PAR above and below the canopy was measured for each tree. Twenty PAR readings were recorded below each tree canopy covering the tree spacing. The ceptometer was placed in a horizontal position at ground level perpendicular to the row. The fiPAR was calculated by dividing the averaged PAR below the canopy by the incident PAR taken in full sunlight at an open site with no interference from the canopy. The LAI was derived by means of fiPAR, using the Norman-Jarvis model (Norman and Jarvis, 1974) and assuming a leaf absorptivity for light at 0.9. Daily fiPAR (fiPARd) was estimated using an hourly model of light interception (Oyarzun et al., 2007). In the model, the porosity parameter was estimated so that the simulated hourly intercepted value at noon equalled the instantaneous value measured in the field. Then, fiPARd was calculated by integrating the diurnal course of the simulated fiPAR. Tree architectural parameters such as canopy height, crown width perpendicular to and along rows, and branch insertion height were also measured.
Concomitant to image acquisition, one midday Ψstem was measured in each tree. Shaded leaves were selected and kept in a plastic bag covered by aluminum foil for 2 h before the measurement in order to equilibrate the water potential between leaf, stem and branches. All measurements were acquired in less than 2 h with a pressure chamber (Plant Water Status Console, Model 3500; Soil Moisture Equipment Corp., Santa Barbara, CA) and following the protocol established by Shackel et al. (1997).
Biophysical Traits of the Vegetation
Three different approaches were tested to estimate LAI and fiPARd: (i) estimates of canopy height and volume through photogrammetry, (ii) spectral vegetation indices (VIs), and (iii) the PROSAIL radiative transfer model.
The three-dimensional (3D) tree canopy volume was obtained following the protocol described by Caruso et al. (2019). The digital surface model (DSM) was generated from the photogrammetric point cloud of multispectral images. A classification of bare ground pixels located between tree rows were used to obtain the digital terrain model (DTM) of the orchard. Then, a raster corresponding to heights (from the ground to maximum height of the canopy) was obtained by subtracting the DTM from the DSM using the raster calculator tool of the QGIS software.
The semi-automatic OS v.6 classification plugin of the QGIS software (Congelo, 2016) was used to classify vegetation, sunlit and shadowed bare soil and weeds (Figure 2). Then, the vegetation mask was used to delineate each crown area through the watershed object-based segmentation algorithm included in the Orfeo Toolbox, and to obtain the average height and crown area of each individual tree. Canopy volume of each pixel was obtained by multiplying the pixel area by its corresponding height value (from the ground to the maximum height within the pixel) (Caruso et al., 2019). The total volume of each tree was obtained by adding all the canopy pixels. Finally, the net canopy volume was calculated by subtracting the volume comprised between the ground and the branch insertion of the canopy from the total volume of each tree.
Several spectral VIs were obtained from multispectral images (Table 2). These indices have been shown to be closely related to certain specific features of plant structure and have demonstrated a great potential to estimate the LAI (Haboudane et al., 2004). Besides the extensively used normalized difference vegetation index (NDVI), this study tested different indices within the red-edge spectral region. The red-edge region is characterized by a sharp change in vegetation reflectance due to chlorophyll absorption, and it has been demonstrated that this is strongly influenced by the LAI (Delegido et al., 2013; Xie et al., 2018).
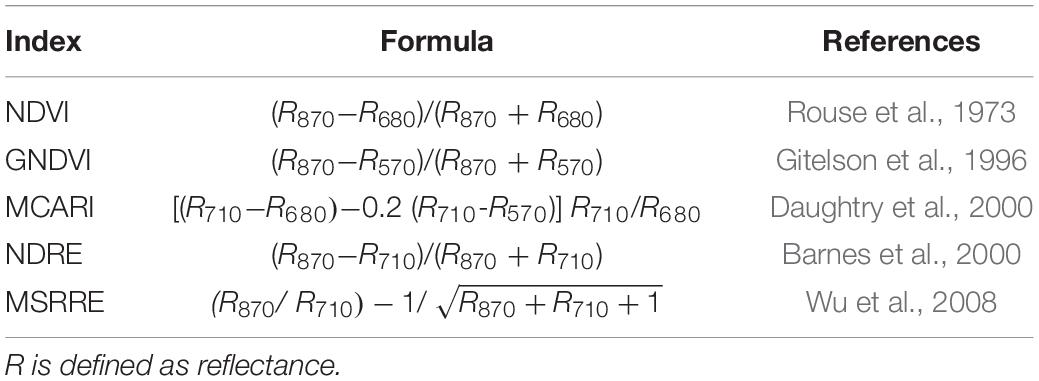
Table 2. List of spectral vegetation indices (VI), their formulation and reference.
The LAI and fiPAR were also estimated following the protocol described by Weiss and Baret (2016), which retrieves these parameters from Sentinel-2 bands. Instead, this study used the six very-high resolution spectral bands of the multispectral sensor. The method consists of generating a large comprehensive dataset of vegetation characteristics, covering all possible ranges in the vegetation parameters described in Table 3, after which simulated reflectance factors are obtained by running the PROSAIL model (Jacquemoud et al., 2009) in forward mode. With these two arrays of values (vegetation parameters and simulated spectra), a neural network was built per each parameter (many-to-one relation). Finally, the trained neural network was applied to the multispectral images for each tree, computing the average reflectance of a rectangular grid with tree spacing distance (4.5 × 5.0 m), in order to predict the biophysical parameters from the reflectances acquired by the multispectral camera.
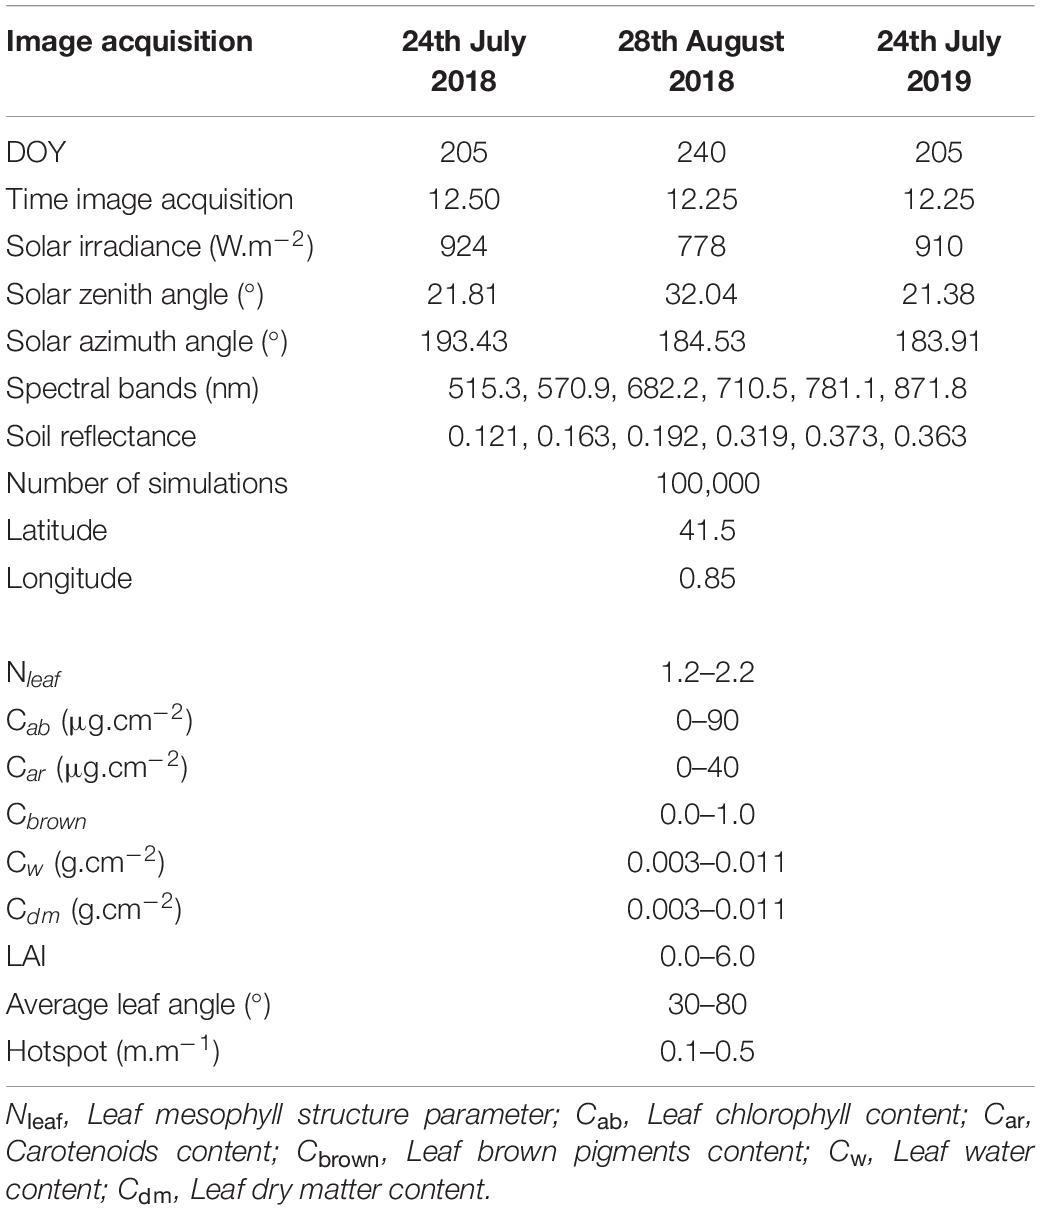
Table 3. List of parameters and their ranges used in PROSAIL reflectance modeling.
Evapotranspiration and Crop Water Stress Index
The TSEB model was used to estimate ETa and its partition between soil and vegetation. One of the main advantages of TSEB is that it estimates evaporation (E) and transpiration (T) separately using information from Trad and biophysical parameters of the vegetation, which are available from RS. The TSEB was originally formulated by Norman et al. (1995) and further improved by Kustas and Anderson (2009). The energy balance is based on the principle of conservation of energy, which calculates latent heat flux as a residual of the surface energy equation (Eq. 1):
where LE is the latent heat flux (W m–2), Rn is the net radiation flux (W m–2), G is the soil heat flux (W m–2), and H is the sensible heat flux (W m–2). The subscripts c and s refer to canopy and soil, respectively. Surface soil heat flux around solar noon (G) is often calculated in TSEB as a constant fraction of Rn,S.
Sensible heat flux (H) is partitioned into soil (Hs) and canopy (Hc) fluxes, in which heat flux transport between soil and canopy are connected in series following an analogy of Ohm’s law for electric transport:
where ρ is the air density (kg m–3), Cp is the specific heat of air (J kg K–1), Ts is the soil temperature (K), Ta is the air temperature (K), Tac is the air temperature in the canopy layer (K), rs is the resistance to heat flow in the boundary layer immediately above the soil surface (s m–1), rx is the total boundary layer resistance of the complete canopy leaves (s m–1), and rah is the aerodynamic resistance (s m–1) to turbulent heat transport between the air-canopy layer and the overlying air layer.
When TSEB runs with coarse resolution satellite-derived images, soil and canopy temperature cannot be directly retrieved. In such cases, Tc and Ts are estimated in an iterative process in which it is first assumed that green canopy transpires at a potential rate based on the Priesley-Taylor equation (Priestley and Taylor, 1972). In this study, however, the high spatial resolution imagery allowed direct retrieval of Ts and Tc without the need to compute an initial canopy transpiration (Nieto et al., 2019). That is, Tc and Ts were individually obtained for each tree and for the bare soil pixels within the 5 × 4.5 m square grid, respectively. For this purpose, the previously mentioned supervised classification was used, and Ts corresponded to the averaged sunlit and shadowed bare soil pixels within each grid.
As in other TSEB models, this methodology also requires LAI to calculate radiation partitioning as well as wind attenuation through the canopy toward the soil surface. Ground measurements of LAI were used in the TSEB. Ancillary variables that were needed, such as meteorological data, were obtained from the closest weather station to the study site (XAC, Les Borges Blanques: 41°30′40.85″N; 0°51′22.21″E). Given Tc and Ts, the heat fluxes from the soil and canopy can be derived directly using Eqs. (2a,b) and the sensible heat flux from Eq. (2c). Actual evapotranspiration at the instant of aircraft image acquisition (ETinst) was calculated as:
where ETinst is the instantaneous ET (mm h–1), ρw represents the density of water (1,000 kg m–3), and λ is the latent heat of vaporization (J kg–1). Then, ETinst was upscaled to daily water fluxes, in units of mm/day, by multiplying the instantaneous ratio between latent heat flux and solar irradiance by average daily solar irradiance (Cammalleri et al., 2014).
The ETp was retrieved from the S-W model (Shuttleworth and Wallace, 1985). This model also considers two coupled sources in a resistance network: the transpiration from vegetation and the evaporation from substrate soil. The theoretical basis of the S-W model is the Penman-Monteith energy combination equation, and includes two parts, one for the soil surface and the other for the plant surface. The potential evapotranspiration and transpiration computed by the S-W model, setting a minimum stomatal resistance value of 100 sm–1, are then used as the basis for estimating the theoretical metrics of the crop water stress index (CWSI). In this study, the CWSI was calculated as:
where ETa and ETp correspond to actual and potential evapotranspiration, estimated, respectively, from the TSEB and S-W models.
Statistical Analysis
Data was analyzed using the JMP® statistical software (SAS Institute Inc., SAS Campus Drive, Cary, NC, United States). Estimates of LAI and fiPARd were also derived using a stepwise multiple regression analysis which included the VIs and canopy volume estimates as dependent variables. All the variables were evaluated with a three-way analysis of variance (three-way ANOVA). Statistical significance was established for P < 0.05. Tukey’s HSD test was applied to separate least square means that differed significantly.
Results
Estimates of the Biophysical Variables of the Vegetation
The one-to-one relationship between observed and estimated canopy height was significant for the three dates of image acquisition, with R2-values ranging from 0.54 to 0.77 and RMSE values from 0.43 to 0.65 m. The R2 and RMSE were, respectively, 0.60 and 0.57 m when aggregating data from the three dates (Figure 3). Values of measured canopy height and LAI ranged between 2.7–5.9 m and 0.3–2.0 m m–1, respectively. Estimates of crown area and canopy volume through photogrammetry were linearly related with fiPARd and LAI, with R2 ranging from 0.38 to 0.72 (Table 4), and being slightly higher for LAI. Non-significant differences were found when estimating these parameters either through crown area or canopy volume, in part because canopy height (used to estimate canopy volume) was quadratically correlated with crown area (R2 = 0.60, p < 0.001). All the tested spectral VIs were significant and linearly correlated with LAI and fiPARd when the data was analyzed for individual dates, but most of the regressions were not significant when the data from the three dates was aggregated. The modified chlorophyll absorption in reflectance index (MCARI) showed the lowest R2 in all cases. The NDVI and normalized difference red-edge (NDRE) index had the highest R2 with LAI on 28th August 2018 and 24th July 2019. In addition, NDRE had the highest R2 on 24th July 2018. On that day, estimates of LAI through NDVI, MCARI and the green normalized difference vegetation index (GNDVI) showed the lowest R2. The VIs with the highest R2 with fiPARd were similar to those reported for LAI. The use of the radiative transfer model PROSAIL significantly improved the estimates of LAI and fiPARd in comparison to the use of simple VIs. The R2 and RMSE for LAI ranged from 0.46 to 0.67 and from 0.24 to 0.39 m m–1, respectively, and for fiPARd from 0.45 to 0.64 and from 0.07 to 0.14%, respectively. In addition, when the data from the three dates were analyzed together, the R2 and RMSE were, respectively 0.40 and 0.34 m m–1 for LAI and 0.29 and 0.12% for fiPARd.
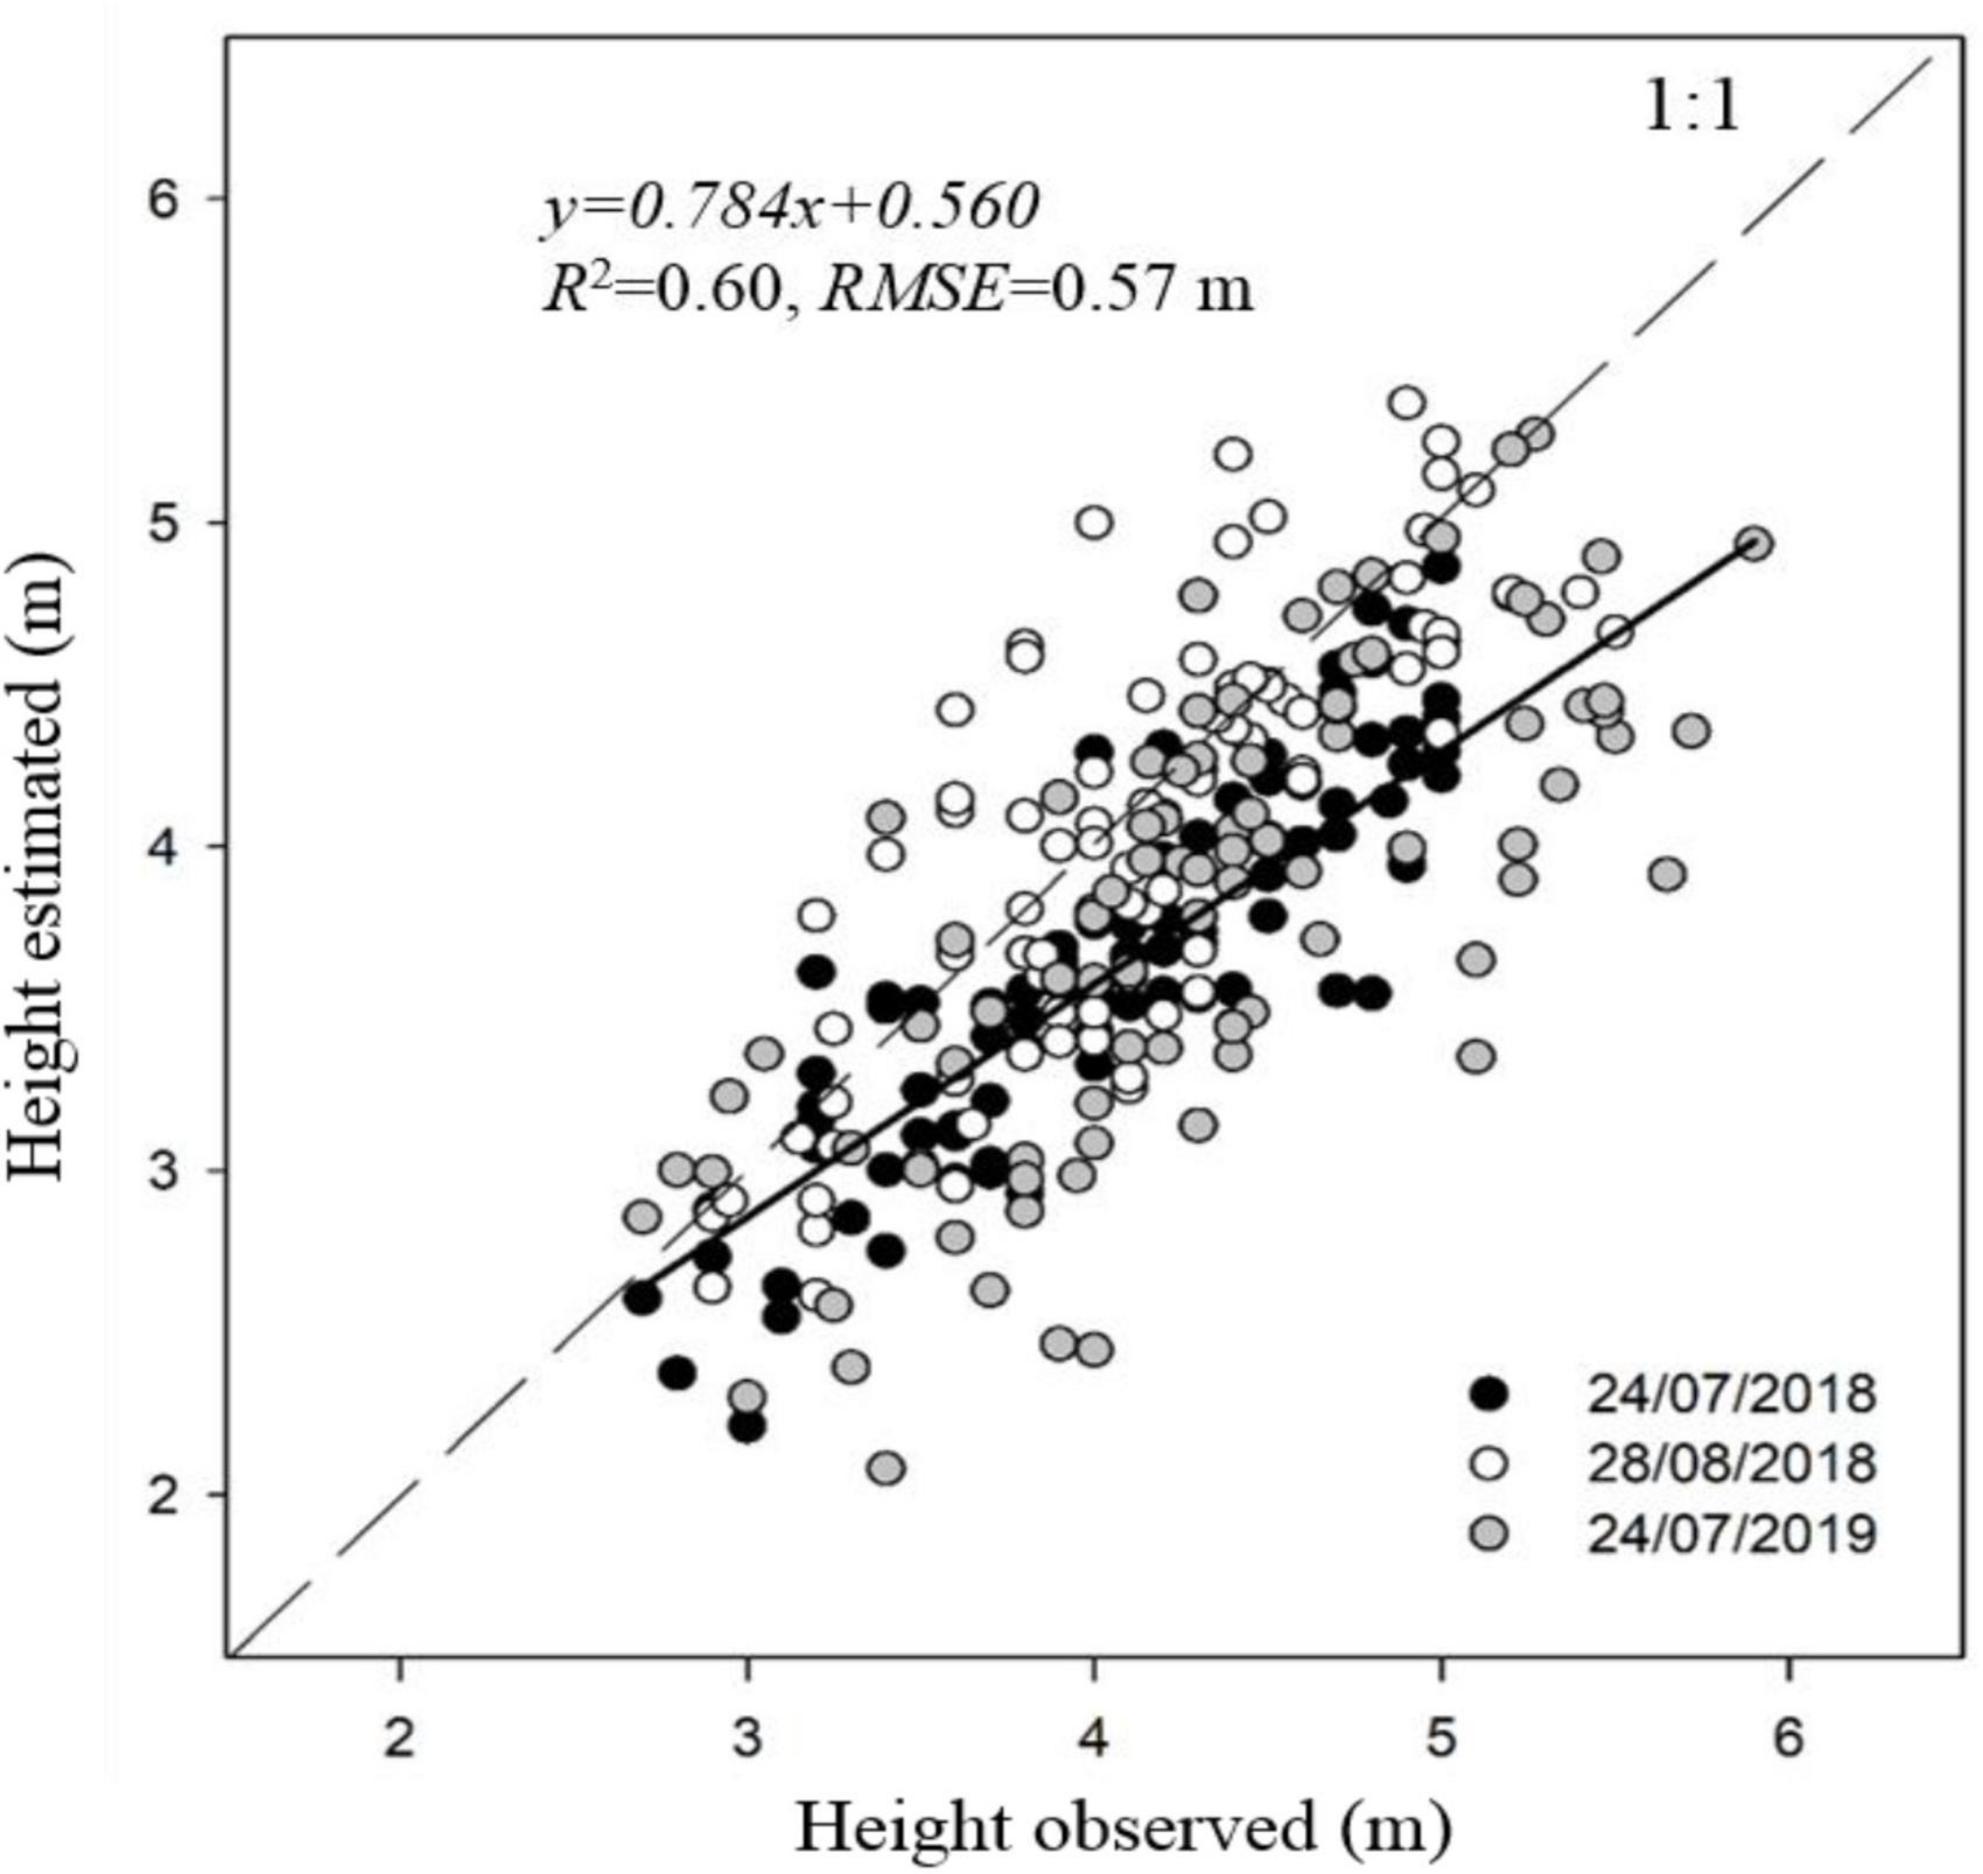
Figure 3. Comparison between ground measured and airborne-estimated maximum canopy height of almond trees on 24th July and 28th August 2018 and 24th July 2019. Linear regression corresponds to aggregated data of the three dates.
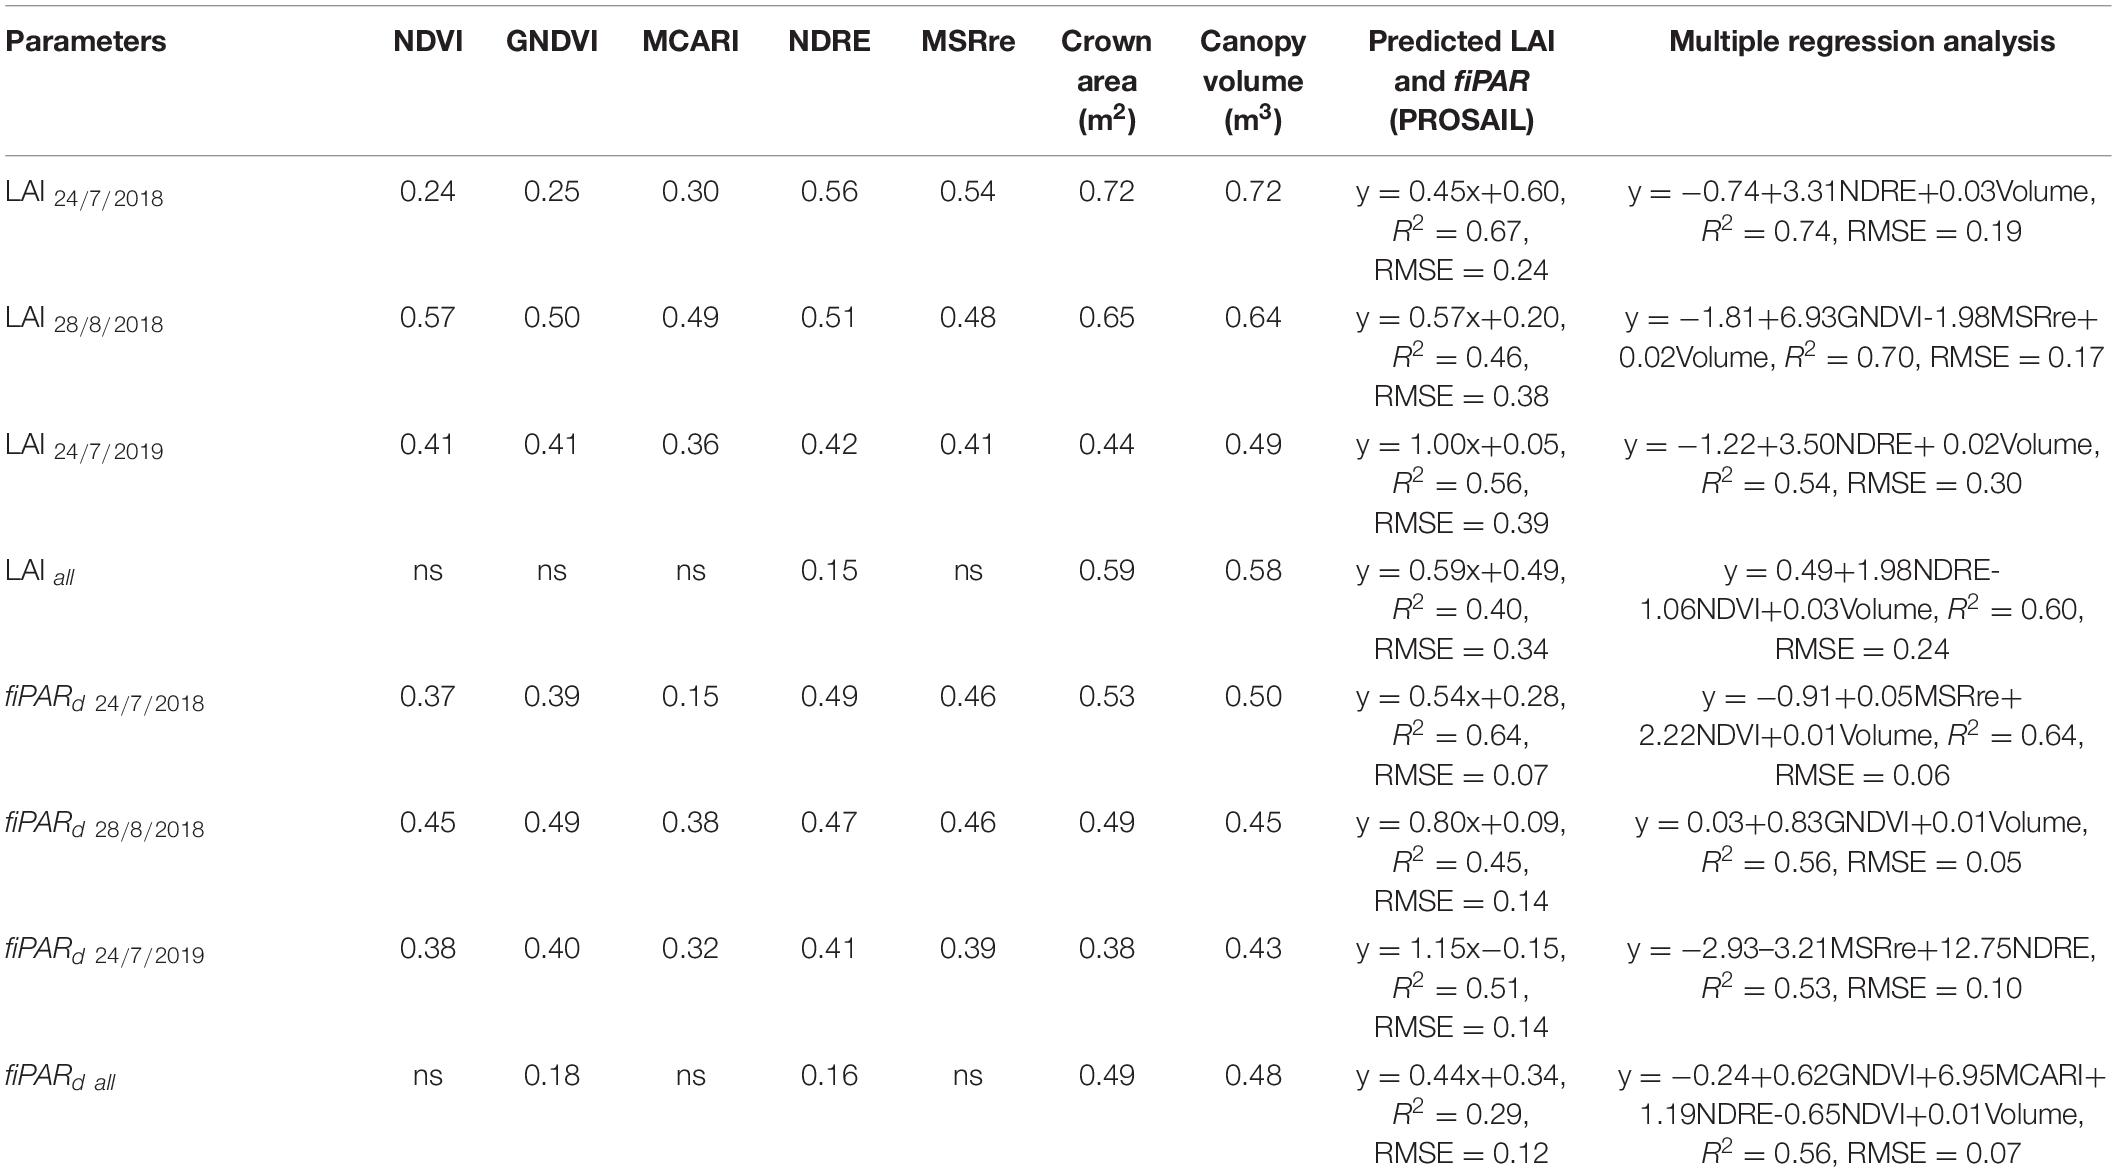
Table 4. Coefficients of determination (R2) of the regressions between leaf area index (LAI) and daily fraction of intercepted radiation (fiPARd) with spectral vegetation indices (VIs), crown area and canopy volume, PROSAIL radiative transfer model, and multiple regression analysis with empirical variables.
The multiple regression analysis using the empirical variables slightly increased the predictions of LAI and fiPARd in all cases. Results indicated that the best predictions were obtained when canopy volume was combined with other VIs, which varied between dates. Overall, the best predictions of LAI and fiPARd using the three dates of data together were observed with the multiple regression analysis. The R2 and RMSE were, respectively, 0.60 and 0.22 m m–1 for LAI and 0.56 and 0.07% for fiPARd (Table 4 and Figure 4).
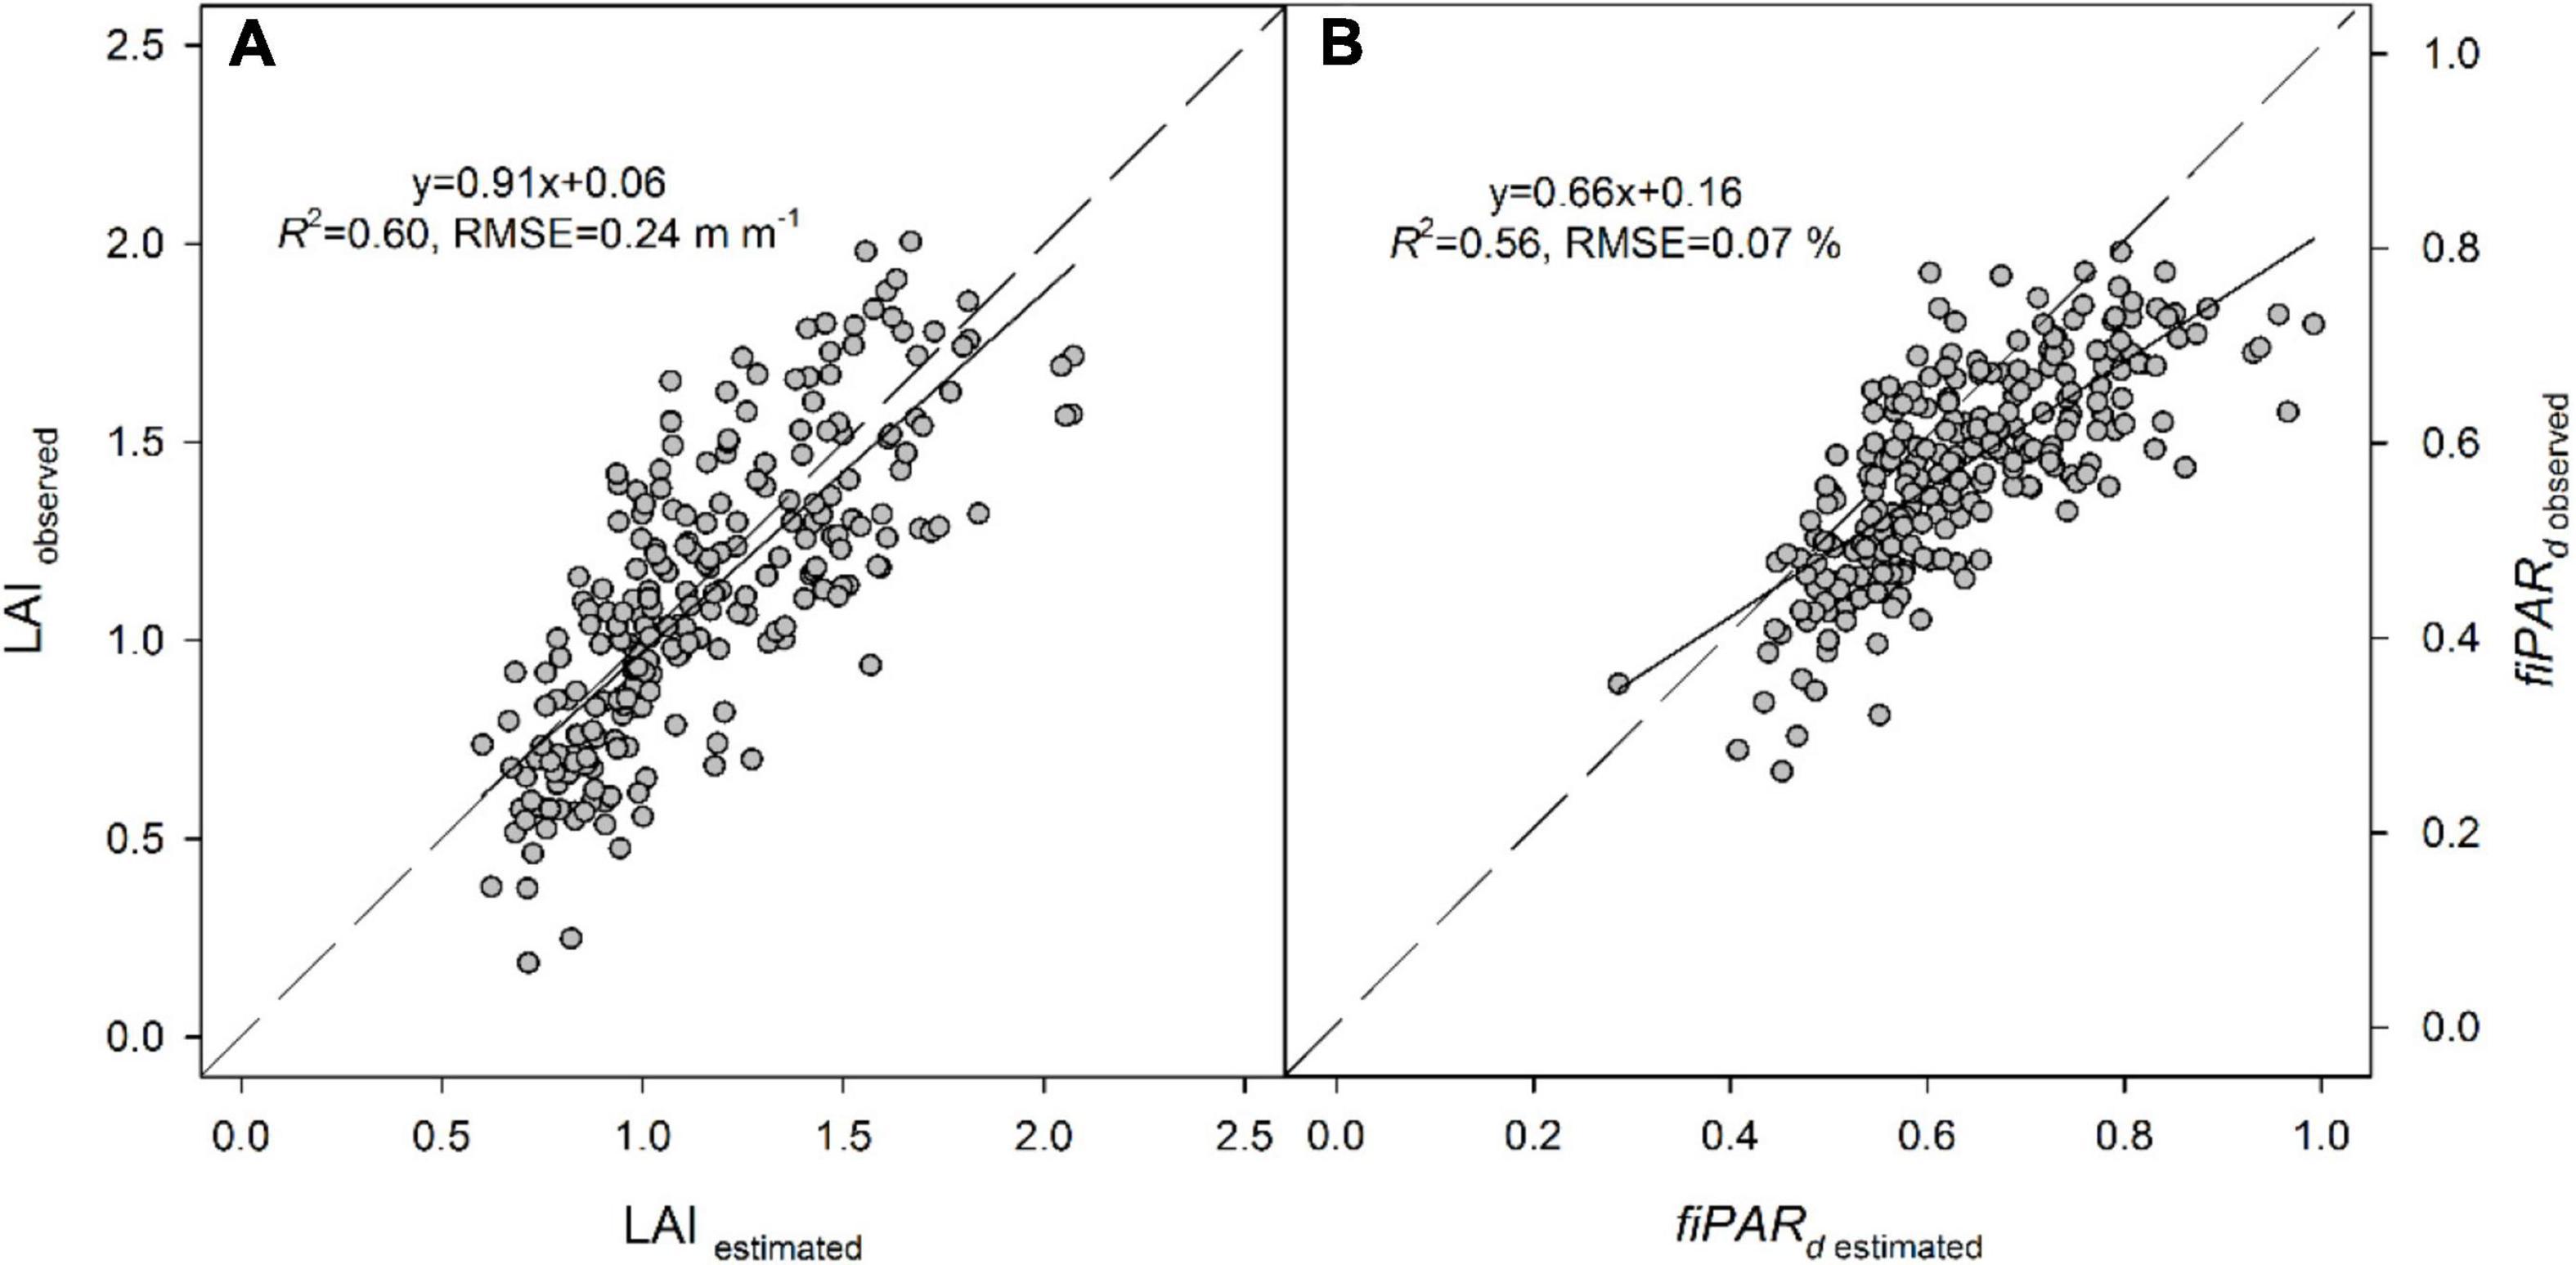
Figure 4. Relationships between observed and estimated (A) LAI and (B) fiPARd in almond trees, calculated from the equations obtained in the multiple regression analysis for the three dates together (LAI = 0.49+1.98NDRE-1.06NDVI+0.03Volume; fiPARd = –0.24+0.62GNDVI+6.95MCARI+1.19NDRE-0.65NDVI+0.01Volume).
Comparison Between Rootstocks
The analysis of variance showed that the rootstock source was significant for all the evaluated variables (p < 0.0001) and that the treatment x rootstock interactions were not significant, except for Ψstem (Table 5). Significant differences between treatments and for the date x treatment interaction were also observed for Ψstem (p < 0.0001). The remotely sensed estimates of crown area, canopy volume, LAI and fiPARd were significant for the interaction date x rootstock. The date source was also significant for ETa, ETa/fiPARd, and kernel yield.
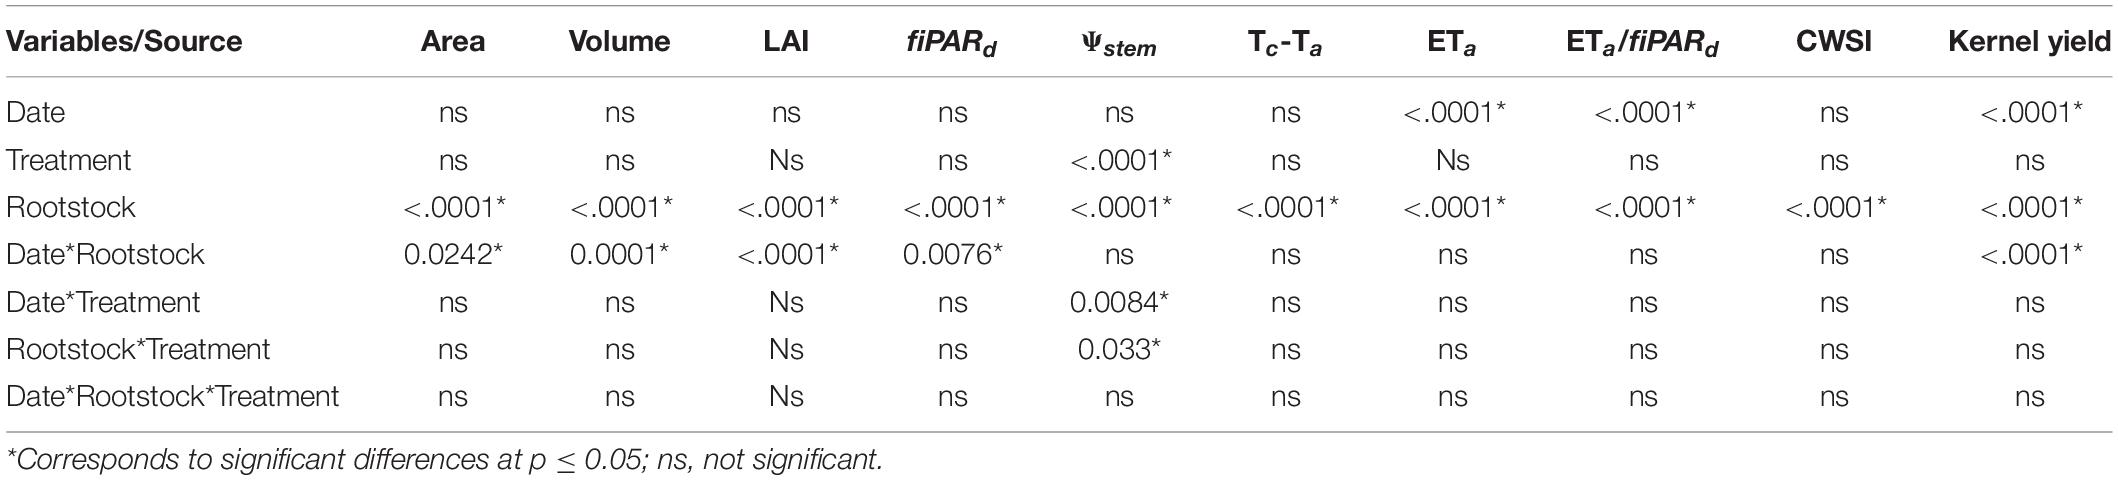
Table 5. Results of an analysis of variance (three-way ANOVA) testing the factor effects (date, treatment and rootstock) on the different variables estimated through remote sensing.
Overall, Cadaman® and Garnem® had the highest crown area, canopy volume, LAI and fiPARd, followed by INRA GF-677 (Table 6). On the other hand, Rootpac® 20 had the lowest values for all the evaluated variables. Non-significant differences were detected between IRTA 1, IRTA 2, Ishtara®, Rootpac® R, Rootpac® 40, and Adesoto. Figure 5 shows the significant differences in Ψstem between rootstock and irrigation treatments. The results show that Rootpac® R and Rootpac® 20 were the two rootstocks with the lowest Ψstem for the three measured dates. However, the latter had slightly lower values, mostly during 2018. On the other hand, Garnem®, Cadaman®, Adesoto, INRA GF-677, IRTA 1, IRTA 2, and Rootpac® 40 displayed similar behavior for the three dates, showing the highest Ψstem values. Measurements conducted on 24th July 2018 showed significant differences between treatments in Adesoto, IRTA 1, Ishtara® and Rootpac® 20. Significant differences in Ψstem for 28th August 2018 were only observed in INRA GF-677 and Rootpac® 40. On 24th July 2019, all rootstocks except Garnem®, IRTA 2 and Rootpac® R had significant differences in Ψstem between irrigation treatments. In all cases, the I0 treatment tended to have the lowest Ψstem values.
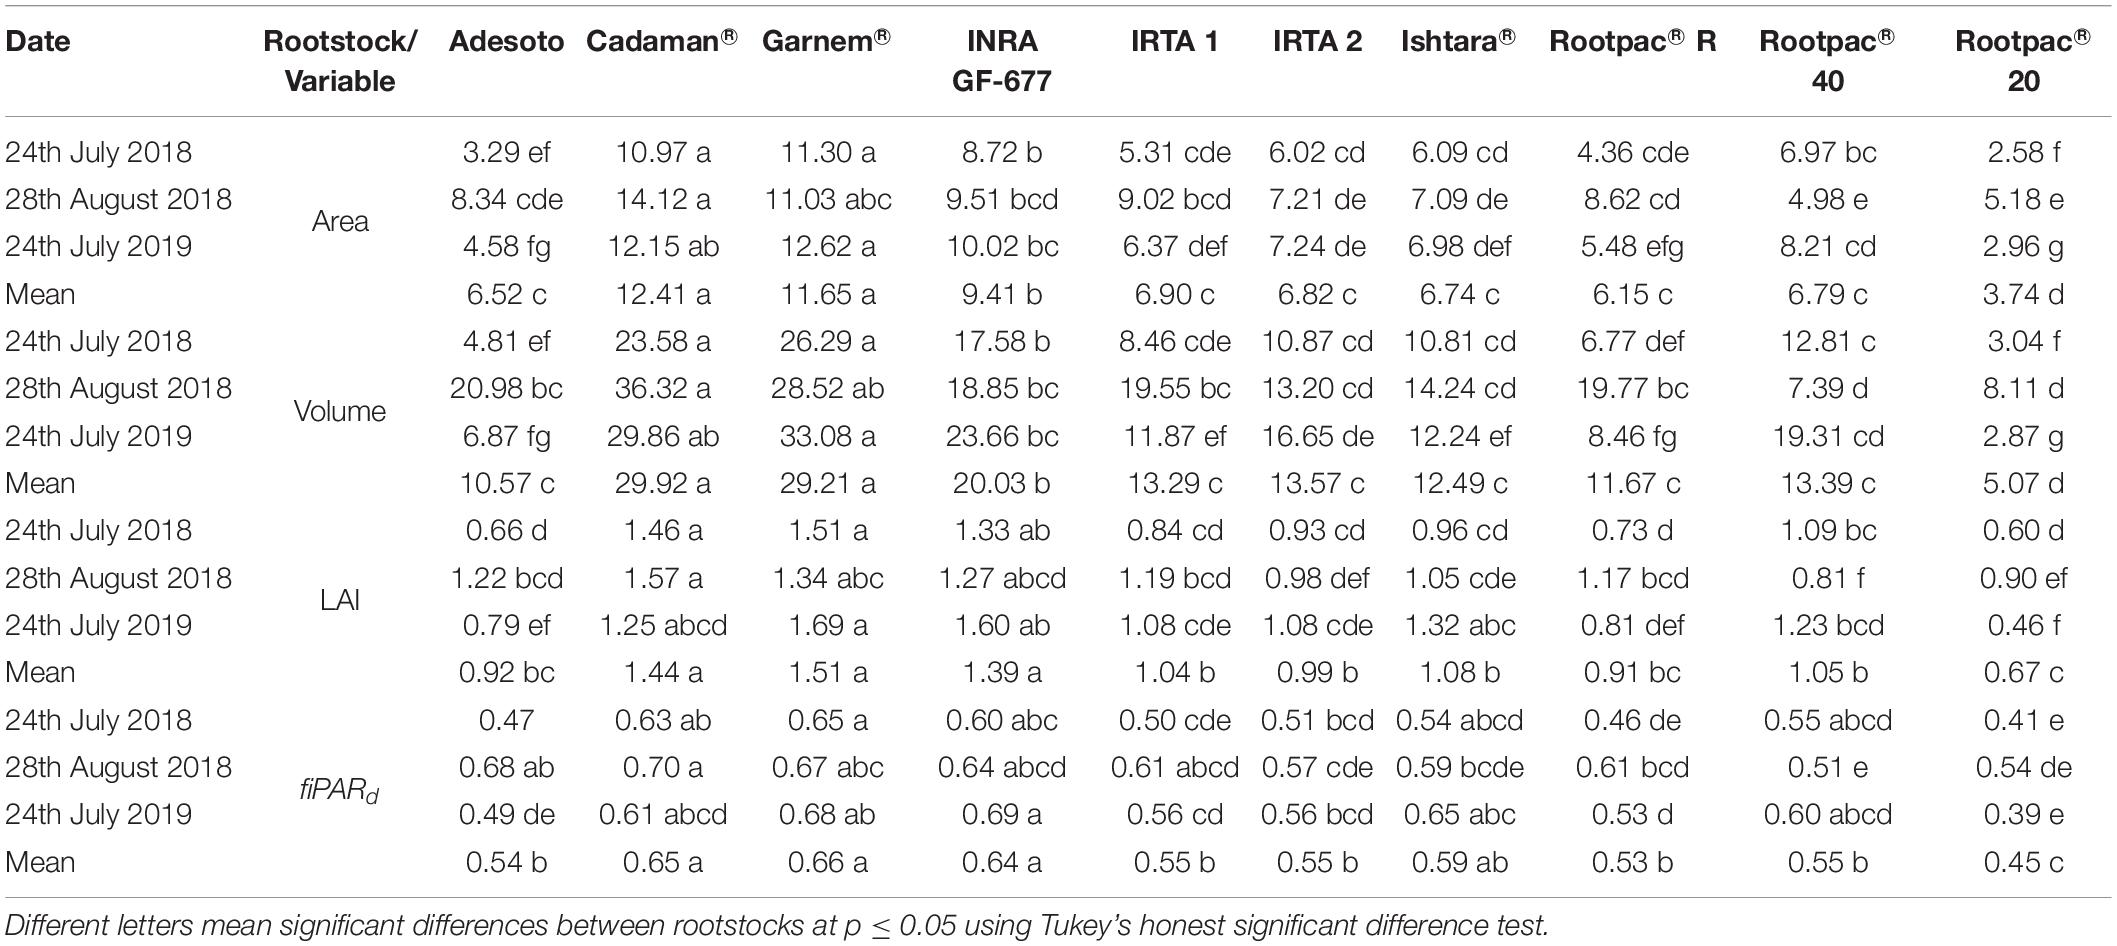
Table 6. Comparison of crown area, canopy volume, leaf area index (LAI) and daily fraction of intercepted radiation (fiPARd) between almond rootstocks for each image acquisition date.
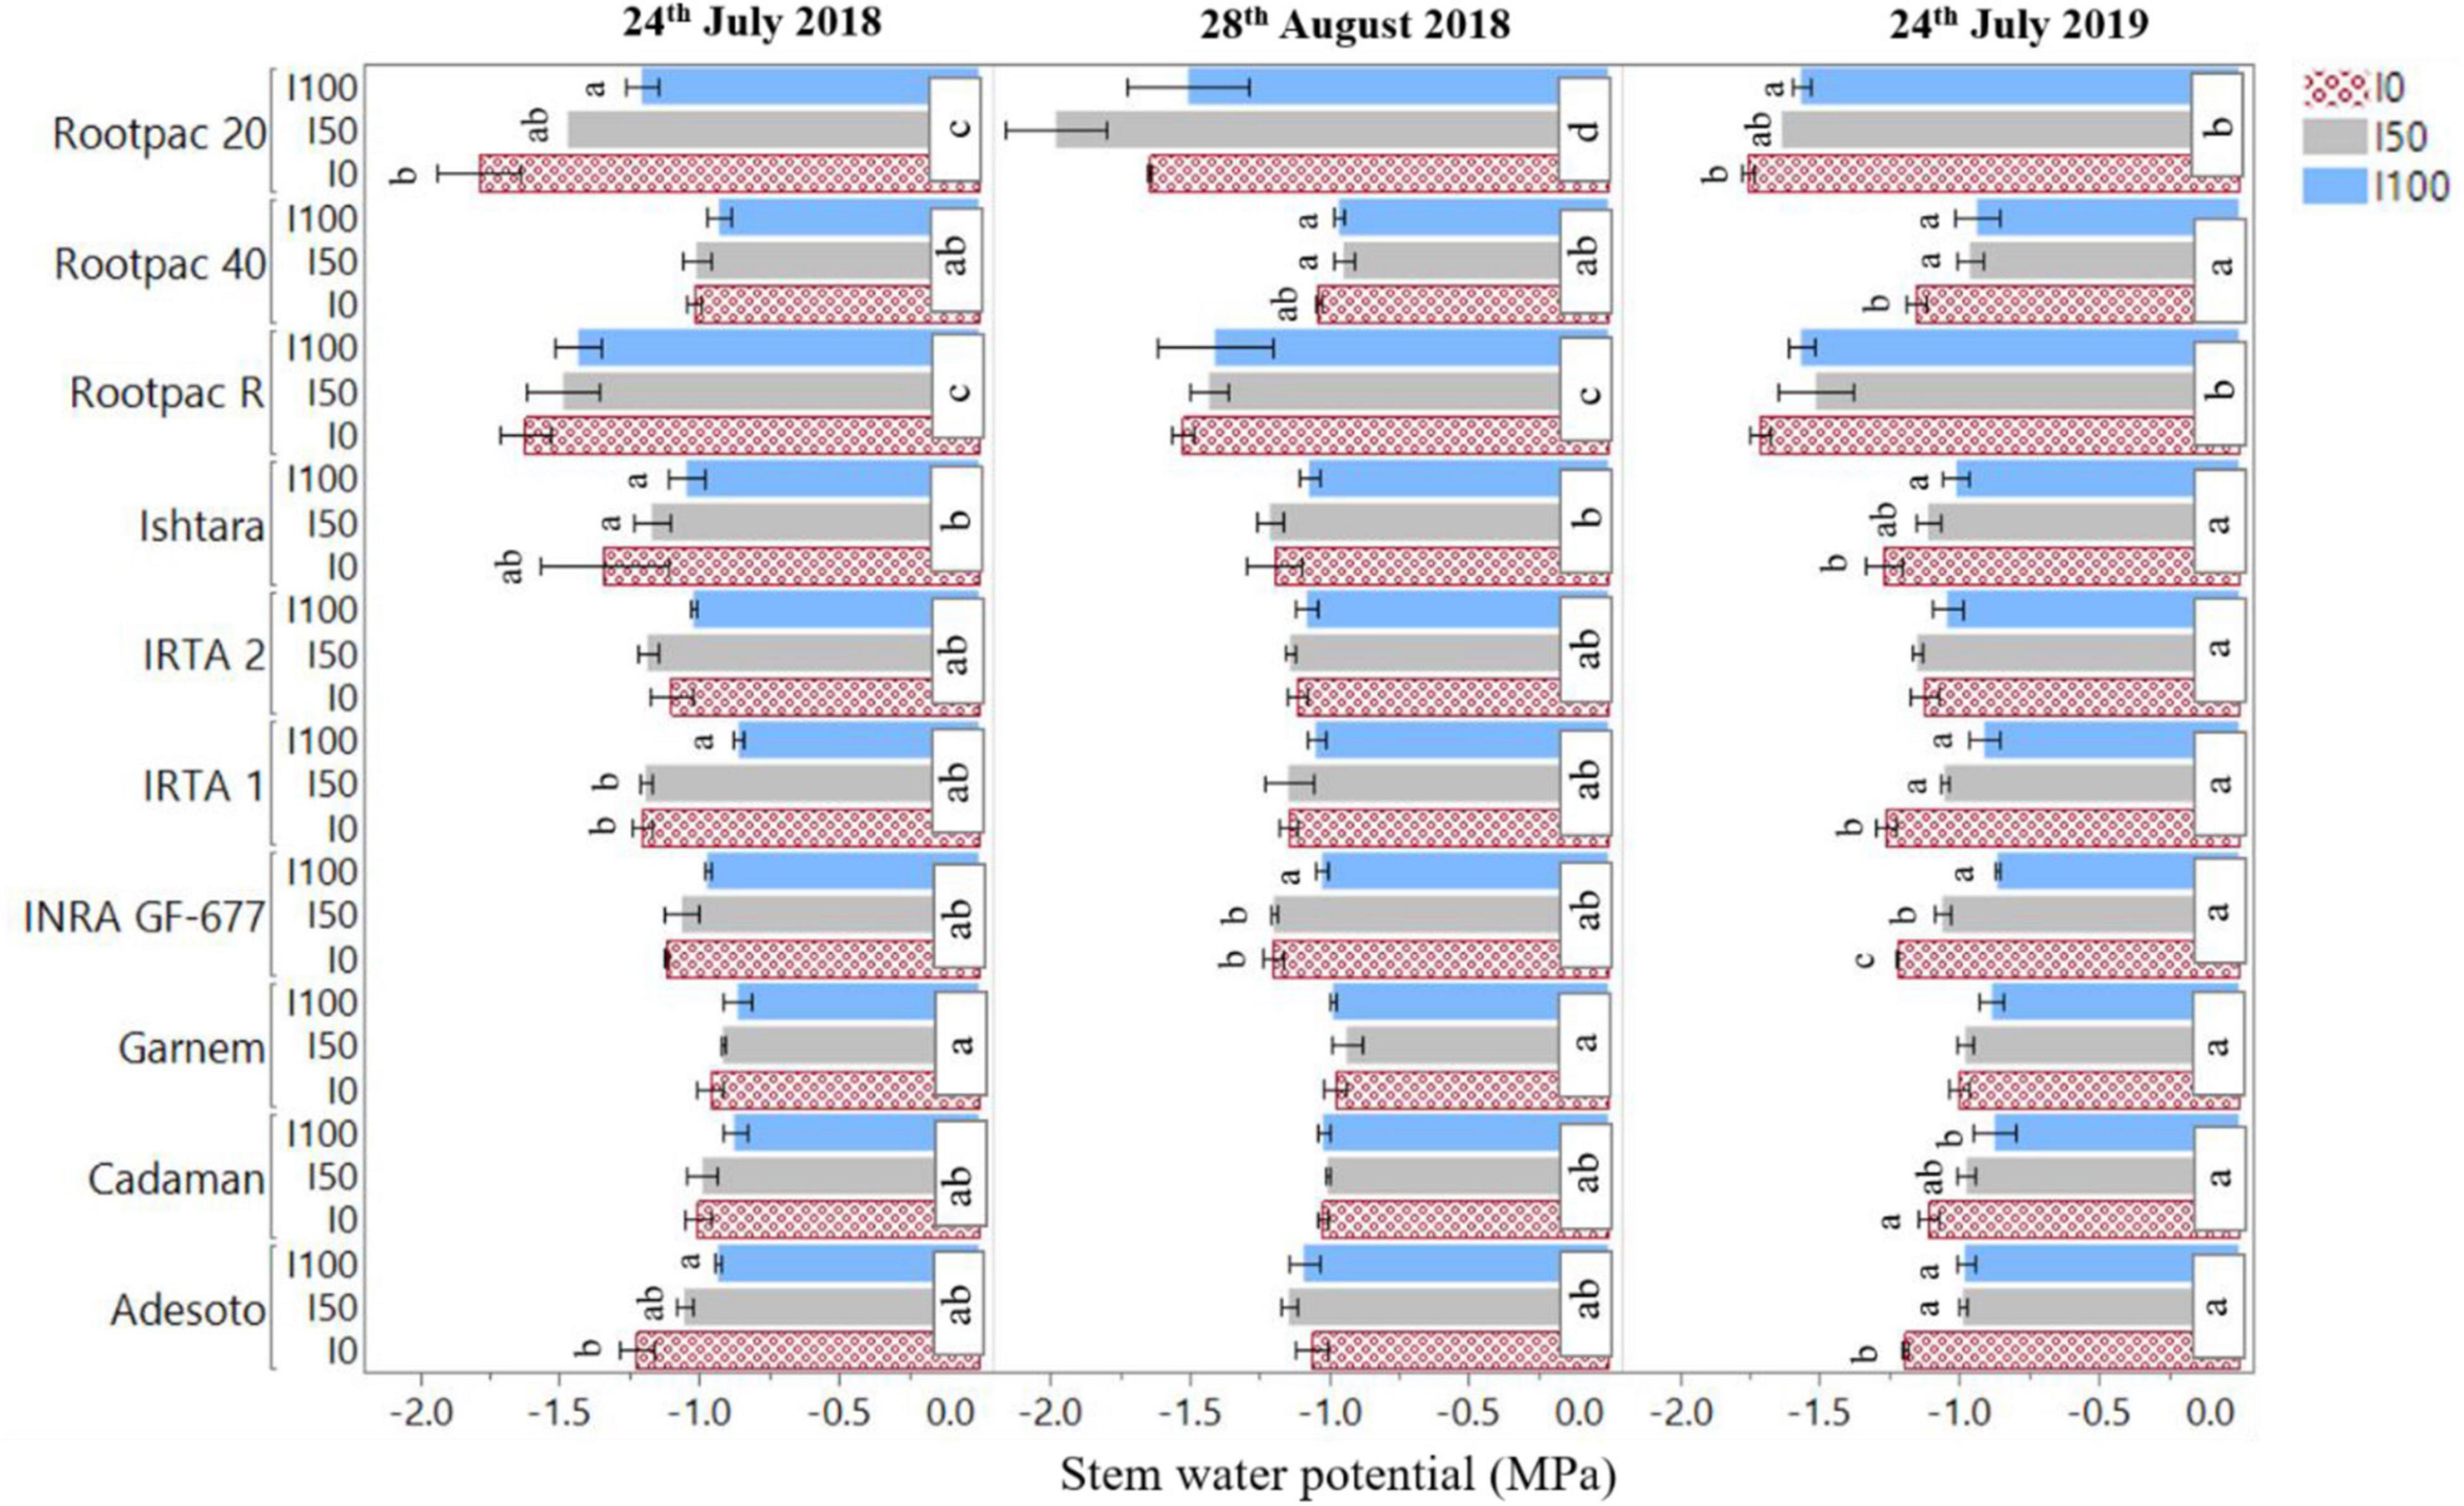
Figure 5. Differences in stem water potential (Ψstem) between rootstock and irrigation treatments (I100, I50, I0) for the three dates of image acquisition (24th July and 28th August 2018 and 24th July 2019). Letters indicate statistically significant differences between rootstock (P < 0.05, Tukey’s HSD test).
Among other parameters, LAI and Tc are inputs required by the TSEB model to estimate the ETa of a crop. In this study, differences in canopy to air temperature (Tc-Ta) between rootstocks were also significant and agreed with Ψstem measurements. More specifically, the relationships between Tc-Ta and Ψstem had R2 values of 0.57, 0.60, and 0.53 for 24th July 2018, 28th August 2018 and 24th July 2019, respectively (graphs not shown). The relationships between ETa with Tc-Ta and LAI gave respective R2-values of 0.57 and 0.87 for 24th July 2018, 0.66 and 0.87 for 28th August 2018, and 0.63 and 0.68 for 24th July 2019 (graphs not shown). These results suggest that ETa had a stronger relationship with LAI than with Tc-Ta, probably due to the lack of range in Tc-Ta values. In fact, both ETa and ETp were also positive and linearly correlated with the canopy crown area (Figures 6A,B). Values of ETa ranged from 1.8 to 8 mm day–1, depending on date and rootstock. For a given crown area, ETa values varied between dates, with ETa rates corresponding to 28th August 2018 lower than those of 24th July 2018 and 24th July 2019 (Figure 6A). These differences in ETa between dates were more pronounced as crown area increased. The highest ETa and ETp were observed in Cadaman® and Garnem® in the three dates, followed by INRA GF-677. On the other hand, Rootpac® 20 was the rootstock with the lowest ETa and ETp. Adesoto and Rootpac® R also had low ETa and ETp values. When differences between dates were atmospherically normalized through the CWSI, all the data followed the same polynomial regression, indicating that rootstocks with a low crown area (Rootpac® 20) also seemed to be more stressed than those with higher crown areas (Cadaman® and Garnem®) (Figure 6C). Maximum CWSI values reached ∼0.6 for trees with a crown area of ∼2.5 m–2. The relationship between averaged ETa and Ψstem was significant (Figure 7A), as was the regression between CWSI and Ψstem (Figure 7B). These regressions indicate that trees grafted on the least vigorous rootstocks (Rootpac® 20 and Rootpac® R) were also those with the lowest Ψstem values. Accordingly, these two rootstocks also had the highest CWSI and lowest ETa rates, with values ranging from 1.4 to 5.3 mm day–1. Of these two rootstocks, Rootpac® 20 had the lowest Ψstem and ETa.
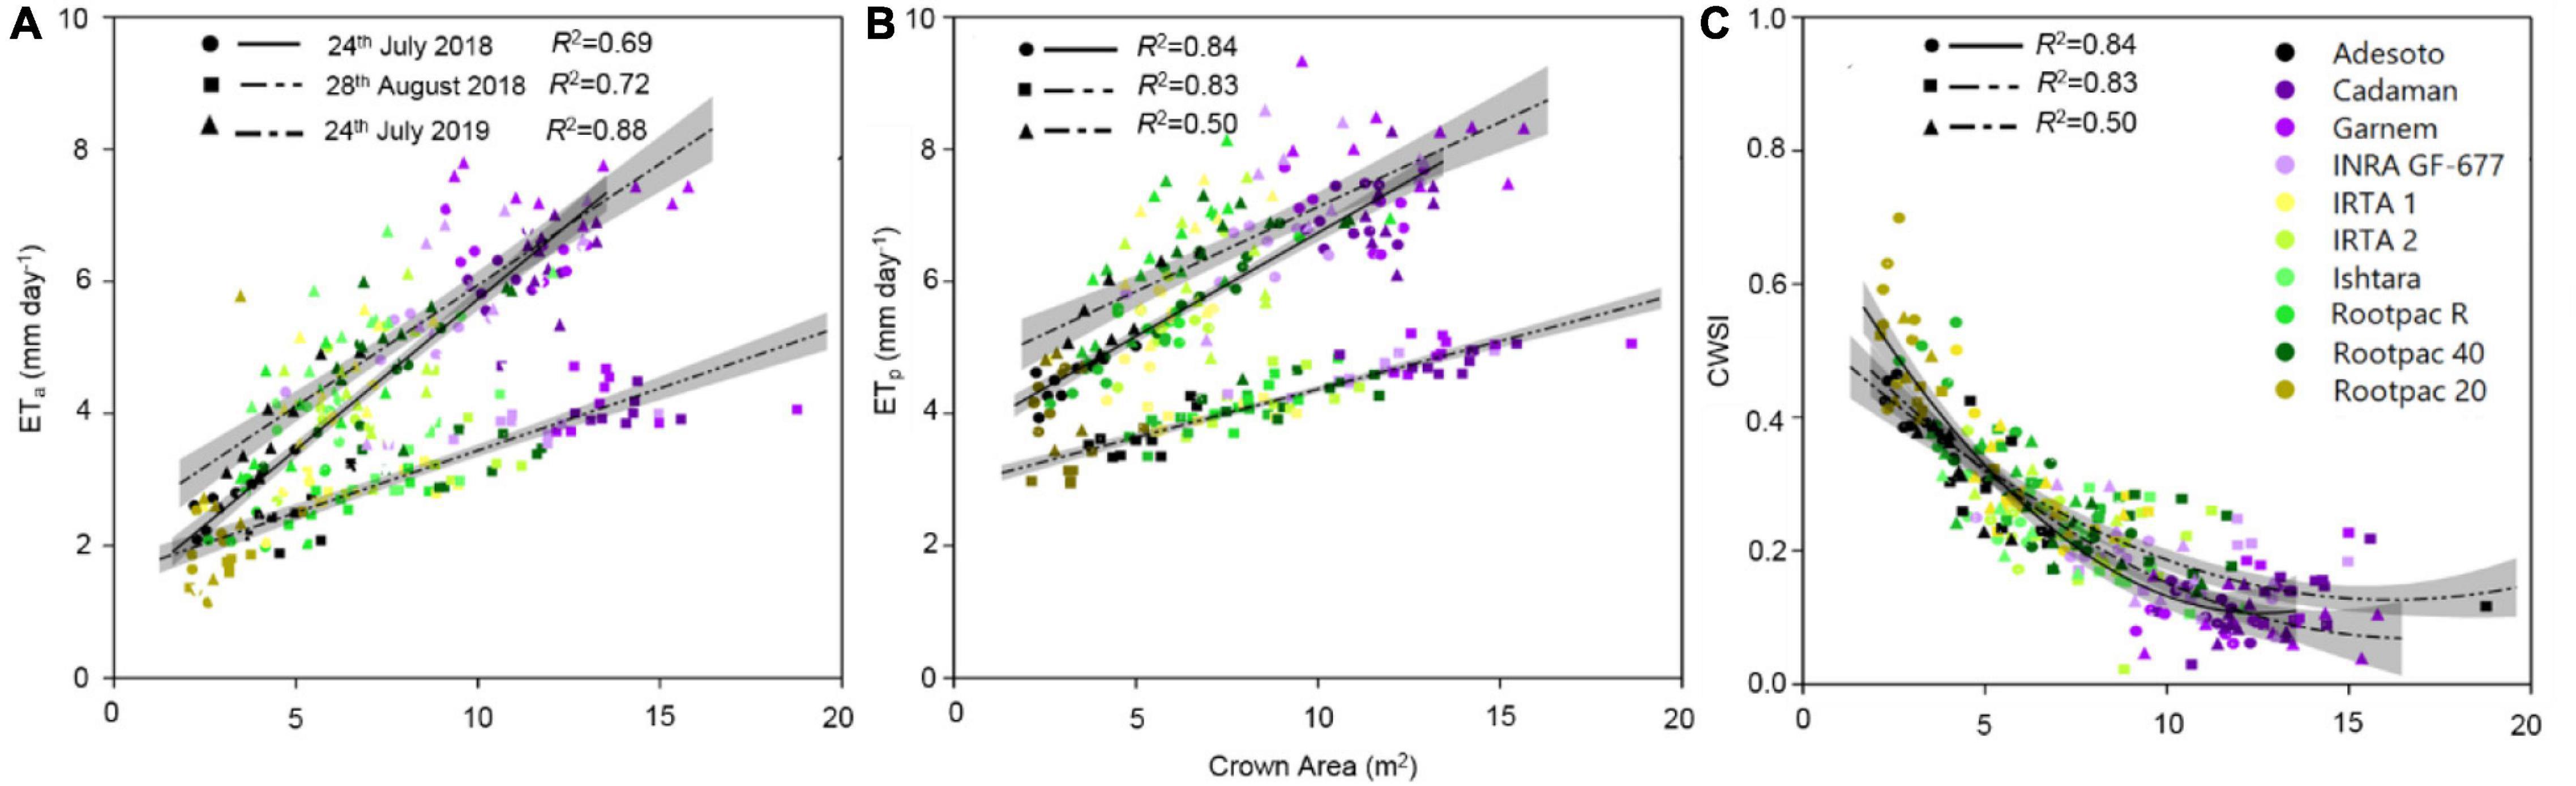
Figure 6. Relationships between estimated canopy crown area and (A) actual evapotranspiration (ETa), (B) potential evapotranspiration (ETp) and (C) CWSI, calculated as 1-ETa/ET0, for the three dates of image acquisition (24th July 2018 and 2019 and 28th August 2018). Shadowed lines indicate the 95% confidence intervals of the regression models.
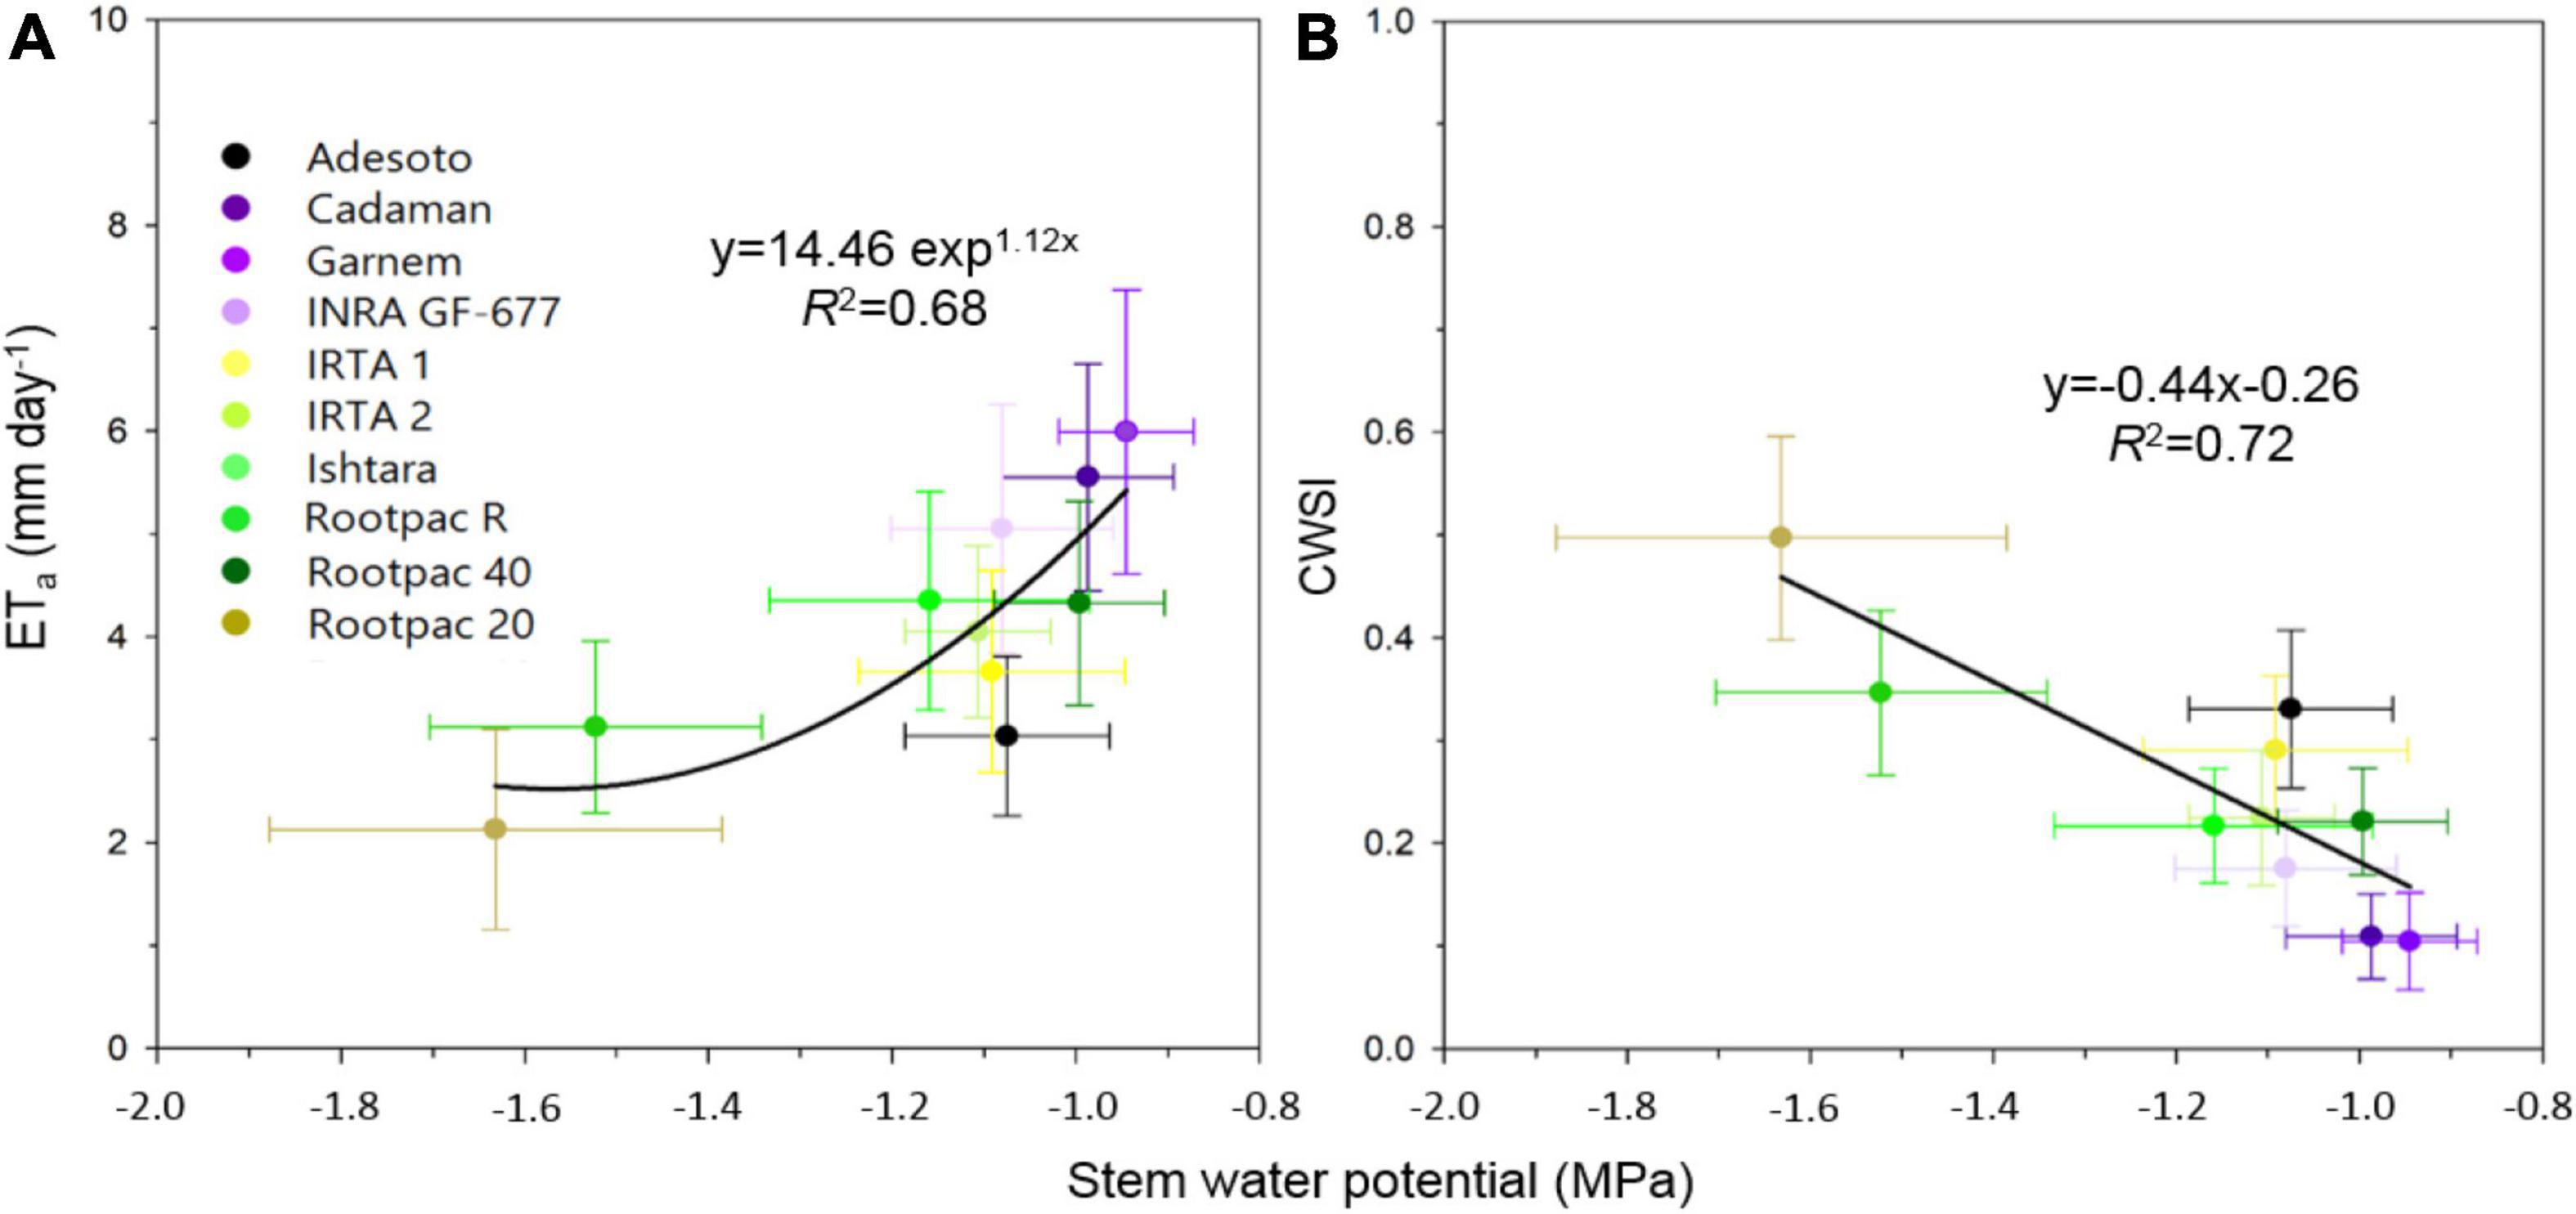
Figure 7. Relationships between stem water potential (Ψstem) and (A) actual evapotranspiration (ETa), and (B) crop water stress index (CWSI) calculated as 1-ETa/ETp.
It can be seen in Figure 8A that kernel yield was positively linearly related to ETa in both years, although the R2 varied between them. It can also be seen that kernel yield tended to decrease as CWSI increased, reaching minimum yields at CWSI values of around 0.5–0.7 (Figure 8B).
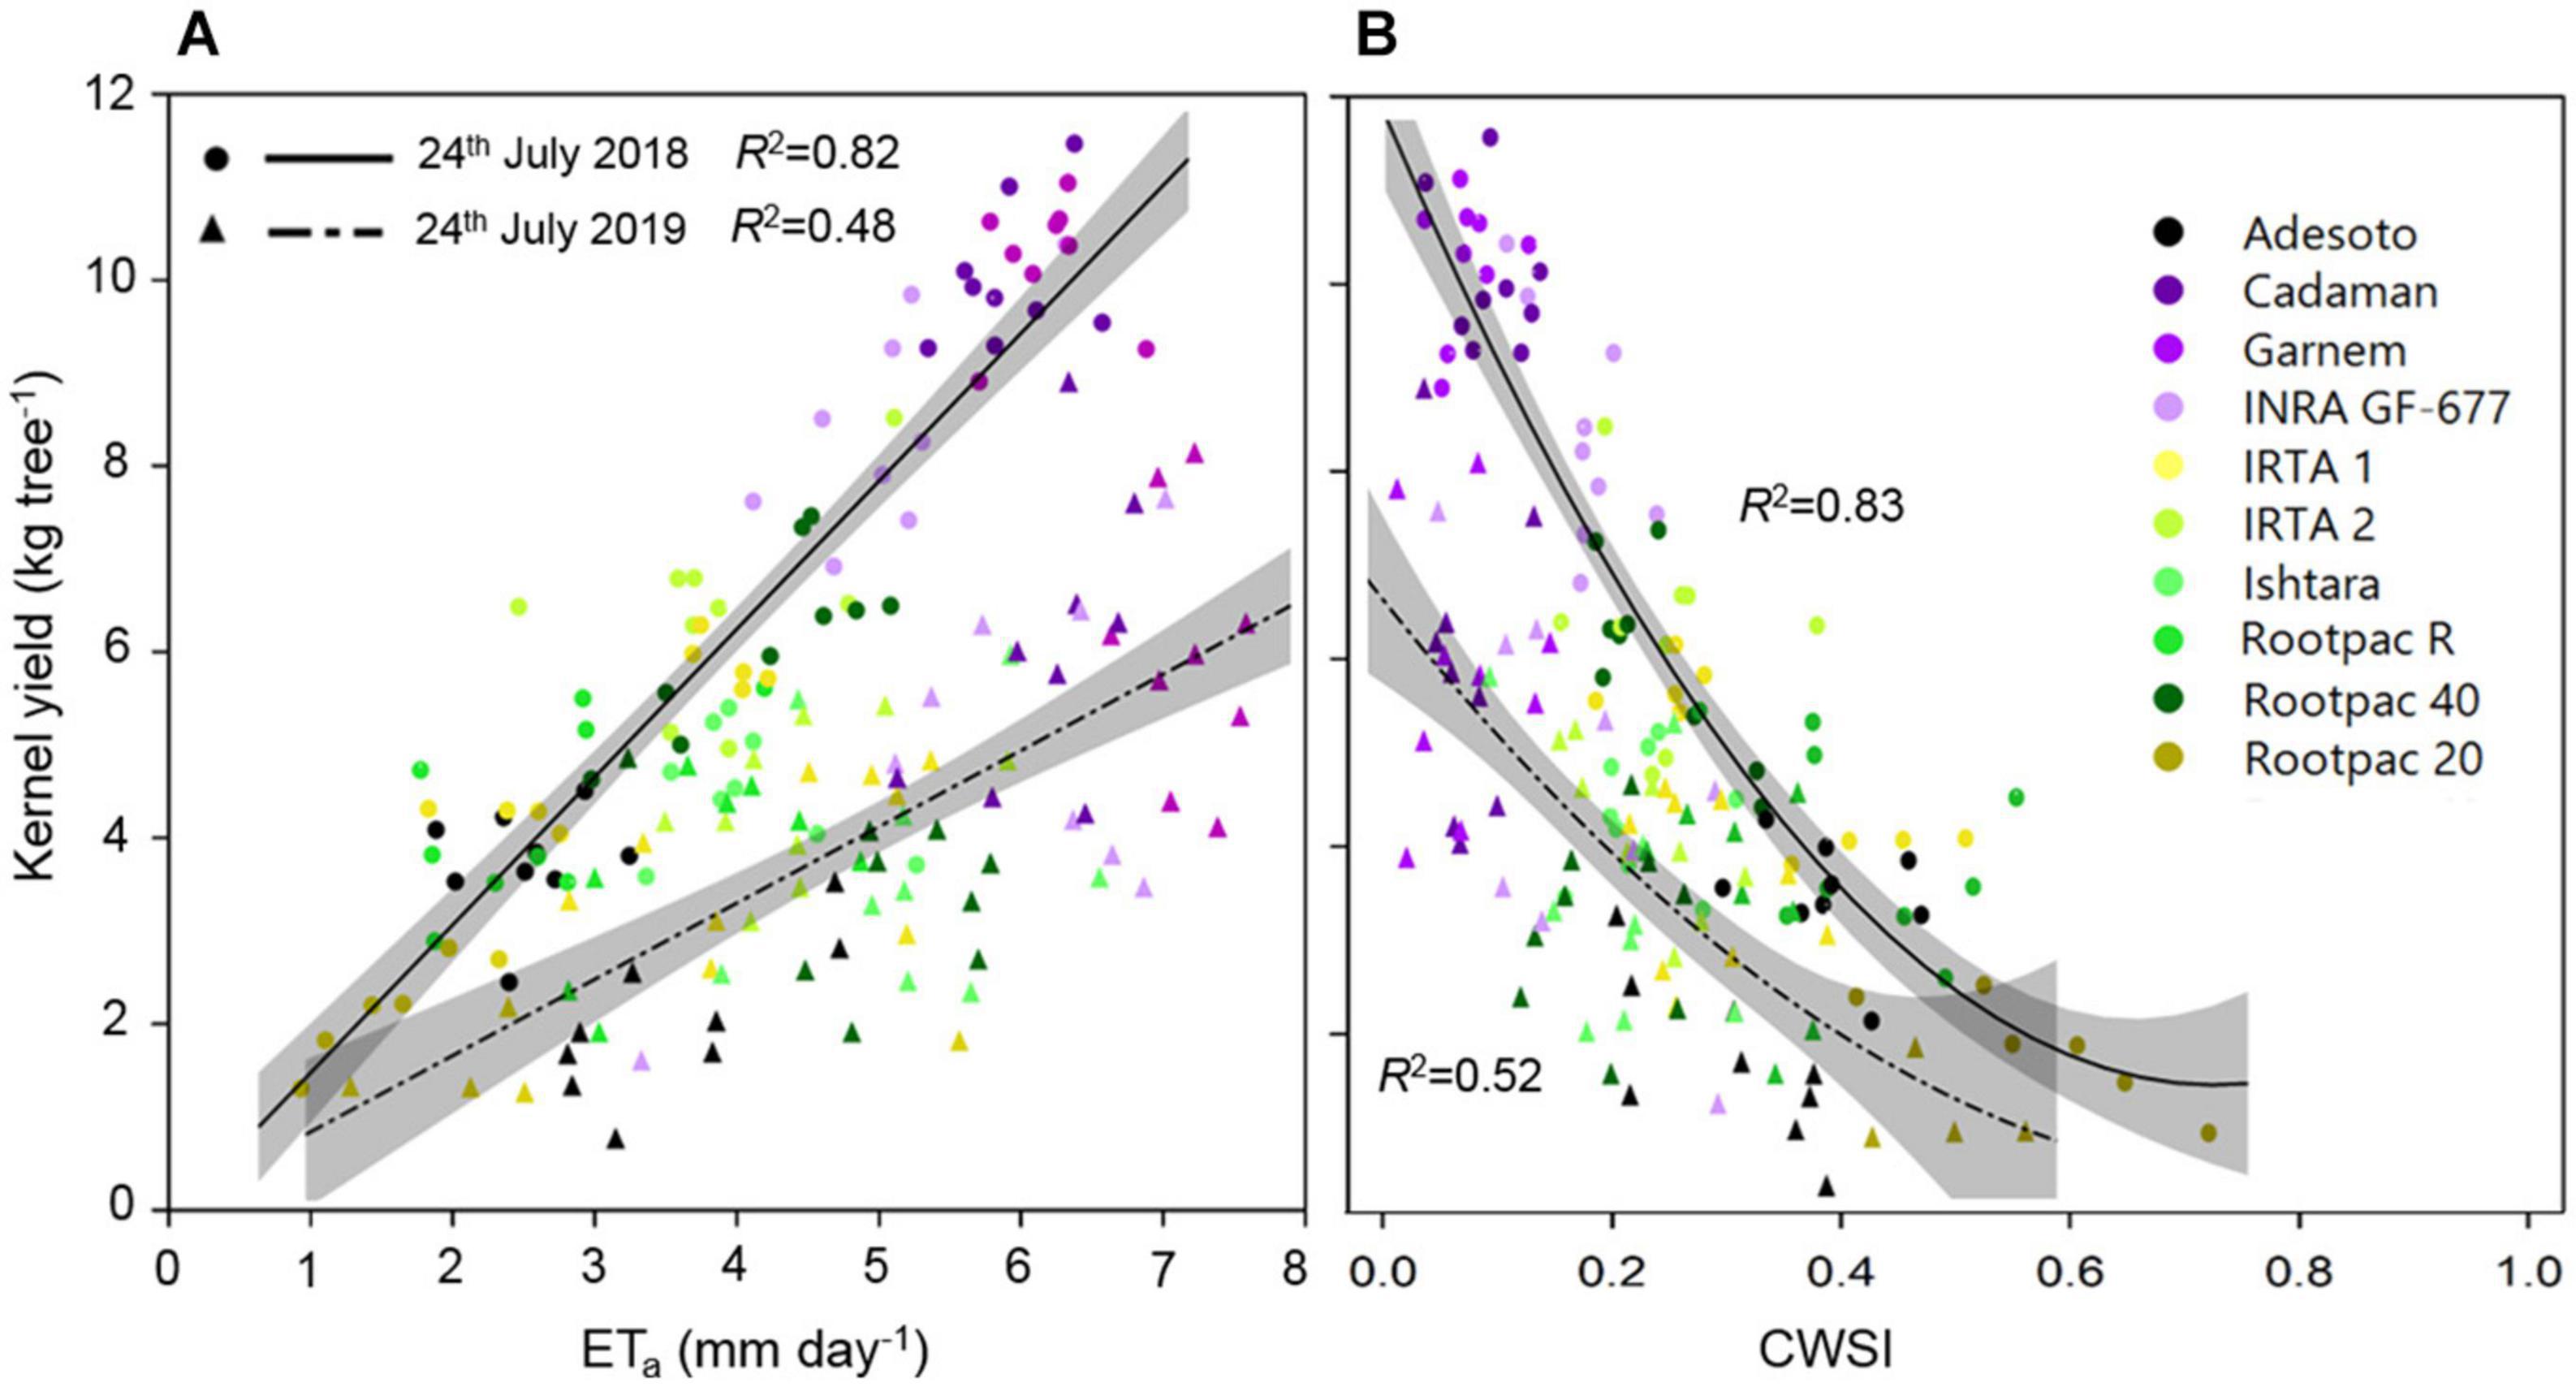
Figure 8. Relationships between kernel yield (kg tree–1) and (A) actual evapotranspiration (ETa) and (B) CWSI of the different rootstocks estimated on 24th July 2018 and 2019. Shadowed lines indicate the 95% confidence intervals of the regression models.
Discussion
The effect of rootstock on tree canopy vigor has been widely reported through in situ measurements of TSCA, canopy volume or LAI (Russo et al., 2007; Gullo et al., 2014; Mestre et al., 2015; Yahmed et al., 2016; Lordan et al., 2019). However, this study demonstrates the feasibility of using very high-resolution multispectral airborne imagery to estimate the architectural traits of the vegetation in an almond rootstock trial and to use them to estimate ETa.
The results confirm that the best fit to estimate LAI and fiPARd was through the combination of information derived from photogrammetry and VIs (Table 4). The highest R2 values with both LAI and fiPARd were obtained when photogrammetric techniques were used to estimate crown area and canopy volume. Since the latter depends on canopy height, which showed an RMSE of 0.57 m (Figure 3), it is possible that any advance in accuracy when estimating canopy height could also contribute to improving estimates of LAI and fiPARd. Increasing the number of images acquired from different viewing angles, higher overlap, or lower flying altitude in order to describe the full 3D scene and avoid occlusion effects are some of the ways that could help to improve canopy height estimates. Other authors have been able to estimate canopy height with greater accuracy. For instance, Zarco-Tejada et al. (2014) and Caruso et al. (2019) obtained RMSE values of 0.22 and 0.35 m, respectively, in olive trees. However, the difference between these two studies and ours was flight altitude (∼130 m of difference) and the trajectories taken by the unmanned aerial vehicle platform which ensured larger image overlaps and point cloud densities.
The use of the PROSAIL model did not improve the estimates of LAI and fiPARd in comparison to the multiple regression analysis, probably because this model was not designed for sparse canopies with multiple layers, as is the case of almond orchards (Berger et al., 2018). Until now, PROSAIL has been mostly used to estimate LAI and fiPAR with multispectral satellite imagery in non-woody vegetation canopies such as croplands (Duan et al., 2014; Li et al., 2015) and grasslands (Darvishzadeh et al., 2008; Casas et al., 2014), as PROSAIL assumes a homogeneous canopy of randomly placed leaves. However, the model has barely been used in woody crops in combination with very high resolution airborne multispectral imagery. This study also showed that PROSAIL tends to overestimate LAI (Table 4).
On the other hand, it is well-established that VIs are strongly influenced by canopy architecture, optical properties, sun illumination angle, viewing properties and soil background (Huete, 1988; Guillen-Climent et al., 2012; Xie et al., 2018; Prudnikova et al., 2019). In addition, saturations at moderate-to-dense canopies, leaf area distribution, and clumping effect are three of the most important issues influencing the accuracy of optical LAI estimates in row crops (Delalieux et al., 2008; Shafian et al., 2018; Yan et al., 2019). For instance, our study showed that NDVI, GNDVI and MCARI had low R2 with LAI and fiPARd on 24th July 2018, probably caused by a soil background effect. The previous week, and up to 3 days before the flight, a series of rainfall events occurred at the study site amounting to a total precipitation value of 20.2 mm. These events resulted in the moist soil (i.e., “darker”) absorbing more light than other days, mostly in the visible and NIR bands, and therefore affecting the values provided by the indices that used these bands. On the other hand, since most of these parameters are taken into consideration in the PROSAIL model, estimates of LAI and fiPARd tended to be better and more consistent over time, although with a systematic overestimation. The methodology used in this study to obtain the biophysical variables of the vegetation was the same as that developed for the Sentinel-2 toolbox (Weiss and Baret, 2016). In that case, a database containing the input radiative transfer model variables was generated first. Then, the corresponding top-of-canopy reflectance for the eight Sentinel-2 bands were simulated with the PROSAIL model. In contrast, in our study we used the six bands derived from the MACAW multispectral sensor. It is also possible that the use of different and a lower number of bands slightly affected the estimates of the biophysical variables.
In this study, all the estimates of the structural parameters of the vegetation indicated that the most dwarfing rootstock was Rootpac® 20, followed by Rootpac® R, Rootpac® 40, Adesoto, Ishtara, IRTA 1, and IRTA 2. Garnem®, Cadaman®, and INRA GF-677 provided the highest values for the same structural traits. These results are in agreement with, for instance, those reported by Lordan et al. (2019), who evaluated tree canopy vigor in the same rootstock trial for a longer period and also identified Garnem®, Cadaman® and INRA GF-677 as those with the greatest tree volume, and Rootpac® 20 as the most dwarfing rootstock in the trial. In agreement, Yahmed et al. (2016) also observed that Garnem® and Rootpac® 40 were, respectively the most and medium vigorous rootstocks and that scions grafted on Rootpac® 20 were the most dwarfing.
The observed differences in ETa between dates could be attributable to changes in atmospheric water demand, plant response (stomatal closure) due to water stress, or some phenological effect. In this case study, water stress can be discarded because Ψstem values of the date with the lowest ETa (28th August 2018) were slightly less negative in comparison to the other two dates, and because the same behavior was observed with the estimates of ETp with the S-W model (Figure 6B). Our hypothesis for the lower ETa values observed for 28th August 2018 is that these are associated with a lower atmospheric demand of water, since the midday VPD and daily solar irradiance (Rs) for that day were slightly lower (VPD = 2.2 KPa and Rs = 195 W m–2) than the other 2 days (respectively, 2.9 KPa and 319 W m–2 for 24th July 2018 and 3.6 KPa and 294 W m–2 for 24th July 2019). Accordingly, Tc-Ta values for that day were also higher. Several studies have published non-water-stressed baselines (NWSB)for different crops, which consist in relating Tc-Ta with VPD at midday for well-watered trees (Bellvert et al., 2016; García-Tejero et al., 2018; Gonzalez-Dugo et al., 2019; Gutiérrez-Gordillo et al., 2020). These regressions indicate that Tc-Ta tended to decrease as VPD increased. In addition, Bellvert et al. (2018) showed that the regression between Tc-Ta and VPD in California almonds was sensitive to the phenology, indicating that for a given increase in VPD, early growth stages, which correspond to vegetative growth (shell expansion and hardening), have more transpiration cooling than the kernel and post-kernel filling stages.
Although the amount of water applied in the different irrigation treatments was the same for all rootstocks, the response of most of the evaluated parameters varied between rootstocks, particularly for Ψstem where the rootstock x treatment and date x treatment interactions were significant (Table 5). As seen in Figure 7, the least vigorous rootstocks (Rootpac® 20, Rootpac® R) had the lowest Ψstem and ETa values. However, Rootpac® 20 had slightly lowest Ψstem than Rootpac® R. These rootstocks are characterized by having Prunus cerasifera (myrobolan) as one of the parents, which may lead to a slight and delayed “localized” incompatibility between plum-almond species, as has previously been described in cherry and peach/plum (Treutter and Feucht, 1991) or almond/plum (Bernhard and Grasselly, 1959) combinations. This type of incompatibility is characterized by anatomical irregularities at the rootstock/scion union interface with breaks in vascular connections, which, in turn, prevent quick resumption of the growth of both root and canopy (Errea et al., 2001; Leonardi and Romano, 2004). It has also been demonstrated that trees grafted on dwarfing rootstocks such as Rootpac® 20 and Rootpac® R tend to have lower Ψstem values, and that this is likely related to the lower water absorption capability of the root system to satisfy the transpiration demand of the canopy (Yahmed et al., 2016). In our case, defoliation and yellowing problems were also observed in some trees of the I0 treatment. The lower Ψstem observed in Rootpac® 20 could be explained because this rootstock was obtained by crossing two plum species (Prunus besseyi× Prunus cerasifera), and therefore probably displaying a smaller root system, while Rootpac® R had a higher compatibility with the scion because at least has a Prunus dulcis as one of the parents.
In terms of WUE or drought tolerance, several studies have related canopy vigor and root system with the level of tolerance (Serra et al., 2014; Zhang et al., 2016). The hypothesis is that vigorous plants are usually more tolerant due to a bigger root system, and vice versa. However, a comparison between rootstocks with statistical differences in canopy vigor is not always the most appropriate method because both plant water demand and the amount of water available in the soil per unit of canopy vigor will differ depending on canopy size and may therefore lead to inappropriate interpretations of the results. In this study, in order to explain the differences between rootstocks, we grouped them according to canopy vigor (mean of canopy volume) (Table 7), and then analyzed the statistical differences in the relations between Ψstem and ETa within each group by using data of the three flights. A first group, which contained Garnem®, Cadaman® and INRA GF-677, was characterized by having the highest ETa rates due to high canopy volume and probably a longer root system which permitted a higher water absorption capacity. Concurring with this finding, Black et al. (2010) described Cadaman® as a rootstock with a high root biomass. The ANCOVA analysis showed no significant differences between rootstocks in the ETa vs. Ψstem regressions of the group 1 (p = 0.721) (Table 8). Despite of this, it seems that INRA GF-677 had slightly lower Ψstem and ETa values and a higher CWSI. A second group with medium canopy vigor rootstocks was composed of Rootpac® 40, Adesoto, IRTA 1, IRTA 2, Ishtara®, and Rootpac® R. Rootpac® R had by some way the lowest Ψstem values, which together with Adesoto and IRTA 1 corresponded with the lowest ETa rates, without significant differences among them. However, the low Ψstem of Rootpac® R suggests that this rootstock was acting as if it had a lower hydraulic conductivity or root biomass in comparison to the others which caused a fall in Ψstem. The ANCOVA analysis of group 2 only showed significant differences between rootstock in the intercept (p = 0.034) (Table 8). Therefore, as there were not significant differences between slopes, we cannot affirm that these rootstocks have differences in the root hydraulic resistance (Rroot). In order to improve our understanding of the response of rootstocks to water stress, future studies should be able to determine the hydraulic resistances of different rootstocks through measurements of water potential gradients and transpiration (López-Bernal et al., 2015). Differences in the intercept could be explained either due to still small differences in the canopy volume between rootstocks of group 2 or due to a physiological response related with an anisohydric or isohydric behavior. In fact, the rootstock with the significantly lower intercept (Adesoto) was the one with the lowest crown area (Figure 6). The last group consisted solely of Rootpac® 20, which had the lowest Ψstem and ETa values. Opazo et al. (2020) compared Rootpac® 20 and Rootpac® 40 and reported that plants grafted on the former had lower transpiration rates, less root biomass and proved to be less tolerant to drought than the latter. Results obtained in our study reinforce these observations (Table 7).
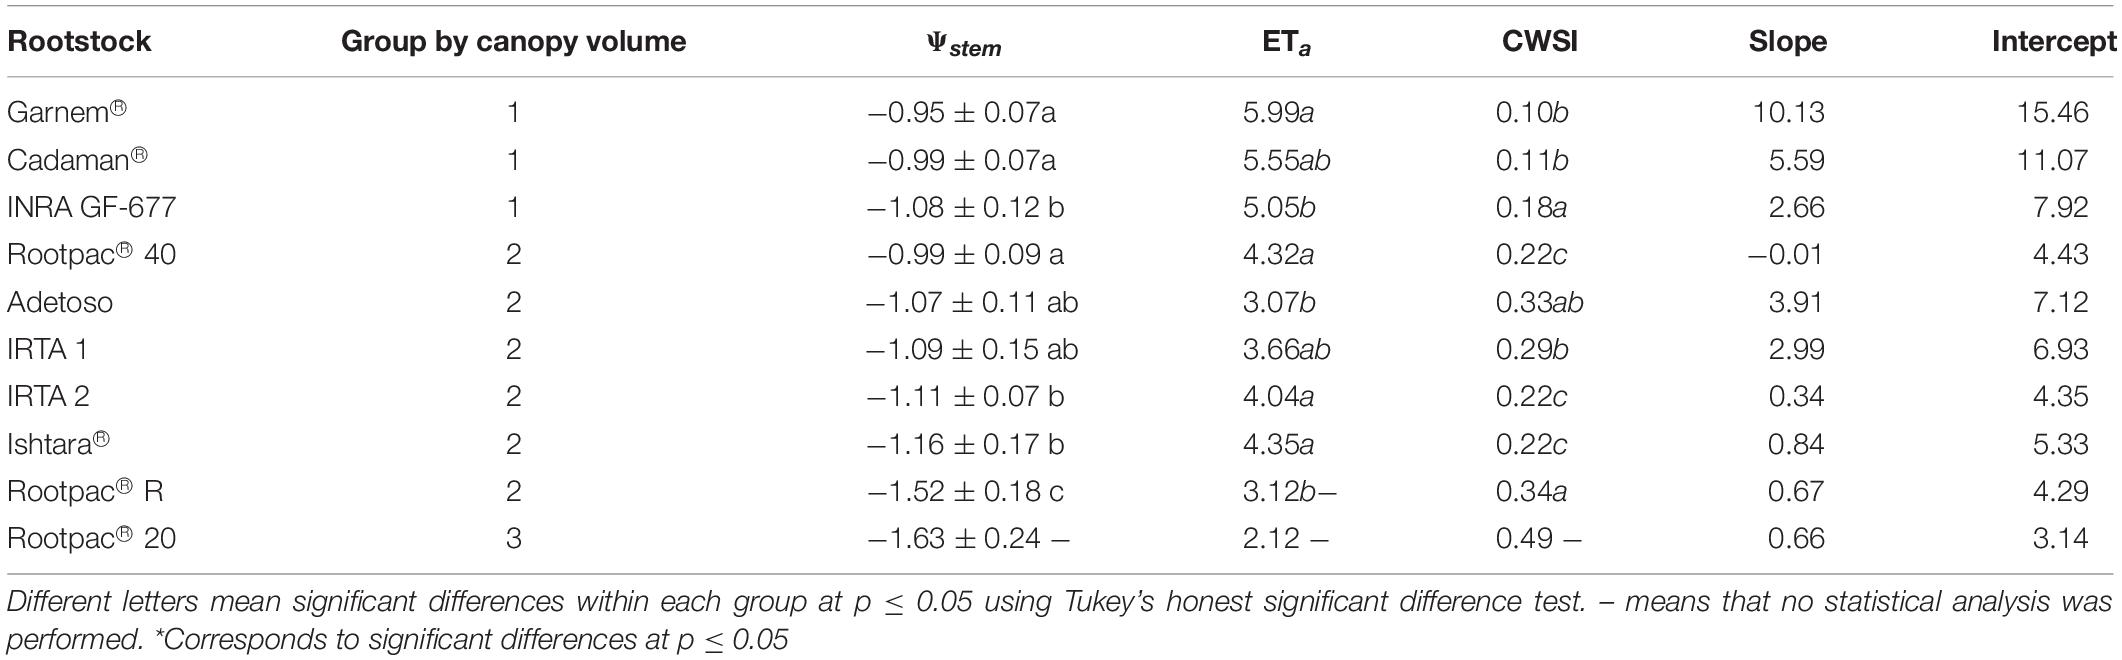
Table 7. Mean of the variables Ψstem, ETa, and CWSI, and slope and intercept of the regression ETa vs. Ψstem for each rootstock grouped on the basis of the analysis of variance of canopy volume.
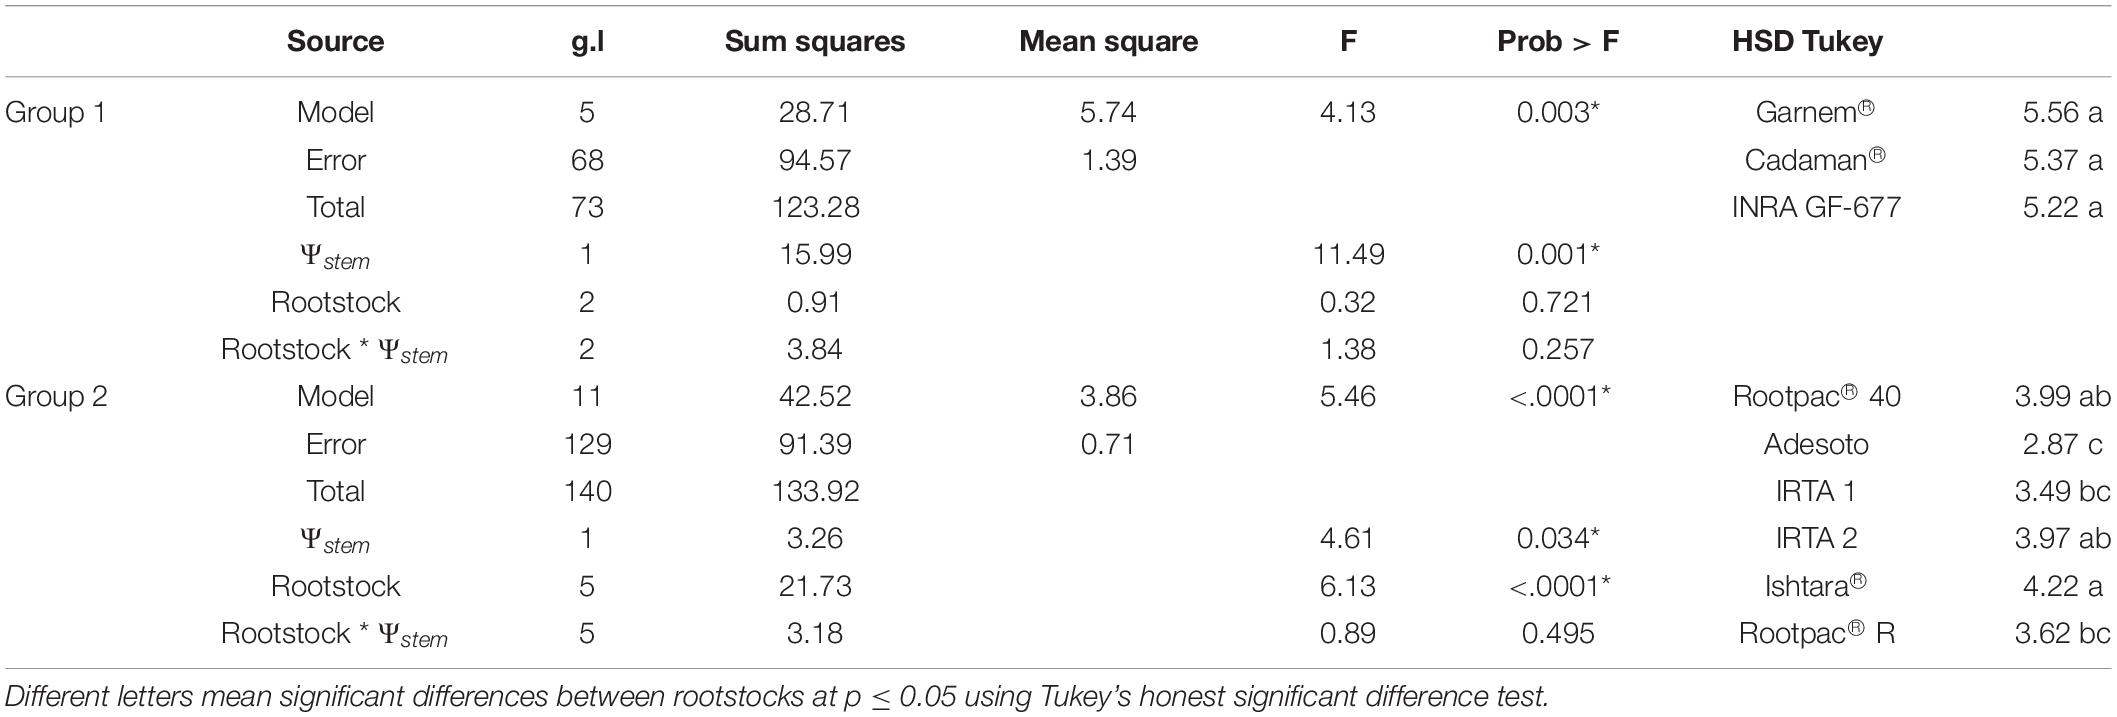
Table 8. Analysis of covariance (ANCOVA) of the relationships between ETa and Ψstem shown in Table 7 for rootstocks of groups 1 and 2.
The establishment of the relationship between crop yield and the consumptive use of water (the so-called production function) in row crops is of particular interest, but at the same time is not easy to obtain due to the need for long-term studies and the difficulty in assessing consumptive use (Goldhamer and Fereres, 2017). Although many studies have demonstrated that almonds are one of the species able to maintain high kernel yield under deficit irrigation conditions (Torrecillas et al., 1989; Girona et al., 2005; Egea et al., 2010), other studies have reported that yield is dependent on canopy PAR light interception, and therefore this will increase with fiPARd (Jin et al., 2020). In our study, the rootstocks with the highest canopy volumes and fiPARd (Cadaman® and Garnem®) had the highest ETa and yields, while the lowest yields were observed in those which had the lowest ETa (Rootpac® 20, followed by Rootpac® 40 and Rootpac® R) (Figure 8A). It should also be noted that the R2 of both the yield-ETa and yield-CWSI regressions were higher in 2018 than in 2019, because the former had higher yield while the latter coincided with an alternate bearing year.
This study also shows the daily water production function as yield per unit of water evapotranspired, using data from 24th July 2018 to 24th July 2019. Figure 9 shows that water productivity (kernel yield/mm water evapotranspired) differed between rootstocks and that the regression with Ψstem tended to decrease as water stress increased. This regression was significant for 2018 (Figure 9A) but not for 2019 (Figure 9B). The rootstocks in the previously mentioned first group (Garnem® and Cadaman®) showed the highest water productivity in both years, together with INRA GF-677, IRTA 1, IRTA 2, and Rootpac® 40. Although Adesoto and Ishtara® had similar high Ψstem values, water productivity was slightly lower. Interestingly, despite the negative Ψstem of Rootpac® R, water productivity values were similar to those obtained in the rootstocks in group 1. This is attributable to the significantly higher yield of Rootpac® R, despite having Ψstem and ETa values similar to Rootpac® 20.
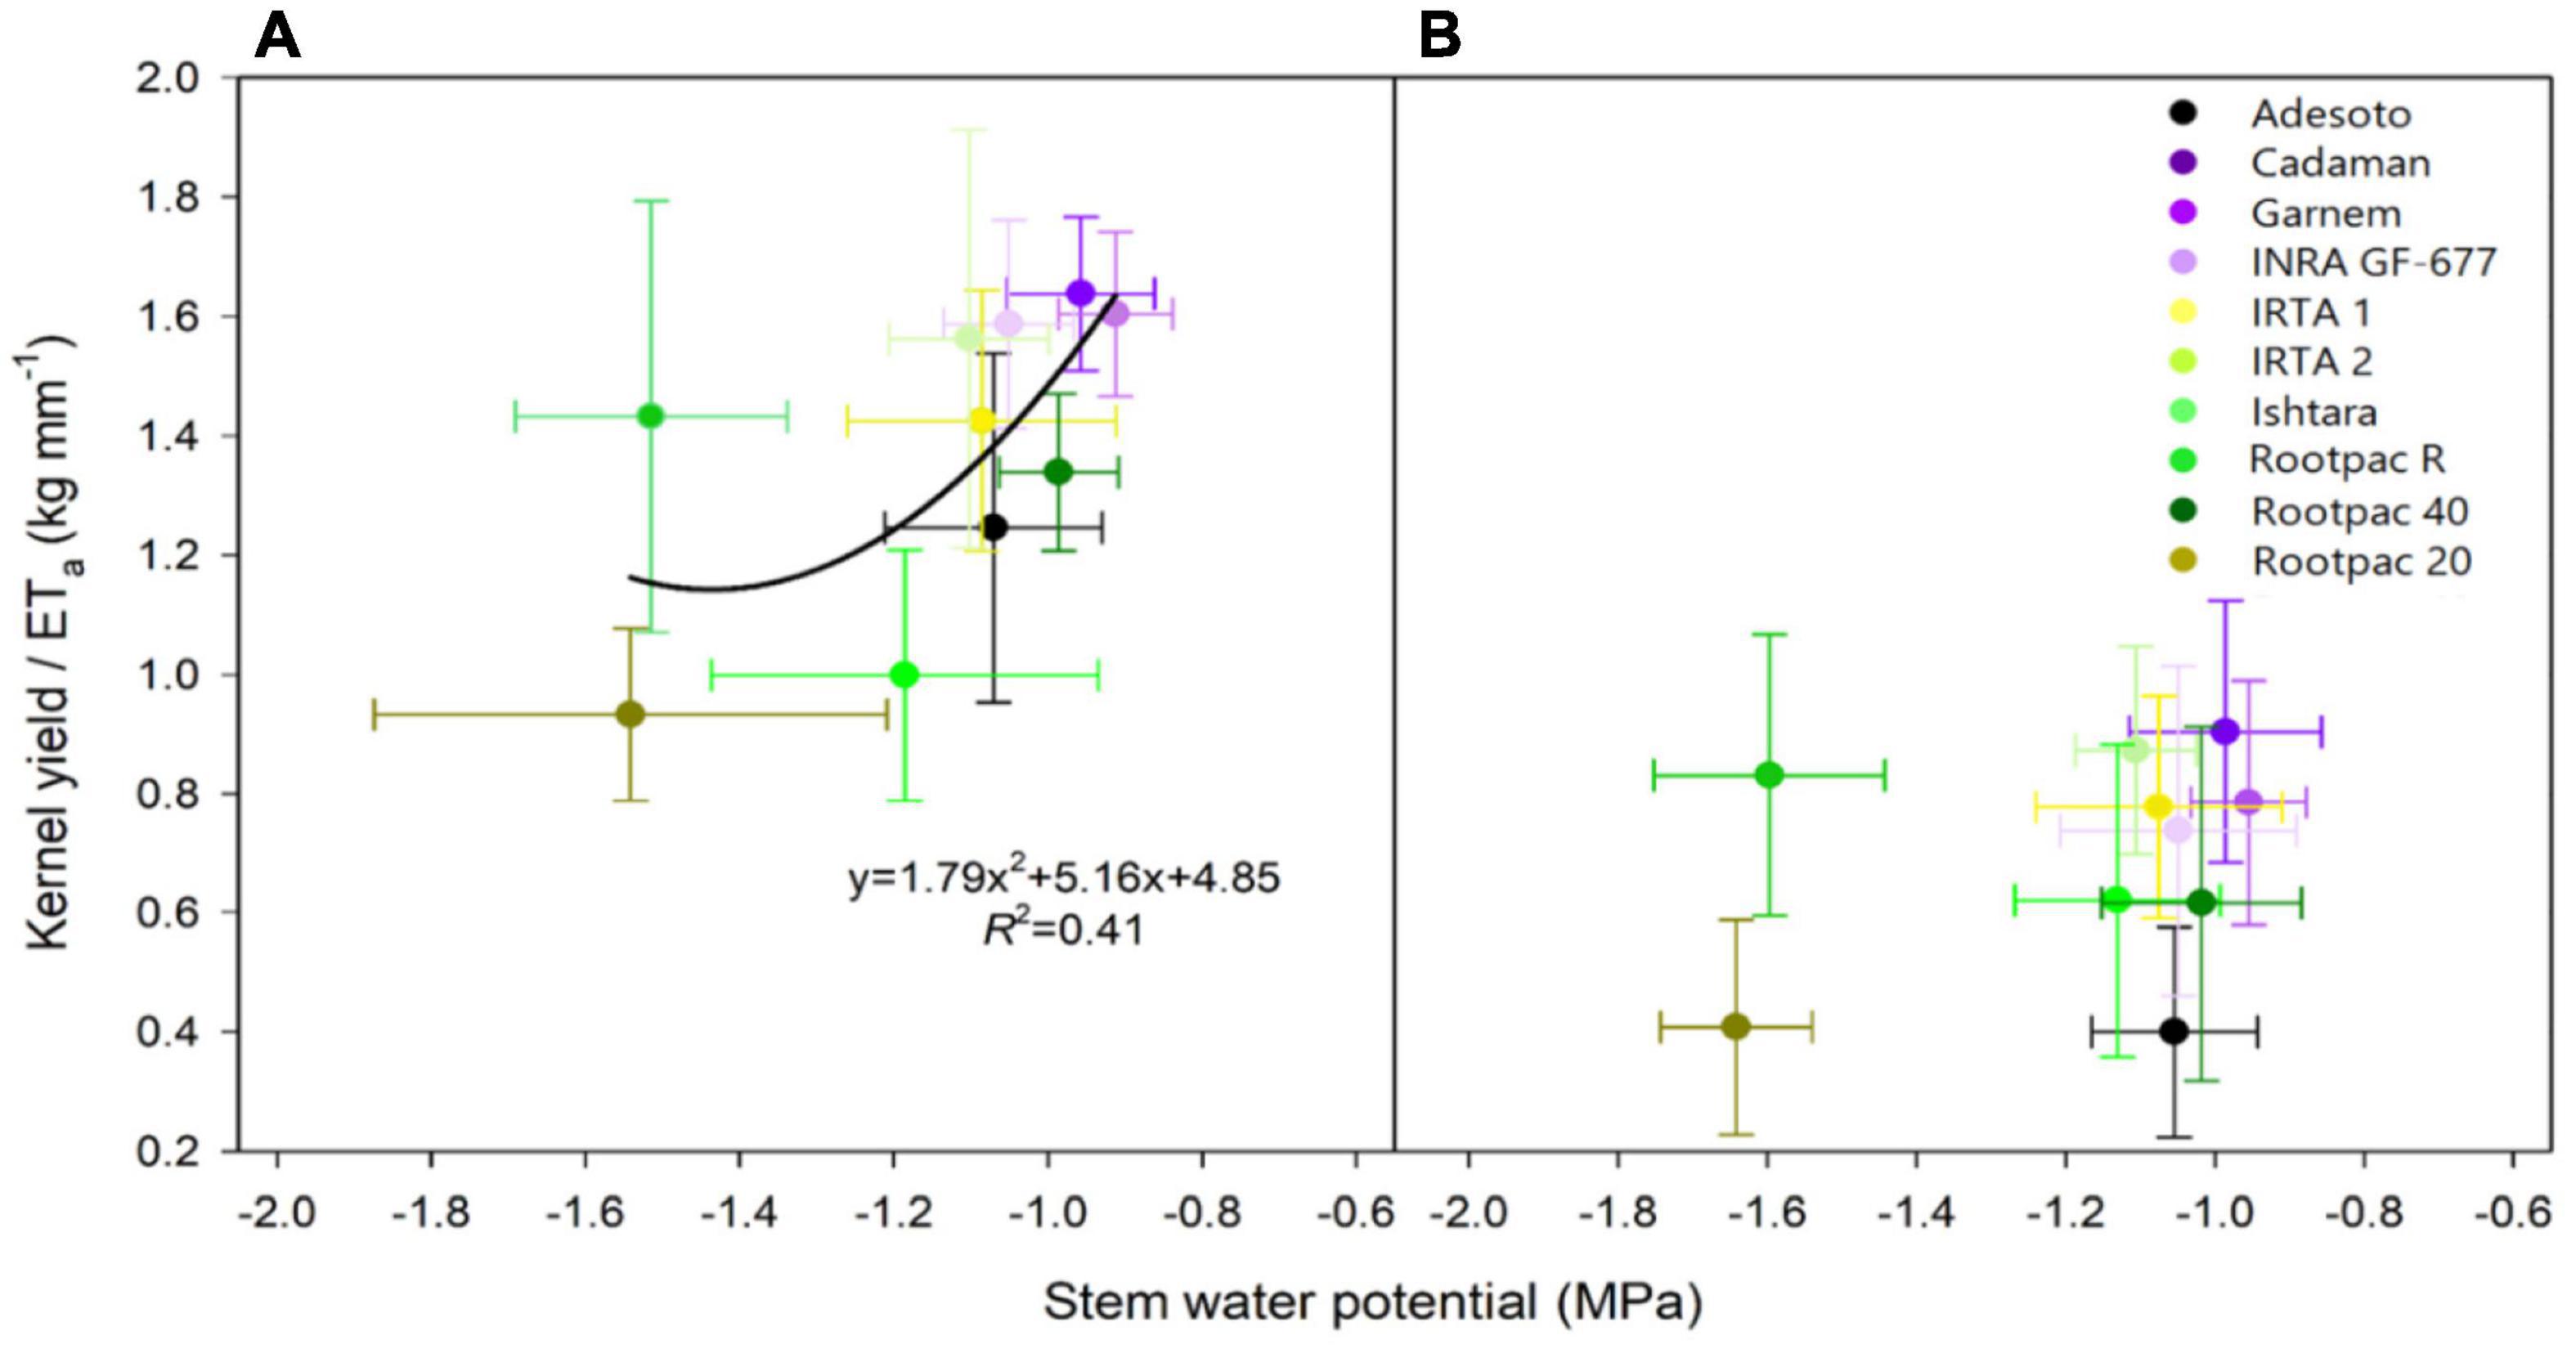
Figure 9. Relationships between kernel yield/ETa (kg tree–1 / mm of water evapotranspired) and stem water potential (Ψstem) for (A) 24th July 2018, and (B) 24th July 2019.
Conclusion
This study has demonstrated, for the first time, the feasibility of using a surface energy balance model for high-throughput phenotyping of crop evapotranspiration in an almond rootstock collection. The analysis allowed the quantification of the following almond traits that are of paramount importance in rootstock phenotyping: canopy tree height, crown area, canopy volume, LAI, fiPARd, actual and potential crop evapotranspiration, and the crop water stress index. The LAI and fiPARd were, respectively, estimated with an R2 of 0.60 and 0.56 through a multiple linear regression equation, which included estimates of both parameters obtained from spectral vegetation indices and estimates of crown area and canopy volume through photogrammetry techniques. Cadaman® and Garnem® were identified as the rootstocks with the highest canopy vigor as well as the highest ETa. These two rootstocks were characterized by maintaining high Ψstem values despite reducing the amount of irrigation water applied. In contrast, Rootpac® 20 and Rootpac® R had the lowest canopy vigor and ETa, and also the lowest Ψstem in the I100 treatment suggesting that this was due to a localized incompatibility between plum-almond species, differences in the root system and/or low hydraulic conductivity. Other rootstocks had medium canopy vigor. Of these, Adesoto and IRTA 1 had the lowest ETa values and Rootpac® 40 and Ishtara the highest. Yield was linearly related with ETa. Cadaman® and Garnem® also had the highest water productivity, and Rootpac® 20 and Rootpac® R the lowest. However, the water productivity of Rootpac® R was significantly higher than that of Rootpac® 20.
The use of energy balance models such as the TSEB using very high-resolution imagery opens the possibility to efficiently evaluate the WUE of a crop in many other different rootstock collections or varieties located in different environments. This will improve the manner in which field phenotyping has been applied until now and will help crop breeders to better understand and identify the rootstocks/varieties best adapted to drought. In addition, since the TSEB allows the partitioning of plant transpiration and surface evaporation components, future studies will focus on using transpiration instead of ETa, and together with measurements of water potential gradients, to determine differences in root hydraulic resistances.
Data Availability Statement
Publicly available datasets were analyzed in this study. This data can be found here: https://github.com/hectornieto.
Author Contributions
JB wrote the manuscript and analyzed the remote sensing and field data. HN was the developer of the pyTSEB code used in this study. AP processed all the images and did the preliminary analysis. CJ-Č conducted the radiometric calibration of images and the analysis with the PROSAIL model. LZ conducted field measurements during the airborne campaign. XM designed the experimental design, collaborated in the field measurements campaign and provided critical insights into the manuscript writing. All authors contributed to the article and approved the submitted version.
Funding
This study was partially supported by the PRIMA ALTOS project (No. PCI2019-103649) of the Ministry of Science, Innovation and Universities of the Spanish government and the Horizon 2020 Programme for Research and Innovation (H2020) of the European Commission, in the context of the Marie Skłodowska-Curie Research and Innovation Staff Exchange (RISE) action through the ACCWA project: grant agreement no. 823965.
Conflict of Interest
The authors declare that the research was conducted in the absence of any commercial or financial relationships that could be construed as a potential conflict of interest.
Acknowledgments
We would like to thank Mercè Mata and Marta Maldonado for, respectively, conducting stem water potential measurements and for scheduling irrigation during the growing season.
References
Allen, R. G., Pereira, L. S., Raes, D., Smith, M., and Ab, W. (1998). Irrigation and Drainage Paper; No. 56. Rome: FAO. doi: 10.1016/j.eja.2010.12.001
Allen, R. G., Tasumi, M., and Trezza, R. (2007). Satellite-based energy balance for mapping evapotranspiration with internalized calibration (METRIC)–Model. J. Irrig. Drain. Eng. 133, 380–394. doi: 10.1061/(ASCE)0733-94372007133:4(380)
Ampatzidis, Y., Partel, V., Meyering, B., and Albrecht, U. (2019). Citrus rootstock evaluation utilizing UAV-based remote sensing and artificial intelligence. Comp. Electronics Agric. 164:104900. doi: 10.1016/j.compag.2019.104900
Araus, J. L., and Cairns, J. E. (2014). Field high-throughput phenotyping: the new crop breeding frontier. Trends Plant Sci. 19:1. doi: 10.1007/978-1-4939-2493-6_1036-1
Araus, J. L., and Kefauver, S. C. (2018). Breeding to adapt agriculture to climate change: affordable phenotyping solutions. Curr. Opin. Plant Biol. 45, 237–247. doi: 10.1016/j.pbi.2018.05.003
Araus, J. L., Kefauver, S. C., Zaman-Allah, M., Olsen, M. S., and Cairns, J. E. (2018). Translating high-throughput phenotyping into genetic gain. Trends Plant Sci. 23, 451–466. doi: 10.1016/j.tplants.2018.02.001
Arismendi, M. J., Hinrichsen, P., Almada, R., Pimentel, P., Pinto, M., and Sagredo, B. (2012). Characterization of genetic diversity of stone fruit rootstocks used in Chile by means of microsatellite markers. J. Am. Soc. Horticult. Sci. 137, 302–310. doi: 10.21273/jashs.137.5.302
Barnes, E. M., Clarke, T. R., Richards, S. E., Colaizzi, P. D., Haberland, J., Kostrzewski, M., et al. (2000). “Coincident detection of crop water stress, nitrogen status and canopy density using ground based multispectral data,” in Proceedings of the Fifth International Conference on Precision Agriculture, ed. P. C. Robert (Madison, WI: ASA).
Bastiaanssen, W. G. M., Pelgrum, H., Wang, J., Ma, Y., Moreno, J. F., Roerink, G. J., et al. (1998). Remote sensing surface energy balance algorithm for land (SEBAL): 2. Validation. J. Hydrol. 212–213, 213–229. doi: 10.1016/S0022-1694(98)00254-6
Bellvert, J., Adeline, K., Baram, S., Pierce, L., Sanden, B. L., and Smart, D. (2018). Monitoring crop evapotranspiration and crop coefficients over an almond and pistachio orchard throughout remote sensing. Remote Sensing 10:2001. doi: 10.3390/rs10122001
Bellvert, J., Marsal, J., Girona, J., Gonzalez-Dugo, V., Fereres, E., Ustin, S. L., et al. (2016). Airborne thermal imagery to detect the seasonal evolution of crop water status in peach, nectarine and saturn peach orchards. Remote Sensing 8:39. doi: 10.3390/rs8010039
Berger, K., Atzberger, C., danner, M., D’Urso, G., Mauser, W., Vuelo, F., et al. (2018). Evaluation of the PROSAIL model capabilities for future model environments: a review study. Remote Sensing 10:85. doi: 10.3390/rs10010085
Bernhard, R., and Grasselly, C. H. (1959). Les pruniers portegreffes du pêcher. Arboric. Fruit. 62, 27–28.
Black, B. L., Drost, D., Lindstrom, T., Reeve, J., Gunnell, J. D., and Reighard, G. L. (2010). A comparison of root distribution patterns among Prunus rootstock. J. Am. Pomol. Soc. 64, 52–62. doi: 10.1016/j.envexpbot.2016.01.009
BOE (2002). Real decreto 1201/2002, de 20 de Noviembre, por el que se Regula la Producción Integrada de Productos Agrícolas. Madrid: Boletin Oficial del Estado.
Boulet, G., Mougenot, B., Lhomme, J. P., Fanise, P., Lili-Chabaane, Z., Olioso, A., et al. (2015). The SPARSE model for the prediction of water stress and evapotranspiration components from thermal infra-red data and its evaluation over irrigated and rainfed wheat. Hydrol. Earth Syst. Sci. 19, 4653–4672. doi: 10.5194/hess-19-4653-2015
Cammalleri, C., Anderson, M. C., Gao, F., Hain, C. R., and Kustas, W. P. (2014). Mapping daily evapotranspiration at field scales over rainfed and irrigated agricultural areas using remote sensing data fusion. Agric. For. Meteorol. 186, 1–11. doi: 10.1016/j.agrformet.2013.11.001
Cantini, C., Iezzoni, A. F., Lamboy, W. F., Boritzki, M., and Struss, D. (2001). DNA fingerprinting of tetraploid cherry germplasm using simple sequence repeats. J. Am. Soc. Horticult. Sci. 126, 205–209. doi: 10.21273/jashs.126.2.205
Caruso, G., Zarco-Tejada, P. J., González-Dugo, V., Moriondo, M., Tozzini, L., Palai, G., et al. (2019). High-resolution imagery acquired from an unmanned platform to estimate biophysical and geometrical parameters of olive trees under different irrigation regimes. PLoS One 14:e0210804. doi: 10.1371/journal.pone.0210804
Caruso, T., Giovanni, D., and Liverani, A. (1996). Rootstock influences the fruit mineral, sugar and organic acid content of a very early ripening peach cultivar. J. Horticult. Sci. 71, 931–937. doi: 10.1080/14620316.1996.11515477
Casanova-Gascón, J., Figueras-Panillo, M., Iglesias-Castellarnau, I., and Martín-Ramos, P. (2019). Comparison of SHD and open-center training systems in almond tree orchards cv.‘Soleta’. Agronomy 9:874.
Casas, A., Riaño, D., Ustin, S. L., Dennison, P., and Salas, J. (2014). Estimation of water-related biochemical and biophysical vegetation properties using multitemporal airborne hyperspectral data and its comparison to MODIS spectral response. Remote Sens. Environ. 148, 28–41. doi: 10.1016/j.rse.2014.03.011
Congelo, L. (2016). Semi-Automatic Classification Plugin Documentation. Release 6.0.1.1. Rome. doi: 10.13140/RG.2.2.29474.02242/1
Coupel-Ledru, A., Pallas, B., Delande, M., Boudon, F., Carrié, E., Martinez, S., et al. (2019). Multi-scale high-throughput phenotyping of apple architectural and functional traits in orchard reveals genotypic variability under contrasted watering regimes. Horticult. Res. 6:52.
Darvishzadeh, R., Skidmore, A., Schlerf, M., and Atzberger, C. (2008). Inversion of a radiative transfer model for estimating vegetation LAI and chlorophyll in a heterogeneous grassland. Remote Sens. Environ. 112, 2592–2604. doi: 10.1016/j.rse.2007.12.003
Daughtry, C. S., Walthall, C. L., Kim, M. S., Brown de Colstoun, E., and McMurtrey, J. E. (2000). Estimating corn leaf chlorophyll concentration from leaf and canopy reflectance. Remote Sens. Environ. 74, 229–239. doi: 10.1016/S0034-4257(00)00113-9
Delalieux, S., Somers, B., Hereijgers, S., Verstraeten, W. W., Keulemand, W., and Coppin, P. (2008). A near-infrared narrow-waveband ratio to determine Leaf Area Index in orchards. Remote Sensing Environ. 112, 3762–3772. doi: 10.1016/j.rse.2008.05.003
Delegido, J., Verrelst, J., Meza, C. M., Rivera, J. P., Alonso, L., and Moreno, J. (2013). A red-edge spectral index for remote sensing estimation of Green LAI over agroecosystems. Eur. J. Agron. 46, 42–52. doi: 10.1016/j.eja.2012.12.001
Deery, D., Jimenez-Berni, J., Jones, H., Sirault, X., and Furbank, R. (2014). Proximal remote sensing buggies and potential applications for field-based phenotyping. Agronomy 4, 349–379. doi: 10.3390/agronomy4030349
Díez-Palet, I., Funes, I., Savé, R., Biel, C., de Herralde, F., Miarnau, X., et al. (2019). Blooming under mediterranean climate: estimating cultivar-specific chill and heat requirements of almond and Apple trees using a statistical approach. Agronomy 9:760. doi: 10.3390/agronomy9110760
Duan, S.-B., Li, Z.-L., Wu, H., Tang, B.-H., Ma, L., Zhao, E., et al. (2014). Inversion of the PROSAIL model to estimate leaf area index of maize potato, and sunflower fields from unmanned aerial vehicle hyperspectral data. Int. J. Appl. Earth Observation Geoinform. 26, 12–20. doi: 10.1016/j.jag.2013.05.007
Egea, G., Nortes, P. A., González-Real, M. M., Baille, A., and Domingo, R. (2010). Agronomic response and water productivity of almond trees under contrasted deficit irrigation regimes. Agricult. Water Manage. 97, 171–181. doi: 10.1016/j.agwat.2009.09.006
Errea, P., Garay, L., and Marin, J. A. (2001). Early detection of graft incompatibility in apricot (Prunus armeniaca) using in vitro techniques. Physiol. Plant. 112, 135–141. doi: 10.1034/j.1399-3054.2001.1120118.x
Fernandez-Gallego, J. A., Kefauver, S. C., Vatter, T., Aparicio-Gutiérrez, N., Nieto-Taladriz, M. T., and Araus, J. L. (2019). Low-cost assessment of grain yield in durum wheat using RGB images. Eur. J. Agron. 105, 146–156. doi: 10.1016/j.eja.2019.02.007
Font i Forcada, C., Gogorcena, Y., and Moreno, M. A. (2012). Effect of almond × peach hybrid rootstocks on fruit quality parameters and yield characteristics of peach cultivars. Acta Hort. 962, 599–604. doi: 10.17660/actahortic.2012.962.81
Font i Forcada, C., Reig, G., Mestre, L., Mignard, P., Betrán, J. A., and Moreno, M. A. (2020). Scion x rootstock response on production, mineral composition and fruit quality under heavy-calcareous soil and hot climate. Agronomy 10:1159. doi: 10.3390/agronomy10081159
García-Tejero, I. F., Gutiérrez-Gordillo, S., Ortega-Arévalo, C., Iglesias-Contreras, M., Moreno, J. M., Souza-Ferreira, L., et al. (2018). Thermal imaging to monitor the crop-water status in almonds by using the non-water stress baselines. Sci. Hortic. 238, 91–97. doi: 10.1016/j.scienta.2018.04.045
Girona, J., Mata, M., and Marsal, J. (2005). Regulated deficit irrigation during kernel-filling period and optimal irrigation rates in almond. Agricult. Water Manage. 75, 152–167. doi: 10.1016/j.agwat.2004.12.008
Gitelson, A. A., Kaufman, Y. J., and Merzlyak, M. N. (1996). Use of a green channel in remote sensing of global vegetation from EOS-MODIS. Remote Sens. Environ. 58, 289–298. doi: 10.1016/S0034-4257(96)00072-7
Goldhamer, D. A. (2012). in Almond in Grop Yield Response to Water. FAO Irrigation and Drainage Paper No. 66, Vol. 246, eds P. Steduto, T. C. Hsiao, E. Fereres, and D. Raes (Rome: Food and Agriculture Organization of the United Nations), 296.
Goldhamer, D. A., and Fereres, E. (2017). Establishing an almond water production function for California using long-term yield response to variable irrigation. Irrig. Sci. 35, 169–179. doi: 10.1007/s00271-016-0528-2
Gonzalez-Dugo, V., Lopez-Lopez, M., Espadafor, M., Orgaz, F., Testi, L., Zarco-Tejada, P. J., et al. (2019). Transpiration from canopy temperature: Implications for the assessment of crop yield in almond orchards. Eur. J. Agron. 105, 78–85. doi: 10.1016/j.eja.2019.01.010
Guajardo, V., Hinrichsen, P., and Muñoz, C. (2015). Breeding rootsock for Prunus species: advances in genetic and genomics of peach and cherry as a model. Chilenean J. Agricult. Res. 75 (Suppl. 1), 17–27. doi: 10.4067/s0718-58392015000300003
Guillen-Climent, M. L., Zarco-Tejada, P. J., Berni, J. A. J., North, P. R. J., and Villalobos, F. J. (2012). Mapping radiation interception in row-structured orchards using 3D simulation and high-resolution airborne imagery acquired from a UAV. Precision Agricult. 13, 473–500. doi: 10.1007/s11119-012-9263-8
Gullo, G., Motisi, A., Zappia, R., Dattola, A., Diamanti, J., and Mezzetti, B. (2014). Rootstock and fruit canopy position affect peach [Prunus persica (L.) Batsch] (cv. Rich May) plant productivity and fruit sensorial and nutritional quality. Food Chem. 153, 234–242. doi: 10.1016/j.foodchem.2013.12.056
Gutiérrez-Gordillo, S., García-Tejero, I. F., Durán Zuazo, V. H., García Escalera, A., Ferrera Gil, F., Amores-Agüera, J. J., et al. (2020). Assessing the water-stress baselines by thermal imaging for irrigation management in almond plantations under water scarcity conditions. Water 12:1298. doi: 10.3390/w12051298
Haboudane, D., Miller, J. R., Pattey, E., Zarco-Tejada, P. J., and Strachan, I. S. (2004). Hyperspectral vegetation indices and novel algorithms for predicting green LAI of crop canopies: modeling and validation in the context of precision agriculture. Remote Sensing Environ. 90, 337–352. doi: 10.1016/j.rse.2003.12.013
He, R., Jin, Y., Kandelous, M. M., Zaccaria, D., Sanden, B. L., Snyder, R. L., et al. (2017). Evapotranspiration estimate over an almond orchard using Landsat satellite observations. Remote Sens. 9:436. doi: 10.3390/rs9050436
Hernandez-Santana, V., Rodriguez-Dominguez, C. M., Fernández, J. E., and Diaz-Espejo, A. (2016). Role of leaf hydraulic conductance in the regulation of stomatal conductance in almond and olive in response to water stress. Tree Physiol. 36, 725–735. doi: 10.1093/treephys/tpv146
Hoffman, H., Nieto, H., Jensen, R., Guzinski, R., Zarco-Tejada, P., and Friborg, T. (2016). Estimating evaporation with UAV data and two-source energy balance models. Hydrol. Earth Syst. Sci. 20, 697–713. doi: 10.5194/hess-20-697-2016
Holman, F. H., Riche, A. B., Michalski, A., Castle, M., Wooster, M. J., and Hawkesford, M. J. (2016). High throughput field phenotyping of wheat plant height and growth rate in field plot trials using UAV based remote sensing. Remote Sensing 8:1031. doi: 10.3390/rs8121031
Huete, A. R. (1988). A soil-adjusted vegetation index (SAVI). Remote Sens. Environ. 25, 295–309. doi: 10.1016/0034-4257(88)90106-x
Jacquemoud, S., Verhoef, W., Baret, F., Bacour, C., Zarco-Tejada, P. J., Asner, G. P., et al. (2009). PROSPECT + SAIL models: a review of use for vegetation characterization. Remote Sens. Environ. 113, S56–S66.
Jiménez, S., Dridi, J., Gutiérrez, D., Moret, D., Irigoyen, J. J., Moreo, M. A., et al. (2013). Physiological, biochemical and molecular responses in four Prunus rootstock submitted to drought stress. Tree Physiol. 33, 1061–1075. doi: 10.1093/treephys/tpt074
Jimenez-Berni, J. A., Deery, D. M., Rozas-Larraondo, P., Condon, A. G., Rebetzke, G. J., James, R. A., et al. (2018). High throughput determination of plant height, ground cover, and above-ground biomass in wheat with LiDAR. Front. Plant. Sci. 9:237. doi: 10.3389/fpls.2018.00237
Jin, Y., Chen, B., Lampinen, B. D., and Brown, P. H. (2020). Advancing agricultural production with machine learning analytics: yield determinants for California’s almond orchards. Front. Plant Sci. 11:290. doi: 10.3389/fpls.2020.00290
Kefauver, S. C., El-Haddad, G., Vergara-Diaz, O., and Araus, J. L. (2015). “RGB picture vegetation indexes for high-throughput phenotyping platforms (HTPPs),” in Proceedings of the SPIE Remote Sensing for Agriculture. Ecosystems, and Hydrology XVII, Vol. 9637, eds M. U. Christopher and N. A. Maltese (Toulousse), 96370J.
Knipper, K. R., Kustas, W. P., Anderson, M. C., Alfieri, J. G., Prueger, J. H., Hain, C. R., et al. (2019). Evapotranspiration estimates derived using thermal-based satellite remote sensing and data fusion for irrigation management in California vineyards. Irrig. Sci. 37, 431–449. doi: 10.1007/s00271-018-0591-y
Kustas, W., and Anderson, M. (2009). Advances in thermal infrared remote sensing for land surface modeling. Agric. For. Meteorol. 149, 2071–2081. doi: 10.1016/j.agrformet.2009.05.016
Legua, P., Pinochet, J., Moreno, M. A., Martinez, J. J., and Hernández, F. (2012). Prunus hibrids rootstocks for flat peach. Sci. Agricola 69, 13–18. doi: 10.1590/s0103-90162012000100003
Leonardi, C., and Romano, D. (2004). Recent issues on vegetable grafting. Acta Horticult. 631, 163–174. doi: 10.17660/actahortic.2004.631.21
Li, X., Zhang, Y., Bao, Y., Luo, J., Jin, X., Xu, X., et al. (2014). Exploring the best hyperspectral features for LAI estimation using partial least squares regression. Remote Sensing 6, 6221–6241. doi: 10.3390/rs6076221
Li, Z., Jin, X., Wang, J., Yang, G., Nie, C., Xu, X., et al. (2015). Estimating winter wheat (Triticum aestivum) LAI and leaf chlorophyll content from canopy reflectance data by integrating agronomic prior knowledge with the PROSAIL model. Int. J. Remote Sens. 36, 2634–2653. doi: 10.1080/01431161.2015.1041176
Lopez, G., Pallas, B., Martinez, S., Lauri, P. E., Regnard, J. L., and Durel, C. -É, et al. (2015). Genetic variation of morphological traits and transpiration in an apple core collection under well-watered conditions: towards the identification of morphotypes with high water use efficiency. PLoS One 10:e0145540. doi: 10.1371/journal.pone.0145540
López-Bernal, A., García-Tejera, O., Testi, L., and Orgaz, F. (2015). Low winter temperatures induce a disturbance of water relations in field olivet rees. Trees 29, 1247–1257. doi: 10.1007/s00468-015-1204-5
López-Granados, F., Torres-Sánchez, J., Jiménez-Brenes, F. M., Arquero, O., Lovera, M., and de Castro, A. I. (2019). An eficient RGB-UAV-based platform for field almond tree phenotyping: 3-D architecture and flowering traits. Plant Methods 15:160.
Lordan, J., Zazurca, L., Maldonado, M., Torguet, L., Alegre, S., and Miarnau, X. (2019). Horticultural performance of ‘Marinada’ and ‘Vairo’ almond cultivars grown on a genetically diverse set of rootstocks. Sci. Horticult. 256:108558. doi: 10.1016/j.scienta.2019.108558
Madec, S., Baret, F., de Solan, B., Thomas, S., Dutartre, D., Jezequel, S., et al. (2017). High-throughput phenotyping of plant height: comparing unmanned aerial vehicles and ground LiDAR estimates. Front. Plant. Sci. 8:2002. doi: 10.3389/fpls.2017.02002
Mazis, A., Chroudhury, S. D., Morgan, P. B., Stoerger, V., Hiller, J., Ge, Y., et al. (2020). Application of high-throughput plant phenotyping for assessing biophysical traits and drought response in two oak species under controlled environment. Forest Ecol. Manage. 465:118101. doi: 10.1016/j.foreco.2020.118101
Mecikalski, J. R., Diak, G. R., Anderson, M. C., and Norman, J. M. (1999). Estimating fluxes on continental scales using remotely sensed data in an atmospheric-land exchange model. (1999). J. Appl. Meteorol. 38, 1352–1369. doi: 10.1175/1520-0450
Mestre, L., Reig, G., Betrán, J. A., and Moreno, M. A. (2017). Influence of plum rootstocks on agronomic performance, leaf mineral nutrition and fruit quality of ‘Catherina’ peach cultivar in heavy-calcareous soil conditions. Spanish J. Agric. Res. 15:e0901. doi: 10.5424/sjar/2017151-9950
Mestre, L., Reig, G., Betrán, J. A., Pinochet, J., and Moreno, M. A. (2015). Influence of peach-almond hybrids and plum-based rootstocks on mineral nutrition and yield characteristics of ‘Big Top’ nectarine in replant and heavy-calcareous soil conditions. Sci. Hortic. 192, 475–481. doi: 10.1016/j.scienta.2015.05.020
Nieto, H., Kustas, W. P., Torres-Rúa, A., Alfieri, J. G., Gao, F., Anderson, M. C., et al. (2019). Evaluation of TSEB turbulent fluxes using different methods for the retrieval of soil and canopy component temperatures from UAV thermal and multispectral imagery. Irrig. Sci. 37, 389–406. doi: 10.1007/s00271-018-0585-9
Norman, J. M., and Jarvis, P. G. (1974). Photosynthesis in Sitka spruce (Picea sitchensis (Bong.) Carr.). III. Measurements of canopy structure and interception of radiation. J. Appl. Ecol. 81, e375–e398.
Norman, J. M., Kustas, W. P., and Humes, K. S. (1995). Source approach for estimating soil and vegetation energy fluxes in observations of directional radiometric surface temperature. Agric. For. Meteorol. 77, 263–293. doi: 10.1016/0168-1923(95)02265-y
Opazo, I., Toro, G., Salvatierra, A., Pastenes, C., and Pimentel, P. (2020). Rootstocks modulate the physiology and growth responses to water deficit and long-term recovery in grafted Stone fruit trees. Agric. Water Manag. 228:105897. doi: 10.1016/j.agwat.2019.105897
Oyarzun, R. A., Stöckle, C. O., and Whiting, M. D. (2007). A simple approach to modeling radiation interception by fruit-tree orchards. Agric. For. Meteorol. 142, 12–24. doi: 10.1016/j.agrformet.2006.10.004
Pereyra-Irujo, G., Gasco, E. D., Peirone, L. S., and Aguirrezábal, L. A. N. (2012). GlyPh: a low-cost platform for phenotyping plant growth and water use. Funct. Plant Biol. 39, 905–913. doi: 10.1071/fp12052
Pinochet, J. (2009). ‘Greenpac’, a new peach hybrid rootstock adapted to Mediterranean 459 conditions. HortScience 44, 1456–1457. doi: 10.21273/hortsci.44.5.1456
Prashar, A., and Jones, H. (2014). Infra-red thermography as a high-throughput tool for field phenotyping. Agronomy 4, 397–417. doi: 10.3390/agronomy4030397
Priestley, C. H. B., and Taylor, R. J. (1972). On the assessment of surface heat flux and evaporation using large-scale parameters. Mon. Weather Rev. 100, 81–92. doi: 10.1175/1520-0493
Prudnikova, E., Savin, I., Vindeker, G., Grubina, P., Shishkonakova, E., and Sharychev, D. (2019). Influence of soil background on spectral reflectance of winter wheat crop canopy. Remote Sensing 11:1932. doi: 10.3390/rs11161932
Reig, G., Garanto, X., Mas, N., and Iglesias, I. (2020). Long-term agronomical performance and iron chloosis susceptibility of several Prunus rootstock grown under loamy and calcareous soil conditions. Sci. Hortic. 262:109035. doi: 10.1016/j.scienta.2019.109035
Reighard, G. L., Beckman, T., Belding, R., Black, B., Byers, P., Cline, J., et al. (2011). Six-year performance of 14 prunus rootstocks at 11 sites in the 2001 NC-140 peach trial. J. Am. Pomol. Soc. 65, 26–41.
Romano, G., Zia, S., Spreer, W., Sanchez, C., Cairns, J., Araus, J. L., et al. (2011). Use of thermography for high throughput phenotyping of tropical maize adaptation in water stress. Comp. Electronics Agric. 79, 67–74. doi: 10.1016/j.compag.2011.08.011
Rouse, J. W., Haas, R. H., Schell, J. A., and Deering, D. W. (1973). “Monitoring vegetation systems in the great plainswith ERTS,” In Third ERTS Symposium (Washington, DC: NASA SP 351 I), 309–317.
Russo, N., Robinson, T., Fazio, G., and Aldwinckle, H. (2007). Field evaluation of 64 apple rootstocks for orchard performance and fire blight resistance. HortScience 42, 1517–1525. doi: 10.21273/hortsci.42.7.1517
Semmens, K. A., Anderson, M. C., Kustas, W. P., Gao, F., Alfieri, J. G., McKee, L., et al. (2016). Monitoring daily evapotranspiration over two California vineyards using Landsat 8 in a multi-sensor data fusion approach. Remote Sens. Environ. 185, 155–170. doi: 10.1016/j.rse.2015.10.025
Serra, I., Strever, A., Myburgh, P. A., and Deloire, A. (2014). Review: the interaction between rootstocks and cultivars (Vitis vinifera L.) to enhance drought tolerance in grapevine. Aust. J. Grape Wine Res. 20, 1–14. doi: 10.1111/ajgw.12054
Shackel, K., Ahmadi, H., Biasi, W., Buchner, R., Godhamer, D., Gurusinghe, S., et al. (1997). Plant water status as an index of irrigation need in deciduous fruit trees. HorTechnology 7, 23–29. doi: 10.21273/horttech.7.1.23
Shafian, S., Rajan, N., Schnell, R., Bagavathiannan, M., Valasek, J., Shi, Y., et al. (2018). Unmanned aerial systems-based remote sensing for monitoring sorghum growth and development. PLoS One 13:e0196605. doi: 10.1371/journal.pone.0196605
Shuttleworth, W. J., and Wallace, J. S. (1985). Evaporation from sparse crops-an energy combination theory. Q. J. R. Meteorol. Soc. 111, 839–855. doi: 10.1002/qj.49711146510
Solari, L. I., Johnson, S., and DeJong, T. M. (2006). Relationship of water status to vegetative growth and leaf gas exchange of peach (Prunus persica) trees on different rootstocks. Tree Physiol. 26, 1333–1341. doi: 10.1093/treephys/26.10.1333
Torrecillas, A., Ruiz-Sanchez, M. C., Leon, A., and del Amor, F. (1989). The response of Young almond tres to different drip-irrigated conditions. Development and yield. J. Horticult. Sci. 64, 1–7. doi: 10.1080/14620316.1989.11515920
Treutter, D., and Feucht, W. (1991). Accumulation of phenolic compounds above the graft union of cherry trees. Gartenbauwissenschaft 56, 134–137.
Vargas, F., Romero, M., Clavé, J., Vergés, J., Santos, J., and Batlle, I. (2008). ‘Vayro’, ‘Marinada’, ‘Constantí’, and ‘Tarraco’ Almonds. HortScience 43, 535–537. doi: 10.21273/HORTSCI.43.2.535
Virlet, N., Lebourgeois, V., Martinez, S., Costes, E., Labbé, S., and Regnard, J. L. (2014). Stress indicators based on airborne thermal imagery for field phenotyping a heterogeneous tree population for response to water constraints. J. Exp. Bot. 65, 5429–5442. doi: 10.1093/jxb/eru309
Weiss, M., and Baret, F. (2016). S2ToolBox Level 2 products: LAI, FAPAR, FCOVER—Version 1.1. Sentin. ToolBox Level2 Products. 53. Available online at: https://step.esa.int/docs/extra/ATBD_S2ToolBox_L2B_V1.1.pdf (accessed July 20, 2020).
Wu, C., Niu, Z., Tang, Q., and Huang, W. (2008). Estimating chlorophyll content from hyperspectral vegetation indices: modeling and validation. Agric. For. Meteorol. 148, 1230–1241. doi: 10.1016/j.agrformet.2008.03.005
Xarxa Agrometeorològica de Catalunya (XAC), and Servei Meterorològic de Catalunya. (2020). Available online at: https://www.ruralcat.net/web/guest/agrometeo.estacions (accessed March 10, 2020).
Xia, T., Kustas, W. P., Anderson, M. C., Alfieri, J. G., Gao, F., McKee, L., et al. (2016). Mapping evapotranspiration with high-resolution aircraft imagery over vineyards using one-and two-source modeling schemes. Hydrol. Earth Syst. Sci. 20, 1523–1545. doi: 10.5194/hess-20-1523-2016
Xie, Q., Dash, J., Huang, W., Peng, D., Qin, Q., Mortimer, H., et al. (2018). “Vegetation indices combining the red and red-edge spectral information for leaf area index retrieval,” in IEEE Journal of selected topics in applied earth observations and remote sensing, (New York, NY: IEEE), 1939–1404.
Xiloyannis, C., Dichio, B., Tuzio, A. C., Kleinhentz, M., Salesses, G., Gomez-Aparisi, J., et al. (2007). Characterization and selection of prunus rootstocks resistant to abiotic stresses: waterlogging, drought and Iron chlorosis. Acta Hortic. 732, 247–251. doi: 10.17660/actahortic.2007.732.35
Yahmed, J. B., Ghrab, M., and Mimoun, M. B. (2016). Eco-physiological evaluation of different scion-rootstock combinations of almond grown in Mediterranean conditions. Fruits 71, 185–193. doi: 10.1051/fruits/2016003
Yan, G., Hu, R., Luo, J., Weiss, M., Jiang, H., Mu, X., et al. (2019). Review of indirect optical measurements of leaf area index: recent advances, challenges, and perspectives. Agricult. Forest Meteorol. 265, 390–411. doi: 10.1016/j.agrformet.2018.11.033
Zarco-Tejada, P. J., Diaz-Varela, R., Angilera, V., and Loudjani, P. (2014). Tree height quantification using very high resolution imagery acquired from an unmanned aerial vehicle (UAV) and automatic 3D photo-reconstruction methods. Eur. J. Agron. 55, 89–99. doi: 10.1016/j.eja.2014.01.004
Keywords: thermal, field phenotyping, water productivity, TSEB model, stem water potential, crown area, yield
Citation: Bellvert J, Nieto H, Pelechá A, Jofre-Čekalović C, Zazurca L and Miarnau X (2021) Remote Sensing Energy Balance Model for the Assessment of Crop Evapotranspiration and Water Status in an Almond Rootstock Collection. Front. Plant Sci. 12:608967. doi: 10.3389/fpls.2021.608967
Received: 22 September 2020; Accepted: 08 February 2021;
Published: 10 March 2021.
Edited by:
Helen H. Tai, Agriculture and Agri-Food Canada (AAFC), CanadaReviewed by:
Iván Francisco García-Tejero, Ifapa Centro Las Torres Tomejil, SpainArturo Reyes, Forestales y Pecuarias, Mexico
Copyright © 2021 Bellvert, Nieto, Pelechá, Jofre-Čekalović, Zazurca and Miarnau. This is an open-access article distributed under the terms of the Creative Commons Attribution License (CC BY). The use, distribution or reproduction in other forums is permitted, provided the original author(s) and the copyright owner(s) are credited and that the original publication in this journal is cited, in accordance with accepted academic practice. No use, distribution or reproduction is permitted which does not comply with these terms.
*Correspondence: Joaquim Bellvert, am9hcXVpbS5iZWxsdmVydEBpcnRhLmNhdA==