 Konrad Krämer
 Arnd G. Heyer
- Department of Plant Biotechnology, Institute of Biomaterials and Biomolecular Systems, University of Stuttgart, Stuttgart, Germany
It has been shown repeatedly that exposure to elevated atmospheric CO2 causes an increased C/N ratio of plant biomass that could result from either increased carbon or – in relation to C acquisition - reduced nitrogen assimilation. Possible reasons for diminished nitrogen assimilation are controversial, but an impact of reduced photorespiration at elevated CO2 has frequently been implied. Using a mutant defective in peroxisomal hydroxy-pyruvate reductase (hpr1-1) that is hampered in photorespiratory turnover, we show that indeed, photorespiration stimulates the glutamine-synthetase 2 (GS) / glutamine-oxoglutarate-aminotransferase (GOGAT) cycle, which channels ammonia into amino acid synthesis. However, mathematical flux simulations demonstrated that nitrate assimilation was not reduced at elevated CO2, pointing to a dilution of nitrogen containing compounds by assimilated carbon at elevated CO2. The massive growth reduction in the hpr1-1 mutant does not appear to result from nitrogen starvation. Model simulations yield evidence for a loss of cellular energy that is consumed in supporting high flux through the GS/GOGAT cycle that results from inefficient removal of photorespiratory intermediates. This causes a futile cycling of glycolate and hydroxy-pyruvate. In addition to that, accumulation of serine and glycine as well as carboxylates in the mutant creates a metabolic imbalance that could contribute to growth reduction.
Introduction
In the course of climate change a substantial increase of the atmospheric CO2 concentration is expected for the 21th century (IPCC, 2014; Szulejko et al., 2017). Because CO2 is the substrate for plant photosynthesis, alteration in the CO2 level have a direct impact on plant metabolism. The enzyme ribulose-1,5-bisphosphat-carboxylase/−oxygenase (RUBISCO) catalyses CO2 fixation, but can also use O2 as substrate, resulting in the production of 2-phosphoglycolate, which is then further processed in the so-called photorespiration (PR) pathway (Shih et al., 2015). Because carboxylation is preferred over oxygenation (Sharkey, 1988), elevated CO2 concentrations (eCO2) will distinctly reduce the probability of oxygenation of RUBISCO (Sharkey, 1988), and thus flux through the PR pathway will decline. Considering that a large proportion of the amino acids glycine (Gly) and serine (Ser) are produced during PR, this will affect plant primary metabolism.
In the course of PR two molecules of 2-phosphoglycolate (2-PG) are converted to one molecule of 3-phosphoglycerate, which is fed back into the Calvin-Benson-Cycle (Huma et al., 2018). More precisely, 2-PG is converted to glycolate which is subsequently oxidized to glyoxylate, producing H2O2 as a byproduct in peroxisomes. Next, glyoxylate is transaminated to Gly. The N source is either Ser or glutamate (Glu), resulting in the production of hydroxypyruvate and α-Ketoglutarate (α-KG), respectively (Nunes-Nesi et al., 2010). Hydroxypyruvate is reduced by the hydroxypyruvate-reductase (HPR) forming glycerate which can be phosphorylated to 3-phosphoglycerate (Timm et al., 2008). Gly is transported to mitochondria, where it is used by the glycine-decarboxylase (GDC), converting Gly, NAD+ and tetrahydrofolic acid to NADH, CO2, NH4+ and N5, N10 -methylene-tetrahydrofolic acid. The CO2 evolution in this step is eponymous for the PR (Rebeille et al., 1994). Together with N5, N10 -methylene-tetrahydrofolic acid a second molecule of Gly is converted to Ser by the enzyme serine-hydroxymethyl transferase (SHMT). Ser is transported to the peroxisomes, where it serves as N donor for Gly production from glyoxylate, yielding hydroxypyruvate (Nunes-Nesi et al., 2010). Besides energy consumption, the oxygenation of RUBISCO and the subsequent PR create toxic intermediates such as 2-PG, glycolate and glyoxylate, which must be removed quickly (Anderson, 1971; Dellero et al., 2016). Even though the entire pathway, starting from oxygenation of ribulose-bisphosphate, appears wasteful, there is strong evidence that PR plays a role in the response to abiotic stress (Voss et al., 2013), for photoprotection (Guan et al., 2004) and nitrogen (N) assimilation (Cousins and Bloom, 2004; Bloom, 2015; Kraemer et al., 2021a).
Nitrogen assimilation mainly starts from nitrate that is reduced to nitrite and subsequently to ammonium by nitrate reductase (NR) and nitrite reductase, respectively (Xu et al., 2012). Ammonium is used to produce glutamine, the acid amide of Glu, catalyzed by glutamine synthetase (GS). The net synthesis of amino acids is then accomplished by the enzyme glutamine-oxoglutarate aminotransferase (GOGAT), which produces two molecules of Glu. Thus, the two enzymes GS and GOGAT create a cycle of Glu synthesis and amination that consumes ammonium, α-KG, ATP and reducing equivalents and yields Glu (Selinski and Scheibe, 2019).
Bloom (2015) proposed that increased PR flux causes higher malate levels in the cytosol. These could maintain turnover in the GS/GOGAT cycle and, concomitantly, produce NADH as substrate for NR. However, Andrews et al. (2019) showed that eCO2 affects N assimilation independently of the form of N administered, and that no inhibition of nitrate assimilation occurs. Thus, the mechanism by which eCO2 interferes with N assimilation remains unclear. Using a mathematical model that was parameterized by literature data, Zhao et al. (2021) demonstrated evidence that α-KG becomes limiting for N assimilation under eCO2, and we have obtained similar results investigating photosynthetic acclimation to eCO2 (Kraemer et al., 2021a). Because α-KG is central in the GS/GOGAT cycle, this again puts the PR pathway in focus. In this study we investigate the role of PR flux for N assimilation. We compare Arabidopsis thaliana plants grown at either ambient or eCO2. To create different PR fluxes, we used the hpr1-1 mutant which lacks peroxisomal HPR (Timm et al., 2008) This results in elevated levels of Gly and Ser (Timm et al., 2021), stunted growth at ambient CO2 and a chlorotic phenotype (Li et al., 2019). The mutant shows elevated levels of α-KG and free amino-acids (Timm et al., 2021). We propose that growth reduction in the mutant is at least partly due to a disturbed energy household resulting from insufficient linear flux through PR.
Materials and Methods
Plant Growth and Photosynthesis Measurement
A. thaliana wildtype Col-0 and the mutant hpr1-1 (SALK067724) were grown in hydroponic culture for 50 days in a growth chamber with 8 h/16 h light/dark regime (100 μmol m−2 s−1; 22°C/16°C). For the first 17 days plants were grown at ambient CO2 (450 ± 20 ppm). Afterwards half of the plants were transferred to eCO2 (1,000 ± 20 ppm). The hydroponic medium was as described in Brauner et al. (2014) with the difference that no ammonium was supplied and the nitrate concentration reduced to 2.175 mM. This assured sufficient, but not excess supply of N as identified in experiments with different levels of nitrate supply. For measurements of metabolites and enzyme activities, full rosettes of 50 day old plants were harvested every 2 h over a full diurnal cycle at fivefold replication under ambient as well as eCO2, resulting in a total of 120 samples. Photosynthesis measurements were conducted 1 week before harvesting as described by Küstner et al. (2019). Briefly, an infrared gas analysis system (Uras 3G; Hartmann and Braun AG, Frankfurt am Main, Germany) equipped with five custom made whole-rosette cuvettes and a sixth channel for measurement of CO2 in surrounding atmosphere was operated at a flow rate of 40 l/h, and each of the channels was measured sequentially for 6 min over a full diurnal cycle at a rate of 0.1 Hz. From the measured time points, splines were generated to yield a complete course of photosynthetic activity. All measurements were conducted at growth light and the respective CO2 concentration. Using the result of the photosynthesis measurements the photorespiratory activity was calculated according to the method developed by Sharkey (1988). For Γ* the values identified by Kraemer et al. (2021a) were used. As a first step, the ratio between oxigenation and carboxylation- Φ-was calculated according to equation (1).
Using this ratio the rate of oxygenation was calculated according to equation (2).
The photorespiratory activity used in the model was calculated as the oxygenation rate divided by 2.
Metabolite Measurements
Gly, Ser, α-KG, glucose, fructose and sucrose were measured by quantitative GC–MS/MS. Samples were extracted using 750 μl methanol with 25 nmol ribitol as internal standard. After 15 min at 70°C followed by shaking for 10 min at RT samples were centrifuged (5 min 17,000 g). The supernatant was transferred to a new vessel, and 400 μl of H2O were added. After incubation for 10 min at 95°C samples were agitated for 10 min at RT. Following centrifugation (5 min, 17,000 g) the supernatants were pooled. Subsequently, 300 μl H2O and 200 μl chloroform were added. After centrifugation (2 min, 17,000 g) the two phases were separated and the polar phase was dried in a speedvac and used for analysis. Dried samples were derivatized using 20 μl of methoxamine dissolved in pyridine (40 mg/ml) by incubation for 90 min at 30°C. Next, 80 μl N-methyl-N-(trimethylsilyl)trifluoracetamide (MSTFA) were added and the solution was incubated for 30 min at 50°C. Metabolites were measured by gas-chromatography coupled to mass-spectrometry (GC–MS/MS). For injection, 1 μl of the derivatized sample was used. The GC–MS/MS device was a GCMS-TQ8040 (Shimadzu, Kyoto, Japan) using helium as carrier gas at a flow of 1.12 ml/min. The stationary phase was a 30 m Optima 5MS-0.25 μm fused silica capillary column. Injection temperature was 230°C. The transfer line and ion source were set to 250°C and 200°C, respectively. The initial temperature of the column oven was 80°C and this was increased by 15°C/min until the final temperature of 330°C was reached and held for 6 min. After a solvent delay of 4.6 min, spectra of the MS device were recorded in the multiple reaction mode (MRM) with specific target-ions for each metabolite. External standards were used for quantification.
Starch, hexose-phosphates and the total amino-acid pool were determined photometrically and carbonic acids (fumaric acid, malic acid and citric acid) by HPLC as described by Küstner et al. (2019). Ammonium was quantified according to Vega-Mas et al. (2015). Glu and Gln were measured according to Graham and Aprison (1966) and Pérez-de la Mora et al. (1989).
Enzymatic Activities
Activity of nitrate reductase was measured as described by Scholl et al. (1974). Activity of hydroxy-pyruvate-reductase was determined according to Bauwe (2017). GS activity was measured according to Berteli et al. (1995) and Silveira et al. (2003). Briefly, protein was extracted into a 100 mM Tris–HCl (pH 7.6) buffer containing 2.5 mM dithiothreitol and 10 mM MgCl2. The assay buffer contained 125 mM Tris–HCl (pH 7.6), 5 mM ATP, 80 mM MgSO4, 125 mM hydroxylamine-NaOH (pH 7) and 100 mM glutamate (pH 7.2). To an assay buffer volume of 80 μl, 120 μl of protein extract were added and incubated for different time-points (0, 20, 25 and 30 min). To determine the background, an assay buffer was used without hydroxylamine-NaOH (pH 7). The reaction was stopped using 60 μl of a solution consisting of 1.5 ml 10% w/v FeCl3*6 H2O in 0.2 N HCl, 1.5 ml 24% w/v trichloroacetic acid and 1.5 ml 20% v/v HCl. Afterwards, the absorption was determined at 540 nm. For calibration curves L-glutamic acid γ-monohydroxamate was used.
All enzyme activities were determined at the beginning, middle and end of the light phase as well as in the middle of the night. Values for the remaining time-points were calculated by spline interpolation. For the calculation of reaction velocity, substrate concentration was calculated from the measured metabolite contents, assuming that 1 g of plant biomass had a volume of 0.77 ml.
Data Analysis and Statistics
Data evaluation, normalization, visualization and statistics were performed in Microsoft Excel (RRID:SCR_016137) and the R software (R Project for Statistical Computing, RRID:SCR_001905). The experimental design was a randomized complete block design with CO2 level as block and genotype as treatment. If not otherwise stated, two-way ANOVA for genotype and CO2 treatment effects were used for statistical analysis. Parameter optimization was performed in a way that in silico time courses best matched the measured time courses. For optimization and simulations the R-package paropt was used (Kraemer et al., 2021b).
Results
Diurnal Dynamics of Metabolites
Net photosynthetic rates (PS) increased by about 50% in the wildtype, when CO2 concentration was raised to 1,000 ppm. The wildtype had significantly higher PS than the mutant (p < 2e-16) under both conditions (Col-0 at ambient CO2 = 85.4 ± 12.8 μmol/g * h, Col-0 at eCO2 = 128.1 ± 44.9 μmol/g * h, hpr1-1 at ambient CO2 = 76.8 ± 19.9 μmol/g * h, hpr1-1 at eCO2 = 98.6 ± 35.8 μmol/g * h). An increase in net photosynthesis by about 50% at eCO2 in the wildtype is in accordance with previous observations (Jauregui et al., 2016). However, a stronger reduction of photosynthesis in hpr1-1 was reported for higher light intensities by Timm et al. (2008).
Despite the lower PS rate and no obvious deviations in hexose-phosphate levels (Supplementary Image 1), the combined pool of malate and fumarate (MF) was larger in the hpr1-1 mutant than in wildtype (p = 4.1e-10). Citrate (Cit) was elevated in hpr1-1 only at ambient CO2 (Supplementary Image 1; p = 2.47e-7) and showed a different response to rising CO2 levels: while it increased in the wildtype (p = 7.1e-4, t-test for wildtype), it declined in the mutant (p = 5.08e-6, t-test for hpr1-1).
The PR intermediates Gly and Ser accumulated in the mutant under both conditions (Figures 1A,B). As expected, the contents were higher at ambient CO2. For NH4+, which is also produced during PR, significant genotype and treatment effects were observed with higher levels in hpr1-1 and a general decrease under eCO2 (p = 5.67e-5 and p = 4.38e-6, respectively).
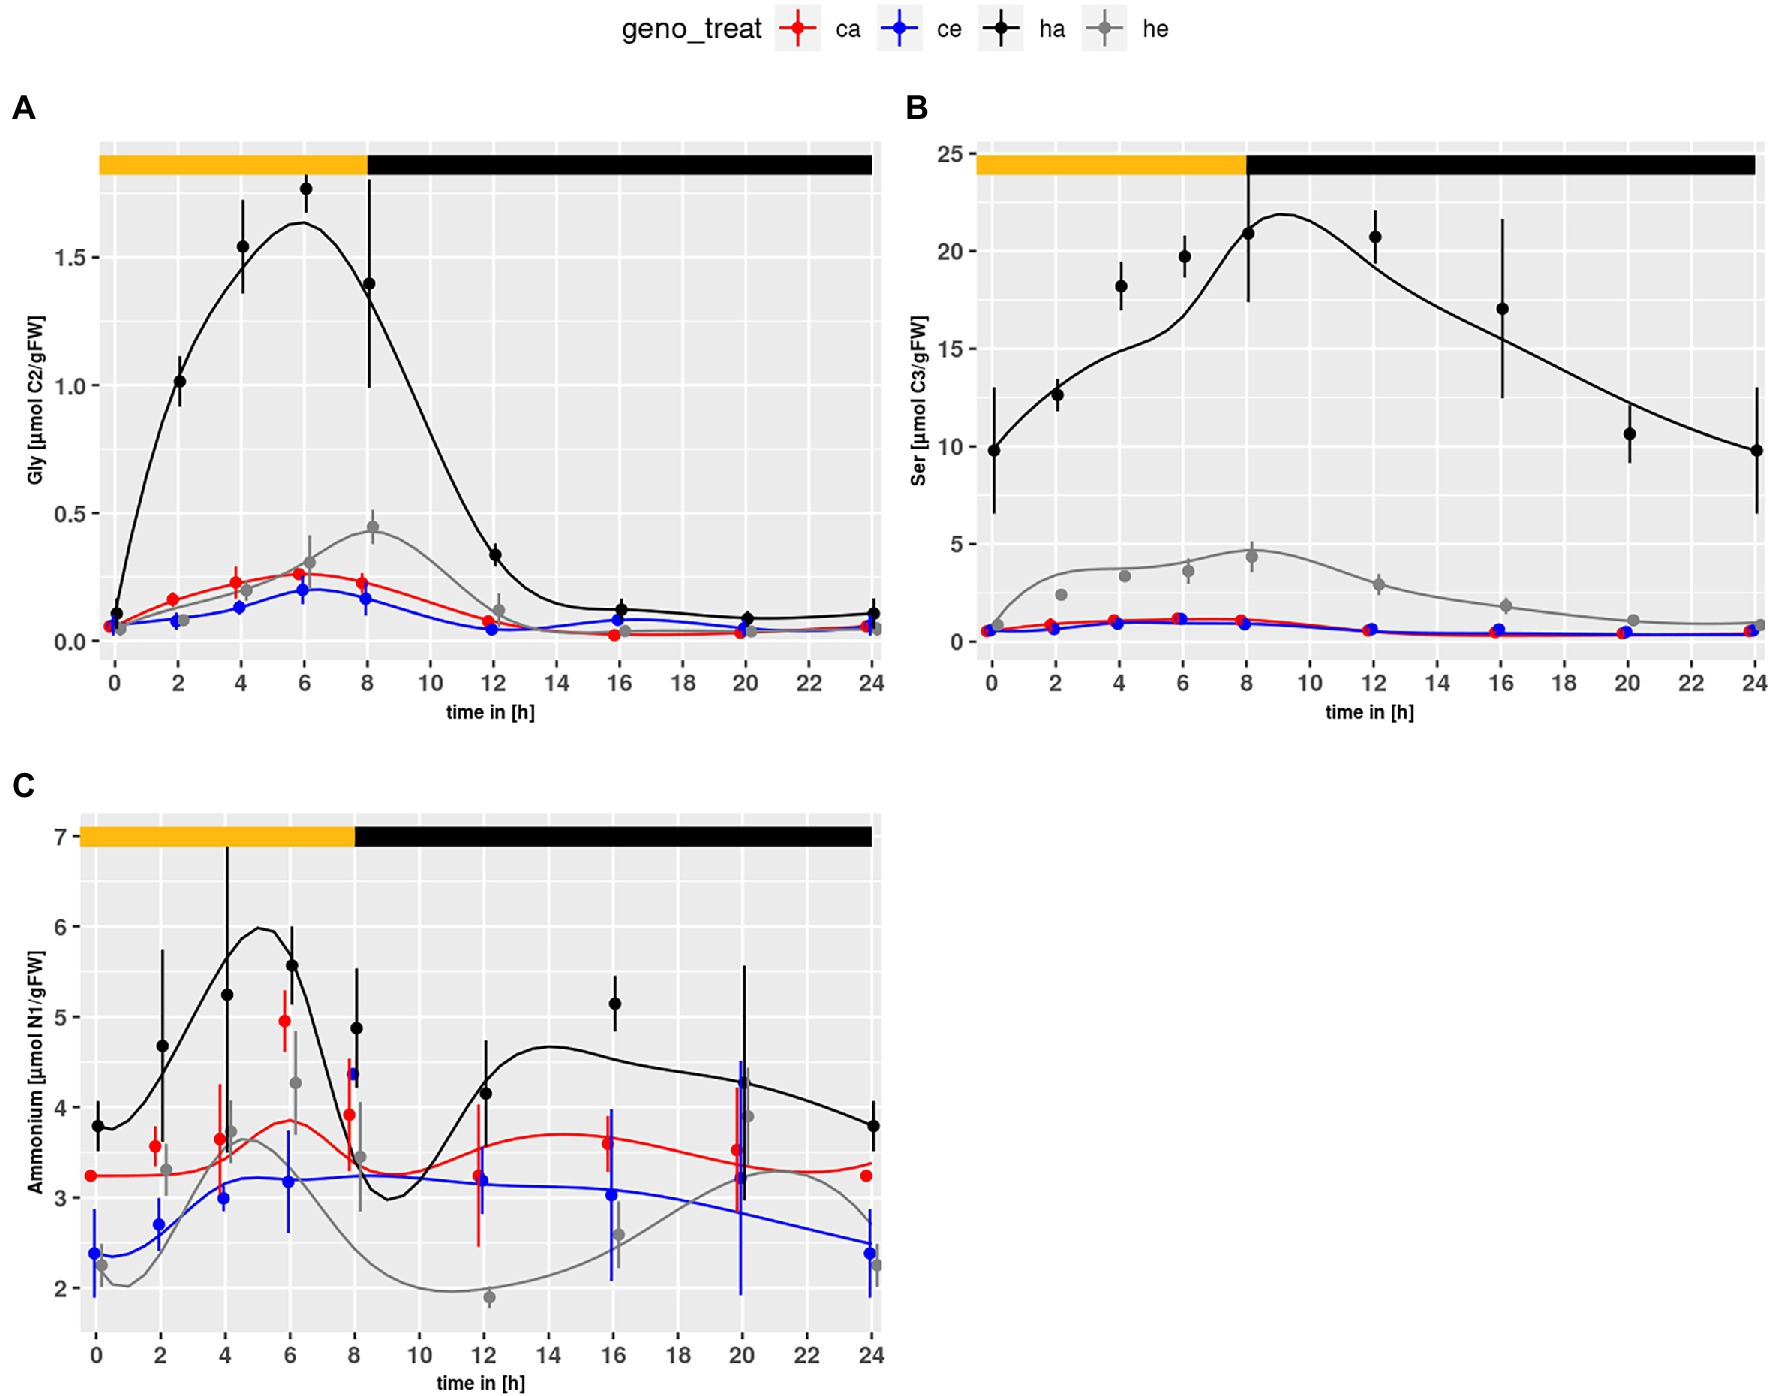
Figure 1. Diurnal course of photorespiratory intermediates; (A) glycine, (B) serine, (C) ammonium. Col-0 ambient: red, Col-0 eCO2: blue; hpr1-1 mutant ambient: black, hpr1-1 mutant eCO2: grey. Shown are means with standard error (n = 5). Lines represent the mean of 20 simulations. Light phase is indicated by yellow bar and dark phase indicated by black bar.
Similar to the NH4+ content, Glu levels (Figure 2A) were elevated in the mutant as compared to wildtype (p = 7.71e-4) and significantly increased in mutant plants at ambient CO2 as compared to eCO2 (p = 2.03e-10). This effect could not be observed for Col-0. Neither genotype nor treatment effects were observed for Gln (Figure 2B). However, when considering the mutant alone, an elevated level at ambient CO2 became obvious (p = 0.0163). The α-KG content (Figure 2C) was strongly increased for hpr1-1 at ambient CO2, Considering that Glu is converted to α-KG when used as substrate for transamination of glyoxylate in the peroxisome, elevated α-KG may point to an increased Glu turnover for transamination of glyoxylate.
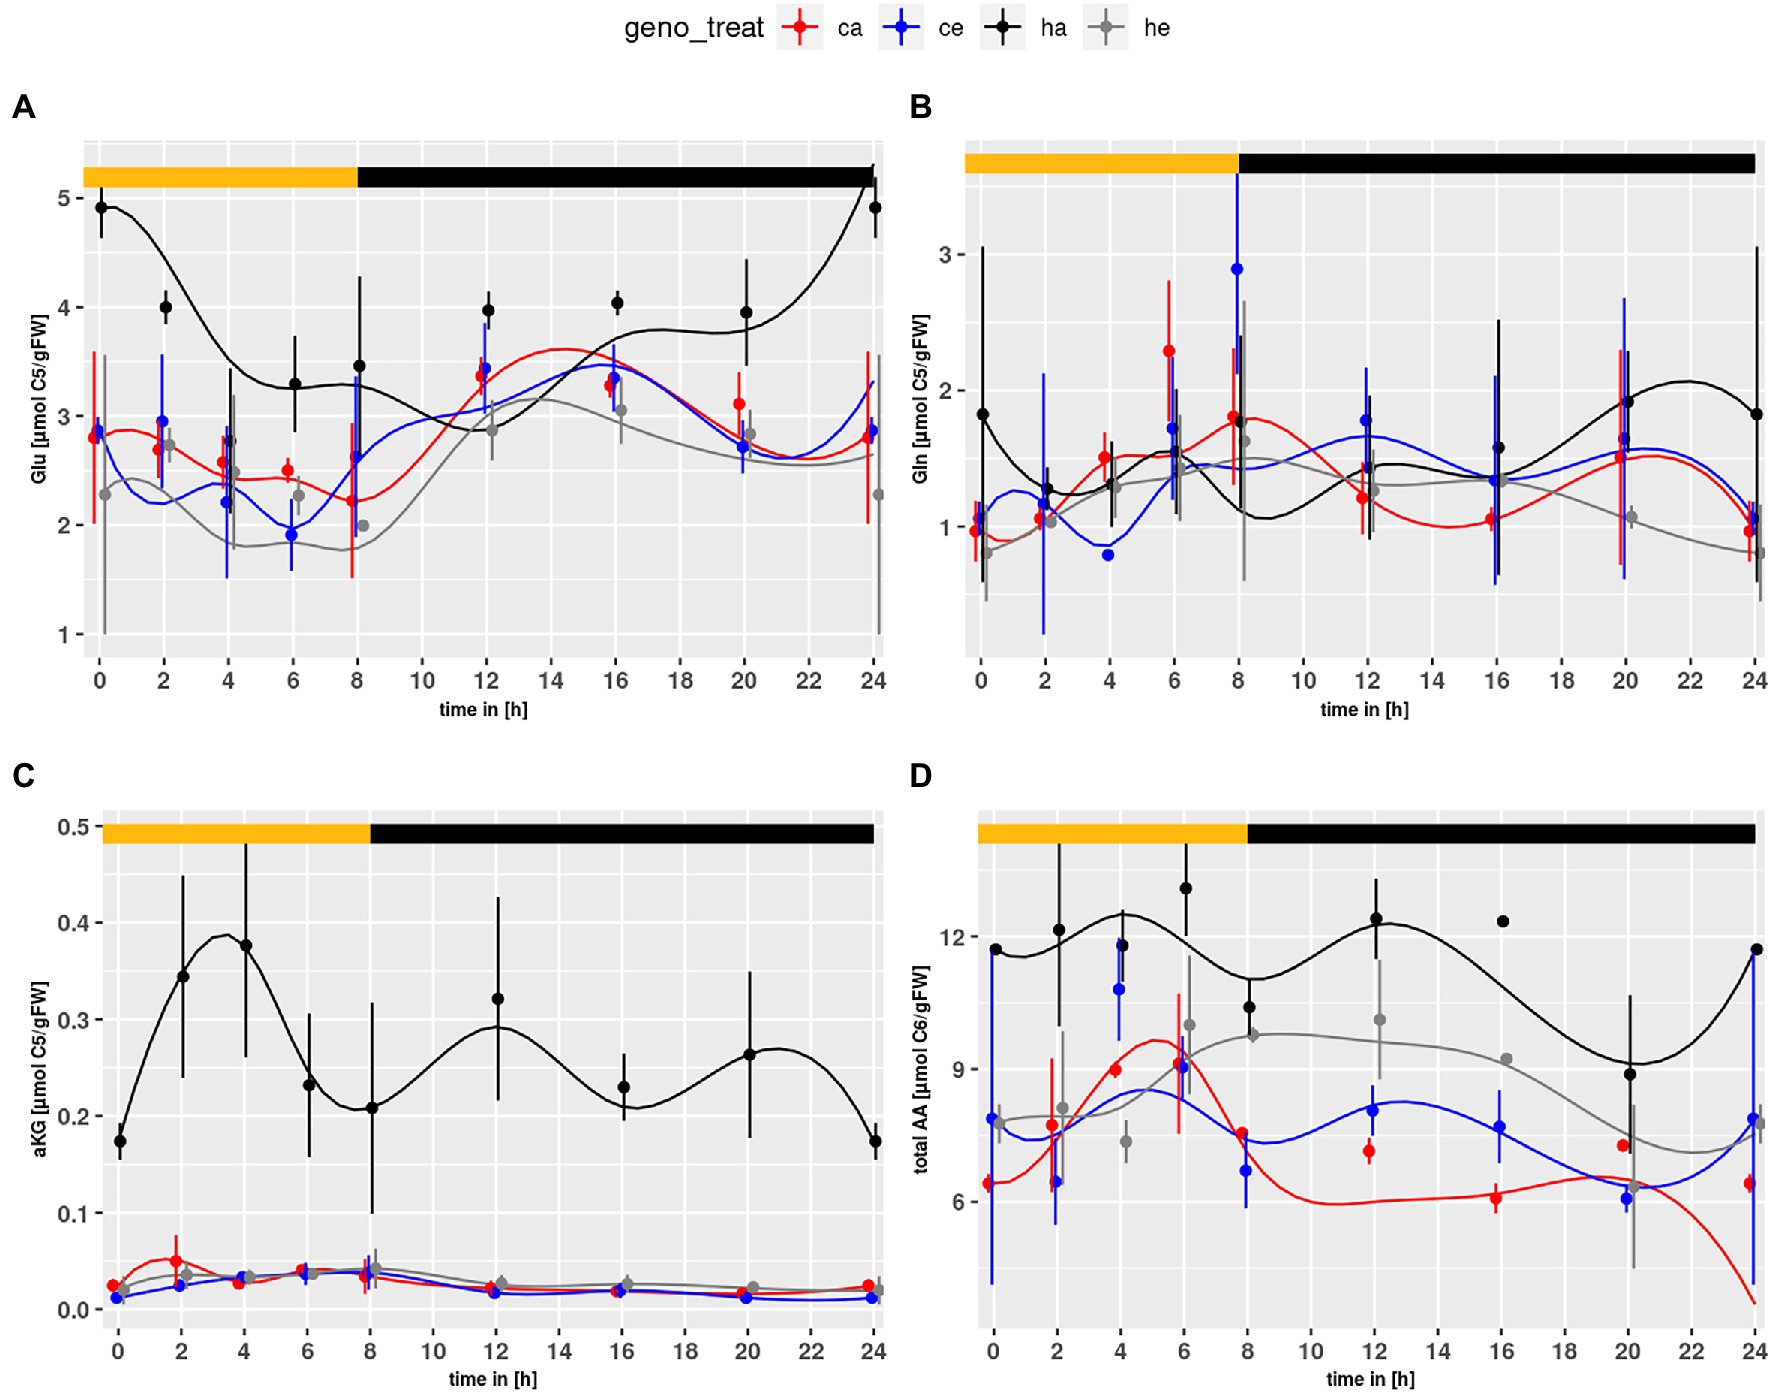
Figure 2. Diurnal course of (A) glutamate, (B) glutamine, (C) α-ketoglutarate, (D) total amino acids. Col-0 ambient: red, Col-0 eCO2: blue; hpr1-1 mutant ambient: black, hpr1-1 mutant eCO2: grey. Shown are means with standard error (n = 5). Lines represent the mean of 20 simulations. Light phase is indicated by yellow bar and dark phase indicated by black bar.
Furthermore, the amino acid (AA) pool (Figure 2D) was elevated in the mutant compared to wildtype (p < 2.0e-16). Considering only mutant data, an increase at eCO2 was significant (p < 2.0e-16). Thus, no indications for N-starvation in the mutant were found.
Diurnal Dynamics of Parameters for Enzyme Activity
Maximum activities were determined for three enzymes central to de novo N assimilation, amino acid metabolism and PR. For NR, the Col-0 wildtype showed the highest activity at eCO2 (Supplementary Image 2A). This constituted a significant genotype effect (p = 0.0346) that was unexpected considering reports of decreased N assimilation at eCO2 (Bloom et al., 2014). In addition, a time effect with highest activity at midday was observed independent of the condition (p = 0.0017). GS activity (Supplementary Image 2B) was clearly affected by the CO2 level with higher activity at ambient CO2 than at eCO2 (p = 4.14e-13). Notably, hpr1-1 had even higher GS activity than Col-0 when grown at ambient CO2 (p = 0.0021), indicating a higher potential for turnover in the GS/GOGAT cycle. Not surprisingly, a genotype effect was found for HPR activity (Supplementary Image 2C; p < 2e-16). In addition, a treatment effect was detected, which was dependent on the hpr1-1 data (p = 0.0461).
Model Construction
With the aim of mathematically simulating C/N interactions at eCO2, a dynamic model based on ordinary differential equations (ODE) was constructed that covered carbon as well as nitrogen acquisition. The model structure is depicted in Figure 3. Based on measurements of photosynthesis and respiration as well as metabolite content at 8 time points over a diurnal cycle, kinetic parameters were identified that allowed simulation of metabolite dynamics with only the metabolite levels at the beginning of the light period (t = 0) given. The identified parameters (see Supplementary Table 1) describe turnover rates for C- and N-compounds. Besides concentrations of O2 and CO2, the plant biomass (BM), starch level, amount of assimilates exported from the leaves (EXP) and nitrate level are regarded as beyond the system boundaries, which means that, e.g., the rate of starch synthesis is included in simulations, but not the actual amount that has accumulated at a certain time point. In contrast, levels of Gly, Ser, HP, MF, Cit, α-KG, Glu, Gln, AA and NH4+ are included in the simulations. For the carbon fluxes to biomass and sink organs (hp2BM/EXP; note: all fluxes in italics), to or among carboxylic acids (hp2MF, Cit2MF, MF2Cit, Cit2KG), as well as the C/N fluxes from serine to amino acids (Ser2AA) and amino acids to biomass and export (AA2BM/EXP), mass balance kinetics were applied. The remaining reactions are represented as Michaelis–Menten kinetics. Kinetic equations for enzyme reactions are given in file Supplementary Data Sheet 1. The full ODE system is given in file Supplementary Data Sheet 2.
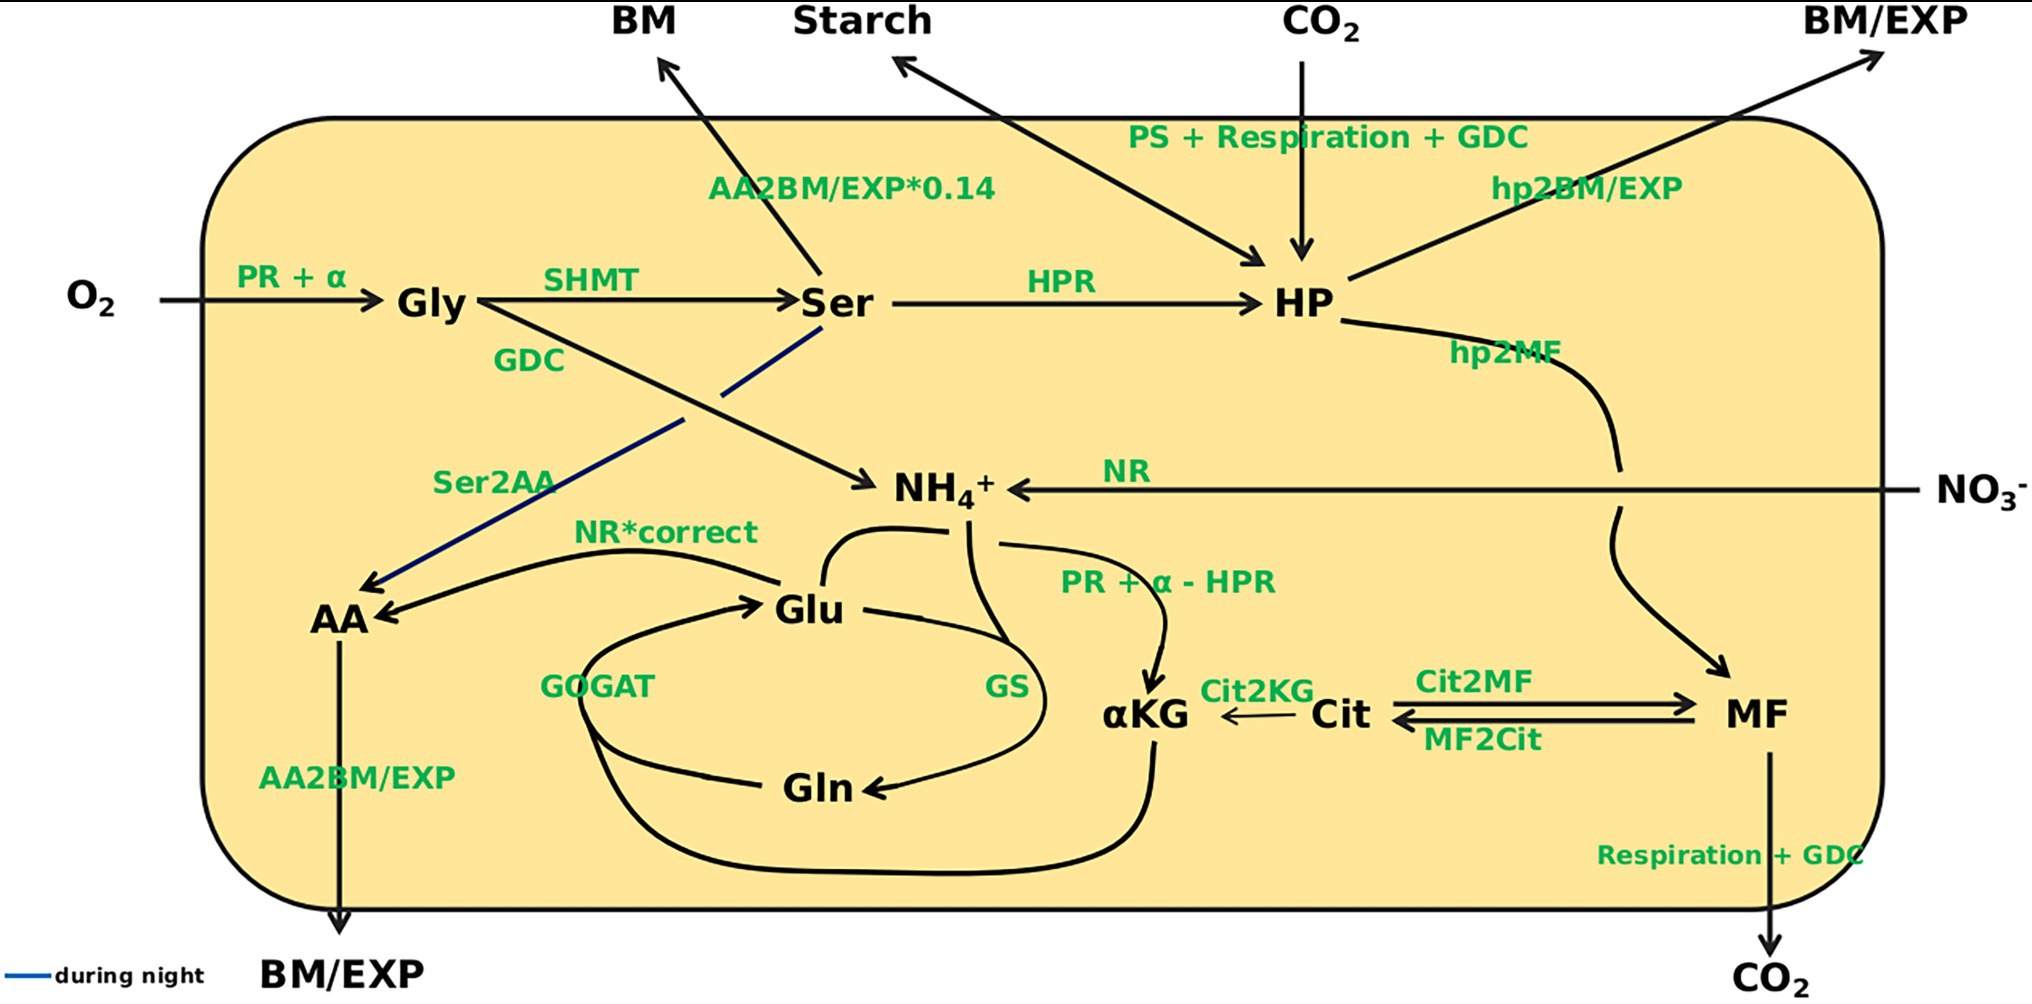
Figure 3. Overview of the model. Model states are given in black. O2, CO2, biomass (BM), Starch, export (EXP), and NO3− are outside the system boundary. Gly, glycine; Ser, serine; HP, hexose-phosphates; MF, malate + fumarate; Cit, citrate; α-KG, α-ketoglutarate; Glu, glutamate; Gln, glutamine; AA, amino acids; NH4+, ammonium. For the following fluxes mass balance kinetics were used: hp2BM/EXP, hp2MF, Cit2MF, MF2Cit, Cit2KG, Ser2AA, AA2BM/EXP. The remaining reactions are represented as Michaelis–Menten kinetics.
Initial steps of the PR pathway are represented by a reaction yielding Gly, which means that all reactions from oxygenation of ribulose-bisphosphate to glyoxylate formation were not resolved, because absolute quantification of the respective intermediates is not reliable. Input into the pathway was calculated on the basis of PS according to Sharkey (1988). Gly is converted to Ser, which was considered precursor for the HPR reaction that feeds back into the pool of sugar-phosphates. Alternatively, Ser can flow into the pool of the other AA, representing the reaction of Ser-pyruvate aminotransferase.
All short-lived intermediates of the Calvin-Benson-Cycle, triose-phosphates and hexose-phosphates were represented by the HP pool, which is quantitatively dominated by glucose-6-phosphate and fructose-6-phosphate. The latter were quantified enzymatically (see Material and Methods). Photosynthesis, measured as CO2 uptake per time, constituted the carbon input into this pool. Measured values were corrected for mitochondrial respiration and PR input. Mitochondrial respiration was measured during the dark phase and set constant over the entire diurnal cycle as earlier suggested by Küstner et al. (2019) and Kraemer et al. (2021a). The HP pool was set as the precursor for cell wall synthesis and the supply of carbon to sinks. It should be mentioned that the transport metabolite, sucrose, attains much higher levels than measured for HP, which is substrate for cell wall biosynthesis. While this would affect the ratio of BM formation and transport rates, when kinetic parameters are constrained, this was not the case in the current model, which left wide ranges for the BM/EXP parameter, because assimilate export was not in focus. In the model, assimilate export and biomass formation were represented by the combined flux hp2BM/EXP. In addition, HP is in exchange with starch that serves as carbon source during the night. Starch production during the day and degradation at night was assumed to be linear as outlined by Stitt and Zeeman (2012). As demonstrated by Gauthier et al. (2010) and Tcherkez et al. (2009), Cit is not, or only to a very low extent, produced during the day, but accumulates during the night and is used for α-KG production during the next day (Cheung et al., 2014). Therefore, the substrate for accumulation of MF during the light phase was considered to be HP, thus referring to anaplerotic reactions. However, the possibility of a flux from Cit to MF was not excluded. MF is used for mitochondrial respiration.
During the reaction from Gly to Ser NH4+ is produced and, together with Glu, can be used by GS to produce Gln (Supplementary Image 2). Gln can transaminate α-KG, catalyzed by GOGAT, to produce two molecules of Glu. Two reactions can yield α-KG that is required for AA production. The first reaction is from Cit (Cheung et al., 2014) representing the TCA cycle and cytosolic isocitrate dehydrogenase activity (Hodges, 2002). The second is from Glu and includes the reaction of Glu-glyoxylate-aminotransferase, which is part of PR, as well as mitochondrial Glu dehydrogenase and transamination reactions involving Glu. For Gly production, a source of N is required. This can derive from Ser, which, in the model, is included in the combined HPR flux. Alternatively, Glu can serve as N donor for Gly production. The PR flux into the system, the HPR flux, and the reaction from Glu to α-KG are all N1-fluxes. Thus, the three fluxes can be balanced, and Glu to α-KG can be expressed as PR minus HPR.
Another source of NH4+ is the reduction of nitrate by NR (Supplementary Image 2). Modeling this de novo N fixation is complicated by the fact that a large proportion of nitrate is stored in the vacuole and not accessible by NR. To account for this compartmentation, the content was adjusted based on the cellular proportion of cytosol, which is about 5% of total cell volume in mature leaves (Koffler et al., 2013). NR is the only flux providing de novo assimilated N. Thus, the step towards AA production was linked to NR. According to Gauthier et al. (2010) about 50% of Ser consist of newly assimilated N. Accordingly, we modeled the flux from Glu to AA as NR multiplied by the correction factor, correct, which was set in the interval [0.5, 1]. Because the PR intermediates Gly and Ser are the only other sinks for de novo assimilated N in our model, correct likewise determines the deposition of new N in these compounds.
Because PR flux, as defined by Sharkey (1988), is directly coupled to photosynthetic activity, the pathway would not operate in the dark, which would, in our model, exclude turnover of Gly and Ser after light-off. However, especially in the case of hpr1-1 at ambient CO2, Ser turnover was substantially extended into the night. This was accounted for by adding the summand α to the formula for PR, which allows operation of pathway reactions described by Walton and Butt (1981) independent of photosynthetic activity.
The step from Gly to Ser is catalyzed by the two enzymes GDC and SHMT. For both reactions Michaelis–Menten kinetics were employed. However, turnover of SHMT cannot exceed that of GDC, and thus SHMT was limited to the GDC value. In contrast, it is known from the literature that the GDC flux may well be substantially higher than the flux of SHMT (Rebeille et al., 1994).
Because the model structure presented in Figure 3 does not allow the amino acids Gly and Ser to contribute to biomass via the AA2BM/EXP route, a separate pathway was established for these compounds. Based on proteome information for Arabidopsis (Berardini et al., 2015) a proportion of about 10% of the amino acids in protein should be Ser. However, Rubisco, which makes up about one third of total protein (Atkinson et al., 2017), has 14% Ser, and thus, the flux from Ser to BM was set to 14% of the flux from AA to BM/EXP.
Preliminary Parameter Identification
According to the above described model structure several rounds of parameter optimization were conducted that yielded results for most states that were covered by the measured standard deviation with an averaged error between 0.05 and 0.1% per state and time point. However, Glu levels were consistently underestimated, particularly during the night as shown in Figure 4A. Choi et al. (1999) reported that the GS enzyme of Canavalina lineata is activated by a reduction at two cysteine residues, which are conserved among all known plastidial GS sequences. The authors demonstrated that reductants like dithiothreitol increase the activity of the plastidial isoform. Considering that dithiothreitol was added during protein extraction (see “Materials and Methods”), it is very likely that GS activity was overestimated, especially during the night. It is known that, following light-off, the redox milieu of the chloroplasts changes rapidly (Dietz and Hell, 2015). However, the extent of change in GS activity is unknown. Therefore, a numerical experiment was set up to mathematically assess GS activity during the night (see Figure 4B). Nocturnal GS activity was intentionally reduced in steps of 10%, and 10 simulations of model states were conducted for each step. Simulations were accepted, when results for all states lay within the measured standard deviation. As can be seen in Figure 4B, the cumulative error of simulations was minimized for nocturnal GS activity between 20 and 50% of the in vitro activity. This agrees with the data of Choi et al. (1999), who showed that dithiothreitol increased the activity by about two-fold. Thus, we added a factor in the model by which GS can be down-regulated by the optimizer during the night.
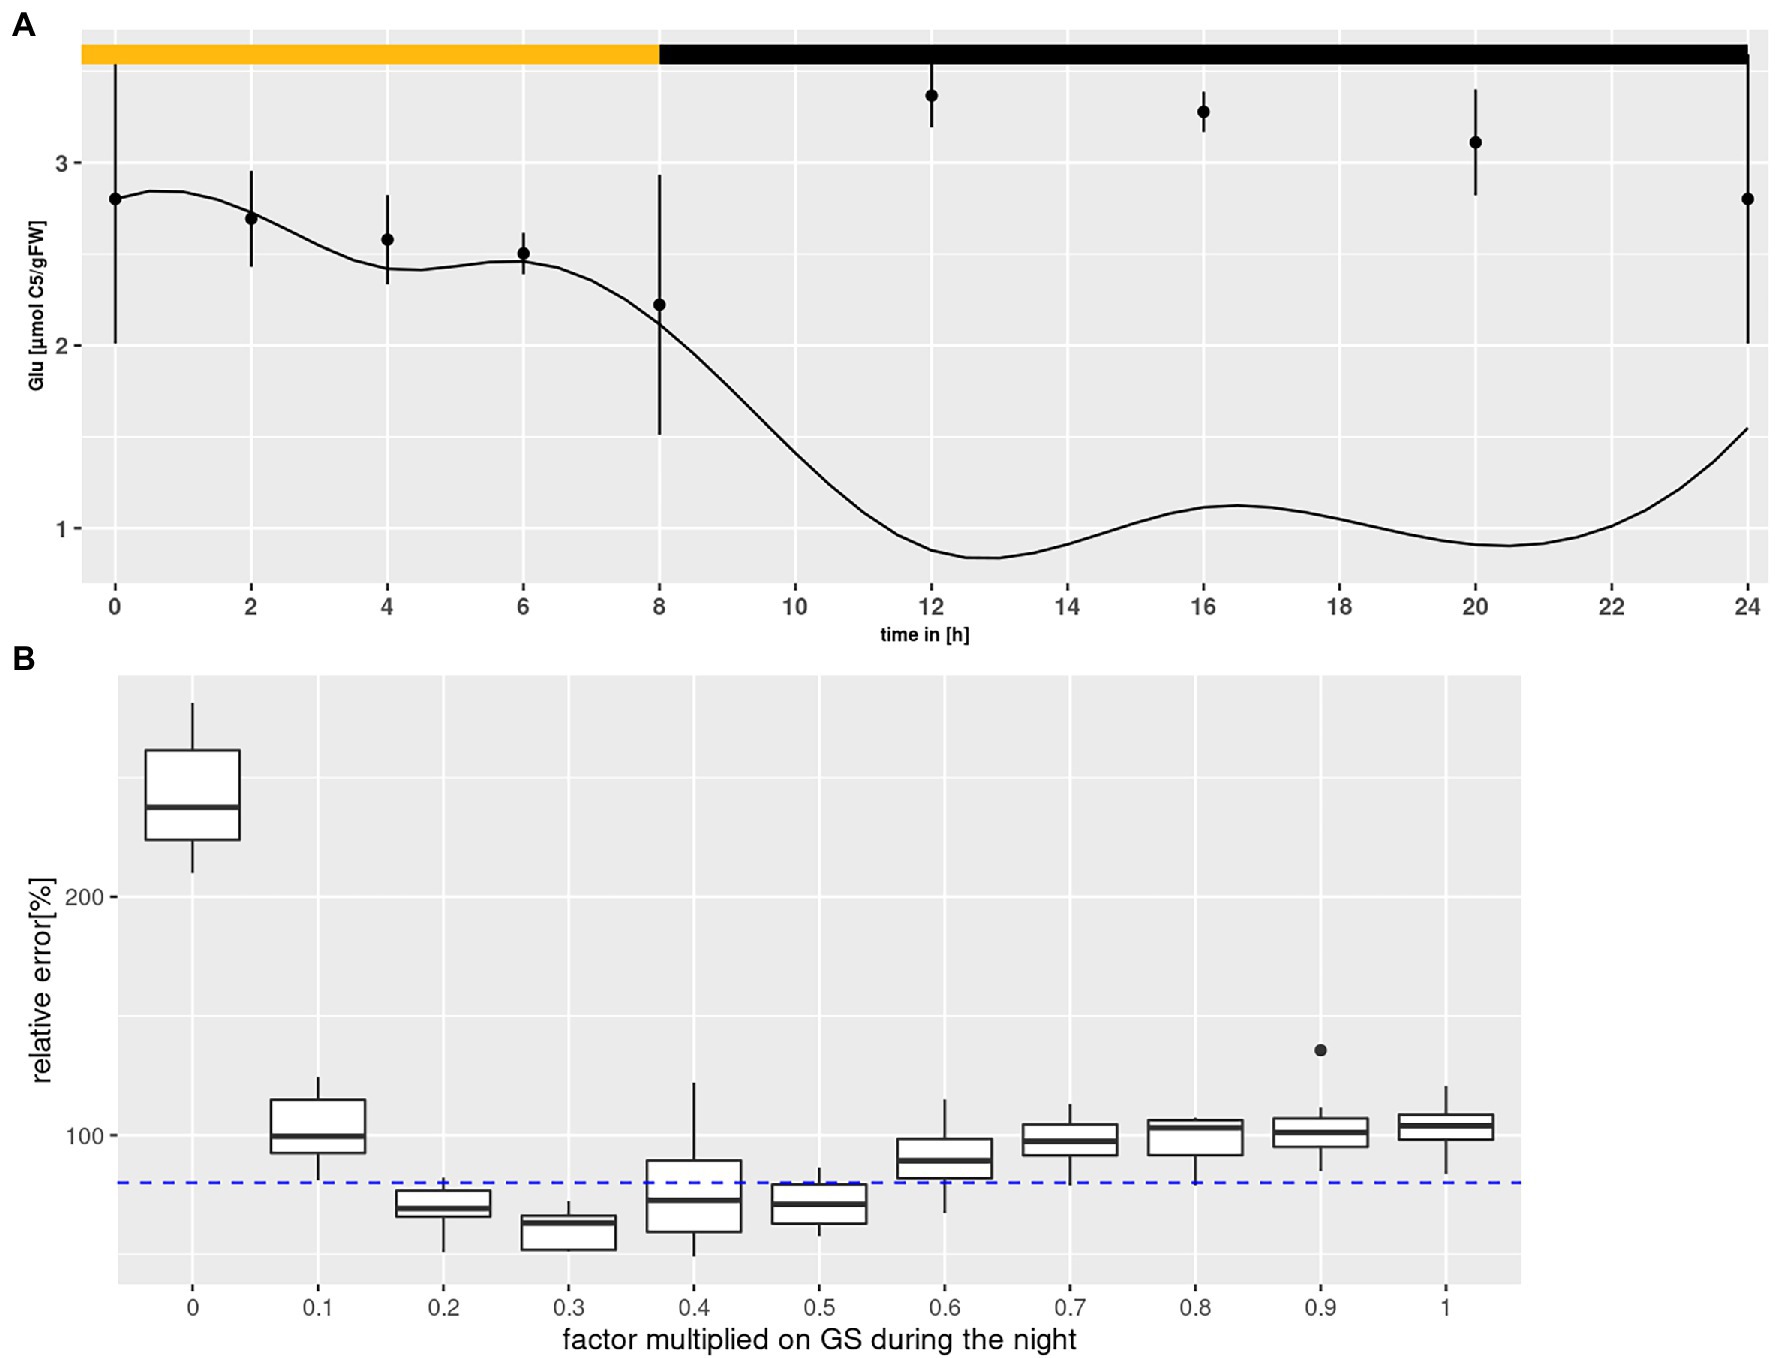
Figure 4. Glutamine synthetase (GS) inactivation. (A) Diurnal course of glutamate for Col-0 at ambient CO2 concentrations. Shown are mean with standard error (n = 5). Lines represent the mean of 10 simulations. Light phase indicated by yellow bar and dark phase indicated by black bar. (B) Error plotted against the factor multiplied with GS activity during the night. Each boxplot represents 10 simulations for Col-0 at ambient CO2 concentrations. The dashed line indicates the threshold at which results for simulations of all states were accepted (see text for criteria).
Photorespiration in the hpr1-1 Mutant
As can be seen from the model structure in Figure 3, fluxes such as HPR summarize multiple enzymatic steps, for which kinetic parameters may deviate from those determined for individual enzymes that are rate-limiting under most conditions. Thus, for identification of the km of the HPR reaction a broad interval was set in order to integrate activity of several enzymes and transporters, for which no parameter boundaries are known. This includes transport of Ser out of the mitochondria and into the peroxisomes, its de-amination by Ser-glyoxylate transaminase, the actual reduction by HPR and finally the phosphorylation of glycerate before its re-integration into the Calvin-Benson cycle. Most importantly, it is unclear whether in Col-0 HPR constitutes the rate-limiting step in the PR pathway.
Setting a broad interval for the HPR parameters created a problem for simulations in hpr1-1, because it allowed for a purely mathematical compensation of the low vmax in the mutant by choosing an adequately low km. To prevent this, the identified minimum of the km value for HPR in Col-0 was set as lower boundary for simulations of the hpr1-1 mutant with the underlying assumption that the km, being a feature of a protein, cannot easily change. However, using this approach the simulated Ser pool was slightly higher then measured for the mutant at eCO2 (Figure 5) albeit not at ambient. Opening of the lower boundary to allow a further 30% reduction of the km could correct this, as demonstrated by the simulations in Figure 1B, and was thus used as setting for all simulations.
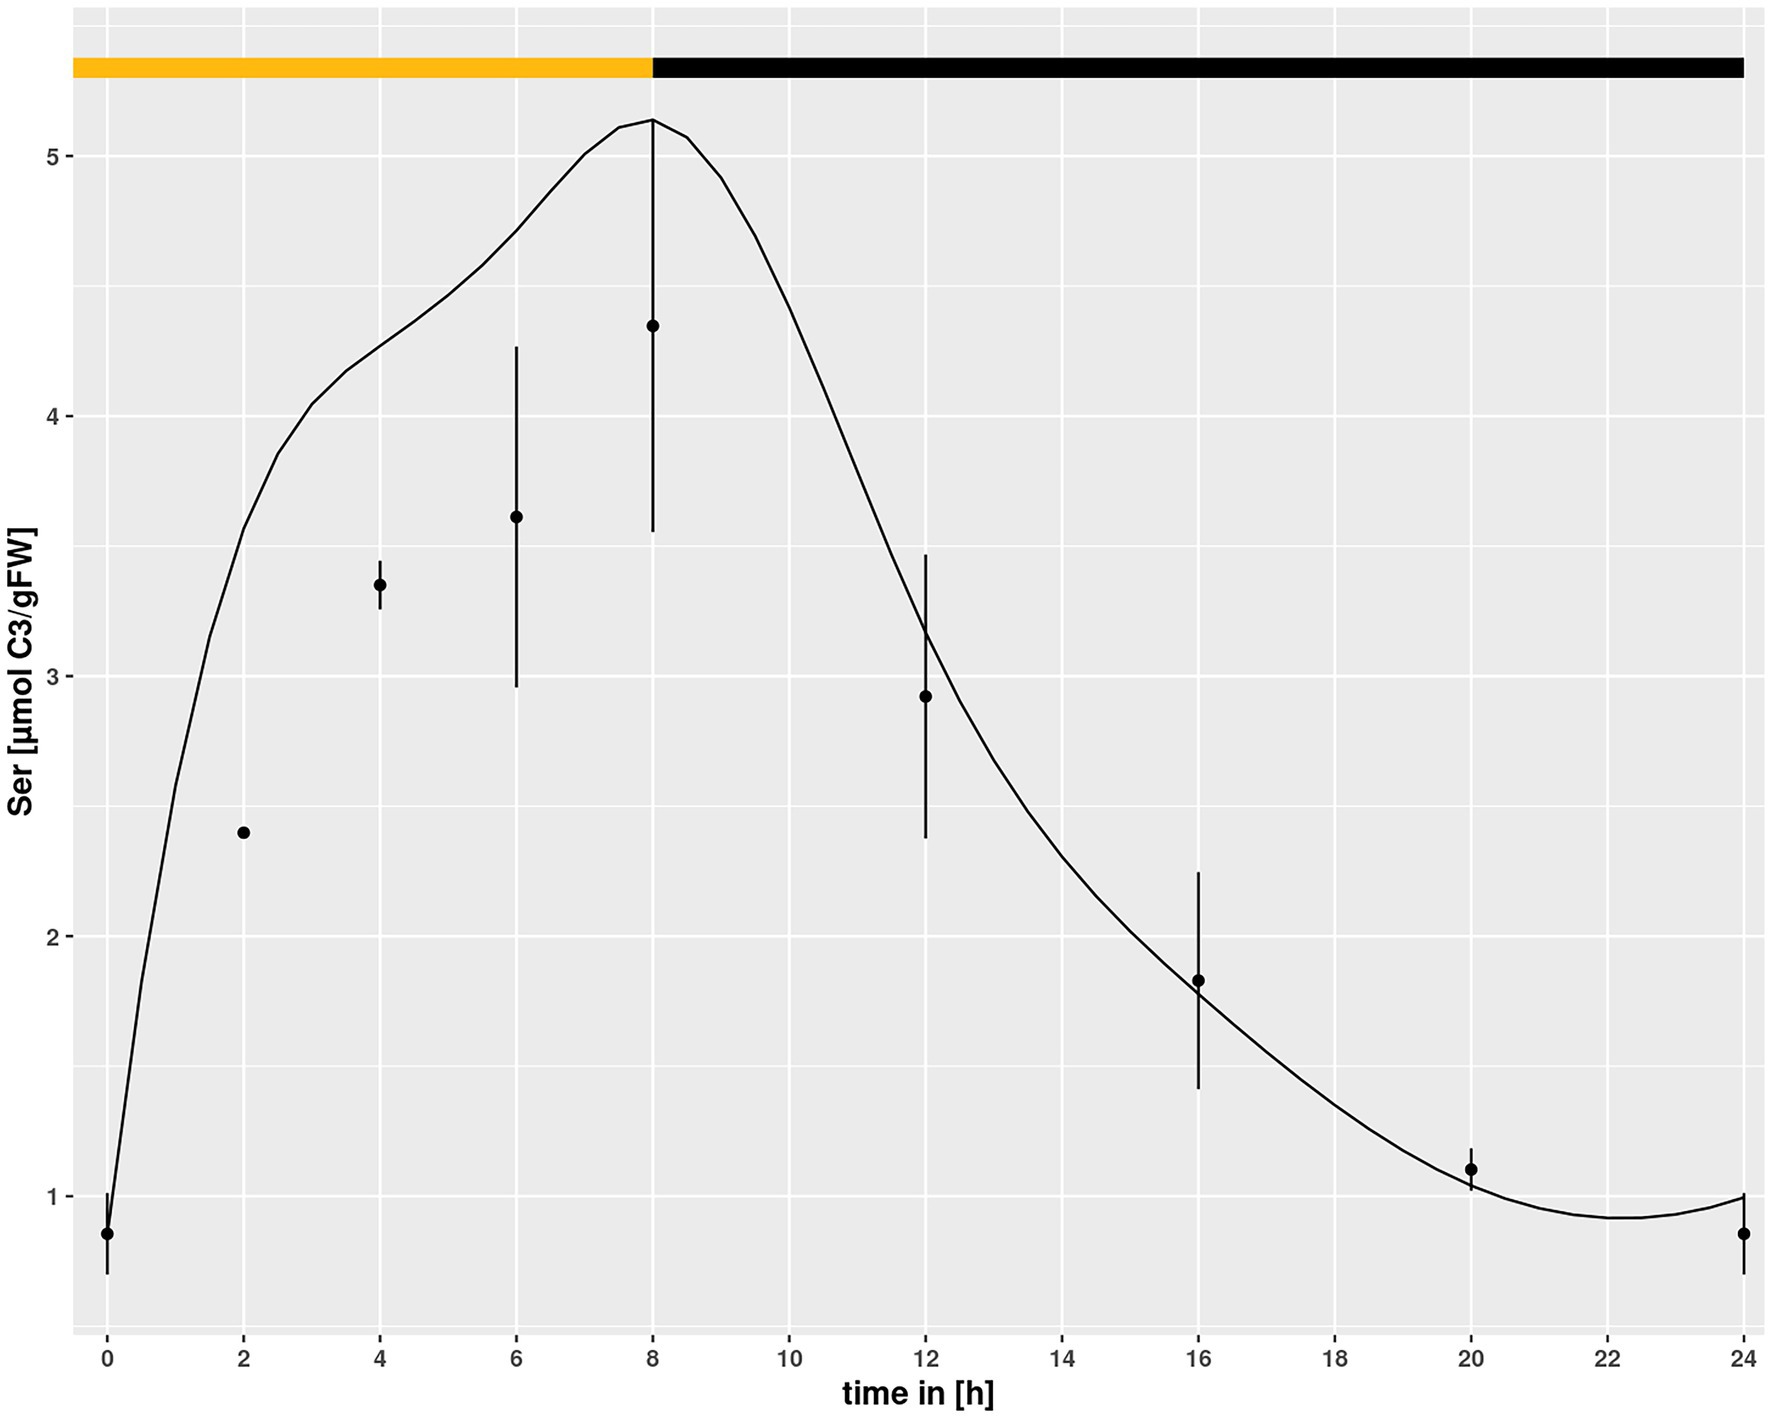
Figure 5. Diurnal course of serine for hpr1-1 at eCO2 concentrations. Dots represent means with standard error (n = 5). Lines represent the mean of 20 simulations using the minimum of the km value of the simulations of Col-0 ambient CO2 as lower boundary. The light phase is indicated by a yellow bar and dark phase indicated by black bar.
Observed Flux Dynamics
Using the parameter sets obtained from the simulations, flux rates at time points of harvest were calculated. Figure 6 shows calculated flux rates for PR-relevant reactions. As expected, HPR flux was higher at ambient than eCO2 (p < 2e-16) due to the larger PR input. Similar, GDC and SHMT (Figures 6A,B) were increased at ambient CO2 as compared to eCO2 (p < 2e-16). Surprisingly, HPR (Figure 6C) showed higher flux rates in the mutant as compared to wildtype (p < 2e-16). This resulted from extremely high levels of Ser, which is the substrate in our compiled HPR reaction, and indicated a metabolic state clearly different from wildtype. For instance, the Ser levels already at the beginning of the day are substantially elevated in the mutant at ambient CO2. Moreover, in comparison to wildtype the hpr1-1 mutant showed increased levels for GDC (p = 1.16e-10). In contrast, the SHMT reaction tended to be increased in the wildtype, though this was not significant.
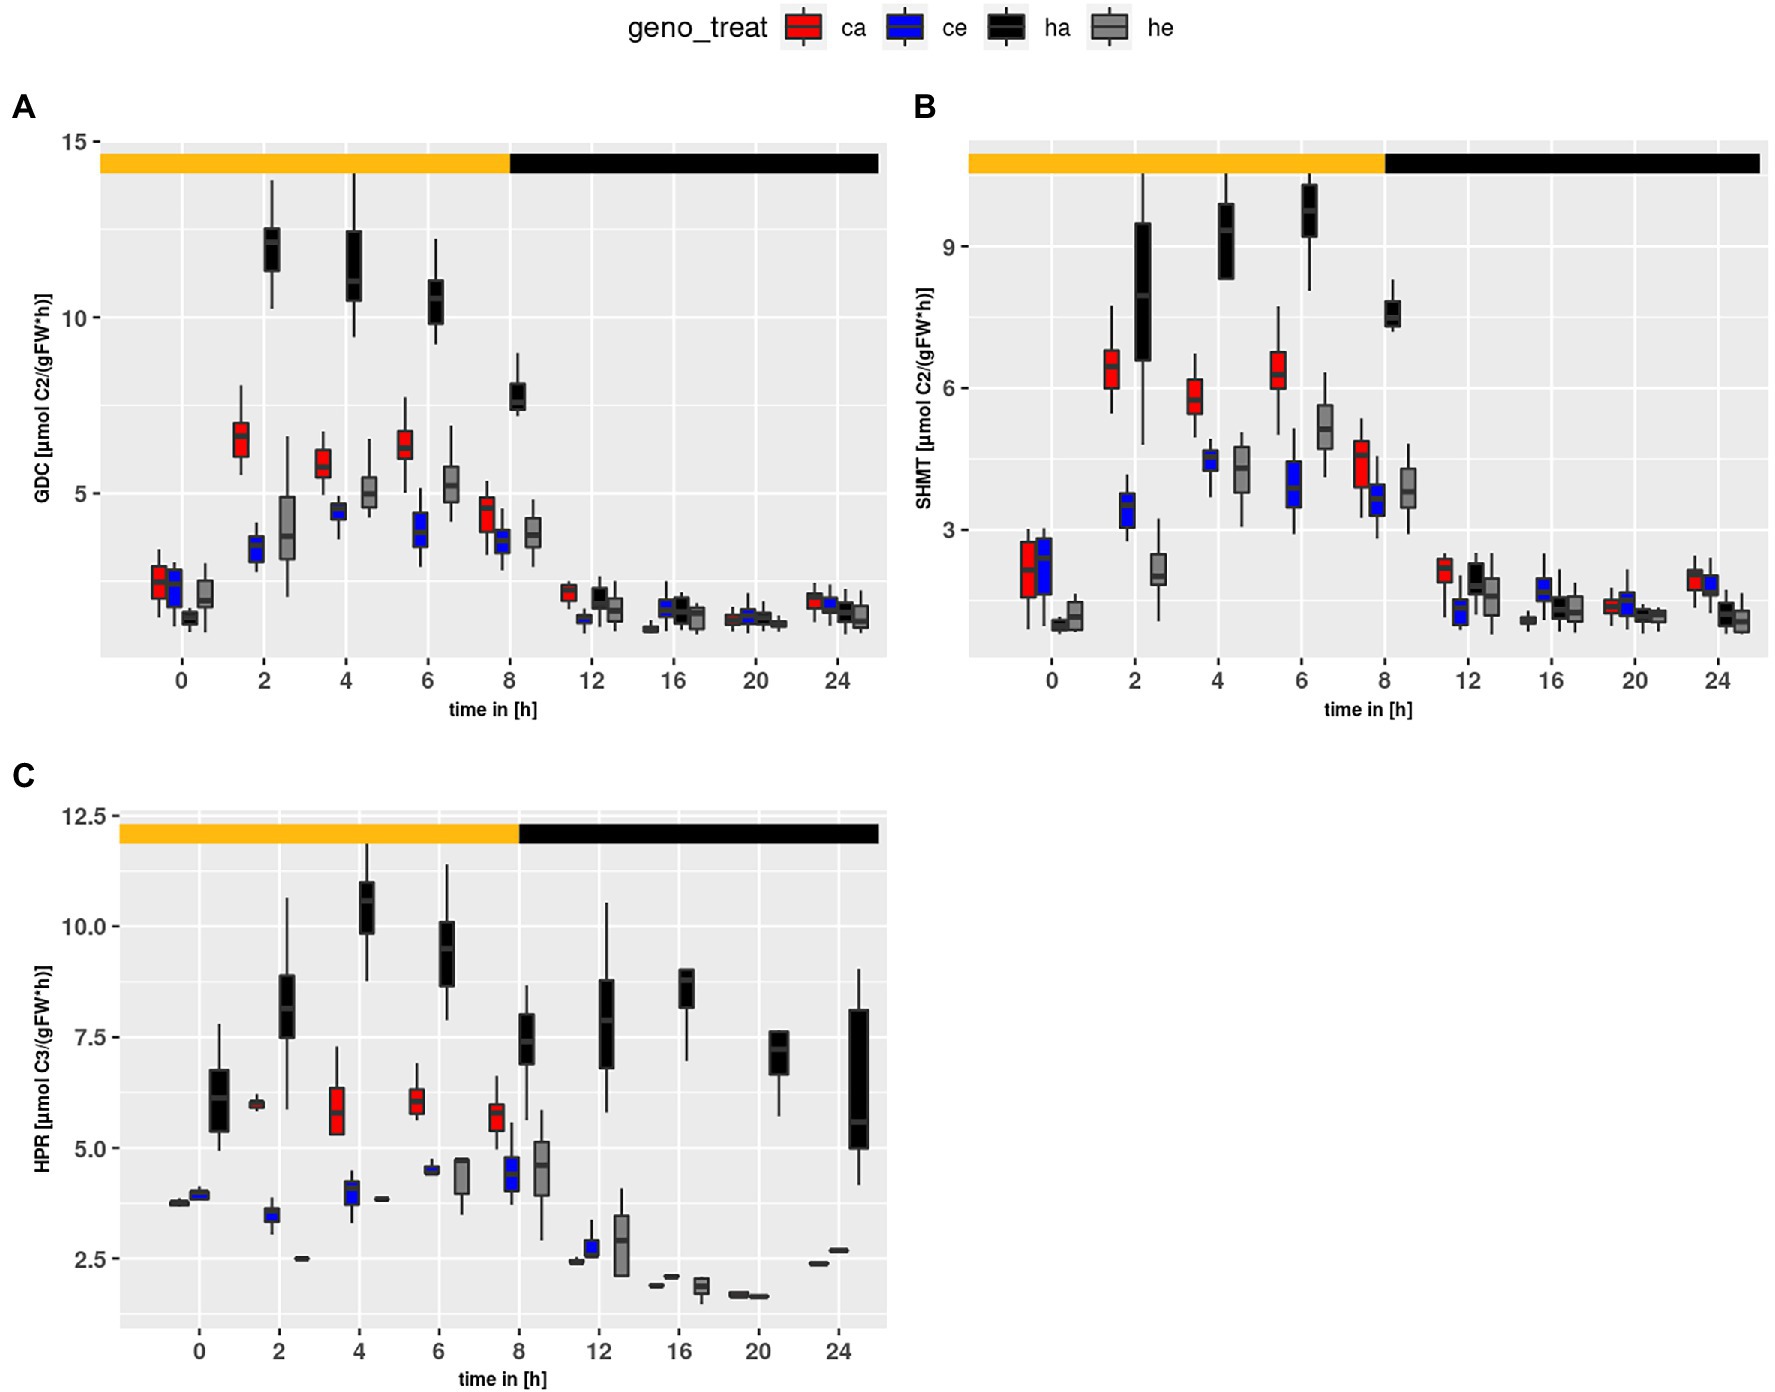
Figure 6. Diurnal course of fluxes for (A) GDC, (B) SHMT and (C) HPR. Col-0 ambient: red, Col-0 eCO2: blue; hpr1-1 mutant ambient: black, hpr1-1 mutant eCO2: grey. Shown are means of results for 20 simulations. Light phase is indicated by yellow bar and dark phase indicated by black bar. Boxplots are dodged by 0.25 h in order to prevent overlap.
Flux within the GS/GOGAT cycle (Figure 7) was tightly linked to PR. For GS and GOGAT genotype and treatment effects were observed (treatment effect on GS and GOGAT: p < 2e-16; genotype effect on GS: p < 2e-16; genotype effect on GOGAT: p = 5.63e-14). The highest flux was obtained at ambient CO2 for hpr1-1, followed by Col-0 at ambient. For plants grown at eCO2, a slightly higher flux was observed for hpr1-1 as compared to wildtype, supporting an earlier finding that PR takes place even at a CO2 concentration of 1,000 ppm (Kraemer et al., 2021a). In summary, the mutant showed a higher turnover in the GS/GOGAT cycle compared to the wildtype, and this turnover was decreased at eCO2. However, flux of NR (Figure 7C) behaved differently. NR flux was higher in Col-0 and rose at eCO2, revealing significant genotype and treatment effects (p = 5.66e-11 and p = 4.79e-07, respectively).
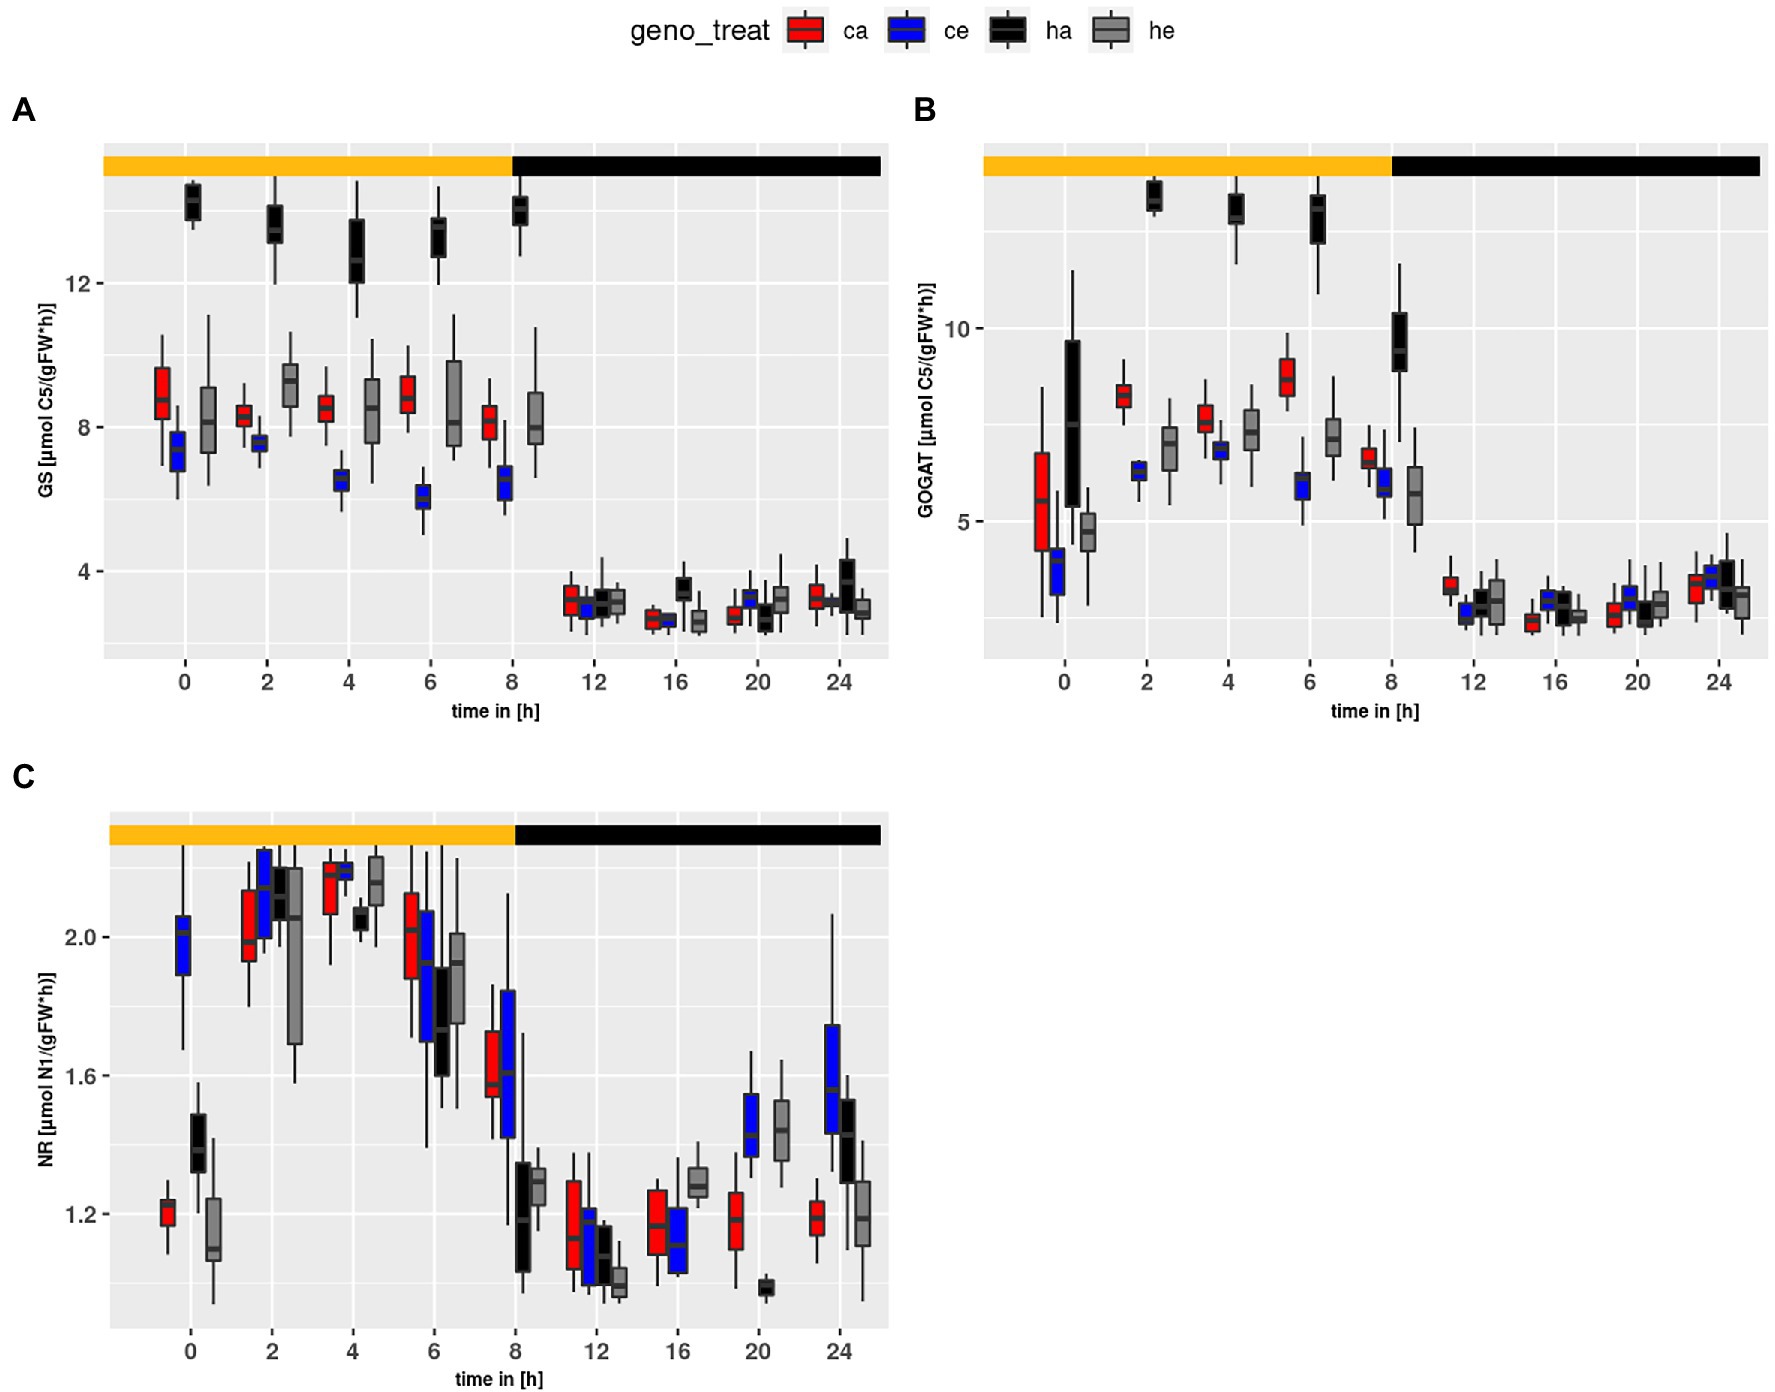
Figure 7. Diurnal course of fluxes for (A) GS, (B) GOGAT and (C) NR. Col-0 ambient: red, Col-0 eCO2: blue; hpr1-1 mutant ambient: black, hpr1-1 mutant eCO2: grey. Shown are means of results for 20 simulations. Light phase is indicated by yellow bar and dark phase indicated by black bar. Boxplots are dodged by 0.25 h in order to prevent overlap.
Discussion
Interaction of eCO2 and N-Assimilation
Several studies have pointed out that eCO2 decreases the N content of plant biomass (Bloom et al., 2014; Andrews et al., 2020). However, the underlying mechanism is unclear. Low stomatal conductance at high internal CO2 concentrations could reduce nitrate availability, but in contrast to observations for wheat under eCO2 (Del Pozo et al., 2007), we found no indications for reduced mineral content in Arabidopsis wildtype plants (Supplementary Image 3A). Although no consistent change of foliar nitrate was observed in the wildtype, it was significantly lower in the hpr1-1 mutant especially under ambient CO2. This points to a restricted uptake capability in hpr1-1, probably because of energetic constraints (see below).
The alternative possibility that nitrate reduction was inhibited at eCO2 (Bloom et al., 2014; Zhao et al., 2021) was also not supported in the current study. We found that the vmax for NR increased at eCO2 (Figure 7C), and the calculated NR flux was higher at eCO2 in wildtype plants. The observation that NR was consistently higher in Col-0 as compared to the hpr1-1 mutant, which had high levels of free AA, further argues against insufficient N supply. Thus, our results are in support of reports favoring a dilution of total N to accompany increased carbon fixation and biomass formation under eCO2 (Andrews et al., 2019). For eCO2, we found a higher ratio of NR to GDC (Figure 8A). Both fluxes feed into the pool of ammonium used for Gln synthesis. A low GDC contribution would reduce the load on the GS/GOGAT cycle, allowing a higher proportion of de novo N assimilation. Indeed, we calculated a lower flux for GS/GOGAT at eCO2 (Figures 7A,B), demonstrating a tight link between PR and GS/GOGAT turnover. This link has also been shown by Häusler et al. (1994) and Wallsgrove et al. (1987), who reported that barley mutants lacking GS activity suffered under photorespiratory conditions. In addition, it is known that even short incubations at eCO2 result in a reduction of GS and GOGAT activity (Guo et al., 2013; Wu et al., 2020). Our finding that the ratio of NR to GDC activity was elevated at eCO2 in the wildtype as well as the mutant indicates that the GS/GOGAT cycle contained more newly assimilated N at eCO2, and this further argues against N starvation at eCO2.
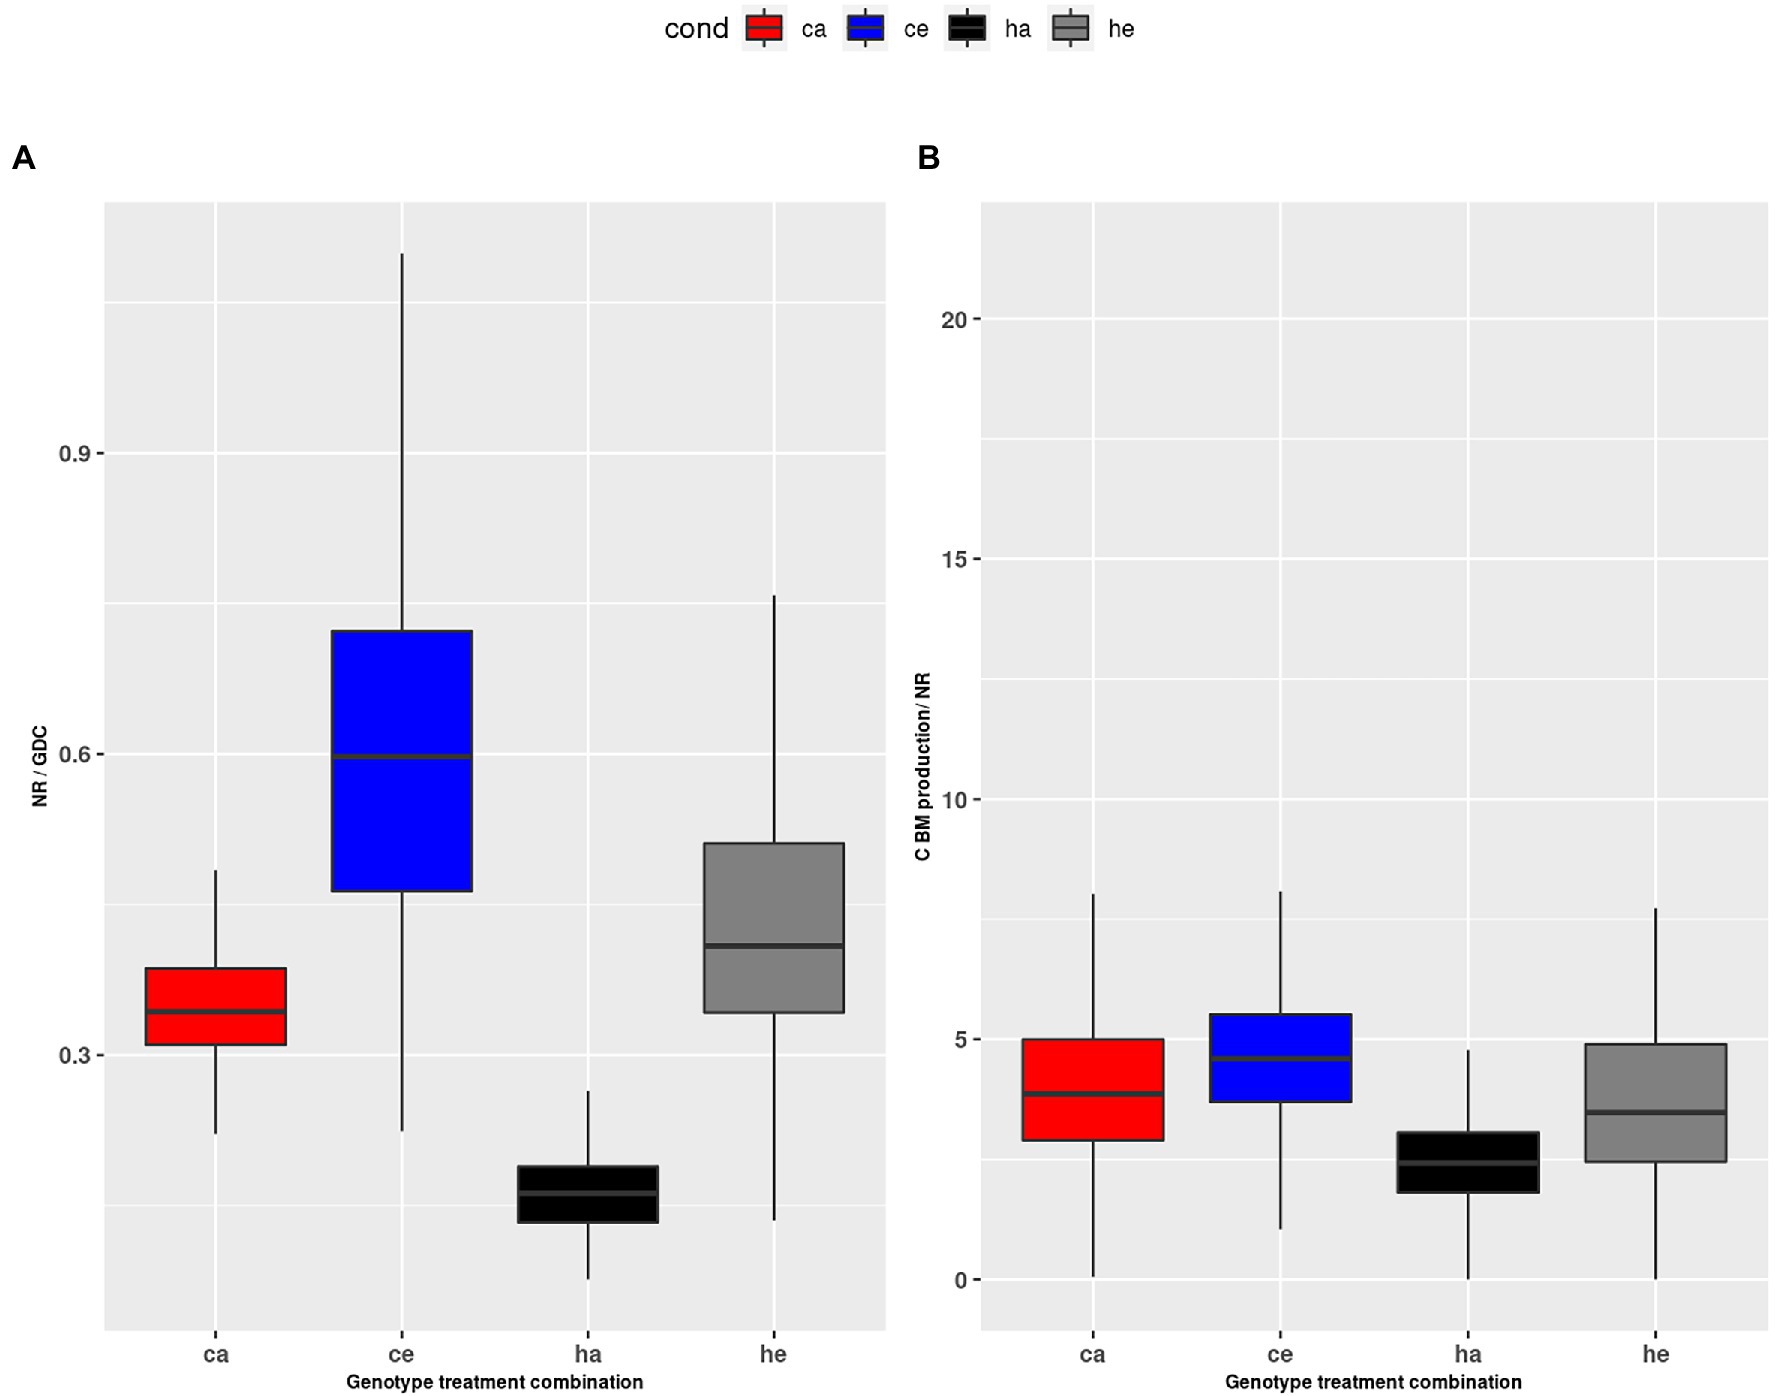
Figure 8. (A) Ratio of NR to GDC during the day, (B) ratio of HP2BMEXP to NR during the day. Col-0 ambient: red, Col-0 eCO2: blue; hpr1-1 mutant ambient: black, hpr1-1 mutant eCO2: grey. Data based on 20 simulations. Boxplots are dodged by 0.25 h in order to prevent overlap.
In a previous study comparing plants exposed to eCO2 either short or long term, we revealed that PR allows deposition of already assimilated N in low carbon-containing AA like Gly and Ser, thus providing carbon skeletons for de novo N assimilation (Kraemer et al., 2021a). While this can explain photosynthetic acclimation to long-term eCO2, which results in reduced PS as well as NR rate, it does not explain an imbalance in the ratio of both fluxes. Whether sufficient N for the production of biomass was assimilated at eCO2 should be reflected in the ratio of the carbon flux HP2BMEXP and the de novo N fixation by NR. Figure 8B shows a significant but not dramatic increase of this ratio at eCO2. Considering the increased NR flux, this indicates that carbon assimilation was even more stimulated than N fixation at eCO2, which would support the concept of N dilution at eCO2 (Wong, 1990; Kuehny et al., 1991; Gifford et al., 2000; Taub and Wang, 2008). This is also substantiated by the strongly increased starch levels (Supplementary Image 3B). In the mutant, however, we and others (Timm et al., 2008) found a large pool of free amino acids (Figures 1, 2), which apparently contradicts an increased C/N ratio.
Phenotype of the hpr1-1 Mutant
As mentioned above, an energetic constraint could be responsible for the metabolic disturbance in the mutant. As shown in Figure 7, the fluxes for GS and GOGAT are increased in hpr1-1 as compared to wildtype especially at ambient CO2. Thus, large amounts of ATP and reduced ferredoxin are required to sustain synthesis of Glu, which is needed for the removal of glyoxylate. Figure 8A shows that the NR-to-GDC ratio was lowest for hpr1-1 at ambient, thus indicating futile cycling of ammonium without net gain of biomass.
While a loss of cellular energy could explain the differences in biomass formation of wildtype and mutant at different CO2 concentrations, which have already been described (Timm et al., 2008), futile cycling of already assimilated ammonium could be regarded as conflicting with high levels of amino acids in the mutant. Accumulation of starch, carboxylates and AA in the mutant could simply result from a slow growth rate as suggested by Génard et al. (2014), but than a reason different from resource limitation must underly stunted growth and chlorotic phenotype of hpr1-1.
A possible explanation could be poisoning by photorespiratory intermediates such as phosphoglycolate, glycolate or glyoxylate (Anderson, 1971; Dellero et al., 2016). As can be seen in Figure 6 the GDC and SHMT fluxes are strongly increased in hpr1-1 at ambient CO2. But still the HPR flux is substantially extended into the night. This shows that even after light-off photorespiratory intermediates had to be recycled, which were not metabolized during the day in spite of the increased GDC and SHMT activity. It can thus be assumed that phosphoglycolate accumulates during the day, and this would strongly inhibit triose-phosphate isomerase (Anderson, 1971), which would in turn block carbon assimilation in the Calvin-Benson cycle. But how should a bottleneck in the last step of the PR pathway cause accumulation of the early metabolites? As we have already described (Kraemer et al., 2021a), simulations of a metabolic model for the hpr1-1 mutant pointed to an additional source of glycolate, which is independent from oxygenation of ribulose-bisphosphate. A very likely candidate is the non-enzymatic oxidation of hydroxypyruvate by H2O2 in the peroxisome, which yields glycolate (Walton and Butt, 1981). This reaction is promoted by the large amount of Ser in the mutant at ambient CO2. Bao et al. (2021) showed that already a fourfold increase of Ser levels in the catalase mutant cat2 caused a significant increase in hydroxypyruvate decarboxylation. Considering that Ser levels in hpr1-1 were about tenfold higher than wildtype at the end of the day, it is highly likely that non-enzymatic decarboxylation of hydroxypyruvate takes place in hpr1-1. Thus, in the hpr1-1 mutant more glycolate is produced in relation to photosynthetic carbon acquisition as compared to the wildtype. This would not only increase the probability of a toxic effect, but also cause additional loss of assimilated carbon in the form of CO2.
Besides toxication by photorespiratory intermediates, it would also be possible that an increased level of ammonium (Figure 1C) could interfere with ATP production, because it is in equilibrium with ammonia that acts as an uncoupling agent of ATP synthesis.
Finally, the metabolic bottleneck created by the hpr1-1 mutation caused large amounts of C and N being bound in the form of Gly and Ser. As a consequence, the equilibrium of free amino-acids, brought about by transamination reactions, might be severely disturbed, and this could interfere with protein synthesis in the shoot as well as the supply of the roots and other sinks with AA. Not only N but also C compounds show altered distributions in hpr1-1 (Supplementary Image 1; Figure 2). Especially the carboxylates Cit, malate and fumarate, were significantly enriched, while glucose was reduced in hpr1-1. We did not detect a drop in foliar sucrose content, but the lowered nitrate content of hpr1-1 shoots in ambient CO2 might indicate low carbon supply to the root system. The low glucose level in leaves could result from enhanced use in the pentose-phosphate pathway as suggested by Li et al. (2019), who reported that high pentose-phosphate pathway activity could provide additional CO2 that would alleviate the PR syndrome, but restrict biomass formation. A combination of the above described effects could contributes to the mutant phenotype of hpr1-1.
Conclusion
We showed that the hpr1-1 mutant suffers from several limitations. Besides a high demand for ATP and reducing equivalents for the increased turnover of the GS/GOGAT cycle, a possible toxication by photorespiratory intermediates or NH4+ could interfere with biomass formation, and an unfavorable redistribution of N and C compounds could contribute to restricted biomass production. Our study confirms a tight link between PR and the GS/GOGAT cycle and adds to our understanding of how plant N assimilation is affected by eCO2.
Data Availability Statement
The raw data supporting the conclusions of this article can be found in the Supplementary Material, further inquiries can be directed to the corresponding author.
Author Contributions
KK and AH designed the study and wrote the manuscript. KK developed the model. KK and JB conducted the experiments. All authors contributed to the article and approved the submitted version.
Funding
KK was supported by a scholarship “Landesgraduiertenförderung (LGF)” of the Federal State of Baden-Wuerttemberg (Germany).
Conflict of Interest
The authors declare that the research was conducted in the absence of any commercial or financial relationships that could be construed as a potential conflict of interest.
Publisher’s Note
All claims expressed in this article are solely those of the authors and do not necessarily represent those of their affiliated organizations, or those of the publisher, the editors and the reviewers. Any product that may be evaluated in this article, or claim that may be made by its manufacturer, is not guaranteed or endorsed by the publisher.
Acknowledgments
The authors would like to thank Hermann Bauwe and Stefan Timm for a generous gift of seeds of the hpr1-1 mutant used in this study. Nadja Beuttenmüller and Annika Allinger are acknowledged for expert plant cultivation.
Supplementary Material
The Supplementary Material for this article can be found online at: https://www.frontiersin.org/articles/10.3389/fpls.2022.897924/full#supplementary-material
References
Anderson, L. (1971). Chloroplast and cytoplasmic enzymes II. Pea leaf triose phosphate isomerases. Biochim. Biophys. Acta 22, 237–244.
Andrews, M., Condron, L. M., Kemp, P. D., Topping, J. F., Lindsey, K., Hodge, S., et al. (2019). Elevated CO2 effects on nitrogen assimilation and growth of C3 vascular plants are similar regardless of N-form assimilated. J. Exp. Bot. 70, 683–690. doi: 10.1093/jxb/ery371
Andrews, M., Condron, L. M., Kemp, P. D., Topping, J. F., Lindsey, K., Hodge, S., et al. (2020). Will rising atmospheric CO2 concentration inhibit nitrate assimilation in shoots but enhance it in roots of C3 plants? Physiol Plantarum 170, 40–45. doi: 10.1111/ppl.13096
Atkinson, N., Leitão, N., Orr, D. J., Meyer, M. T., Carmo-Silva, E., Griffiths, H., et al. (2017). Rubisco small subunits from the unicellular green alga Chlamydomonas complement Rubisco-deficient mutants of Arabidopsis. New Phytol. 214, 655–667. doi: 10.1111/nph.14414
Bao, H., Morency, M., Rianti, W., Saeheng, S., Roje, S., Weber, A. P. M., et al. (2021). Catalase protects against nonenzymatic decarboxylations during photorespiration in Arabidopsis thaliana. Plant Direct 5:e366. doi: 10.1002/pld3.366
Bauwe, H. (2017). “Measurement of enzyme activities,” in Photorespiration: Methods and Protocols. eds. A. R. Fernie, H. Bauwe, and A. P. Weber (New York, NY: Springer New York), 31–50.
Berardini, T. Z., Reiser, L., Li, D., Mezheritsky, Y., Muller, R., Strait, E., et al. (2015). The arabidopsis information resource: making and mining the “gold standard” annotated reference plant genome. Genesis 53, 474–485. doi: 10.1002/dvg.22877
Berteli, F., Corrales, E., Guerrero, C., Ariza, M. J., Pliego, F., and Valpuesta, V. (1995). Salt stress increases ferredoxin-dependent glutamate synthase activity and protein level in the leaves of tomato. Physiol Plantarum 93, 259–264. doi: 10.1111/j.1399-3054.1995.tb02226.x
Bloom, A. J. (2015). Photorespiration and nitrate assimilation: a major intersection between plant carbon and nitrogen. Photosynth. Res. 123, 117–128. doi: 10.1007/s11120-014-0056-y
Bloom, A. J., Burger, M., Kimball, B. A., and Pinter, P. J. (2014). Nitrate assimilation is inhibited by elevated CO2 in field-grown wheat. Nat. Clim. Chang. 4, 477–480. doi: 10.1038/nclimate2183
Brauner, K., Hörmiller, I., Nägele, T., and Heyer, A. G. (2014). Exaggerated root respiration accounts for growth retardation in a starchless mutant of Arabidopsis thaliana. Plant J. 79, 82–91. doi: 10.1111/tpj.12555
Cheung, C. M., Poolman, M. G., Fell, D. A., Ratcliffe, R. G., and Sweetlove, L. J. (2014). A diel flux balance model captures interactions between light and dark metabolism during day-night cycles in c3 and crassulacean acid metabolism leaves. Plant Physiol. 165, 917–929. doi: 10.1104/pp.113.234468
Choi, Y. A., Kim, S. G., and Kwon, Y. M. (1999). The plastidic glutamine synthetase activity is directly modulated by means of redox change at two unique cysteine residues. Plant Sci. 149, 175–182. doi: 10.1016/S0168-9452(99)00163-6
Cousins, A. B., and Bloom, A. J. (2004). Oxygen consumption during leaf nitrate assimilation in a C3 and C4 plant: The role of mitochondrial respiration. Plant Cell Environ. 27, 1537–1545. doi: 10.1111/j.1365-3040.2004.01257.x
Del Pozo, A., Pérez, P., Gutiérrez, D., Alonso, A., Morcuende, R., and Martínez-Carrasco, R. (2007). Gas exchange acclimation to elevated CO2 in upper-sunlit and lower-shaded canopy leaves in relation to nitrogen acquisition and partitioning in wheat grown in field chambers. Environ. Exp. Bot. 59, 371–380. doi: 10.1016/j.envexpbot.2006.04.009
Dellero, Y., Jossier, M., Schmitz, J., Maurino, V. G., and Hodges, M. (2016). Photorespiratory glycolate – glyoxylate metabolism. J. Exp. Bot. 67, 3041–3052. doi: 10.1093/jxb/erw090
Dietz, K. J., and Hell, R. (2015). Thiol switches in redox regulation of chloroplasts: balancing redox state, metabolism and oxidative stress. Biol. Chem. 396, 483–494. doi: 10.1515/hsz-2014-0281
Gauthier, P. P. G., Bligny, R., Gout, E., Mahé, A., Nogués, S., Hodges, M., et al. (2010). In folio isotopic tracing demonstrates that nitrogen assimilation into glutamate is mostly independent from current CO2 assimilation in illuminated leaves of Brassica napus. New Phytol. 185, 988–999. doi: 10.1111/j.1469-8137.2009.03130.x
Génard, M., Baldazzi, V., and Gibon, Y. (2014). Metabolic studies in plant organs: don’t forget dilution by growth. Front. Plant Sci. 5:85. doi: 10.3389/fpls.2014.00085
Gifford, R. M., Barrett, D. J., and Lutze, J. L. (2000). The effects of elevated CO_2 on the C:N and C:P mass ratios of plant tissues. Plant Soil 224, 1–14. doi: 10.1023/A:1004790612630
Graham, L., and Aprison, M. (1966). Fluorometric determination of aspartate, glutamate, and gamma-Aminobutyrate in nerve tissue using Enzymic methods. Anal. Biochem. 15, 487–497. doi: 10.1016/0003-2697(66)90110-2
Guan, X. Q., Zhao, S. J., Li, D. Q., and Shu, H. R. (2004). Photoprotective function of photorespiration in several grapevine cultivars under drought stress. Photosynthetica 42, 31–36. doi: 10.1023/B:PHOT.0000040566.55149.52
Guo, H., Sun, Y., Li, Y., Liu, X., Ren, Q., Zhu-Salzman, K., et al. (2013). Elevated CO2 modifies N acquisition of Medicago truncatulaby enhancing N fixation and reducing nitrate uptake from soil. PLoS One 8:e81373. doi: 10.1371/journal.pone.0081373
Häusler, R. E., Lea, P. J., and Leegood, R. C. (1994). Control of photosynthesis in barley leaves with reduced activities of glutamine synthetase or glutamate synthase - II. Control of electron transport and CO2 assimilation. Planta 194, 418–435. doi: 10.1007/BF00197543
Hodges, M. (2002). Enzyme redundancy and the importance of 2-oxoglutarate in plant ammonium assimilation. J. Exp. Bot. 53, 905–916. doi: 10.1093/jexbot/53.370.905
Huma, B., Kundu, S., Poolman, M. G., Kruger, N. J., and Fell, D. A. (2018). Stoichiometric analysis of the energetics and metabolic impact of photorespiration in C3 plants. Plant J. 96, 1228–1241. doi: 10.1111/tpj.14105
IPCC (2014). “Summary for Policymakers.” in Climate Change 2014: Mitigation of climate change. Contribution of Working Group III to the Fifth Assessment Report of the Intergovernmental Panel on Climate Change; April 2014.
Jauregui, I., Aparicio-Tejo, P. M., Avila, C., Cañas, R., Sakalauskiene, S., and Aranjuelo, I. (2016). Root-shoot interactions explain the reduction of leaf mineral content in Arabidopsis plants grown under elevated [CO2] conditions. Physiol. Plant. 158, 65–79. doi: 10.1111/ppl.12417
Koffler, B. E., Bloem, E., Zellnig, G., and Zechmann, B. (2013). High resolution imaging of subcellular glutathione concentrations by quantitative immunoelectron microscopy in different leaf areas of Arabidopsis. Micron 45, 119–128. doi: 10.1016/j.micron.2012.11.006
Kraemer, K., Kepp, G., Brock, J., Stutz, S., and Heyer, A. G. (2021a). Acclimation to elevated CO2 affects the C/N balance by reducing de novo N-assimilation. Physiol Plantarum 174:e13615. doi: 10.1111/ppl.13615
Kraemer, K., Kraemer, J., and Heyer, A. G. (2021b). Paropt: parameter optimizing of ODE-Systems. Available at: https://cran.r-project.org/package=paropt (Accessed June 13, 2022).
Kuehny, J. S., Peet, M. M., Nelson, P. V., and Willits, D. H. (1991). Nutrient dilution by starch in CO2-enriched chrysanthemum. J. Exp. Bot. 42, 711–716. doi: 10.1093/jxb/42.6.711
Küstner, L., Nägele, T., and Heyer, A. G. (2019). Mathematical modeling of diurnal patterns of carbon allocation to shoot and root in Arabidopsis thaliana. Npj Syst. Biol. Appl. 5, 1–11. doi: 10.1038/s41540-018-0080-1
Li, J., Weraduwage, S. M., Preiser, A. L., Tietz, S., Weise, S. E., Strand, D. D., et al. (2019). A cytosolic bypass and G6P shunt in plants lacking Peroxisomal Hydroxypyruvate Reductase. Plant Physiol. 180, 783–792. doi: 10.1104/pp.19.00256
Nunes-Nesi, A., Fernie, A. R., and Stitt, M. (2010). Metabolic and signaling aspects underpinning the regulation of plant carbon nitrogen interactions. Mol. Plant 3, 973–996. doi: 10.1093/mp/ssq049
Pérez-de la Mora, M., Méndez-Franco, J., Salceda, R., and Riesgo-Escovar, J. R. (1989). A glutamate dehydrogenase-based method for the assay of L-glutamic acid: formation of pyridine nucleotide fluorescent derivatives. Anal. Biochem. 180, 248–252. doi: 10.1016/0003-2697(89)90425-9
Rebeille, F., Neuburger, M., and Douce, R. (1994). Interaction between glycine decarboxylase, serine hydroxymethyltransferase and tetrahydrofolate polyglutamates in pea leaf mitochondria. Biochem. J. 302, 223–228. doi: 10.1042/bj3020223
Scholl, R. L., Harper, J. E., and Hageman, R. H. (1974). Improvements of the nitrite color development in assays of nitrate Reductase by Phenazine Methosulfate and zinc acetate 1. Plant Physiol. 53, 825–828. doi: 10.1104/pp.53.6.825
Selinski, J., and Scheibe, R. (2019). Malate valves: old shuttles with new perspectives. Plant Biol. 21, 21–30. doi: 10.1111/plb.12869
Sharkey, T. D. (1988). Estimating the rate of photorespiration in leaves. Physiol Plantarum 73, 147–152. doi: 10.1111/j.1399-3054.1988.tb09205.x
Shih, P. M., Occhialini, A., Cameron, J. C., Andralojc, P. J., Parry, M. A., and Kerfeld, C. A. (2015). Biochemical characterization of predicted Precambrian RuBisCO. Nat. Commun. 7, 1–11. doi: 10.1038/ncomms10382
Silveira, J. A. G., Viégas, R., da Rocha, I. M. A., Moreira, A. C. D. O. M., Moreira, R. D. A., and Oliveira, J. T. A. (2003). Proline accumulation and glutamine synthetase activity are increased by salt-induced proteolysis in cashew leaves. J. Plant Physiol. 160, 115–123. doi: 10.1078/0176-1617-00890
Stitt, M., and Zeeman, S. C. (2012). Starch turnover: pathways, regulation and role in growth. Curr. Opin. Plant Biol. 15, 282–292. doi: 10.1016/j.pbi.2012.03.016
Szulejko, J. E., Kumar, P., Deep, A., and Kim, K. H. (2017). Global warming projections to 2100 using simple CO2 greenhouse gas modeling and comments on CO2 climate sensitivity factor. Atmos. Pollut. Res. 8, 136–140. doi: 10.1016/j.apr.2016.08.002
Taub, D. R., and Wang, X. (2008). Why are nitrogen concentrations in plant tissues lower under elevated CO2? A critical examination of the hypotheses. J. Integr. Plant Biol. 50, 1365–1374. doi: 10.1111/j.1744-7909.2008.00754.x
Tcherkez, G., Mahe, A., Gauthier, P., Mauve, C., Gout, E., Bligny, R., et al. (2009). In folio respiratory fluxomics revealed by 13C isotopic labeling and H/D isotope effects highlight the noncyclic nature of the tricarboxylic acid “cycle” in illuminated leaves. Plant Physiol. 151, 620–630. doi: 10.1104/pp.109.142976
Timm, S., Nunes-Nesi, A., Florian, A., Eisenhut, M., Morgenthal, K., Wirtz, M., et al. (2021). Metabolite profiling in arabidopsis thaliana with moderately impaired photorespiration reveals novel metabolic links and compensatory mechanisms of photorespiration. Meta 11:391. doi: 10.3390/metabo11060391
Timm, S., Nunes-Nesi, A., Morgenthal, K., Wienkoop, S., Keerberg, O., Pärnik, T., et al. (2008). A cytosolic pathway for the conversion of Hydroxypyruvate to Glycerate during photorespiration in Arabidopsis. Plant Cell 20, 2848–2859. doi: 10.1105/tpc.108.062265
Vega-Mas, I., Asier, S., and Marino, D. (2015). High-throughput quantification of ammonium content in Arabidopsis. Bio-protocol 5, 14–17. doi: 10.21769/BioProtoc.1559
Voss, I., Sunil, B., Scheibe, R., and Raghavendra, A. S. (2013). Emerging concept for the role of photorespiration as an important part of abiotic stress response. Plant Biol. 15, 713–722. doi: 10.1111/j.1438-8677.2012.00710.x
Wallsgrove, R. M., Turner, J. C., Hall, N. P., Kendall, A. C., and Bright, S. W. J. (1987). Barley mutants lacking chloroplast glutamine Synthetase—biochemical and genetic analysis. Plant Physiol. 83, 155–158. doi: 10.1104/pp.83.1.155
Walton, N. J., and Butt, V. S. (1981). Metabolism and decarboxylation of glycollate and serine in leaf peroxisomes. Planta 153, 225–231. doi: 10.1007/BF00383891
Wong, S. C. (1990). Elevated atmospheric partial pressure of CO2 and plant growth - II. Non-structural carbohydrate content in cotton plants and its effect on growth parameters. Photosynth. Res. 23, 171–180. doi: 10.1007/BF00035008
Wu, F., Sun, X., Hu, X., Zou, B., Lin, N., Lin, J., et al. (2020). Response of nitrogen metabolism in masson pine needles to elevated CO2. Forests 11, 1–13. doi: 10.3390/F11040390
Xu, G., Fan, X., and Miller, A. J. (2012). Plant nitrogen assimilation and use efficiency. Annu. Rev. Plant Biol. 63, 153–182. doi: 10.1146/annurev-arplant-042811-105532
Keywords: photorespiration, nitrate assimilation, elevated CO2, hydroxypyruvate reductase, Arabidopsis
Citation: Krämer K, Brock J and Heyer AG (2022) Interaction of Nitrate Assimilation and Photorespiration at Elevated CO2. Front. Plant Sci. 13:897924. doi: 10.3389/fpls.2022.897924
Edited by:
Guillaume Pilot, Virginia Tech, United StatesReviewed by:
Toshihiro Obata, University of Nebraska-Lincoln, United StatesPavel Kerchev, Mendel University in Brno, Czechia
Michael Hodges, UMR9213 Institut des Sciences des Plantes de Paris Saclay (IPS2), France
Copyright © 2022 Krämer, Brock and Heyer. This is an open-access article distributed under the terms of the Creative Commons Attribution License (CC BY). The use, distribution or reproduction in other forums is permitted, provided the original author(s) and the copyright owner(s) are credited and that the original publication in this journal is cited, in accordance with accepted academic practice. No use, distribution or reproduction is permitted which does not comply with these terms.
*Correspondence: Arnd G. Heyer, YXJuZC5oZXllckBiaW8udW5pLXN0dXR0Z2FydC5kZQ==