Abstract
Non-destructive testing (NDT) is not only primarily concerned with the detection of discontinuities, but also with the mechanical properties. However, the usage of NDT in understanding the mechanical effect that leads to a failure of composites and the damage mechanisms are still not thoroughly studied, as much of the NDT approaches are widely used to maintain the structural integrity to preserve quality assurance. This work aims to investigate the application of infrared thermographic and ultrasonic in evaluating randomly-oriented short-natural-fiber-reinforced phenolic composites. The composites were made from short palm fibers of various sizes between 1.18–0.6 mm, 0.6–0.3 mm, and less than 0.3 mm at 20 and 40 wt%, respectively. The tensile results obtained from the parallel testing of the composites using infrared thermography, where the temperature and time changes on the tested samples were continuously recorded. The peak in the temperature-time graph indicated a macro crack growth and matrix cracking in the form of dissipated energy. Ultrasonic inspection were carried out on the impacted specimens. A scan of the ultrasonic testing on the phenolic composites found presence of a back wall in neat phenolic and was eradicated with fiber reinforcement due to attenuation and energy dissipation. The attenuation coefficient of composites was calculated with the aid of the A-scan. Therefore, it is concluded that ultrasonic inspection on the natural fiber is limited due to the large scattering of wave and energy loss due to attenuation, while infrared thermography is suitable to inspect natural-fiber-reinforced composites when monotonic loadings are applied.
Introduction
The demand for composite materials in structural application in the aerospace, automotive, marine, and sports industries keep increasing due to their light-weight, corrosion resistant, cost effective, and superior properties. Non-destructive testing (NDT) is the only testing that detects damages formed in the composite materials during fabrication or in service of the component, without destroying the test components. However, structural integrity identification and assessment is particularly challenging because composite materials typically are non-homogeneous and anisotropic. NDT methods are used for composites especially in detecting the porosity, crack, delamination, debonding, thick wall, sandwich structures, as well as for structural health monitoring (Wang et al., 2020). NDT methods such as ultrasonic testing, radiography, thermography, Eddy current, and acoustic emission are emerging tools. Methods are categorized according to their applications and their inherent characteristics. The selection of a suitable NDT method is applied to detect defects depending upon the applicability criteria of the structure, physical, and mechanical properties of the composite materials.
Adequate experimental techniques are necessary in order to identify damages in composite structures and to monitor their location and progression during loading. Among the NDT methods, Infrared (IR) thermography and acoustic emission (AE) are used for in-line monitoring of the progression of defects in composite materials during loading. Nonetheless, the most common NDT method used to inspect natural-fiber-reinforced polymeric composites is AE (Park et al., 2006; De Rosa et al., 2009; Sarasini and Santulli, 2014). AE is a contact-sensor (piezoelectric) which detects stress wave motion that causes dynamic displacement and converts it to an electrical signal (Giurgiutiu, 2020). (Selmi et al., 2020) investigated the compression damage of honeycomb cores made from non-woven flax-epoxy composites using an AE. The result from the AE revealed that matrix cracking was the dominant damage factor for all the test samples over fiber pull-out and fiber-breakage (Selmi et al., 2020). In the flax-reinforced epoxy composites, the fiber breakage eventually increases the surface density, resulting in a loss of honeycomb performance. However, some challenges have been identified and addressed on their natural fiber. The challenges are the probability that the damage analysis using AE relies on the complexity of fiber architecture, which may lead to a challenging evaluation of the AE data through the inclusion of multiple affected areas (Sarasini and Santulli, 2014).
In natural-fiber-reinforced composites, the presence of different dimensional dispersions and the interfacial strength between the fiber-matrix are the most challenging in comparison to synthetic-based composites. Natural fibers are irregular (uneven cell structure), non-homogeneous, and their cellular hierarchical structures are filled with cavities or lumens of different dimensions (Sanjay et al., 2018; Huang et al., 2019). Their integration into a polymer matrix generates compatibility issues that can only be resolved partially by fiber surface treatment by a broad dispersion of properties in the final laminate of composites (Sanjay et al., 2019; Yusof et al., 2020). The uncertainty of the composite’s mechanical properties results in the difficulties of establishing accurate stress limits for the nature of the materials and determining the impact of damage on the structure (Lau et al., 2018). Therefore, very limited NDT methods or resources have been used for natural-fiber-reinforced composites (Amir et al., 2019).
IR thermography is a non-contact sensor that records temperature, depending on the IR radiation emitted by each object at a temperature above absolute zero (Gutschwager et al., 2020). IR thermography is capable of measuring surface temperature during the application of thermal charge due to mechanical loading on the structural component. (Islam and Ulven, 2020). carried out a thermographic and energy-based approach to the fatigue strength of flax fibre reinforced composites, and both the stabilized temperature and dissipated energy showed a linear relationship. El Sawi et al. investigated the fatigue damage of a unidirectional flax-reinforced epoxy composite using IR thermography (El Sawi et al., 2014). The analysis of the IR thermography and the experimental fatigue test data showed a correlation with a low dispersion. It was observed that pectin, as the binding agent, was the weakest in the composite which led to the initiation of defect between the fibers in fiber bundles of flax-reinforced epoxy composite. Therefore, a crack was triggered and propagated over the interface between the elementary of flax fibers during cyclic loading (Tripathi et al., 2016). Suriani et al. carried out the Infrared Thermal Imaging Technique method on kenaf/epoxy composite and found manufacturing standard defects such as voids, resin-rich field, pocket of undispersed crosslinker, misaligned fibers, and regions where the resin has been improperly wetted by the fiber (Suriani et al., 2012). Most research works applying infrared thermography on composite materials focused mainly on stress analysis under dynamic loading specifically on fatigue. Very few experiments have applied it to monotonic loading since composite materials are not extremely dissipative (Colombo et al., 2011). Therefore, it is not reliable to support material damage characterization for low applied loadings with small temperature variations solely (Harizi et al., 2014).
The fundamental principles of ultrasonic testing include propagation and reflection of sound waves (acoustics). (El-Sabbagh et al., 2013a). studied the feasibility of fiber content and distribution in flax polypropylene composites using the ultrasonic method and found that as the fiber content increased, the attenuation coefficient increased in a parabolic trend. As the sound waves cross a medium, the intensity of the amplitude decreases with distance called attenuation. In composites, the natural fiber content influences the longitudinal sound velocity and attenuation (El-Sabbagh et al., 2013b). The study reported that the attenuation coefficient increases from 70 to 3,000 dB/m for non-reinforced polypropylene and 50 wt% fiber reinforced polypropylene. However, (Abd El-Malak, 1997) observed that the attenuation coefficient for non-reinforced polyester and 60 wt% glass fiber reinforced polyester only increases from 400 to 800 dB/m. This findings supported by the fact that natural fibers attributed to the void content cause higher attenuation (Loganathan et al., 2018). To date, no study has been done on X-ray radiography on short-natural fiber reinforced polymer composites. However, (Prade et al., 2017) characterized fiber glass and carbon fiber orientation in short-natural fiber-reinforced polymer composites using X-ray radiography, and identified the radiography as a promising method that offers information of two dimensions on the fiber direction and its orientation degree as well as the fiber content. On the other hand, Fernandes et al. assessed the fiber orientation in randomly-oriented carbon strand composites using IR thermography and found the accuracy was 71.6% (Fernandes et al., 2015). (De Rosa et al., 2010) characterized fiber–matrix interface during tensile and flexural tests using AE on random and quasi-unidirectional Phormium tenax fiber-reinforced epoxy composites. They found that higher amplitudes reflected breakages of fiber, and the range of 50–70 dB amplitudes was defined as the failure mechanism occurring in the matrix and at the interface. Only a few NDT tests were carried out on randomly-oriented short-fiber composites of either synthetic-or natural-based.
Two Inspection of natural fiber composites is a significant issue and NDT is a possible solution only if a rigorous analysis is performed. To date, no study has been carried out on the ultrasonic inspection of randomly-oriented short-natural fiber reinforced polymeric composites. Even for the IR thermography inspection of randomly-oriented short-natural fibers, very few studies have been reported to date. The aim of this work is to study the feasibility of using the infrared thermography and ultrasound imaging of the palm fiber loading and size in natural fiber reinforced phenolic composites. The size of the palm fiber varied between 1.18–0.6 mm, 0.6–0.3 mm, and less than 0.3 mm at a loading of 20 and 40 wt%, which is categorized as short fiber. The fibers were arranged in a random orientation and the composites were prepared using a hot press machine. In this research, the effects of the size and content of palm fiber in the phenolic resin on the tensile strength are characterized using the IR thermography method. The tensile testing was carried out simultaneously with the IR thermography, while the ultrasound imaging was carried out on the impacted test specimen.
Materials and Methods
Preparation of Short-Palm-Fiber-Reinforced Phenolic Composites
The phenolic resin PH-4055 (Novolac type) was supplied by Chemovate Girinagar, India. The palm fibers were manually extracted from the leaf stalk of Lipstick Palm and treated with sodium hydroxide solution. The sodium hydroxide pellet was purchased from R and M Chemicals. The composite formulations used in this study are given in Table 1. The composite sheets with a thickness of 3 mm were prepared by pressing the mixture of palm fiber and phenolic resin material in a steel mold at 160°C for 15 min at a pressure of 10 MPa using hot compression.
TABLE 1
| Abbreviation | Size of palm fiber (mm) | CR fiber content (%) |
|---|---|---|
| PH | No filler | |
| 20L | 1.18−0.6 | 20% |
| 40L | 1.18−0.6 | 40% |
| 20M | 0.6−0.3 | 20% |
| 40M | 0.6−0.3 | 40% |
| 20S | <0.3 | 20% |
| 40S | <0.3 | 40% |
Size and content of palm fiber in phenolic composites.
IR Thermographic and Tensile Testing
In this study, the IR-camera Micro-Epsilon thermoIMAGER TIM 200 was used with an optical resolution of 160 × 120 pixels, a spectral range of 7.5–13 μm, a thermal sensitivity of 0.08 K and an acquisition rate of 128 Hz. The IR camera was positioned approximately 300 mm away from the specimen surface during the tensile testing as shown in Figure 1. The central area of the specimen was scanned because the heat transfer from the grips may have influenced the top and bottom sections of the specimen. For data processing, the device was connected to a monitor and the test unit to provide a reference signal. TIM Connect, a thermal camera software, was used for post-processing the data. This software provides full field thermal maps of the scanned area, assesses damage, and maps data for temperature. The video and thermographic monitoring were performed simultaneously. Five specimens were tested, for each configuration.
FIGURE 1
The tensile test of palm-fiber-reinforced phenolic composites was carried out as per the ASTM D3039 standard using INSTRON 5556. The samples were prepared as rectangular strips with a dimension of . The sample’s gauge length was maintained at 50 mm, crosshead speed at 2 mm/min, with a load cell of 5 kN. The inspection of the tensile damage was carried out using IR thermography. Five specimens were tested, for each configuration and average reading was recorded.
Ultrasonic Imaging and Impact Testing
The ultrasonic imaging was carried out on the impacted samples. Ultrasonic Flaw Detector Dolphicam2 from Dolphitech has the capability to execute the inspection on the impacted composite materials. A longitudinal mode velocity of 3,070 m/s was used in this study. An 80% Full Screen Height (FSH) was used as the reference threshold to examine the reflected and received sound energy by the transducer. The probe had a 2D array with a transducer array and 3.5 MHz frequency, implying that a total of 16,384 transducer elements performed deep analysis in real time. Scans performed at the middle of impacted specimen to achieve a reasonable lateral resolution throughout the thickness of the specimen. Five specimens were tested, for each configuration. The principle of this apparatus and the result displays are shown in Figure 2 below. A-Scan, B-Scan, and C-Scan were captured, where A-scan represents the signal amplitude, B-scan represents the cross-section of the composite materials, while C-scan provides the plan view information of the tested samples. The attenuation coefficient of the composites was determined as shown in Eq. 1 with the aid of the A-scan.Where, is attenuation coefficient, and are signal strengths from A-scan.
FIGURE 2
However, the images of B-scan and C-scan were not clear due to possibilities such as: 1) the natural fiber composite material absorbed the sound wave or energy, or 2) the current probe frequency was not sufficient to execute on the natural fiber composites. Therefore, it was recommended by authors to use a transducer with a frequency of 0.5 or 1 MHz in order to improve the sensitivity and resolution.
The Izod impact test was carried out as per ASTM D256 using Gotech Testing Machine. A rectangular sample was prepared with a dimension of . The impact strength was calculated based on the impact energy and the cross sectional area of the sample as shown in Eq. 2. Five specimens were tested, for each configuration and average reading was recorded.
Results and Discussion
IR Thermography Inspection of Tensile Testing
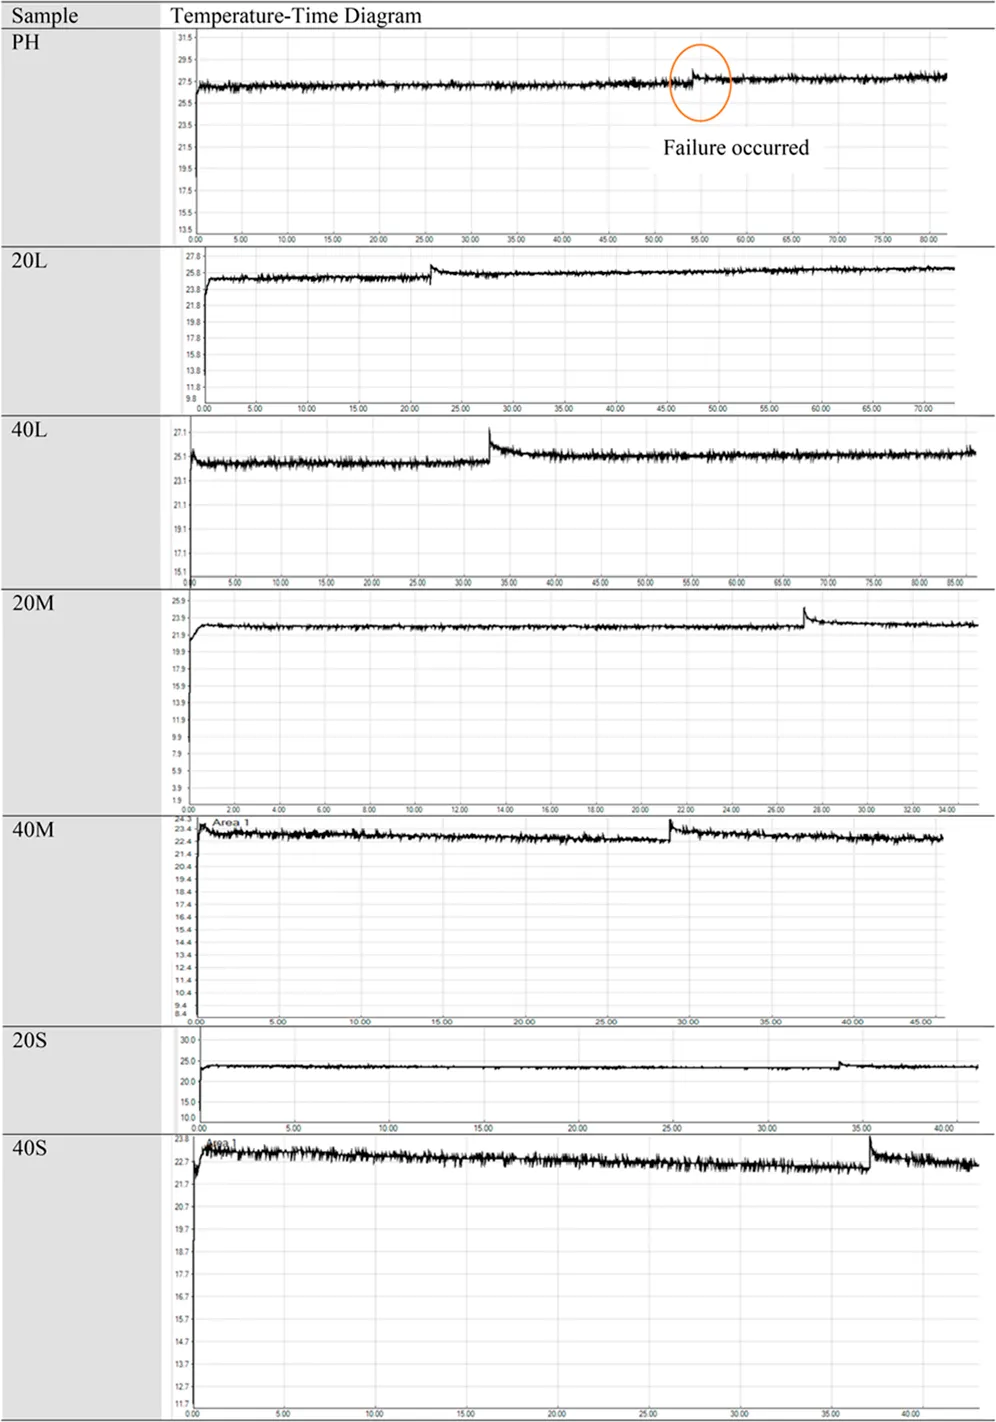
Figure 3 represents the thermographic images of the tensile specimen throughout the testing. The speed of the infrared camera was 128 Hz; therefore, the images were continuously captured for every subsequent 0.0078 s. In the initial images, there was no sign of failure. When the extension rate increased, the composites of the phenolic matrix began cracking and the fracture propagated until a final failure was achieved. The overall temperature before the failure remained constant; however, when the complete failure took place, the temperature evolution reached a peak. This indicates that the failure was in a brittle manner which occurred instantly without deformation. During the failure, the peak was observed due to a macro crack growth and matrix cracking (Kim et al., 2011). It released the mechanical energy in the form of dissipated energy as heat on the surface (Lisle et al., 2013). In this case, the dissipated energy was much smaller than the thermo-elastic source, therefore, the size of peak was also small.
FIGURE 3
Table 2 displays the result of Temperature-Time diagram for tensile testing of the palm-fiber-reinforced phenolic composites at different sizes and contents of the fiber. The tensile tests were carried out at room temperature under the displacement control. An increase in the temperature was observed when the failure occurred at the interval time. It is noted that the exhibited hump shape showed the temperature variations along the length direction of the sample. This is due to the heat conduction along the length direction where there was heat conduction in both cold ends of the sample. As a result, the center of the sample emitted higher temperature than both ends of the sample.
TABLE 2
 |
Result of Temperature-Time Diagram for tensile testing of palm-fiber-reinforced phenolic composites.
Table 3 displays the tensile strength of the phenolic and palm-fiber-reinforced phenolic composites and the time taken for the fracture to occur. The damage evolution was obtained by a combination of thermal application and mechanical analysis. For the palm-fiber-reinforced composites, as the size of the fiber reduced, the tensile strength as well as the time taken for the tensile fracture to occur increased. It is noticed that the addition of 20 wt% of fiber between the sizes of 1.18 to 0.6 mm and 0.6 to 0.3 mm reduced the tensile strength relative to the phenolic resin. Therefore, the time taken to fracture also reduced as the tensile strength of the composites decreased. However, when the fiber size became smaller and the content increased, the tensile strength was improved and the time taken to fracture was observed longer. In fact, the phenolic resin was more compatible with a smaller fiber size as it was influenced by the viscosity of the resin during the hot press for the sample fabrication. Hence, it affected the interfacial bonding between the fiber and matrix.
TABLE 3
| Specimen | Tensile strength (MPa) | Time taken to fracture (s) |
|---|---|---|
| PH | 29.82±3.30 | 52.20±2.03 |
| 20L | 20.96±3.03 | 23.40±1.02 |
| 40L | 24.23±4.06 | 24.20±0.75 |
| 20M | 25.87±2.90 | 28.20±1.33 |
| 40M | 27.90±4.07 | 29.40±1.02 |
| 20S | 29.90±3.00 | 34.40±1.02 |
| 40S | 34.27±3.96 | 37.00±1.41 |
Time taken for the tensile specimen to fracture.
Ultrasonic Inspection on Impacted Specimen
The impact properties of the palm-fiber-reinforced phenolic composites were calculated according to Eq. 2 and tabulated in Table 4 which shows that the phenolic impact strength increased with the addition of palm fiber. The improvement in the impact intensity is due to the ability of the fiber that effectively transfers the impact load. The failure of the composites is due to the impact caused by failure of the matrix, fiber pull-out, and debonding of the fiber matrix (Andrew et al., 2019). Debonding takes place when the transmission load exceeds the interfacial bonding of the fiber-matrix (Zhou et al., 2020). Meanwhile, fiber pull-out happens when the force exceeds the strength of fiber, owing to energy dissipation (Chen et al., 2020).
TABLE 4
| Sample | Impact strength (kJ/m2) |
|---|---|
| PH | 1.15±0.04 |
| 20L | 2.72±0.02 |
| 40L | 3.28±0.03 |
| 20M | 2.21±0.03 |
| 40M | 2.90±0.02 |
| 20S | 1.79±0.04 |
| 40S | 2.03±0.02 |
Impact properties of palm-fiber-reinforced phenolic composites.
Table 5 displays the schematic diagram of A-scan of the palm fiber in various sizes and contents in phenolic composites and also the calculated value of attenuation coefficient based on Eq. 1. From the A-scan results, there is no indications of defect detected. In the neat phenolic, presence of a back wall was noticed. The inclusion of natural fiber in the phenolic, thus, removed the back wall echo. This may be due to attenuation and energy dissipation. The gross attenuation of the ultrasonic waves in composites is the sum of the matrix viscosity, the scattering attenuation owing to defects (void) and the energy loss at the fiber/matrix interface (Li et al., 2018). Attenuation is high in the matrix, owing to the fact that absorption of sound energy is by viscoelastic matrix. (Biwa, 2001) also stated that within composites, not just the scattering of waves by micro constituents, but also their viscoelastic properties contribute significantly to the attenuation of waves. The high frequency waves absorbed by the polymer matrix, however, were scattered by the natural fiber. There are four basic attenuations in ultrasonic, namely absorption, scattering, beam spreading, and dispersion. Sound velocity also results in dispersion due to heterogenous (dissimilar) materials, i.e., fiber and matrix. The addition of natural fiber in phenolic composites, increases the attenuation coefficient. The major contributing factors to sound attenuation in natural fiber composites are the complex porous existence of natural fibers, fiber scattering, higher void content compared to synthetic fiber composites, and the interface friction between fibers and matrix. Further supported by (Yang and Li, 2012), as the sound wave is transmitted to the fibers, the viscous effect between the fiber frame and the air cavities (lumen) attenuates most of the sound energy. Fiber size and loading are significant parameters for the attenuation coefficient. As the fiber size gets smaller and the loading increases, higher attenuation is attained. (Seviaryna et al., 2014) similarly found that sound attenuation coefficient in the natural fiber reinforced composites increases exponentially with an increase of volume fraction of fiber. As the natural fiber loading increases in composites, the percentages of voids also increase, resulting in greater attenuation coefficient. Similar findings was reported by (Mehdikhani et al., 2019; Gholampour and Ozbakkaloglu, 2020) that attenuation with void content increased rapidly.
TABLE 5
| Sample | A schematic diagram | A-scan Display | Intensity of back wall, Full Screen Height (FSH) | Attenuation coefficient, dB |
|---|---|---|---|---|
| PH | 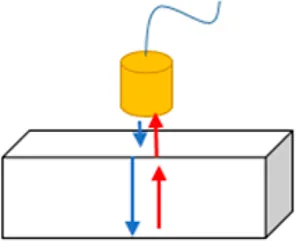 | 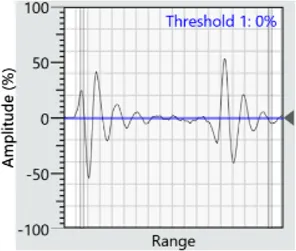 | 60% | 4.43 dB |
| 20L | 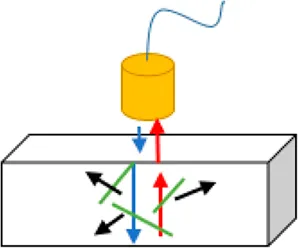 | 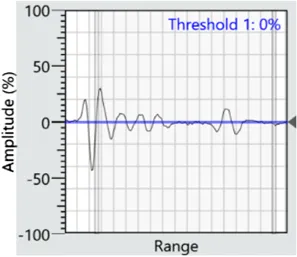 | 30% | 6.02 dB |
| 40L | 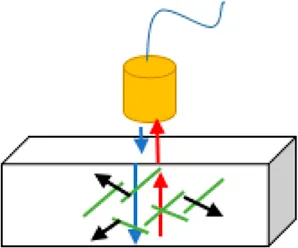 | 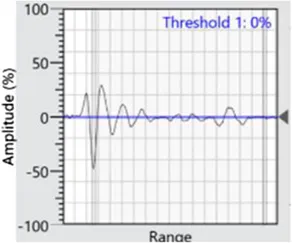 | 20% | 9.54 dB |
| 20M | 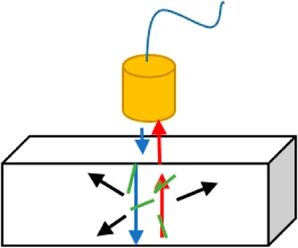 | 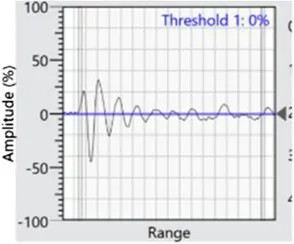 | 20% | 9.54 dB |
| 40M | 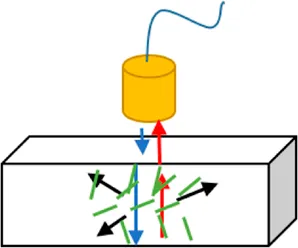 | 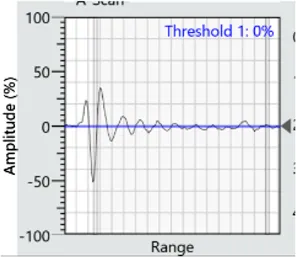 | 10% | 15.56 dB |
| 20S | 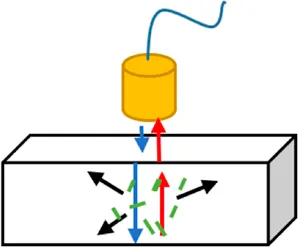 | 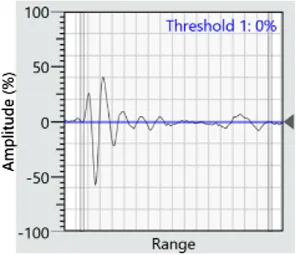 | 10% | 15.56 dB |
| 40S | 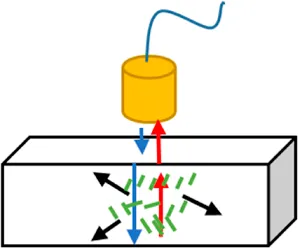 | 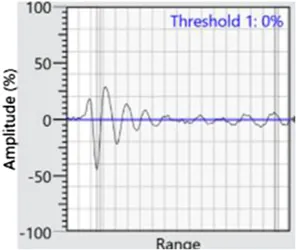 | 5% | 21.58 dB |
A-scan of attenuation of various sizes and contents of palm fiber in phenolic composites.
For the smallest fiber size (mention the size), the maximum attenuation coefficient is attained. This may result in less overlap due to the random distribution of smaller fibers, more surface area exposure to the sound wave to be absorbed and scattered. With the tendency of longer fiber to entangle and agglomerate, the interaction between fiber and fiber increased, contributing to lower absorption and scattering of sound wave energy. This is supported by (Liu et al., 2013) who studied the effect of fiber orientation and frequency on attenuation characteristics. The study reported that the highest attenuation occurs where the fibers are oriented in the direction of wave propagation. (Yang and Li, 2012). also reported that attenuation and dispersion were perpendicular to the fibers. Therefore, the distribution of the smaller size fiber in the composites, resulted in the highest attenuation due to its orientation.
Conclusion
In the case of palm-fiber-reinforced composites, as the fiber size decreased, the tensile strength and the time taken for the tensile to fracture increased. The temperature evolution reached a peak when the failure occurred. It is indicated that the failure occurred in a brittle manner without deformation. During the failure, the peak was observed as dissipated heat energy due to the growth of macro crack at the matrix cracking in the form of heat. On the other hand, the impact strength decreased as the size of the composites decreased. During the inspection of palm-fiber-reinforced composites, no back wall was observed, only the threshold identification was detected. This may be caused by attenuation and energy dissipation due to the porous structure which led the sound energy to be scattered by the natural-fibers. The addition of natural fibers to phenolic composites raises the attenuation coefficient. Fiber size and loading are significant parameters for the attenuation coefficient. As the fiber size was becoming smaller and the loading increased, the attenuation was higher. The study provides a quantitative evaluation of the attenuation coefficient of association between the loading and size of palm fibere in phenolic composites. These ultrasonic wave propagation analysis and infrared thermography analysis are promising for short randomly oriented natural fiber reinforced polymer.
Funding
This work is supported by UPM under GPB grant, 9668200.
Statements
Data availability statement
The raw data supporting the conclusions of this article will be made available by the authors, without undue reservation.
Author contributions
TL carried out the composites fabrication and constructed materials and methods. MS helped in the analysis part and constructed the conclusion. SA carried out the IR thermography at Malaysian Nuclear Agency. MY carried out the Tensile testing at Malaysian Nuclear Agency. JJ carried out the Ultrasonic Inspection and also helped in the analysis part. AS constructed the introduction part.
Acknowledgments
The authors would like to express their gratitude and sincere appreciation to the Department of Aerospace Engineering, Faculty of Engineering, Universiti Putra Malaysia and Laboratory of Biocomposite Technology, Institute of Tropical Forestry and Forest Products (INTROP), Universiti Putra Malaysia (HiCOE) and also a special thanks to Dr Ilham Mukriz Zainal Abidin, Agency Nuclear Malaysia for the close collaboration in this research.
Conflict of interest
Author JJ was employed by company Sensor Networks Inc.
The remaining authors declare that the research was conducted in the absence of any commercial or financial relationships that could be construed as a potential conflict of interest.
References
1
Abd El-MalakN. (1997). Ultrasonic properties of composites (polymer-fibre glass). Bull. Mater. Sci. 20, 981–990.
2
AmirS. M. M.SultanM. T. H.JawaidM.AriffinA. H.MohdS.SallehK. a. M.et al (2019). “16-nondestructive testing method for Kevlar and natural fiber and their hybrid composites,” in Durability and life prediction in biocomposites, fibre-reinforced composites and hybrid composites. Editors JawaidM.ThariqM.SabaN. (Cambridge, United Kingdom: Woodhead Publishing), 367–388.
3
AndrewJ. J.SrinivasanS. M.ArockiarajanA.DhakalH. N. (2019). Parameters influencing the impact response of fiber-reinforced polymer matrix composite materials: a critical review. Compos. Struct. 224, 111007. 10.1016/j.compstruct.2019.111007
4
BiwaS. (2001). Independent scattering and wave attenuation in viscoelastic composites. Mech. Mater. 33, 635–647. 10.1016/S0167-6636(01)00080-1
5
ChenM.ZhongH.WangH.ZhangM. (2020). Behaviour of recycled tyre polymer fibre reinforced concrete under dynamic splitting tension. Cement Concr. Compos. 114, 103764. 10.1016/j.cemconcomp.2020.103764
6
ColomboC.LibonatiF.PezzaniF.SalernoA.VerganiL. (2011). “Fatigue behaviour of a GFRP laminate by thermographic measurements,” in 11th international conference on the mechanical behavior of materials (ICM11), Como, Italy, January 1, 2011 (Amsterdam, Netherlands: Elsevier), 3518–3527.
7
De RosaI. M.SantulliC.SarasiniF. (2009). Acoustic emission for monitoring the mechanical behaviour of natural fibre composites: a literature review. Compos. Appl. Sci. Manuf. 40, 1456–1469. 10.1016/j.compositesa.2009.04.030
8
De RosaI. M.SantulliC.SarasiniF. (2010). Mechanical and thermal characterization of epoxy composites reinforced with random and quasi-unidirectional untreated Phormium tenax leaf fibers. Mater. Des. 31, 2397–2405. 10.1016/j.matdes.2009.11.059
9
El-SabbaghA.SteuernagelL.ZiegmannG. (2013a). Characterisation of flax polypropylene composites using ultrasonic longitudinal sound wave technique. Compos. B Eng. 45, 1164–1172. 10.1016/j.compositesb.2012.06.010
10
El-SabbaghA.SteuernagelL.ZiegmannG. (2013b). Ultrasonic testing of natural fibre polymer composites: effect of fibre content, humidity, stress on sound speed and comparison to glass fibre polymer composites. Polym. Bull. 70, 371–390. 10.1007/s00289-012-0797-8
11
El SawiI.FawazZ.ZitouneR.BougheraraH. (2014). An investigation of the damage mechanisms and fatigue life diagrams of flax fiber-reinforced polymer laminates. J. Mater. Sci.49, 2338–2346.
12
FernandesH.ZhangH.Ibarra-CastanedoC.MaldagueX. (2015). Fiber orientation assessment on randomly-oriented strand composites by means of infrared thermography. Compos. Sci. Technol. 121, 25–33. 10.1016/j.compscitech.2015.10.015
13
GholampourA.OzbakkalogluT. (2020). A review of natural fiber composites: properties, modification and processing techniques, characterization, applications. J. Mater. Sci. 55, 1–64. 10.1007/s10853-019-03990-y
14
GiurgiutiuV. (2020). “Structural health monitoring (SHM) of aerospace composites,” in Polymer composites in the aerospace industry. Editors IrvingP. E.SoutisC. (Amsterdam, Netherlands: Elsevier), 491–558.
15
GutschwagerB.KönigS.KononogovaE.MonteC.ReinigerM.SchillerS. (2020). Non-contact temperature measurement at the Physikalisch-Technische Bundesanstalt (PTB). Quant. InfraRed Thermo. J.1–26.
16
HariziW.ChakiS.BourseG.OurakM. (2014). Mechanical damage assessment of Polymer–Matrix Composites using active infrared thermography. Compos. B Eng. 66, 204–209. 10.1016/j.compositesb.2014.05.017
17
HuangP.WuF.ShenB.MaX.ZhaoY.WuM.et al (2019). Bio-inspired lightweight polypropylene foams with tunable hierarchical tubular porous structure and its application for oil-water separation. Chem. Eng. J. 370, 1322–1330. 10.1016/j.cej.2019.03.289
18
IslamM. Z.UlvenC. A. (2020). A thermographic and energy based approach to define high cycle fatigue strength of flax fiber reinforced thermoset composites. Compos. Sci. Technol. 196, 108233. 10.1016/j.compscitech.2020.108233
19
KimJ. G.YoonS. C.KwonS. T. (2011). “Analysis of fracture behavior in polymer matrix composites by infrared thermography,” in Key engineering materials. Editors GhassanH.MajidA.AlbermanyS.ObaidA. J.AlasadyL. A. (Zurich, Switzerland: Trans Tech Publication), 397–400.
20
LauK.-T.HungP.-Y.ZhuM.-H.HuiD. (2018). Properties of natural fibre composites for structural engineering applications. Compos. B Eng. 136, 222–233. 10.1016/j.compositesb.2017.10.038
21
LiR.NiQ.-Q.XiaH.NatsukiT. (2018). Analysis of individual attenuation components of ultrasonic waves in composite material considering frequency dependence. Compos. B Eng. 140, 232–240. 10.1016/j.compositesb.2016.03.045
22
LisleT.BouvetC.PastorM.-L.MargueresP.CorralR. P. (2013). Damage analysis and fracture toughness evaluation in a thin woven composite laminate under static tension using infrared thermography. Compos. Appl. Sci. Manuf. 53, 75–87. 10.1016/j.compositesa.2013.06.004
23
LiuZ.OswaldJ.BelytschkoT. (2013). XFEM modeling of ultrasonic wave propagation in polymer matrix particulate/fibrous composites. Wave Motion. 50, 389–401. 10.1016/j.compositesa.2013.06.004
24
LoganathanT. M.SultanM. T.GobalakrishnanM. K. (2018). “Ultrasonic inspection of natural fiber-reinforced composites,” in Sustainable composites for aerospace applications, Editor JawaidM.ThariqM. (Amsterdam, Netherlands: Elsevier), 227–251
25
MehdikhaniM.GorbatikhL.VerpoestI.LomovS. V. (2019). Voids in fiber-reinforced polymer composites: a review on their formation, characteristics, and effects on mechanical performance. J. Compos. Mater. 53, 1579–1669. 10.1177/0021998318772152
26
ParkJ.-M.SonT. Q.JungJ.-G.HwangB.-S. (2006). Interfacial evaluation of single Ramie and Kenaf fiber/epoxy resin composites using micromechanical test and nondestructive acoustic emission. Compos. Interfac. 13, 105–129. 10.1163/156855406775997051
27
PradeF.SchaffF.SenckS.MeyerP.MohrJ.KastnerJ.et al (2017). Nondestructive characterization of fiber orientation in short fiber reinforced polymer composites with X-ray vector radiography. NDT E Int. 86, 65–72. 10.1016/j.ndteint.2016.11.013
28
SanjayM. R.MadhuP.JawaidM.SenthamaraikannanP.SenthilS.PradeepS. (2018). Characterization and properties of natural fiber polymer composites: a comprehensive review. J. Clean. Prod. 172, 566–581. 10.1016/j.jclepro.2017.10.101
29
SanjaySiengchin, S.ParameswaranpillaiJ.JawaidM.PruncuC. I.KhanA. (2019). A comprehensive review of techniques for natural fibers as reinforcement in composites: preparation, processing and characterization. Carbohydr. Polym. 207, 108–121. 10.1016/j.carbpol.2018.11.083
30
SarasiniF.SantulliC. (2014). “Non-destructive testing (NDT) of natural fibre composites: acoustic emission technique,” in Natural fibre composites. Editors HodzicAShanksR. (Amsterdam, Netherlands: Elsevier), 273–302.
31
SelmiS.HabibiM.LaperrièreL.KelouwaniS. (2020). Characterisation of natural flax fibers honeycomb: compression damage analysis using acoustic emission. J. Nat. Fibers1–10. 10.1080/15440478.2020.1789531
32
SeviarynaI.BuenoH. G.MaevaE.TjongJ. (2014). “Characterization of natural fibre-reinforced composites with advanced ultrasonic techniques,” in IEEE international ultrasonics symposium, Chicago, IL USA, September 3–6, 2014 (Piscataway, NJ, United States: IEEE), 1428–1431.
33
SurianiM.AliA.KhalinaA.SapuanS.AbdullahS. (2012). Detection of defects in kenaf/epoxy using infrared thermal imaging technique. Procedia Chem.4, 172–178.
34
TripathiK.VincentF.CastroM.FellerJ. (2016). Flax fibers—epoxy with embedded nanocomposite sensors to design lightweight smart bio-composites. Nanocomposites2, 125–134.
35
WangB.ZhongS.LeeT.-L.FanceyK. S.MiJ. (2020). Non-destructive testing and evaluation of composite materials/structures: a state-of-the-art review. Adv. Mech. Eng. 12, 1687814020913761. 10.1177/1687814020913761
36
YangW.LiY. (2012). Sound absorption performance of natural fibers and their composites. Sci. China Technol. Sci. 55, 2278–2283. 10.1007/s11431-012-4943-1
37
YusofN.SapuanS.SultanM.JawaidM. (2020). Conceptual design of oil palm fibre reinforced polymer hybrid composite automotive crash box using integrated approach. J. Cent. S. Univ. 27, 64–75. 10.1007/s11771-020-4278-1
38
ZhouA.QiuQ.ChowC. L.LauD. (2020). Interfacial performance of aramid, basalt and carbon fiber reinforced polymer bonded concrete exposed to high temperature. Compos. Appl. Sci. Manuf. 131, 105802. 10.1016/j.compositesa.2020.105802
Summary
Keywords
tensile testing, Infrared thermography, ultrasonic, impact testing, natural fiber composites
Citation
Loganathan TM, Sultan MTH, Muhammad Amir SM, Jamil J, Yusof MR and Md Shah AU (2021) Infrared Thermographic and Ultrasonic Inspection of Randomly-Oriented Short-Natural Fiber-Reinforced Polymeric Composites. Front. Mater. 7:604459. doi: 10.3389/fmats.2020.604459
Received
09 September 2020
Accepted
01 December 2020
Published
21 January 2021
Volume
7 - 2020
Edited by
Andrea Dorigato, University of Trento, Italy
Reviewed by
Stephane Panier, University of Picardie Jules Verne, France
Sanjay Mavinkere Rangappa, King Mongkut’s University of Technology North Bangkok, Thailand
Updates
Copyright
© 2021 Loganathan, Sultan, Muhammad Amir, Jamil, Yusof and Md Shah.
This is an open-access article distributed under the terms of the Creative Commons Attribution License (CC BY). The use, distribution or reproduction in other forums is permitted, provided the original author(s) and the copyright owner(s) are credited and that the original publication in this journal is cited, in accordance with accepted academic practice. No use, distribution or reproduction is permitted which does not comply with these terms.
*Correspondence: Mohamed Thariq Hameed Sultan, thariq@upm.edu.my
This article was submitted to Polymeric and Composite Materials, a section of the journal Frontiers in Materials
Disclaimer
All claims expressed in this article are solely those of the authors and do not necessarily represent those of their affiliated organizations, or those of the publisher, the editors and the reviewers. Any product that may be evaluated in this article or claim that may be made by its manufacturer is not guaranteed or endorsed by the publisher.