
 Martin Freiberg3
- 1 Institute of Botany, Darmstadt University of Technology, Darmstadt, Germany
- 2 Institute of Bio- and Geosciences, IBG-2: Plant Sciences, Forschungszentrum Jülich, Jülich, Germany
- 3 Institute of Botany, University of Leipzig, Leipzig, Germany
Here we present the first study, in which a large number of different vascular epiphyte species were measured for their photosynthetic performance in the natural environment of their phorophyte in the lowland rainforest of French Guyana. More than 70 epiphyte species covered the host tree in a dense cover. Of these, the photosynthesis of 16 abundant species was analyzed intensely over several months. Moreover, the light environment was characterized with newly developed light sensors that recorded continuously and with high temporal resolution light intensity next to the epiphytes. Light intensity was highly fluctuating and showed great site specific spatio-temporal variations of photosynthetic photon flux. Using a novel computer routine we quantified the integrated light intensity the epiphytes were exposed to in a 3 h window and we related this light intensity to measurements of the actual photosynthetic status. It could be shown that the photosynthetic apparatus of the epiphytes was well adapted to the quickly changing light conditions. Some of the epiphytes were chronically photoinhibited at predawn and significant acute photoinhibition, expressed by a reduction of potential quantum efficiency (Fv/Fm)30′, was observed during the day. By correlating (Fv/Fm)30′ to the integrated and weighted light intensity perceived during the previous 3 h, it became clear that acute photoinhibition was related to light environment prior to the measurements. Additionally photosynthetic performance was not determined by rain events, with the exception of an Aechmea species. This holds true for all the other 15 species of this study and we thus conclude that actual photosynthesis of these tropical epiphytes was determined by the specific and fluctuating light conditions of their microhabitat and cannot be simply attributed to light-adapted ancestors.
Introduction
Tropical epiphytic plants constitute a functional group of high diversity and about 10% of the terrestrial plant species can grow epiphytically (Kress, 1989). The vast majority of vascular epiphytes occur in the tropics, with a higher abundance in montane rainforests and in cooler upper montane and cloud forests. However, also in the lowland rainforest of the Amazon epiphytes can reach an astonishing diversity, such as described in the case study of Freiberg (1999), where 74 species of epiphytes were found on a single host tree.
Epiphytes have no physiological contact with their phorophyte and it was hypothesized that epiphytism was driven by the competition for light: plants escape the dark forest floors by climbing or becoming an epiphyte. This theory was first developed from observations of epiphytic bromeliads in Central America by Schimper (1888). A detailed study of the distribution of a large number of bromeliad species in Trinidad performed by Pittendrigh (1948), led to the distinction of an “exposure group,” a “sun group,” and a “shade-tolerant group,” and suggested that the epiphytic forms emerged from terrestrial ancestors preadapted to open, drier habitats. Subsequently this was supported by ecophysiological studies (Griffiths and Smith, 1983; Smith et al., 1986; Smith, 1989).
Conversely, studies of the distribution of epiphytic orchids in a West African rainforest have shown that they are not found in the very outer layers of the canopy, but rather dwell within the crown of trees, where light intensity is reduced (Johansson, 1975). It was also argued that shade- and sun-adapted physiological types should be reflected in distinctive light response characteristics. A comparison of light compensation points, light saturation of photosynthesis and the rate of photosynthesis at light saturation for a variety of epiphytes gave variable results, with some epiphytic ferns and orchids appearing as typical shade plants, while other ferns, orchids, and Kalanchoe uniflora appeared to be sun types (Lüttge et al., 1986). Most studies have considered light use as the main driving factor for epiphytism, despite the additional constraints of limited and highly fluctuating water and nutrient availability that also characterizes the habitat of tree canopies (Benzing, 1990, 2000; Lüttge, 2008).
Additionally, to the total availability of light, one should also bear in mind that light intensity within a canopy is subject to extreme spatio-temporal variations. Photosynthesis was shown to be differently affected by fluctuating as compared to constant conditions (Pearcy, 1990; Holtum and Winter, 2003; Rascher and Nedbal, 2006; Lüttge, 2008, chap. 4.2.1). Fluctuating light conditions may be extreme in tropical tree crowns as high light intensities quickly change to low light conditions because of fast moving clouds, diurnally changing solar angle and wind moving canopy (Doley et al., 1987; Lüttge, 2008, Figure 3.28).
Thus, the aim of this study was to (1) develop a novel approach to quantify the fluctuating light environment in natural canopies and to relate this to the momentary functional status of photosynthesis, to (2) use this approach and quantify light use and photosynthesis of a large number of epiphytes in their natural, fluctuating environment, and (3) to describe the diversity of epiphytic photosynthesis and its dependency on two main driving environmental factors, namely light and water.
Materials and Methods
Study Site and Plants
All measurements were performed from May to September 1997 within Les Nouragues national park (Reserve Naturelle des Nouragues) in the centre of French Guyana close to Arattai field station, located at the junction of the Arattai and Apporague river (3°95′24′′ N, 52°35′27′′ W, 45 m asl). At the site mean air temperature (1 m above the forest floor) is 24.9°C and mean annual rainfall 2920 mm, with rainfalls occurring year round and September to October being the driest months (Sarthou, 1992; van der Meer, 1995; Rascher et al., 2003; Lakatos et al., 2006).
A Virola michelii Heckel (Myristicaceae) tree, which had a dense cover of epiphytes, was chosen for this survey (Figures 1A,B). The tree was located 120 m from the Arattai river about 10 m above the water level. The tree was 52 m high and its major branches started at 33 m above ground, maximum crown diameter was 20 m (at a height of 37 m). The tree was climbed using rope assisted climbing techniques. For a detailed description of this tree and the environmental conditions inside the canopy see Freiberg (2001). 72 species of holoepiphytes and two species of hemiepiphytes were found on this tree (Freiberg, 1999) and 16 species, which were accessible by climbing techniques, were chosen for this study. From each species at least two, generally more than three individuals were marked, and the light environment and photosynthesis were characterized on more than 30 days during the measuring period. For a list of species and their distribution within the canopy see Table 1.
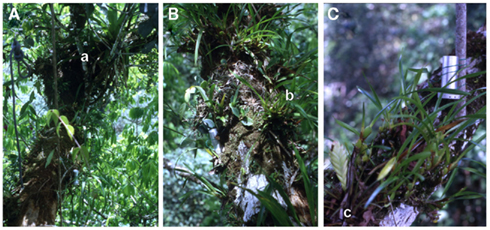
Figure 1. Habitat on the upper branches of the host tree Virola michelii Heckel. The pictures were taken between 38 and 41 m above ground. (A) Overview picture of a representative branch of V. michelii in the upper canopy (height 41 m). The branches are densely covered by vascular epiphytes that accumulated a substrate layer on the branches. The dominating species is Maxillaria alba (Hook. f.) Lindl. (B) Close-up view of the same branch showing several orchid species growing next to each other. Additionally, the spatial pattern of different light intensity becomes obvious, those light fleckles were highly fluctuating because of moving clouds and leaves. (C) Custom made light sensor (metal capsule), that was placed in close proximity to the plants for continuous recording of light intensity. Selected species, which were included in this study, are also visible in this panel: Clusia grandiflora Engl. (a), Maxillaria alba (Hook. f.) Lindl. (b), and Tillandsia anceps Lodd. (c).
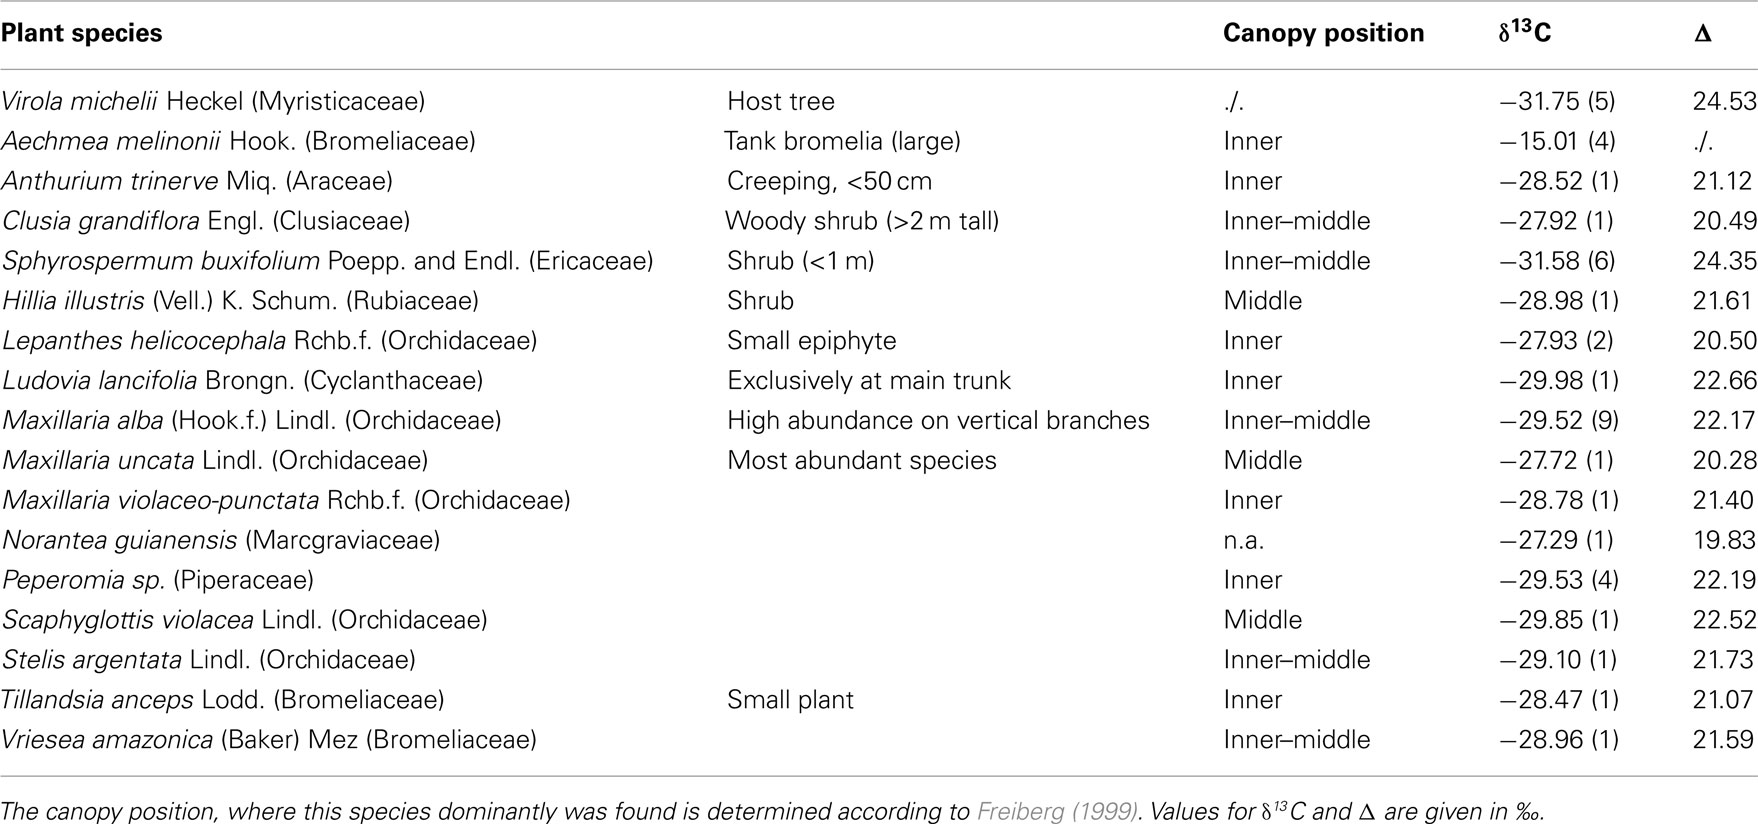
Table 1. Epiphyte species stable isotope values, that were recorded over the 3 months measuring period within the canopy of the Virola tree.
Light Measurements
Intensity of photosynthetically active radiation (PFD, λ = 380–710 nm) was measured using two methods. (1) The micro-quantum sensor of the Fluorescence Yield Analyzer (Mini-PAM) was used for instantaneous measurements of prevailing PFD in parallel to the measurements of chlorophyll fluorescence. (2) Miniaturized light sensors (metal capsules in Figure 1C) were specially developed to characterize the light environment over a longer time period. These sensors were placed directly next to the leaves and recorded time series of light intensity over 72 h. This allowed us to relate photosynthetic performance to the history of light that was received before.
These custom made light sensors are based on a gallium-arsenide photodiode (Pontailler, 1990), whose readings were stored every 2 min on a battery operated, miniaturized data logger (Tinytalk TK-070 2, Gemini Data Loggers Ltd., Chichester, UK). The light sensor and the data logger were sealed in a waterproof metal cylinder and data were collected for at least 24 h prior to the fluorescence measurements. The sensors were calibrated against a LI-COR quantum sensor (LI-190, LI-COR, Lincoln, NE, USA) and showed linear characteristic in the range of 0–900 μmol m−2 s−1. At higher PFD, reading of the sensors curved and reached saturation at about 1400 μmol m−2 s−1. We thus will use the numerical values at high PFD with care. However, local PFD within the canopy only rarely exceeded 1400 μmol m−2 s−1.
Quantification of Variations in Light Intensity within the Canopy
Light intensity (PFD), which was measured at various spots within the canopy of the Virola michelii tree, fluctuated greatly in time and space (Figure 2). Covering foliage moved by wind and fast changing clouds, which are characteristic for the wet tropics, induced rapidly changing light flecks of varied duration. The crown of the Virola michelii tree follows classical tree architecture with horizontal branches minimizing shadowing as already described by Halle et al. (1978). Nevertheless, local and small scale light environment that determines photosynthesis of individual leaves and branches cannot be determined analytically. Thus, it was impossible to predict light distribution within the canopy and, for example, spots which were located higher within the canopy (Figure 2C) could be exposed to lower PFD than a branch, which was just below (Figure 2A). Generally, no clear trends of PFD with the location in the canopy (height, distance from trunk) could be derived; average PFD was only lower regularly during early afternoon, because of the dense cloud cover and rainfall often occurring during this time of the day.
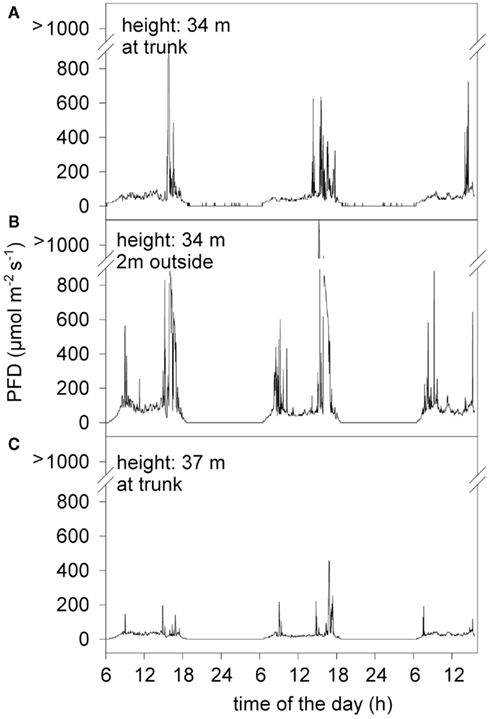
Figure 2. Light intensity (PFD) recorded on three subsequent days with three parallel sensors, which were located on the same side of the trunk within the canopy. (A) Light sensor located on vertical branch, about 40 cm off the main trunk. (B) Light sensor located on the same vertical branch, but 2 m off the main trunk. (C) Light sensor located 3 m just above sensor A, on vertical branch, about 40 cm off the main trunk.
In order to characterize the light environment to which individual plants were exposed, we developed a dynamic weighting routine (Figure 3). An autonomous light sensor was placed directly next to the leaf of an epiphyte to be measured (Figure 1C) and PFD was recorded continuously for at least 24 h prior to PAM measurements (see Figure 3A for an exemplary day course). During the following days, photosynthesis of this epiphyte was characterized and PFD values prior to these photosynthesis measurements were integrated. PFD was assumed to determine the state of the photosynthetic apparatus more strongly, if it was absorbed just before the photosynthesis measurement. Thus, ambient PFD was weighted with an exponential function, where light intensities that were prevailing before the PAM measurements were multiplied with a higher weighting factor, the longer the time span between insolation and PAM measurement, the lower the weighting factor (Eq. 4; Figure 3B). Weighted PFD were then integrated to derive the “effective” integrate PFD prior to the measurement (PFDexp; Figure 3C). The integrated PFD over the whole day (insolation) is shown for comparison (Figure 3C, insert). We regard PFDexp as a good parameter to describe the light environment the plant was exposed to and assume that this approach is especially useful to quantify light perception within a fluctuating environment. PFDexp was calculated as:
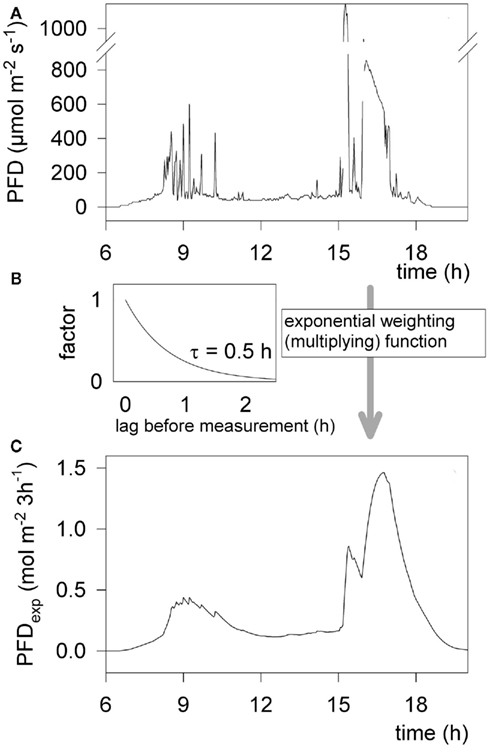
Figure 3. Example of light intensity (PFD) during the day course and the way of calculating an exponentially weighted integral over a 3 h time window. (A) Momentary (ambient) PFD measured by a light sensor in 2 min intervals. The sensor was located just above a dense stand of Maxillaria alba, 34 m above the ground in the canopy. (B) Exponential weighting function, with a half-time (τ) of 30 min. Light intensities measured before are multiplied (weighted) with this factor. (C) Exponentially weighted and integrated light intensity (PFDexp) over a 3 h window, determining the “recently” perceived photon flux. Insert: integrated light intensity over the same day course for comparison.
where t0 is the time of the measurement, PFD(t) is the light intensity at a given time, τ is the half-time of the exponential weighting function, and t describes the time (in hours) before the measurement of photosynthesis.
We are aware of the fact that the factor τ in Equation 4, which determines the half-time in which perceived PFD affects the photosynthetic apparatus, may be critical. We thus tested the correlation of photosynthetic parameters with PFDexp under changing τ. The correlations were stable as long as τ was between 0.2 and 2 h, we thus used 0.5 h as a fixed value for the following analyses. We also tested a linear decay function, which yielded similar results to the exponential function with the same half-time; however, we considered that an exponential decay function would reflect underlying physiological mechanisms (such as repair mechanisms) more accurately.
Rain Measurements
Rainfall was recorded continuously at Arattai field station, which was about 500 m from the study site. Rainfall was integrated over time periods of 6 h and these integrated values were used for correlation analyses. We exemplary also tested longer and shorter time intervals and found that results were not greatly affected as long as half-time remained in the range of a few hours.
Carbon Isotope Analysis
Carbon isotope ratios (δ13C) were determined mass-spectrometrically as relative deviations to Pee Dee belemnite standard [δ13C (‰)]. From each plant one to nine leaves were collected, dried and finely powdered. δ13C values indicate the general mode of photosynthesis [C3, C4, or crassulacean acid metabolism (CAM)], and for the leaves of C3 plants, can be used to calculate the relation between intercellular and extracellular CO2 partial pressures (ci/ca). This ratio is related to the ratio between assimilation rate and stomatal conductance (A/gs) and, thus, more negative δ13C values maybe due to either higher conductance or lower CO2 fixation rates. The δ13C of bulk leaf material reflects the photosynthetic conditions during leaf formation (i.e., the structural component, mainly cellulose) and recent photosynthetic activity (i.e., soluble sugars; Eq. 2). Carbon isotope discrimination, was calculated as
where δ13Cp is the value measured for the plant material and δ13Ca is the value of the CO2 of the ambient atmosphere, for which we used the average value of −8.00‰ as generally applied when δ13Ca was not measured.
Chlorophyll Fluorescence Measurements
Chlorophyll a fluorescence was measured using the miniaturized pulse-amplitude modulated photosynthesis yield analyzer (Mini-PAM) of H. Walz (Effeltrich, Germany) with a leaf clip holder described by Bilger et al. (1995). Prior to and just after each measurement, the fluorescence standard provided by H. Walz was measured. The readings of the standard were then used to normalize the absolute fluorescence values of leaves. By this procedure we could correct for different settings of the instrument, variations of the sensitivity and unavoidable differences in the distance of the fiber optics to the leaf surface. After this correction also absolute fluorescence values can be compared to each other. Spot measurements of light intensity (λ = 380–710 nm) were taken inside the measuring field by the micro-quantum sensor of the Mini-PAM and calibrated against a LI-COR quantum sensor (LI-190, see above). The effective quantum yield of PS II (ΔF/Fm′) was calculated as (Fm′ − F)/Fm′, where F is fluorescence yield of the light-adapted sample and Fm′ is the maximum light-adapted fluorescence yield when a saturating light pulse of 800 ms duration (intensity ≈4000 μmol m−2 s−1) is superimposed on the prevailing environmental light levels (Genty et al., 1989; Schreiber and Bilger, 1993). During these measurements special care was taken not to change the ambient conditions, e.g., the angle of the leaf or shading. Predawn values of optimal quantum yield of PS II (Fv/Fm) were performed twice before sunrise between 4:00 and 5:00. Fv/Fm was calculated as Fv/Fm = (Fm − F0)/Fm, where F0 is ground fluorescence yield of the dark adapted leaf and Fm maximum fluorescence of the dark adapted leaf when a saturating light pulse, as described above, is superimposed. Additionally, potential quantum yield was measured at different times of the day, after leaves were darkened for 20–30 min using the darkening clips of H. Walz. With this treatment acute photoinhibition during the day course can be detected. To avoid confusion these measurements will be denoted (Fv/Fm)30′, where the subscript number indicates the duration of darkening. (Fv/Fm)30′ values may be lower than predawn values, indicating an inhibited photosynthetic apparatus; we will refer to this as “dynamic photoinhibition” as maximum values may still recover after a night–long dark relaxation. Predawn Fv/Fm values, which were below the theoretical and empirical optimum of 0.83, indicate a non-repairable damage to the photosynthetic apparatus, and we will refer to this as “chronic photoinhibition.”
Non-photochemical processes (NPQ) were calculated as (Fm − Fm′)/Fm′ (Bilger and Björkman, 1990). Fm values were taken as average readings for each individual from predawn measurements. The apparent rate of photosynthetic electron transport of PS II (ETR) was obtained as ETR = ΔF/Fm′ · PFD · 0.5 · 0.84, where the factor 0.5 assumes equal excitation of both PS II and PS I. The factor of 0.84 takes into account that a fraction of incident light is not absorbed by photosystems. For the plants used in this study no specific reflection factors are known. Due to the fact that no specific anatomical, light reflecting structures, such as hairs, were present, we assumed an average reflection on the leaf surface and thus used the empirical mean absorption factor of 0.84 (Ehleringer, 1981).
Light within the canopy changes during the course of the day and shows patches of varying intensity. Thus, leaves are exposed to rapid changes in PFD of various duration and intensity, which cannot be determined analytically. Momentary efficiency of light-reactions of photosynthesis is mainly driven by these spatio-temporal fluctuations in PFD. In order to extract intrinsic parameters of the photosynthetic capacity of single species ΔF/Fm′ and ETR values were plotted over PFD. Light dependency data plotted in such way can be mathematically fitted in order to quantify the characteristic cardinal points of photosynthesis (Rascher et al., 2000).
To determine the cardinal points of light dependency curves, ETR vs. PFD data were fitted using single exponential functions:

where a and b are independent parameters.
From the results of Equation 3 the initial slope of ETR and the maximum electron transport rate (ETRmax) at saturating light intensity, were calculated (in the following fitted values ± SE are given). The parameters are tested statistically using the Wald Test, as follows:

where a1 and a2 are the parameters tested against each other and W has a standard normal distribution for high sample sizes (Rascher et al., 2000).
Instant light-response curves of ΔF/Fm′ were obtained using the light-curve program of the Mini-PAM, where actinic light intensity was increased during 4 min in eight steps following each other within 30 s. Light was provided by the internal halogen lamp of the instrument, using the fiber optics and the leaf clip holder. The measured light intensities were corrected as described in Rascher et al. (2000). The leaves measured in this way were dark adapted only for 30 s before the light-curve runs. Due to the short time of adaptation to the stepwise increased light intensities between the single measurements (30 s), possibly photosynthesis of the leaves was not in steady state. However, data from different species can be compared with each other and give insight into the fast adaptation of photosynthesis to increasing PFD (Rascher et al., 2000).
Results
Epiphyte Photosynthesis in the Field
Mode of photosynthesis
Carbon isotope ratios (δ13C) of all plants, except those of Aechmea melinonii, were below −27.9‰, showing that primarily carbon fixation was by ribulose-1,5-bisphosphate-carboxylase/oxygenase (Rubisco) and, thus, the species of this study were performing C3-photosynthesis. The CAM mode of photosynthesis, which was found to dominate among tropical epiphytes of dry sites in Trinidad (Griffiths and Smith, 1983) would have shifted the δ13C to less negative values. The less negative value of −15‰ of Aechmea melinonii indicates an almost exclusive primary carbon fixation via phosphoenolpyruvate-carboxylase and identifies A. melinonii as the only CAM plant in this study.
Integrated H2O-conductance and water use efficiency
Δ Values of the single species varied greatly, i.e., by about 4.5‰ between the lowest and highest value obtained by the epiphytes. This indicates a strong variability of histories of the intrinsic water use efficiency and the relative instantaneous water use efficiency between species as it can be assumed that vapor pressure deficits were similar for the different microsites (Table 1).
No correlations between Δ values, growth form, or position within the canopy were found.
Light response characteristics
In order to extract cardinal points of photosynthesis, which describe the intrinsic properties of the photosynthetic apparatus in the species studied, single measurements of effective quantum yield (ΔF/Fm′), electron transport rate (ETR), and non-photochemical energy dissipation (NPQ) of each species were plotted vs. PFD (Figures 4 and 5, see Rascher et al., 2000 for the fitting model). We used two approaches to record these light response characteristics: (i) we plotted all measurements, which were taken under ambient PFD (closed symbols in Figures 4 and 5) and (ii) we recorded instant light response curves with an adaptation time of 30 s to increasing light intensities (open symbols in Figures 4 and 5).
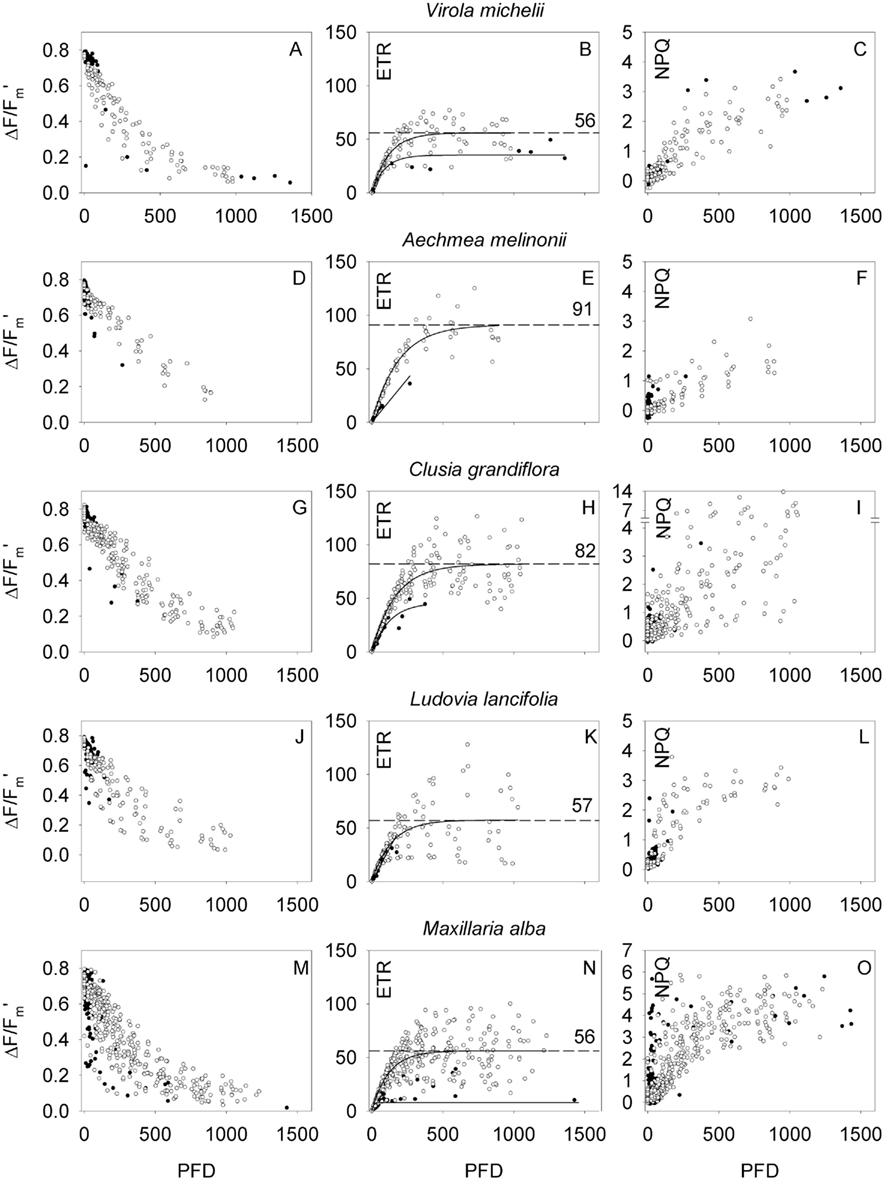
Figure 4. Light response characteristics expressed as effective quantum yield (ΔF/Fm′, left column), photosynthetic electron transport rate (ETR, middle column), and non-photochemical energy dissipation (NPQ, right column) in dependency of light intensity (PFD) of the host tree [Virola michelii (A–C)], the tank bromeliad Aechmea melinonii (D–F), the tall woody epiphyte Clusia grandiflora (G–I), the liana Ludovia lancifolia (J–L), and the small epiphytic orchid Maxillaria alba (M–O). Closed symbols refer to measurements under ambient PFD, while open symbols refer to instant light response curves with an adaptation time of 30 s. ETR values were fitted using a single exponential function, the resulting best fitted function is shown in the graphs (solid lines: ETRmax from ambient measurements, dashed lines, and numbers: ETRmax from instant light response curves; ETR is given in micromole electrons m−2 s−1).
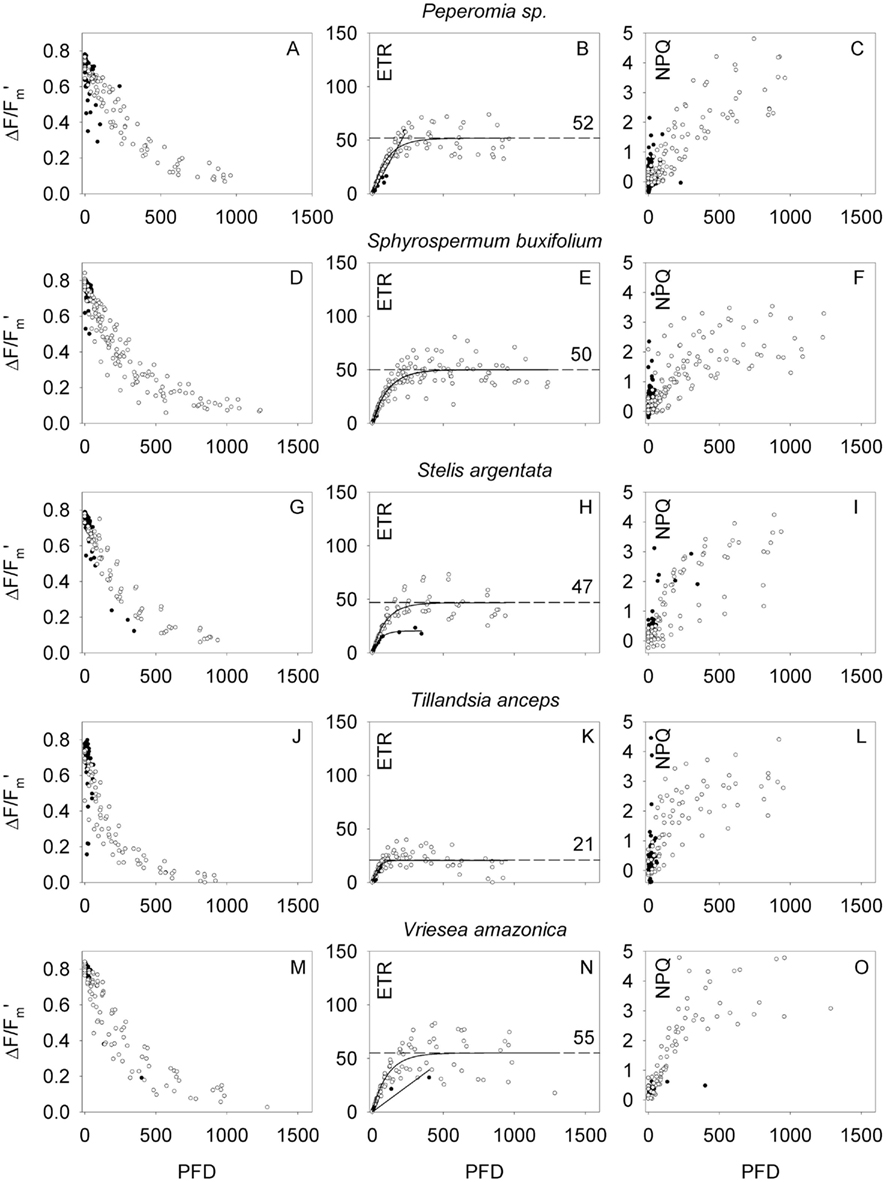
Figure 5. Light response characteristics expressed as effective quantum yield (ΔF/Fm′, left column), photosynthetic electron transport rate (ETR, middle column), and non-photochemical energy dissipation (NPQ, right column) in dependency of light intensity (PFD) of the small epiphyte Peperomia sp. (A–C), the small-leaves Ericacea Sphyrospermum buxifolium (D–F), the small epiphytic orchid Stelis argentata (G–I), the small non-tank bromeliad Tillandsia anceps (J–L), and medium size bromeliad Vriesea amazonica (M–O). Closed symbols refer to measurements under ambient PFD, while open symbols refer to instant light response curves with an adaptation time of 30 s. ETR values were fitted using a single exponential function, the resulting best fitted function is shown in the graphs (solid lines: ETRmax from ambient measurements, dashed lines, and numbers: ETRmax from instant light response curves; ETR is given in micromole electrons m−2 s−1).
In general, with increasing PFD ΔF/Fm′ declined, ETR increased to a maximum, and NPQ increased often without reaching saturation. Different species showed rather different light response characteristics. ΔF/Fm′ and ETR values, which were recorded during the instant light response curves, in general, were higher than steady state measurements (Figures 4 and 5). The host tree Virola michelii had a maximum ETR (ETRmax) of 56 ± 2 μmol m−2 s−1 and NPQ values reached about 3. The epiphytic Ludovia lancifolia showed quite similar light response characteristics even though NPQ increased faster at low light intensities (ETRmax = 57 ± 3 μmol m−2 s−1). A similar ETRmax (56 ± 1 μmol m−2 s−1) was also attained by the most abundant epiphyte orchid Maxillaria alba, although it reached higher NPQ values at higher PFD (maximum NPQ = 5.8), and the epiphytic bromeliad Vriesea amazonica also showed a very similar performance (ETRmax = 55 ± 2 μmol m−2 s−1, NPQ values up to ∼5). These species having ETRmax values between 55 and 60 μmol m−2 s−1 were followed by species with ETRmax close to 50 μmol m−2 s−1, i.e., Peperomia sp. (ETRmax = 52 ± 2 μmol m−2 s−1), Sphyrospermum buxifolium (ETRmax = 50 ± 2 μmol m−2 s−1), and Stelis argentata (ETRmax = 47 ± 2 μmol m−2 s−1), with NPQ values of 4–5 at high PFD. While the seven species discussed so far are still rather close to each other with respect to ETRmax and highest NPQ values at high PFD, Tillandsia anceps had considerably lower ETRmax (21 ± 2 μmol m−2 s−1, P < 0.001) but also NPQ values reaching 4–5.
At the other end of the scale the CAM bromeliad and epiphyte Aechmea melinonii and the woody C3 epiphyte Clusia grandiflora had the highest ETRmax (91 ± 3 and 82 ± 2 μmol m−2 s−1, respectively, P < 0.001). Maximum NPQ values were lower for Aechmea melinonii (up to three), while Clusia grandiflora reached the highest NPQ values measured during this study. For the CAM species cardinal points of light use characteristics may be dependent on the time of the day, when light dependency curves were measured. During phase III of CAM sensu Osmond (1978) nocturnal stored organic acid is remobilized and a high internal CO2 concentration is built up behind closed stomata. Thus non-photochemical energy dissipation, expressed as NPQ may be reduced, while photosynthetic electron transport remains unaffected. The δ13C value of –27.9‰ rated the Clusia grandiflora as a C3 species, which confirms earlier determinations of carbon isotope ratios (Lüttge, 1999). Thus, Clusia grandiflora may be indeed an obligate C3 species, however, in the genus Clusia there are many C3/CAM intermediate species, which often make only very limited use of their CAM option in the field so that this may not be reflected very much in δ13C values (Lüttge, 1999; Holtum et al., 2004). Additional measurements such as gas-exchange and diel organic acid fluctuations would be required to decide if Clusia grandiflora may have a CAM option. Such measurements are neither available from the present study nor from the literature. Hence, we may assume that Clusia grandiflora performed C3-photosynthesis, during which a high electron transport rate has to be accomplished by high NPQ values.
No relationships between different life forms or light response characteristics of the epiphytes and position within the canopy were noted.
Chronic and dynamic photoinhibition
Potential quantum yield of photosynthesis (Fv/Fm) of the host tree (Virola michelii) and 16 vascular epiphytes was measured on 2 days before sunrise (Table 2). The host tree and 14 epiphytes had mean Fv/Fm values at and above 0.80, indicating that light-reactions of photosynthesis generally were in a fully functioning state without signs of predawn, chronic photoinhibition. Only, Lepanthes helicocephala and Tillandsia anceps had Fv/Fm values below 0.8 in 6 of 6 and 10 of 11 measurements, respectively, which may be interpreted as a sign of chronic predawn photoinhibition. Additionally, in Aechmea melinonii (3/8), Anthurium trinerve (2/6), Maxillaria alba (16/27), Maxillaria violaceo-punctata (2/4), and Peperomia sp. (10/14) individual Fv/Fm values were below 0.8 (number of values below 0.8 in relation to total measurements are given in parenthesis). We interpret these repeated recordings of low Fv/Fm values within the same species as chronic photoinhibition of the individual plant or leaf measured specifically at this particular day. In general this species does not suffer from chronic photoinhibition and the low Fv/Fm values may be due to the fact that measurements may have been made outside the optimal seasonal conditions of the species. Moreover, this might be related to a variety of other reasons including lower inherent photosynthetic capacity or alternative dissipation mechanisms.
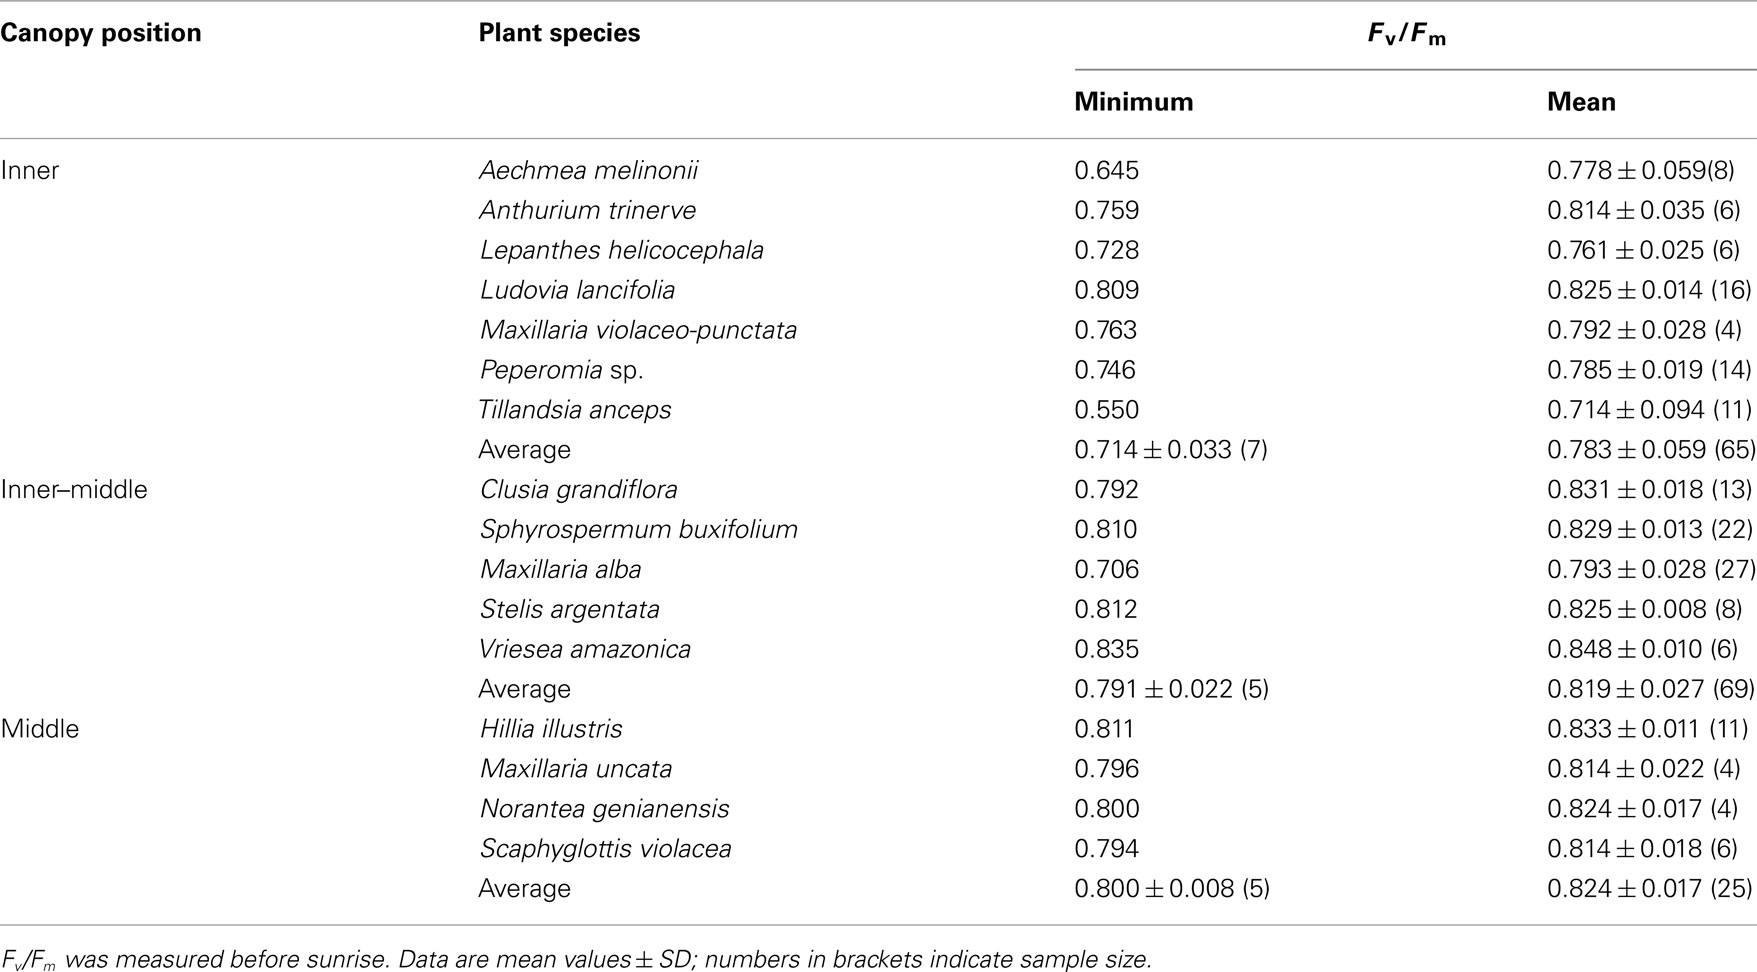
Table 2. Predawn values of potential quantum yield of the epiphytes grouped according to their position within the canopy of the host tree Virola michelii.
By grouping the species according to their distribution within the canopy it became clear that species growing in the inner canopy closest to the trunk had lowest predawn Fv/Fm values, while species, which were growing further in the periphery of the grown had higher Fv/Fm values (P < 0.001, Table 2).
In order to study the dynamic performance of potential quantum yield and possible recovery in more detail, we darkened single leaves during the course of the day for 30 min. For clarity we will denote these values as (Fv/Fm)30′ and we will interpret reduced (Fv/Fm)30′ values as signs of dynamic photoinhibition, i.e., a reduction of potential quantum efficiency, which cannot be restored to maximum during 30 min. All species studied with respect to (Fv/Fm)30′ were prone to dynamic photoinhibition and often values below 0.7 were obtained (Figure 6).
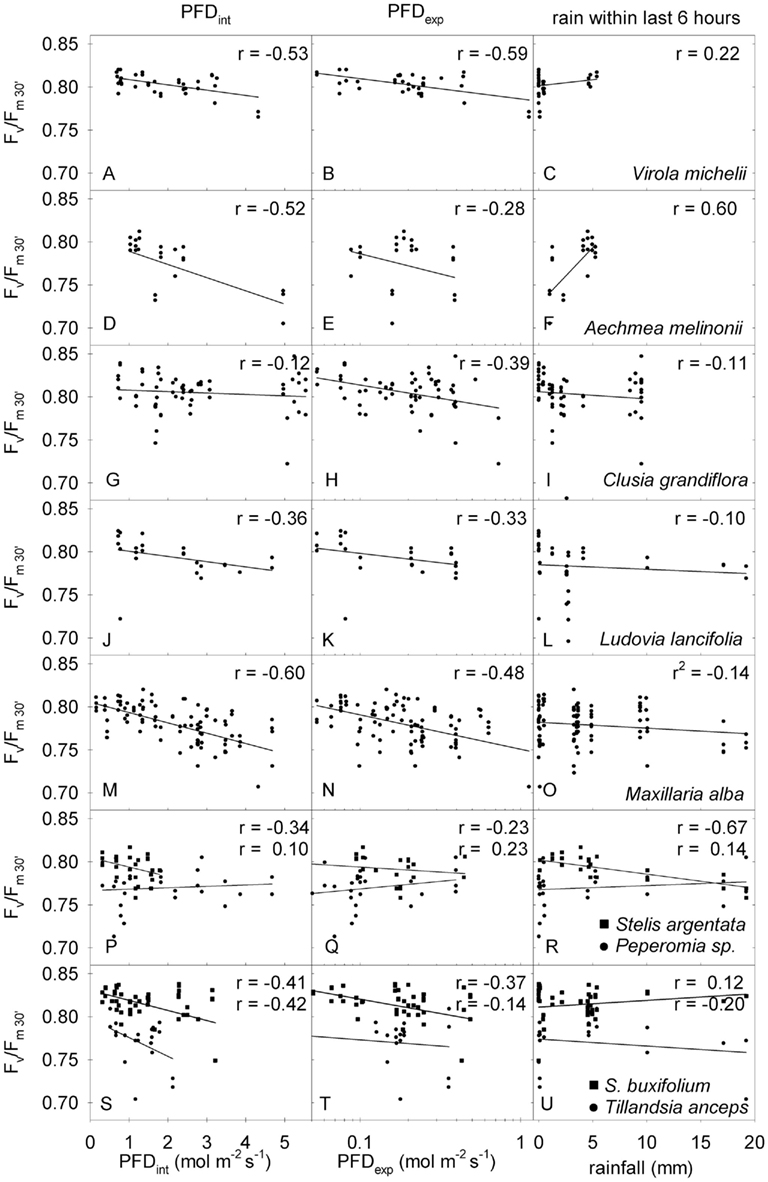
Figure 6. Correlation analyses between dynamically restored potential quantum yield after 30 min of dark adaptation (Fv/Fm30′) and integrated PFD perceived until the measurement (PFDint, left column), exponentially weighted PFD perceived during the last 3 h (PFDexp, middle column), and rain within the last 6 h (right column). Names of the plants are given in the panels; r is the correlation coefficient for the linear correlation. Where two values of r are given the upper one refers to the squares and the lower one to the circles.
However, no obvious correlations between (Fv/Fm)30′ and time of the day, position within the canopy, or momentary light intensity were found. We thus tested the correlation of (Fv/Fm)30′ with the dynamic changing environmental factors and plotted (Fv/Fm)30′ vs. the total PFD during this day (PFDint), the exponentially weighted PFD of the last 3 h (PFDexp), and the integrated rainfall of the last 6 h (Figure 6). For most plants (Fv/Fm)30′ was correlated with light absorbed. (Fv/Fm)30′ decreased with integrated or exponentially weighted PFD (Figure 6, left and middle column). The degree of correlation, which is expressed in the correlation coefficient (r), varied among the species.
Rainfall within the last 6 h before measurements (Figure 6, right column) only had a strong effect on Aechmea melinonii, where dynamic photoinhibition [(Fv/Fm)30′] was greatly prevented by increased water availability after rain (Figure 6F). This must be due to the fact that Aechmea melinonii was the only tank forming epiphyte allowing water storage. Tank bromeliads are known to be able to make use of short term precipitation for their photosynthetic performance (Lee et al., 1989). All the other species showed no correlation of (Fv/Fm)30′ with rainfall, and increased water availability after rain did not prevent photoinhibition caused by high PFD.
Discussion
Developing a novel field-proof set up of light sensors together with a dynamic weighting algorithm proved to be essential in our study to document that light intensities within a natural, tropical canopy do not follow simple gradients. Gradients within the canopy only describe the mean distribution but fail to characterize a specific microhabitat. Natural light conditions in the canopy were highly fluctuating and produced a spatio-temporal mosaic of ever changing light. As a consequence species distribution within the canopy could not simply be described by position within the canopy. However, species distribution was not random and one functional parameter (Fv/Fm) showed a correlation with general canopy position (Table 2). According to our knowledge this is one of the rare demonstrations that functional traits are correlated with microhabitats of plants.
We could further show that epiphytic plants within this fluctuating mosaic are adapted to these fast changes of environmental conditions. Dynamic photoinhibition was correlated with the light intensity that plant experienced in the previous few hours. This underlines the dynamic behavior of the photosynthetic machinery, which continuously adapts to the prevailing environmental constraints. It was proposed earlier that adaptation to rapidly changing environmental conditions is a major driving force for functional adaptation of plant metabolism (Rascher and Nedbal, 2006; Schurr et al., 2006).
We argue that these results will expand our (eco-)physiological knowledge on the acclimation of light-reactions of photosynthesis under natural and thus fluctuating conditions. Measurements under controlled conditions never reflect the highly variable, multifactorial environmental conditions, and stress given in wet-tropical forests, where stress is never imposed by one dominating environmental factor alone, but always by the combination of factors often showing considerable and unpredictable fluctuations (Lüttge, 2008, 2010a). One of these highly fluctuating factors is irradiance as documented for the canopy of the host tree Virola michelii, chosen for the present study (Figure 2). According to our knowledge this work was the first ecophysiological comparative investigation of as many as 16 epiphyte species in the field in the same canopy of a given tree.
There was only one CAM species (Aechmea melinonii) among the epiphytes studied here. In general, CAM is very abundant among vascular epiphytes, 57% of all species of which are known to be CAM species (Lüttge, 2004). Among other factors this may be particularly driven by the strong problem of water supply of epiphytes (Zotz and Hietz, 2001) as CAM is a water saving mode of photosynthesis. Thus, very moist tropical rainforests may be relatively poor in CAM epiphytes. In a lowland rainforest of Panama (Barro Colorado Island) as judged from carbon isotope ratios, about 25% of the vascular epiphytes were CAM species (Zotz and Ziegler, 1997). However, in the extremely wet cloud forest of Panama, Pierce et al. (2002) found that epiphytic CAM bromeliads of the genus Aechmea seem to possess a number of ecophysiological advantages over C3 bromeliads, because the expression of CAM phases allows more flexible timing of CO2-aquisition during the night than during the day, and hence, superior carbon budgets when leaves are frequently wetted. The occurrence of CAM taxa in wet forests led Pierce et al. (2002) to assume that the intrusion of Aechmea into the Panamanian cloud forest is a recent radiation of this photosynthetic pathway and occupation of new niches where the plasticity inherent in CAM (Lüttge, 2004, 2010b) is pre-adapting more xerophytic physiotypes to wetter habitats. On this background the fact that Aechmea was the only epiphytic CAM species in the lowland rainforest of French Guyana offers an interesting outlook.
The species selected for the presented measurements belong to different systematic taxa, represent different epiphytic life forms and vary somewhat in their position within in the canopy of the host tree. For most of the ecophysiological traits assessed, i.e., long term water use, light use in photosynthesis, and susceptibility to photoinhibition, we could observe no correlation with phylogeny of taxons, life forms and canopy site-occupation. Only susceptibility to photoinhibition was significantly increased in the inner canopy (Table 2). Moreover, we could clearly show that photosynthetic characteristics were greatly determined by the short term fluctuations and that light absorbed in a 30 min time window was the main driving factor for changes in functional photosynthetic parameters.
Conflict of Interest Statement
The authors declare that the research was conducted in the absence of any commercial or financial relationships that could be construed as a potential conflict of interest.
Acknowledgments
This work was supported by a grant of the German Academic Exchange Service (DAAD) to Uwe Rascher. We also like to thank Karl Schuller for developing and building the computer controlled light sensors for continuous recording of PFD. Uwe Rascher also thanks Katharina Etzold for help during the field studies in French Guyana and the Columbia University, New York, for providing the infrastructure for data analyses.
Abbreviations
CAM, crassulacean acid metabolism; ETR, apparent rate of photosynthetic electron transport of PS II; F, fluorescence yield of the light-adapted leaf; F0, fluorescence yield of the dark adapted leaf; Fm, maximum fluorescence yield of the dark adapted leaf; Fm′, maximum fluorescence yield of the light-adapted leaf; ΔF, variable fluorescence yield of the light-adapted leaf (ΔF = Fm′ − F); ΔF/Fm′, effective quantum yield of PS II; Fv, variable fluorescence yield of the dark adapted leaf (Fv = Fm − F0); Fv/Fm, potential quantum yield of PS II; (Fv/Fm)30′, potential quantum yield of PS II measured after 30 min of dark adaptation using the dark-leaf-clips; PFD, photosynthetically active photon flux density (λ = 380–710 nm); PS, photosystem.
References
Benzing, D. H. (1990). Vascular Epiphytes. General Biology and Related Biota. Cambridge: Cambridge University Press.
Benzing, D. H. (2000). Bromeliaceae: Profile of an Adaptive Radiation. Cambridge: Cambridge University Press.
Bilger, W., and Björkman, O. (1990). Role of the xanthophyll cycle in photoprotection elucidated by measurements of light-induced absorbance changes, fluorescence and photosynthesis in leaves of Hedera canariensis. Photosyn. Res. 25, 173–185.
Bilger, W., Schreiber, U., and Bock, M. (1995). Determination of the quantum efficiency of photosystem II and of non-photochemical quenching of chlorophyll fluorescence in the field. Oecologia 102, 425–432.
Doley, D., Yates, D. J., and Unwin, G. L. (1987). Photosynthesis in an Australian rainforest tree, Argyrodendron peralatum, during the rapid development and relief of water deficits in the dry season. Oecologia 74, 441–449.
Ehleringer, J. (1981). Leaf absorptances of Mohave and Sonoran desert plants. Oecologia 49, 366–370.
Freiberg, M. (1999). The vascular epiphytes on a Virola michelii tree (Myristicaceae) in French Guiana. Ecotropica 5, 75–81.
Freiberg, M. (2001). The influence of epiphyte cover on branch temperature in a tropical tree. Plant Ecol. 153, 241–250.
Genty, B., Briantais, J. M., and Baker, N. R. (1989). The relationship between the quantum yield of photosynthetic electron transport and quenching of chlorophyll fluorescence. Biochim. Biophys. Acta 990, 87–92.
Griffiths, H., and Smith, J. A. C. (1983). Photosynthetic pathways in the Bromeliaceae of Trinidad: relations between life forms, habitat preference and the occurence of CAM. Oecologia 60, 176–184.
Halle, F., Oldeman, R. A. A., and Tomlinson, P. B. (1978). Tropical Trees and Forests. Berlin: Springer-Verlag.
Holtum, J. A. M., Aranda, J., Virgo, A., Gehrig, H. H., and Winter, K. (2004). δ13C values and crassulacean acid metabolism in Clusia species from Panama. Trees Struct. Funct. 18, 658–668.
Holtum, J. A. M., and Winter, K. (2003). Photosynthetic CO2 uptake in seedlings of two tropical tree species exposed to oscillating elevated concentrations of CO2. Planta 218, 152–158.
Johansson, D. R. (1975). Ecology of epiphytic orchids in West African rain forests. Am. Orchid Soc. Bull. 44, 125–136.
Kress, W. J. (1989). “The systematic distribution of vascular epiphytes,” in Vascular Plants as Epiphytes, Vol. 76, Evolution and Ecology. Ecological Studies, ed. U. Lüttge (Berlin: Springer), 234–261.
Lakatos, M., Rascher, U., and Büdel, B. (2006). Functional characteristics of corticolous lichens in the understory of a tropical lowland rain forest. New Phytol. 172, 679–695.
Lee, H. S. J., Lüttge, U., Medina, E., Smith, J. A. C., Cram, W. J., Diaz, M., Griffiths, H., Popp, M., Schäfer, C., Stimmel, K. H., and Thonke, B. (1989). Ecophysiology of xerophytic and halophytic vegetation of a coastal alluvial plain in northern Venezuela. III. Bromelia humilis Jacq., a terrestrial CAM bromeliad. New Phytol. 111, 253–271.
Lüttge, U. (1999). One morphotype, three physiotypes: sympatric species of Clusia with obligate C3-photosynthesis, obligate CAM and C3-CAM intermediate behaviour. Plant Biol. 1, 138–148.
Lüttge, U. (2010a). Ability of crassulacean acid metabolism plants to overcome interacting stresses in tropical environments. AoB Plants plq005. doi:10.1093/aobpla/plq005
Lüttge, U. (2010b). Photorespiration in phase III of crassulacean acid metabolism: evolutionary and ecophysiological implications. Prog. Bot. 72, 371–384.
Lüttge, U., Ball, E., Kluge, M., and Ong, B. L. (1986). Photosynthetic light requirements of various tropical vascular epiphytes. Physiol. Vég. 24, 315–331.
van der Meer, P. J. (1995). Canopy Dynamics of a Tropical Rain Forest in French Guiana. Ph.D. thesis, Wageningen Agicultural University, Den Haag.
Osmond, C. B. (1978). Crassulacean acid metabolism: a curiosity in context. Annu. Rev. Plant Physiol. 29, 379–414.
Pearcy, R. W. (1990). Sunflecks and photosynthesis in plant canopies. Annu. Rev. Plant Physiol. Plant Mol. Biol. 41, 421–453.
Pierce, S., Winter, K., and Griffiths, H. (2002). The role of CAM in high rainfall cloud forests: an in situ comparison of photosynthetic pathways in Bromeliaceae. Plant Cell Environ. 25, 1181–1189.
Pittendrigh, C. S. (1948). The bromeliad-Anopheles-malaria complex in Trinidad. I. The bromeliad flora. Evolution 2, 58–89.
Pontailler, J.-Y. (1990). A cheap quantum sensor using a gallium arsenide photodiode. Funct. Ecol. 4, 591–596.
Rascher, U., Lakatos, M., Büdel, B., and Lüttge, U. (2003). Photosynthetic field capacity of cyanobacteria of a tropical inselberg of the Guiana Highlands. Eur. J. Phycol. 38, 247–256.
Rascher, U., Liebig, M., and Lüttge, U. (2000). Evaluation of instant light-response curves of chlorophyll-fluorescence parameters obtained with a portable chlorophyll fluorometer on site in the field. Plant Cell Environ. 23, 1397–1405.
Rascher, U., and Nedbal, L. (2006). Dynamics of plant photosynthesis under fluctuating natural conditions. Curr. Opin. Plant Biol. 9, 671–678.
Sarthou, C. (1992). Dynamique de la végétation pionnière sur un inselberg en Guyane française. Doctoral thesis, Université P.M. Curie, Paris VI, :253.
Schimper, A. F. W. (1888). Botanische Mitteilungen aus den Tropen. II. Epiphytische Vegetation Amerikas. Jena: Gustav Fischer.
Schreiber, U., and Bilger, W. (1993). Progress in chlorophyll fluorescence research: major developments during the past years in retrospect. Prog. Bot. 54, 151–172.
Schurr, U., Walter, A., and Rascher, U. (2006). Functional dynamics of plant growth and photosynthesis – from steady-state to dynamics – from homogeneity to heterogeneity. Plant Cell Environ. 29, 340–352.
Smith, J. A. C. (1989). “Epiphytic bromeliads” in Vascular Plants as Epiphytes, Vol. 76, Evolution and Ecology. Ecological Studies, ed. U. Lüttge (Berlin: Springer), 109–138.
Smith, J. A. C., Griffiths, H., and Lüttge, U. (1986). Comparative ecophysiology of CAM and C3 bromeliads. I. The ecology of the Bromeliaceae in Trinidad. Plant Cell Environ. 9, 359–376.
Zotz, G., and Hietz, P. (2001). The physiological ecology of vascular epiphytes: current knowledge, open questions. J. Exp. Bot. 52, 2067–2078.
Keywords: vascular epiphytes, chlorophyll a fluorescence, photosynthesis, light reaction, photoinhibition, CAM, Maxillaria, Ludovia
Citation: Rascher U, Freiberg M and Lüttge U (2012) Functional diversity of photosynthetic light use of 16 vascular epiphyte species under fluctuating irradiance in the canopy of a giant Virola michelii (Myristicaceae) tree in the tropical lowland forest of French Guyana. Front. Plant Sci. 2:117. doi: 10.3389/fpls.2011.00117
Received: 06 June 2011;
Paper pending published: 06 July 2011;
Accepted: 29 December 2011;
Published online: 13 January 2012.
Edited by:
José M. Grünzweig, The Hebrew University of Jerusalem, IsraelReviewed by:
Kadmiel Maseyk, Universite Pierre et Marie Curie, FranceTeng-Chiu Lin, National Taiwan Normal University, Taiwan
Jose Luis Andrade, Centro de Investigacion Cientifica de Yucatan, Mexico
Copyright: © 2012 Rascher, Freiberg and Lüttge. This is an open-access article distributed under the terms of the Creative Commons Attribution Non Commercial License, which permits non-commercial use, distribution, and reproduction in other forums, provided the original authors and source are credited.
*Correspondence: Uwe Rascher, Institute of Bio- and Geosciences, Forschungszentrum Jülich, Leo-Brandt-Str., 52425 Jülich, Germany. e-mail:dS5yYXNjaGVyQGZ6LWp1ZWxpY2guZGU=