

- Department of Botany and Plant Sciences, Center for Plant Cell Biology, University of California, Riverside, CA, USA
Light, a dynamic environmental parameter, is an essential regulator of plant growth and development. Light-regulated transcriptional networks are well documented, whereas light-regulated post-transcriptional regulation has received limited attention. In this study, dynamics in translation of cytosolic mRNAs were evaluated at the genome-level in Arabidopsis thaliana seedlings grown under a typical light/dark diurnal regime, shifted to darkness at midday, and then re-illuminated. One-hour of unanticipated darkness reduced levels of polysomes by 17% in a manner consistent with inhibition of initiation of translation. This down-regulation of translation was reversed within 10 min of re-illumination. Quantitative comparison of the total cellular population of transcripts (the transcriptome) to those associated with one or more 80S ribosome (the translatome) identified over 1600 mRNAs that were differentially translated in response to light availability. Unanticipated darkness limited both transcription and translation of mRNAs encoding components of the photosynthetic machinery. Many mRNAs encoding proteins associated with the energy demanding process of protein synthesis were stable but sequestered in the dark, in a rapidly reversible manner. A meta-analysis determined these same transcripts were similarly and coordinately regulated in response to changes in oxygen availability. The dark and hypoxia translationally repressed mRNAs lack highly supported candidate RNA-regulatory elements but are characterized by G + C-rich 5′-untranslated regions. We propose that modulation of translation of a subset of cellular mRNAs functions as an energy conservation mechanism.
Introduction
Light is an essential and variable environmental factor that impacts the morphogenesis and development of vascular plants. On a daily basis, fluctuations in the quantity and quality of illumination alter the plant’s energy and carbon resources. In the light, photosynthesis results in carbon fixation and starch accumulation that supports metabolic and growth activities in the dark. The alteration between light and darkness, circadian regulation, and the resultant fluctuation of sugars induces changes in the accumulation and stability of mRNA transcripts as shown for the model plant Arabidopsis thaliana (Blasing et al., 2005; Lidder et al., 2005; Usadel et al., 2008; Graf et al., 2010). Light-regulated mRNAs encode proteins involved in diverse cellular processes, including photosynthesis and energy management.
Photosynthetic organs respond to changes in light quantity and quality. For example, rapid light-fluctuations stimulate short-term responses (e.g., chlorophyll energy quenching) that are reversible within minutes (Kulheim et al., 2002; Allen, 2003), whereas progressive changes in light induce long-term responses such as changes in photosynthetic complex stoichiometry and light harvesting complex antenna size within thylakoid membranes (Brautigam et al., 2009). Such long-term responses to light quantity and quality are an acclimation strategy that optimizes light use efficiency and minimizes light damage under fluctuating light quality conditions (Dietzel and Pfannschmidt, 2008; Eberhard et al., 2008; Pesaresi et al., 2010).
Both nuclear and chloroplast genomes encode the components of chloroplast light harvesting and photosynthetic complexes. This necessitates coordinated regulation of gene transcription and protein production within the nucleus, cytoplasm, and the chloroplast. Chloroplast gene expression is modulated by the availability of light (Pogson et al., 2008) through regulation at levels including transcription, mRNA processing, stability, and translation (Stern et al., 2010). It has been shown that the stability and translation of chloroplast mRNA is orchestrated by RNA binding proteins (RBPs) that complex with 5′- or 3′-untranslated regions (UTRs; Bruick and Mayfield, 1999). The production of nuclear-encoded proteins of the photosynthetic machinery is also highly regulated by the quality and quantity of light, resulting in modulation of chromatin organization as well as the activity and stability of transcription factors (Hiratsuka and Chua, 1997; Ma et al., 2001; Rutitzky et al., 2009).
Despite detailed mechanistic knowledge of signal transduction pathways mediated by light that manifest transcriptional control, there is limited knowledge of the extent or mechanisms of post-transcriptional gene regulation in response to light availability. Several studies confirmed that light and circadian cycles impact the stability and translation of specific gene transcripts (Berry et al., 1986; Sullivan and Green, 1993; Petracek et al., 1997; Dickey et al., 1998; Gutierrez et al., 2002; Tang et al., 2003). Genes regulating the biological clock are post-transcriptionally regulated during the processes of splicing, polyadenylation, and transcript decay (Staiger and Koster, 2011). Moreover, a study by Piques et al. (2009) reported that light availability and the circadian clock affect the steady-state accumulation and ribosome-association of mRNAs encoding 35 enzymes of central metabolism in Arabidopsis, leading to the conclusion that the light-mediated energy balance contributes to post-transcriptional regulation. To date, there has not been a genome-level study of the translation of individual mRNAs in response to changes in light availability, such as an unanticipated shift to darkness followed by re-illumination.
It is well established that the abundance of a gene transcript is not necessarily correlated with its association with polyribosome (polysome) complexes and therefore presumed translation (Bailey-Serres et al., 2009). The extent to which an individual mRNA species is engaged in translation has been referred to as its translation state (Zong et al., 1999). The translation state of mRNAs can be measured by comparison of steady-state abundance to polysome association. In Arabidopsis, this has been accomplished by isolation of mRNA-ribosome complexes through differential centrifugation of detergent-treated cell-extracts (Kawaguchi et al., 2004; Kim et al., 2004, 2007; Branco-Price et al., 2005; Kawaguchi and Bailey-Serres, 2005; Nicolai et al., 2006; Matsuura et al., 2010; Sormani et al., 2011) or immunoprecipitation of polysome complexes from transgenic plants expressing a FLAG-tagged 60S ribosomal protein integrated into functional ribosomes (Zanetti et al., 2005; Branco-Price et al., 2008; Mustroph et al., 2009b; Jiao and Meyerowitz, 2010). These studies have shown that mRNA translation state is perturbed by a variety of sub-optimal environmental conditions including water-deficit, hypoxia, sucrose starvation, salt, high temperature, elevated cadmium, as well as mutation of genes encoding non-essential components of the translational machinery. Uniformly, environmental stimuli re-prioritize the selection of individual mRNAs for translation.
In this study, we examined global dynamics in mRNA translation state in Arabidopsis seedlings subjected to unanticipated changes in light availability. The quantitative evaluation of the total and immunopurified polysomal mRNA populations isolated from seedlings confirmed that unanticipated darkness transiently limits the translation of a sub-population of nuclear-encoded mRNAs in the absence of a concomitant effect on transcript abundance. We also performed a meta-analysis to compare changes in translation state following unanticipated darkness and reduced oxygen availability. This confirmed the presence of nucleotide bias in the 5′-UTRs of mRNAs with reduced translation state in response to distinct environmental cues.
Materials and Methods
Plant Material, Growth Conditions, and Treatments
Arabidopsis 35S:HF-RPL18 (Col-0 ecotype), expressing an amino-terminal His6-FLAG (HF)-tagged ribosomal protein L18B (RPL18, At3g05590) under the control of the near-constitutive Cauliflower Mosaic Virus (CaMV) 35S promoter, was used to enable the immunoprecipitation of polysomes (Zanetti et al., 2005). Seeds were surfaced sterilized in a 15-mL Falcon tube with 10 mL 95% (v/v) ethanol for 5 min, 10 mL 20% (v/v) household bleach plus 0.1% (v/v) Tween-20 for 5 min, rinsed three times with 10 mL sterile water, and stratified in 10 mL sterile water at 4°C for 48 h in darkness. Seeds were plated on sterile solid Murashige and Skoog (MS) medium containing 0.43% (w/v) MS salts (Caisson Laboratories, North Logan, UT, USA), 1% (w/v) Sucrose, 1% (w/v), Agar (pH 5.7), and vertically orientated in a growth chamber (model CU-36L5C8, Percival Scientific, Inc.) under a 16-h light (∼60 μE s-1 m-2) and 8 h dark cycle at 23°C.
At the middle of the day (Zeitgeber time 8, ZT8), 14-day-old seedlings were subjected to changes in light availability. For the unanticipated darkness treatment, plates were placed vertically in a plastic box that was completely wrapped in foil and kept in a growth chamber for 1 h. After 1 h, the foil was removed and plants were re-illuminated in the growth chamber for 10 min. For the light control, plates taken directly from the growth chamber were harvested at ZT9. Dark-treated seedlings were collected in the dark using a dim-green light (Corning glass filter No. 4010, Corning Life Science, Union City, CA, USA). Seedlings were quickly frozen in liquid nitrogen, ground to fine powder, and stored at −80°C.
Polysome Isolation and Quantitation
Polysomes were isolated and quantified by differential centrifugation as described previously (Mustroph et al., 2009a). Briefly, 5 mL of packed frozen tissue was thawed in 10 mL polysome extraction buffer [PEB: 200 mM Tris–HCl (pH 9.0), 200 mM KCl, 36 mM MgCl2, 25 mM EGTA, 5 mM DTT, 1 mM PMSF, 1% (v/v) Triton X-100, 1% (v/v) Brij-35, 1% (v/v) Tween-20, 1% (v/v) NP-40, 1% (v/v) Polyoxyethylene 10 tridecyl ether (PTE), 50 μg/mL cycloheximide, and 50 μg/mL chloramphenicol], transferred to a glass mortar, and homogenized with a glass teflon pestle. The crude cell-extract was clarified by centrifugation at 16,000 g for 20 min at 4°C. The supernatant was filtered though sterile Miracloth (Calbiochem, La Jolla, CA, USA), layered on top of an 8-mL 1.75 M sucrose cushion [400 mM Tris–HCl (pH 9.0), 200 mM KCl, 30 mM MgCl2, 1.75 M sucrose, 5 mM DTT, 50 μg/mL chloramphenicol, 50 μg/mL cycloheximide], and centrifuged at 135,000 g for 18 h at 4°C (70 Ti Rotor, Beckman, Brea, CA, USA) to obtain a crude ribosome pellet. The pellet was re-suspended in 250 μL polysome buffer [PB: 200 mM Tris–HCl (pH 9.0), 200 mM KCl, 36 mM MgCl2, 25 mM EGTA, 5 mM DTT, 50 μg/mL cycloheximide and 50 μg/mL chloramphenicol and 20 U/mL RNaseOUT (Invitrogen, Carlsbad, CA, USA)]. Approximately 2000 units (OD260) were layered on top of a 20–60% (w/v) sucrose gradient (Kawaguchi et al., 2004) and centrifuged at 275,000 g for 1.5 h at 4°C (SW55 Ti Rotor, Beckman), then passed through a UA-5 detector and 185 gradient fractionator (ISCO, Lincoln, NE, USA). Data were analyzed using the Icruncher 2.2 to determine the proportion of ribosomes in polysome complexes (polysome content; Williams et al., 2003). Quantitative polysome gradient fractionation was performed using three biological replicate samples.
Isolation of Polysomes from Crude Cell Lysates and mRNA Quantitation
Polysomes were extracted from 0.5 mL packed frozen tissue that was thawed in 1 mL PEB, homogenized, clarified, and filtered as described above for polysome isolation and quantitation. The clarified supernatant (500 μL) was layered on top of a 20–60% (w/v) sucrose gradient (Kawaguchi et al., 2004), centrifuged, and passed through a UA-5 detector and 185 gradient fractionator (ISCO, Lincoln, NE, USA) as described above. Twelve fractions of equal volume were collected and RNA extraction was performed by use of the TRIzol reagent (Invitrogen) according to the manufacturer’s protocol.
Transcript levels were evaluated by semi-quantitative reverse transcription-polymerase chain reaction (RT-PCR). For total RNA, polysomal RNA, and sucrose gradient fractioned RNA the complementary DNA (cDNA) synthesis was performed using 400 ng RNA in 20 μL reaction buffer {2.5 μM oligo-dT (Promega, Madison, WI, USA), 5× reaction buffer [250 mM Tris–HCl (pH 8.3), 250 mM KCl, 50 mM MgCl2, 2.5 mM spermidine, 50 mM DTT], 0.2 mM dNTP mix, 10 mM DTT, 40 U RNaseOUT (Invitrogen), 200 U Superscript II reverse-transcriptase (Invitrogen)} at 65°C for 5 min for oligo-dT annealing, 42°C for 50 min for reverse transcription and then at 70°C for 15 min for termination. PCR was performed in 20 μL reaction buffer [25 mM Tris–HCl (pH 8.3), 25 mM KCl, 2 mM MgCl2, 2.5 mM each oligonucleotide primer and 0.5 U Taq polymerase (Qiagen, Valencia, CA, USA)]. PCR amplification was carried out with denaturation at 95°C for 1 min, annealing at 50–55°C for 45 s and elongation at 72°C for 60 s for 20–30 cycles in a thermocycler (PTC-0200 DNA Engine, MJ Research Inc., Waltham, MA, USA). Table 1 lists the primers, annealing temperature and cycles of PCR amplification performed. An equal volume (20 μL) of each RT-PCR sample was mixed with 5 μL of 5× DNA gel loading dye [125 μL 2% (v/v) bromophenol blue in ddH2O, 125 μL of 2% (v/v) xylene cyanol in ddH2O, 25% (v/v) glycerol, 5% (v/v) 0.5 M EDTA] and analyzed on a 1.2% (w/v) agarose gel containing 0.01% (w/v) ethidium bromide with Tris–Acetate–EDTA buffer [40 mM Tris–HCL (pH 8.4), 20 mM acetic acid, 1 mM EDTA] and photograph under UV light.
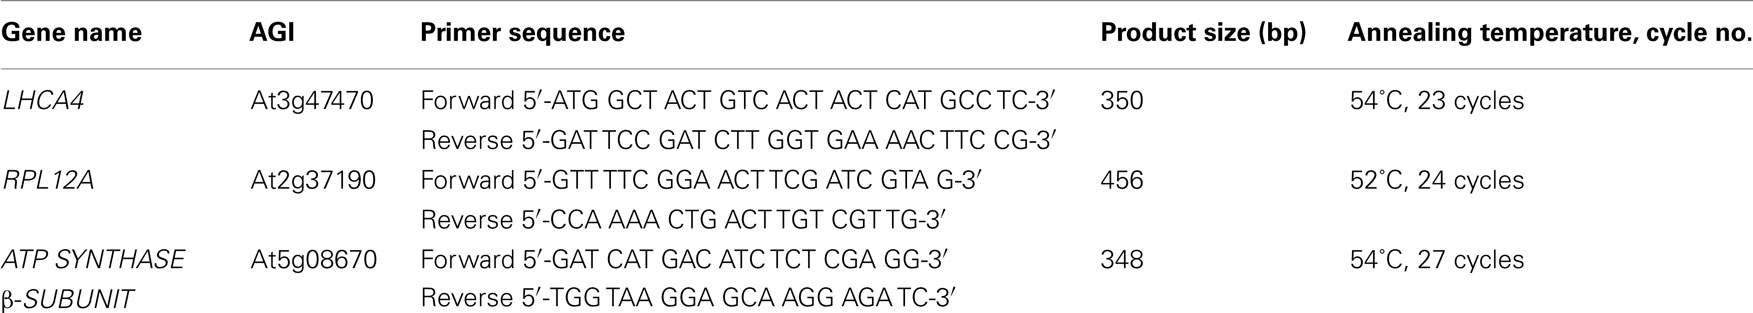
Table 1. Oligonucleotide primers and RT-PCR conditions.
Polysome Immunoprecipitation and RNA Extraction
Ribosome complexes were isolated by immunoprecipitation as described previously (Zanetti et al., 2005; Mustroph et al., 2009a). Briefly, 7.5 mL of frozen packed tissue was thawed in 15 mL of PEB, homogenized, and centrifuged at 16,000 g for 20 min at 4°C to obtain a clarified supernatant. This supernatant was passed through Miracloth and 13 mL were combined with 400 μL EZ view Red Anti-FLAG affinity beads (Sigma, St. Louis, MO, USA) that had been pre-washed twice with 6 mL PB. The mixture was incubated at 4°C for 2 h with gentle shaking. The unbound fraction was removed by centrifugation in a clinical centrifuge at 700 g for 2 min and beads were washed four times with 6 mL PB for 5 min at 4°C with gentle shaking. The elution was performed by incubation of beads with 600 μL PB containing 200 ng/μL 3× FLAG peptide (Sigma) for 30 min at 4°C.
Total RNA was extracted from 1 mL of the clarified extract supernatant and polysomal mRNA was isolated from the eluate after FLAG protein addition by use of TRIzol (Invitrogen) according to the manufacture’s recommendations. RNA was further purified by use of the RNaeasy Plant Mini Kit (Qiagen) according to the manufacturer’s protocol. RNA concentration and quality were evaluated by monitoring absorbance at 260 and 280 nm use of a spectrophotometer (ND-1000, Nanodrop, Wilmington, DE, USA). The RNA integrity was examined with an Agilent Bioanalyzer 2100 on RNA 6000 Nano LabChip (Agilent Technologies, Santa Clara, CA, USA).
Microarray Hybridization and Data Analysis
Total mRNA and immunopurified polysomal mRNA were analyzed by hybridization to ATH1 GeneChip (Affymetrix, Santa Clara, CA, USA) DNA microarrays at the Genomic Core Facility, Institute for Integrative Genome Biology, University of California, Riverside, CA, USA. cRNA synthesis and hybridization was conducted with 1.5 μg RNA using One-Cycle cDNA synthesis Kit (Affymetrix, Santa Clara, CA, USA). Biotin-labeled cRNA was synthesized by use of the GeneChip IVT Labeling Kit (Affymetrix). Hybridizations were performed at 45°C for 16 h, in a rotating platform with 10 μg of biotin-labeled cRNA. Two independently generated sets of biological samples were evaluated. Raw expression data obtained in .cel files was extracted by use of the Bioconductor package of the R statistical environment and language. Low-level normalization followed using MAS 5.0 (MAS5; Affymetrix) and included probe-specific and multi-chip background corrections. The microarray datasets were clustered by use of a bootstrapped hierarchical cluster analysis (nboot = 1000; p-value <0.05) with the normalized signal values. Present, Marginal, or Absent (P/M/A) calls, describing signals for probe pair sets that were above or below the background default threshold, were obtained with the MAS5 platform.
To quantify the amount of individual mRNAs in polysomes, the Robust Multi-chip Average (RMA) data values from the polysomal RNA hybridizations were further adjusted based on the relative polysome content, as described previously (Kawaguchi et al., 2004; Branco-Price et al., 2005, 2008). Briefly, the normalization factor was generated from quantitative measurements of polysome content in tissue from each treatment sample by use of sucrose density gradient absorbance profiles of three biological replicates. In each case, the relative proportion of RNA in polysomes was determined from the integrated area of the polysome peak region divided by that of the complete gradient profile (total RNA content; A254 units in polysomes/A254 = relative polysome level). Signal values for polysomal RNA were obtained by multiplication of the MAS5 value by the relative polysome content (light = 0.729, early darkness = 0.603 and re-illumination = 0.738). These polysome content normalized values were used to calculate signal log2 ratio (SLR) values. Three comparisons were made for both total and polysomal mRNA in the light availability experiment: Dark/Light (L → D), Re-illumination/Dark (D → R), and Re-illumination/Light (R versus L), yielding a total of six comparisons. False discovery rates (FDR) for significant differences between mRNA in the samples compared were generated using p-value distributions (Smyth, 2004). Normalized SLR data of probe pair sets (genes) that had at least one P or M call in both bioreplicate samples across all comparisons based on MAS5 and with a FDR <0.05 were used as the data set for the cluster and gene category analyses (n = 2508, 1224 of which had a |SLR| ≥ 1 in at least one comparison). The analysis of genes regulated by light availability reported here is described following MIAME guidelines and the microarray data deposited in the NCBI GEO database under the accession number GSE34231.
For meta-analysis of genes regulated by light and oxygen availability data from GEO accession GSE9719 (Branco-Price et al., 2008) were processed exactly as described above, including the normalization step that takes into consideration differences in polysome content. SLR values were calculated by use of RMA for seven comparisons of total and polysomal mRNA: Dark/Light (L → D), Re-illumination/Dark (D → R), and Re-illumination/Light (R versus L), 2 h hypoxia/2 h non-stress [NS → HS (2 h)], 9 h hypoxia/9 h non-stress [NS → HS (9 h)], 1R recovery from 9 h hypoxia/9 h hypoxia [HS → R (air)], and 1R recovery from 9 h hypoxia/9 h non-stress (R versus HS), yielding a total of 14 comparisons. FDRs were calculated as described above. Normalized SLR data of probe pair sets (genes) that had at least one P or M call in the duplicate (light availability) or triplicate (oxygen availability) samples based on MAS5 and with a FDR < 0.01 were used as the data set for the cluster and gene category analyses (n = 8554, 5024 of which had a |SLR| ≥ 1 in at least one comparison).
Identification of Co-Regulated Genes by Clustering and Their Ontology
Co-regulated genes were recognized by use of fuzzy k-means clustering using Euclidean correlation for the distance measure, a membership exponent of 1.1, maximal number of iterations of 5000 and an experimentally determined number of clusters (Mustroph et al., 2009b). Cluster membership was analyzed for gene ontology (GO) category enrichment analysis by use of the GOHyperGall function (Horan et al., 2008). GO annotations were obtained from http://geneontology.org/ (TAIR, 11/25/2011 release). The annotation of photosynthesis and ribosomal proteins categories were obtained from TAIR (ATH_GO_GOSLIM, date 11/21/2011).
Sequence Motif and Sequence Determinant Analyses
The 5′-UTR, coding sequence (CDS) and 3′-UTR of annotated genes represented on the ATH1 GeneChip were extracted from http://www.arabidopsis.org (TAIR 10: 11/10/2010 release). If a gene had multiple isoforms (AGI identifiers) with different 5′- or 3′-UTRs, only the TAIR10 representative gene model/splice form was used. The mono- and di-nucleotide content of each 5′-UTR was determined using Excel. Over-represented motifs were identified by use of the MEME suite (Multiple EM for Motif Elicitation; Bailey et al., 2009) using the two-component mixture (TCM) model with minimum and maximum widths set at 6 and 50 bases, respectively. The motif consensuses derived from MEME were represented graphically using the WebLogo application (Crooks et al., 2004). The over-represented motifs derived from MEME were used to search against sequence databases for motif occurrences by find individual motif occurrences (FIMO) with significant p-value <1E−04 (Bailey et al., 2009). Motif discovery rates (MDR) were calculated by use of equations:
Results
Light Availability Mediates Dynamic Regulation of Polysome Abundance
To ascertain whether translation is dynamically regulated by light availability, Arabidopsis seedlings were subjected to an unanticipated period of darkness at midday of a typical light/dark diurnal cycle to darkness for 1 h (ZT8 to ZT9 in dark, Dark) and then re-illuminated for 10 min (Re-illumination; Figure 1). Control samples were harvested at ZT9 (Light). In the dark-shifted seedlings, a decrease in polysome levels was accompanied by an increase in 80S monoribosomes (monosomes) and ribosomal subunits (Figure 2A), characteristic of a reduction in initiation of translation. After 10 min of re-illumination, monosomes decreased and polysome levels were restored. Quantitative analysis confirmed that the amount of RNA in polysome complexes of light, dark-shifted, and re-illuminated seedlings was 72.88 ± 0.55, 60.31 ± 1.02, and 73.80 ± 0.90%, respectively (n = 3 independent experiments). This indicates that seedlings grown under these conditions engage ∼75% of their ribosomes in polysome complexes, of which most are presumed to be engaged in active translation. The consequence of unanticipated darkness was a 17.25 ± 1.67% decline in polysome complexes, which was rapidly restored within 10 min of re-illumination (Figure 2B). The extent of reduction in polysomes was similar to the 15% decline observed following moderate water-deficit stress of rosettes (Kawaguchi et al., 2004), but considerably less than the 46% drop after 2 h of severe hypoxia of seedlings (Branco-Price et al., 2008) and 50% decline in large polysomes (≥5 ribosomes) in rosettes at the end of night as compared to 2 h after dawn (Piques et al., 2009). These data indicate that unanticipated darkness transiently reduces protein synthesis in a manner consistent with inhibition of the initiation phase of translation.
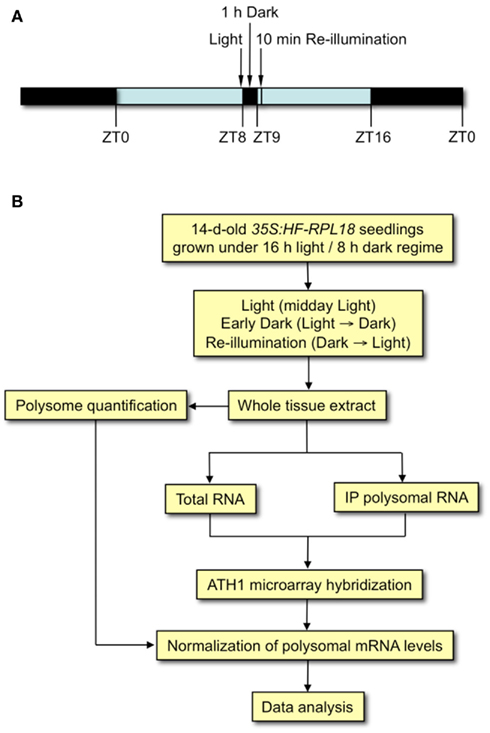
Figure 1. Quantitative analysis of the molecular response to the shift to early darkness and re-illumination in Arabidopsis (Col-0) seedlings. (A) Experimental scheme of the light cycle used for seedling growth for 14 days on MS medium supplemented with 1% (w/v) sucrose. Arrows indicate time of day relative to the beginning of the light period (ZT0). Light (control) seedlings were harvested in the light at ZT9, Early Dark seedlings were transferred to darkness at ZT8 for 1 h and harvested, and Re-illumination seedlings were transferred to darkness at ZT8 for 1 h and then re-illuminated for 10 min before harvest. (B) Flow diagram of experimental strategy for quantitative assessment of transcript abundance in the total mRNA and immunopurified polysomal mRNA populations.
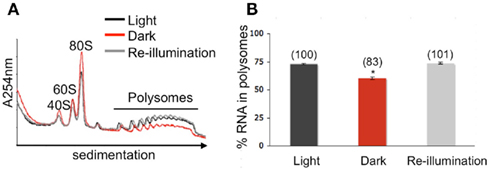
Figure 2. Reversible global adjustment of protein synthesis in response to altered light availability. (A) Quantitative sucrose density gradient analysis of ribosomal subunit and polysome complex levels. Whole seedlings were pulverized under liquid nitrogen, hydrated in a membrane-disrupting and ribosome-stabilizing buffer, and centrifuged to obtain a ribosome pellet. The ribonucleoprotein complexes were re-suspended and separated by centrifugation through 20–60% sucrose density gradients. Absorbance profiles at 254 nm were recorded. The ribosomal subunit and polysome peak areas were quantified after adjustment of the absorbance profiles to equivalent total optical density units per gradient. Line traces show representative absorbance profiles of fractionated ribosomes of seedlings shifted to darkness for 1 h (red), re-illuminated for 10 min (gray), and maintained in the light (black). (B) Mean (in percent) cellular RNA content in polysome complexes, calculated from three independent biological replicate experiments. Error bars represent SD and an asterisk indicates a significant difference from the seedlings maintained in the light, as determined by Student’s t-test (p < 0.05). Numbers in brackets above each bar are the percent polysome content compared light.
Light Availability Mediates Rapid Changes in Translation Status of Individual mRNAs
To compare the effect of changes in light availability on the accumulation and translational status of individual mRNAs, we quantitatively profiled the total (transcriptome) and polysomal (translatome) mRNA populations from light, dark-shifted, and re-illuminated seedlings using the Affymetrix ATH1 microarray platform. To obtain polysomal mRNAs, we utilized the 35S:HF-RPL18 line implemented previously to immunopurify ribosome complexes (60S subunits, 80S monosomes, and polysomes; Zanetti et al., 2005; Branco-Price et al., 2008; Mustroph et al., 2009b). Of the 14,362 probe sets (genes) with signal levels above the limit of detection in at least one of the samples, 2508 displayed a significant change in transcript abundance in one or more of six signal log2 ratio (SLR) comparisons (FDR <0.05; Table S1A in Supplementary Material) and were considered differentially expressed genes (DEGs). Of these, 1224 also showed a twofold increase or decrease in abundance in one or more of the six mRNA populations (|SLR| ≥ 1). The hybridization signal values were highly correlated between biological replicate samples (R2 values ranged from 0.96 to 0.98), confirming the reproducibility of the biological response and polysomal mRNA immunopurification method.
For an initial global view, we compared the SLR of the 2508 DEGs in the total and polysomal mRNA populations (Figure 3). In this analysis, the genes that plotted above or below the solid diagonal line were positively or negatively regulated at the level of translation, respectively. In the dark-shifted seedlings (Light → Dark), darkness affected the mRNA levels in both the total and polysomal mRNA populations but to different extents (R2 = 0.664; Figure 3A). We also used Venn diagrams to compare DEGs (Figure 4). Following the shift to darkness, 61 mRNAs were reduced in the total mRNA population, whereas 10-fold more (n = 647) were reduced in the polysomal mRNA population (Figure 4, Light → Dark panel). This indicates that expression of a cohort of mRNAs was down-regulated by the shift to darkness through restriction in translational initiation, as evidenced by their decline in association with polysomes. On the other hand, 60% of the mRNAs that increased at the steady-state level by darkness also increased in polysomes, confirming that their up-regulation was accompanied by engagement in translation.
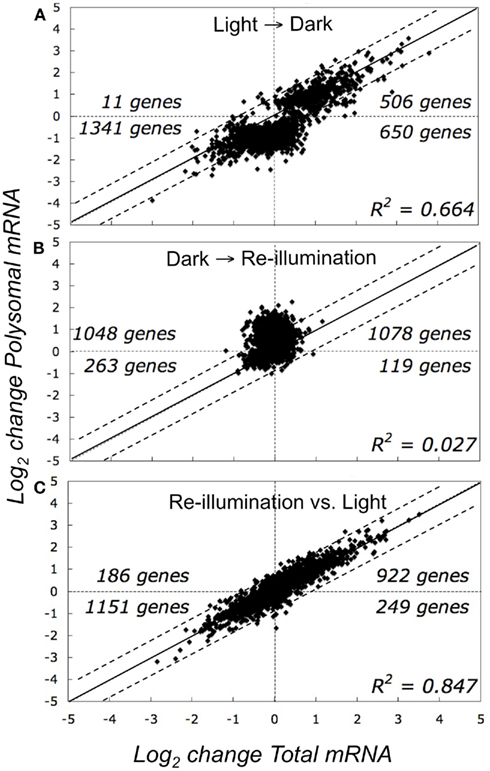
Figure 3. Comparison of abundance of total and polysomal mRNA in seedlings in the light, following transfer to early darkness, and after brief re-illumination. Graphs represent the change in total steady-state mRNA abundance (x-axis, transcriptome) versus change in immunopurified polysomal mRNA (y-axis, translatome) (A) Comparison of seedlings in light to those shifted to darkness (Light → Dark). (B) Comparison of re-illuminated seedlings to those shifted to darkness (Dark → Re-illumination). (C) Comparison of re-illuminated seedlings versus those in light. Each point on the graphs represents the mean log2-transformed signal log2 ratio (SLR) value for an individual gene by comparison of two different treatments (e.g., SLR = log2 signal Treatment A gene i −log2 signal Treatment B gene i), using genes without all “absent” calls in the bioreplicates and FDR <0.05 (n = 2508 probe pair sets).
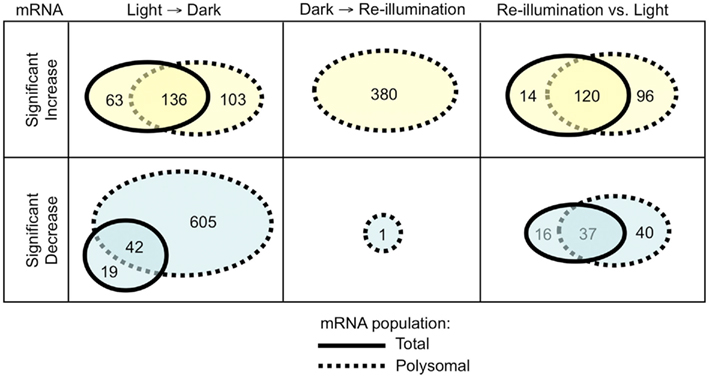
Figure 4. Comparison of changes in mRNA abundance in the transcriptome and translatome. Venn diagrams indicate the number of genes in the total and immunopurified polysomal mRNAs that displayed a significant increase or decrease in abundance following the shift to early darkness or re-illumination. mRNAs analyzed included those without all “absent” calls in the bioreplicates and with a significant increase or decrease in abundance in total or polysomal mRNA (|SLR| ≥ 1; FDR <0.05; n = 1224 probe pair sets). Dark/Light (L → D), Re-illumination/Dark (D → R), and Re-illumination/Light (R versus L).
In contrast to the shift to darkness, there was little correlation between adjustments in the transcriptome versus the translatome in response to re-illumination (R2 = 0.027; Figure 3B; Dark → Re-illumination). The large number of genes that plotted above the diagonal line reflects an increase in translation upon re-illumination relative to darkness. In fact, 10 min re-exposure to light did not significantly alter the steady-state abundance of any individual mRNA species (|SLR| ≥ 1; FDR <0.05), but significantly elevated the translation of 380 mRNAs, of which 179 were reduced in translation in the Light → Dark comparison (Figure 4; Table S1A in Supplementary Material). The comparison between the total and polysomal mRNA populations of the Light and Re-illuminated seedlings samples confirmed these populations were highly similar (R2 = 0.847; Figure 3C), indicating that abundance and translation status of most mRNAs was similar prior the shift to darkness and after brief re-illumination. Together, these results demonstrate that the translation state of individual mRNAs is dynamically regulated by early darkness and re-illumination.
Validation of Light-Regulated Translation of Representative Transcripts
For a limited verification of the microarray results, semi-quantitative reverse-transcriptase polymerase chain reaction (RT-PCR) was used to quantify three representative transcripts in the six different mRNA population samples. The selected mRNAs included two with reduced polysome association in response to early darkness [LIGHT HARVESTING COMPLEX A4 (LHCA4) and RIBOSOMAL PROTEIN LARGE SUBUNIT 12A (RPL12A)] and one with limited change in polysome association [mitochondrial ATP SYNTHASE β-SUBUNIT (β-ATP); Figures 5A,B]. The analysis confirmed that levels of LHCA4 and RPL12A but not β-ATP displayed a dark-induced decline in the polysomal mRNA population that was largely reversed after the brief re-illumination. To further examine the dynamics in polysome association of these transcripts in response to light availability, the detergent-solubilized cell-extracts were centrifuged through a 20–60% (w/v) sucrose gradient, collected in 12 gradient fractions and the mRNA in these fractions were monitored (Figure 5C). LHCA4 and RPL12A mRNAs were well loaded on large polysomes (≥5 ribosomes; gradient fractions 9–12) in the Light and Re-illuminated seedling samples. Whereas, in seedlings shifted to early darkness, these mRNAs accumulated to a greater extent in the free mRNA, monosome, and small polysome fractions (gradient fractions 1–5). Because steady-state transcript abundance was not decreased in response to darkness (Figures 5A,B), these results suggest that LHCA4 and RPL12A mRNAs tend to be sequestered during darkness and remobilized onto polysomes by re-illumination. By contrast, the β-ATP mRNAs remained stable and polysome-associated in light, early darkness, and upon re-illumination. These data provide further support of altered translation status of a sub-population of cellular mRNAs following a change in light availability.
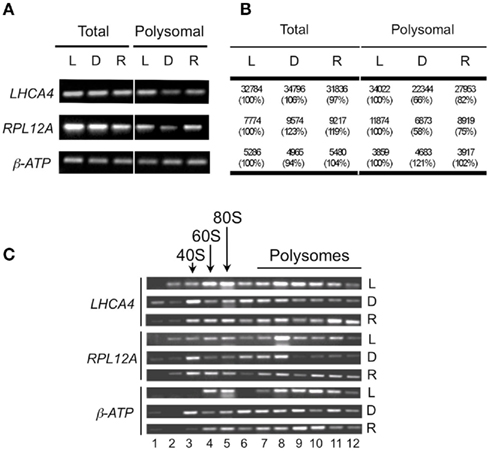
Figure 5. Validation of microarray data for selected mRNAs. (A) Monitoring of total and immunopurified polysomal mRNA levels by semi-quantitative reverse-transcriptase PCR of light (L), dark (D), and re-illuminated (R) seedlings. (B) Means of microarray signal values from total and immunopurified polysomal mRNA from light (L), dark (D), and re-illuminated (R) seedlings. Numbers in brackets are percentage compared to those of light. (C) mRNAs obtained from sucrose density gradient fractionated polysomes evaluated by semi-quantitative reverse-transcriptase PCR with selected specific primer pairs using tissue from light (L), dark (D), and re-illuminated (R) seedlings. LHCA4, LIGHT HARVESTING COMPLEX A4; RPL12, RIBOSOMAL PROTEIN 12A; β-ATP (mitochondrial ATP synthase β-subunit).
Light Availability Mediates Rapid Changes in Translation Status of Cohorts of mRNAs
To further evaluate the response to light availability, we considered the biological role of DEGs that were co-regulated at the level of transcript accumulation and translation in response to early darkness and re-illumination. As before (Figures 2 and 3), three SLR comparisons were made to evaluate changes in the transcriptome and translatome in response to the three treatments. Co-regulated genes were recognized by use of fuzzy k-means clustering, which sorted the DEGs into 10 groups (gene clusters; k = 10; n = 2508 DEGs; Figure 6A; Table S1A in Supplementary Material). The heatmap display of the median log2 SLR of each cluster further resolved three groups comprising two to five gene clusters. Group 1 mRNAs were up-regulated at the transcriptional and translational level by unanticipated darkness (n = 492 mRNAs; Clusters 1–3). The abundance and translation of these mRNAs was not dramatically affected by brief re-illumination. Group 2 mRNAs showed a proportional decline in abundance and translation in response to early darkness (n = 403 mRNAs; Clusters 4–5). Of these, Cluster 4 mRNAs were slightly more elevated at the level of polysome association in response to re-illumination than Cluster 5 mRNAs. Group 3 mRNAs include those maintained at similar steady-state levels in the light, following the shift to darkness and upon re-illumination (n = 1613 mRNAs; Clusters 6–10). Notably, these mRNAs moved off of polysomes upon the shift to darkness and were re-recruited to polysomes upon re-illumination, with the exception of Cluster 10 mRNAs, which increased in the translatome upon re-illumination. These results further demonstrate that light availability influences mRNA abundance and translation status.
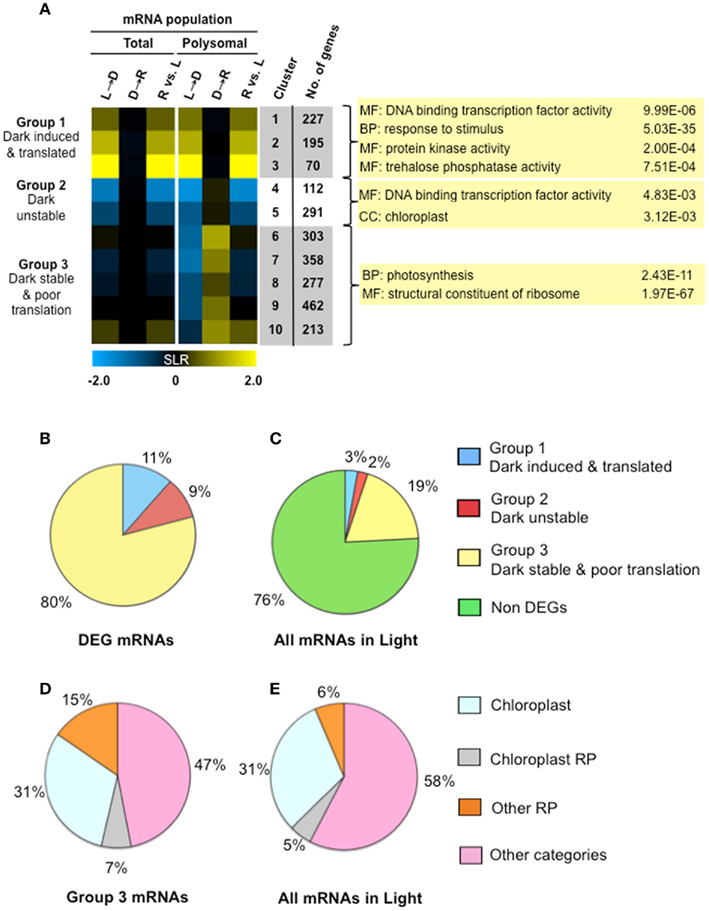
Figure 6. Light availability alters both transcript accumulation and translational status as a mechanism of energy conservation. (A) Fuzzy k-mean clustering analysis performed on six mean signal log ratio (SLR) comparisons of total and immunopurified polysomal mRNA transcript abundance. Genes included in the analysis were those without all “absent” calls and significantly different in abundance (FDR <0.05; n = 2508 probe pair sets). The comparisons and genes evaluated are the same as those represented in Figure 3 (Table S1A in Supplementary Material). The heatmap shows median SLR values for each of 10 clusters of mRNAs that displayed similar responses to light availability based on the total and polysomal mRNA populations; color indicates increase (yellow), decrease (blue) or no-change (black) in mRNA abundance. Columns indicate cluster ID, number of genes (No. genes). Selected gene ontology (GO) categories (p-values calculated by GOHyperGAll) from three groups of coordinately regulated genes are shown. Pie charts in (B,C) represent the percentage of total cellular mRNAs in seedlings in the light, as determined from average signal values. (B) The proportion of total cellular mRNA of contrastingly regulated gene clusters; differential expressed gene (DEG) mRNAs in groups shown in (A). (C) Proportion of total cellular mRNA of the three groups of DEGs represented in (A). (D) Percentage of cellular mRNA content in Clusters 6–10 (19% of the total cellular mRNA in the light) that encodes genes annotated as chloroplast localized, chloroplast ribosomal protein (RP), cytosolic, or mitochondrial ribosomal protein (Other RP) or some other category of molecular function or location. (E) Proportion of total cellular mRNA of the four classes of genes evaluated in (D).
Gene ontology (GO) analysis was performed with the genes of the 10 k-means clusters (Table S1B in Supplementary Material) and three groups (Table S1C in Supplementary Material). Co-regulation of genes with similar metabolic function and biological process were observed. For example, the dark-induced and well-translated mRNAs (Group 1) were enriched for metabolic functions including trehalose phosphate synthase (UDP forming) activity (6.13E−05), trehalose phosphatase activity (7.51E−04), kinase activity (2.00E−04), and transcription factor activity (9.99E−06). Transcripts that were dark-unstable and re-illumination-induced as well as translationally repressed by darkness until re-illumination (Group 2) were enriched for transcriptional factor activity (4.83E−03) and the chloroplast (3.12E−09). A survey of all transcription factors in the DEG set confirmed that these were regulated at both steady-state and translational levels (Figure 7A). The mRNAs that were stable in the dark but translationally repressed (Group 3) were highly enriched for proteins involved in translation [ribosomal proteins (1.97E−67), ribosome biogenesis (2.41E−22), translation (1.46E−17)] as well as photosynthesis (2.43E−11; Figure 6A). mRNAs in these categories showed a general simultaneous regulation at the level of accumulation and translation in response to changes in light availability (Figure 7B).
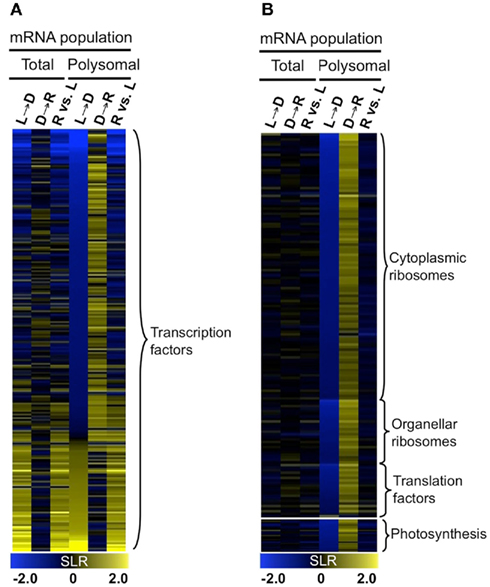
Figure 7. Dynamics of transcript accumulation and translational status of mRNAs encoding proteins for transcription factors, translation machinery, and photosynthesis. (A) Heatmap of mRNA encoding transcription factors. Colors indicate increase (yellow), decrease (blue), or no-change (black) in mRNA abundance. (B) Heatmap of mRNA encoding components of cytosolic and organellar ribosomes, translation factors, and photosynthesis. Gene lists for (A,B) are provided in Table S1D in Supplementary Material.
By quantitation of the hybridization signal values for individual gene transcripts versus the hybridization signal value of all mRNAs present in the light, we determined that Group 3 mRNAs comprised 80% of the DEG transcripts and 19% of all mRNAs (Figures 6B,C). The Group 1 and 2 mRNAs comprised 11 and 9% of the DEG mRNA signal value, respectively, but did not represent a sizable portion of the total mRNA in the light (5%; Figure 6C). The finding that early darkness down-regulated translation of ∼19% of all gene transcripts is consistent with the finding that polysome levels declined by 17% in response to early darkness (Figure 2B). Group 3 mRNAs (reduced in translation status but not abundance by early darkness) were enriched in chloroplast proteins and structural components of the ribosome. These latter categories comprised 53% of the DEG signal value (Figure 6D). Remarkably, these categories of mRNAs represented 42% of all transcripts present in light grown seedlings (Figure 6E). Thus, mRNAs encoding both regulatory factors and abundant structural proteins are targets of translational control in response to unanticipated darkness.
Over-Represented Sequence Motifs in Untranslated Regions of Regulated mRNAs
We sought RNA-regulatory elements that are over-represented in the 5′- and 3′-UTRs of mRNAs with regulated translational status. Examination of the dark-repressed chloroplast-targeted mRNAs (Cluster 6) and ribosomal proteins and translation factor mRNAs (Clusters 6–9; Figure 6A) with the unsupervised multiple expectation maximization for motif elicitation (MEME) algorithm (Bailey et al., 2009) yielded an over-represented A-rich motif (consensus: 5′-[AU][AGC]AA[GA]AA[AU][GAC]A[GA][AC][CAU][UG][ACG]) present in the 3′-UTRs of mRNAs of chloroplast-targeted proteins (26 of 44 Cluster 6 mRNAs; Figures 8A,C) and a motif (consensus: 5′-[AG][AG]AAACCCUA[AG]) containing a telobox (AAACCCT) present in the 5′-UTR of translationally repressed ribosomal protein and translation factor mRNAs (41 of 120 Cluster 6–9 mRNAs; Figures 8B,D). Despite the significant enrichment in mRNAs encoding genes of similar process, these motifs were not limited to the translationally regulated mRNAs (Figures 8E–F). For this reason we decided not to explore their biological function by direct evaluation using in vitro translation or in planta expression systems.
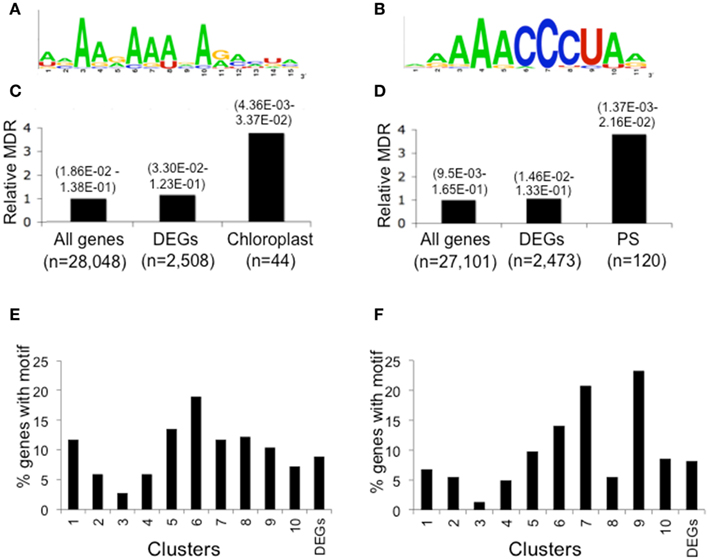
Figure 8. 5′- and 3′-UTR over-represented motifs of dark stabilized and translationally repressed chloroplast and protein synthesis machinery (PS) mRNAs identified by the unsupervised motif finder MEME. Forty-four chloroplast mRNAs from Cluster 6 and 120 ribosomal protein and translation factor mRNAs from Clusters 6–9 were independently analyzed for over-represented sequences. This identified a consensus sequence present in the 3′-UTR of dark-regulated and translationally repressed mRNA encoding proteins targeted to the chloroplast (A) and a consensus motif present in the 5′-UTR of ribosomal protein and translation factor mRNAs that contains the a telobox (B). Relative motif occurrence rate identified by FIMO in the whole transcriptome (all genes), 2508 light-regulated mRNAs (DEGs) and 44 chloroplast mRNAs in Cluster 6 (C) and protein synthesis machinery mRNAs in Clusters 6–9 (PS Cluster 6–9) (D). Numbers in brackets above each category indicate the range in q-value for motif-enriched discovery from FIMO. The numbers (n) of 5′- or 3′-UTR used for each analysis were varied based the availability of the 5′- or 3′-UTR sequences for each mRNA. Distribution by cluster of DEGs with the 3′-UTR chloroplast mRNA motif (E) or the 5′-UTR protein synthesis machinery mRNA motif (F).
Cross-Comparison of MRNAs Regulated by Light and Oxygen Availability
The coordinate translational repression of mRNAs encoding proteins associated with ribosome biogenesis and function was observed in analyses of hypoxia and re-oxygenation using the identical polysome immunopurification and microarray hybridization methods (Branco-Price et al., 2008). To assess similarities and differences in translational regulation in response to light and hypoxia, a meta-analysis was performed. This identified 8554 mRNAs that were differentially regulated (FDR <0.01; of these, 5024 also showed a twofold increase or decrease in abundance in one or more of 14 comparisons (|SLR| ≥ 1)). These DEGs were sorted by fuzzy k-means clustering to identify those that were light-regulated, hypoxia-regulated, or light and hypoxia-regulated (k = 20; n = 5024 DEGs; Table S2A in Supplementary Material). A heatmap was used to display the median log2 SLR of each cluster (Figure 9). Because the degree of change in transcript accumulation was less pronounced in response to light availability as compared to oxygen availability, the scales used in the heatmap differ for the two datasets. Clusters 1–7 and 12–16 mRNAs were primarily regulated by oxygen availability, Clusters 10–11 mRNAs were primarily regulated by light availability, and Clusters 8–9 and 17–20 mRNAs were regulated by both oxygen and light availability.
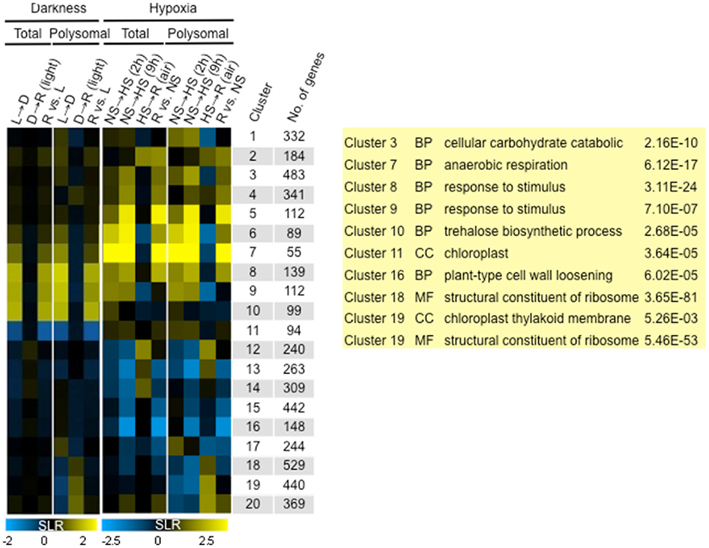
Figure 9. Comparison of change in transcriptome and translatome mRNA abundance in response to light and oxygen availability. Fuzzy k-mean clustering analysis performed on 14 mean signal log ratio (SLR) comparisons of total and immunopurified polysomal mRNA transcript abundance. Genes included in the analysis were those without all “absent” calls in bioreplicates and significantly different increase or decrease in abundance (|SLR| ≥ 1; FDR <0.01; n = 5024 probe pair sets; Table S2A in Supplementary Material). The heatmap shows median SLR values for each of 20 clusters of mRNAs that displayed similar responses to light availability and low oxygen treatment based on the total and polysomal mRNA populations. Color indicates increase (yellow), decrease (blue), or no-change (black) in mRNA abundance. Columns indicate cluster ID, number of genes (No. genes). Dark/Light (L → D), Re-illumination/Dark (D → R), and Re-illumination/Light (R versus L), 2 h hypoxia/2 h non-stress [NS → HS (2 h)], 9 h hypoxia/9 h non-stress [(NS → HS (9 h)], 1 h recovery from 9 h hypoxia/9 h hypoxia [HS → R (air)], and 1 h recovery from 9 h hypoxia/9 h non-stress (R versus NS).
Gene ontology analysis confirmed significant enrichment of genes in many of these clusters (Table S2B in Supplementary Material). The GO categories enriched in the condition-specific regulated clusters were consistent with analyses performed on the independent datasets. For example, hypoxia up-regulated genes were enriched for cellular carbohydrate catabolic process (Cluster 3, 2.16E−10) and anaerobic respiration (Cluster 7, 6.12E−17), whereas hypoxia-down-regulated genes were associated with carbohydrate biosynthetic process (Cluster 14, 3.82E−07) and plant type cell wall loosening (Cluster 16, 6.02E−05; Branco-Price et al., 2008). As seen in the analysis of Figure 6, unanticipated darkness up-regulated genes enriched for trehalose biosynthetic process (Cluster 10, 2.68E−05) and down-regulated genes associated with the chloroplast cellular compartment (Cluster 11, 3.64E−05). The genes up-regulated by both light and oxygen availability included many associated with response to a stimulus (Cluster 8, 3.11E−24; Cluster 9, 7.10E−07). Clusters 18–20 displayed dark and hypoxia-regulated translational inhibition. This control was more pronounced during hypoxia, consistent with the greater overall decline in ribosomes in polysomes [17% following 1 h of darkness (Figure 1B) versus ∼45% after 2 and 9 h of hypoxia (Branco-Price et al., 2008)]. Clusters 18–19 were highly enriched for mRNAs encoding ribosomal proteins and other components of the translational apparatus [i.e., cluster 19: structural constituent of ribosome (5.46E−53), ribosome biogenesis (4.84E−13), translation (4.13E−23)]. Cluster 19 also included genes associated with the chloroplast thylakoid membrane (5.26E−03). Both re-illumination and re-oxygenation restored association of Cluster 18–20 mRNAs with polysomes. These results emphasize that the same broad program of translational inhibition can be linked to two distinct environmental stimuli.
Over-Represented Sequence Features of Translationally Regulated mRNAs
To further evaluate mRNA sequences that may be associated with regulation of translational status, we surveyed the 20 clusters resolved in the meta-analysis for the telobox motif over-represented in the 5′-UTR of translationally regulated ribosomal protein mRNAs (Figure 8A). The motif was more prevalent in the clusters of mRNAs that were translationally repressed by darkness and hypoxia, particularly in those enriched for ribosomal proteins and other components of the translational apparatus (Clusters 18–19; Figure 10A; Table S2 in Supplementary Material). Of the 373 DEGs that possessed the motif in their 5′-UTR, 40.8% were translationally repressed either under hypoxia and/or darkness (Clusters 18–20). The telobox is a functional cis-element present in genes encoding ribosomal proteins, abundant translation factors, and RNA helicases as well as genes associated with cell cycle regulation (Axelos et al., 1989; Manevski et al., 1999; Tremousaygue et al., 2003; McIntosh and Bonham-Smith, 2005). It was previously noted that teloboxes occur downstream of the transcription start site. This motif acts in transcriptional regulation; it remains to be tested whether the telobox functions in translational regulation.
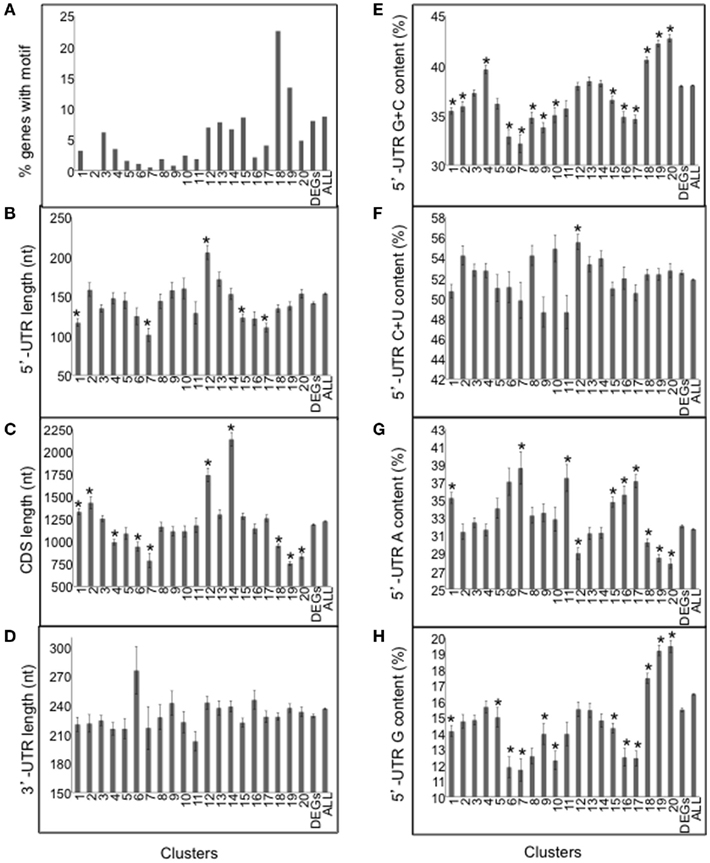
Figure 10. Evaluation of nucleotide sequence features of mRNAs co-regulated by light and/or oxygen availability. (A) Frequency of the motif 5′-[AG][AG]AAACCCUA[AG] resembling a telobox in each of the 20 clusters represented in Figure 9, the entire DEG dataset, and all 5′-UTRs from TAIR10 (ALL). (B) Length of the 5′-UTR in nucleotides (nt). (C) Length of the coding sequence (CDS; nt). (D) Length of the 3′-UTR (nt). (E) G + C content (%) of the 5′-UTR. (F) C + U content (%) of the 5′-UTR. (G) A content (%) of the 5′-UTR. (H) G content (%) of the 5′-UTR. Values are mean and SE for the mRNAs of the 20 clusters represented in Figure 9. DEGs, corresponds to the mean and SE for all 5024 DEGs. ALL, corresponds to all 5′-UTR, CDS or 3′-UTRs from TAIR10. An asterisk indicates a significant difference as compared to the average of all 5024 mRNAs by use of the Student’s t-test (p < 0.001).
We showed previously that mRNAs that are poorly translated under mild dehydration conditions in rosette leaves are characterized by long and G + C-rich 5′-UTRs with high predicted thermostability (Kawaguchi and Bailey-Serres, 2005). Here, we examined the influence of the length of the 5′-UTR, coding region (CDS) and 3′-UTR as well as the mono- and di-nucleotide content of 5′-UTR of light and/or hypoxia-regulated mRNAs (Table S2A in Supplementary Material). We found that the hypoxia-induced and translated mRNAs (Clusters 6–7) have shorter than average 5′-UTRs and CDSs, lower than average 5′-UTR G + C content and higher than average 5′-UTR A content (Figures 10B,E,G). mRNAs that were translationally repressed by darkness and hypoxia (Clusters 18–20) possessed shorter than average CDS, however their 5′-UTR G + C content and G content was above average (Figures 10C,E,H), suggesting more stable 5′-UTR secondary structure. We also found that the percent C + U content was significantly higher in Cluster 12 mRNAs (Figure 10F). Although CU-rich regions were prevalent in 5′UTRs, they were not clearly enriched at the 5′-terminus of mRNAs for any cluster. The examination of 3′-UTR length did not reveal any significant differences (Figure 10D). These results support the hypothesis that 5′-UTR G + C content and other sequence features may contribute to dynamics in translation status observed in response to external cues.
Discussion
Differential mRNA Translation Regulated by Light Availability
This study demonstrates that changes in light availability can dynamically and reversibly regulate the translational status of individual mRNAs in Arabidopsis seedlings. Most mRNA expression profiling studies have focused on the total cellular mRNA population, which is readily isolated from biological samples. By use of an efficient method of ribosome-mRNA immunopurification, we were able to perform a quantitative comparison of total cellular versus ribosome-associated mRNAs. This uncovered the regulation of translation status of individual mRNAs in response to light availability. We found that an unanticipated shift to darkness at midday and subsequent re-illumination influenced the abundance of a subset of cellular mRNAs in either the transcriptome and/or translatome (n = 2508; Figure 4). These included 492 dark-induced mRNAs, 403 dark-destabilized mRNAs and 1613 dark translationally repressed mRNAs. Many of the dark-induced mRNAs were associated with carbohydrate and amino acid catabolism (Tables S1A,B in Supplementary Material), whereas the dark-destabilized mRNAs were highly enriched in transcription factors and other regulatory proteins. The mRNAs that were translationally repressed in the dark-shifted out of polysome complexes and were somehow stabilized. This group of mRNAs was enriched for proteins targeted to plastids and the protein synthesis machinery (Figure 6A; Table S1 in Supplementary Material). Remarkably, the stable but translationally repressed mRNAs comprised 19% of the total cellular mRNA detected, in strong agreement with the observed 17% reduction in polysomal content (Figure 2; Figure 6C). A search for putative RNA-regulatory sequences in UTRs associated with differential translational regulation yielded two short motifs (Figure 8), but neither were convincingly over-represented in translationally regulated mRNAs to merit functional validation. A meta-analysis of translational regulation in response to light and oxygen availability confirmed general and stress-specific translational regulation. The transcripts with reduced rates of initiation in multiple stresses possessed 5′-UTRs rich in G + C content but lacked any discernable significantly over-represented sequence motif.
Translational Regulation and Energy Availability
Protein synthesis is energetically costly due to ATP and GTP requirements during 43S-pre-initiation complex formation and scanning of the 5′-UTR, the completion of the initiation processing, charging of tRNAs and ribosome translocation. Photosynthetic organs produce ATP through photosynthesis in the light and mitochondrial respiration in the dark. Branco-Price et al. (2008) reported that oxygen deprivation causes a deficiency in cellular ATP content that is tightly correlated with global levels of polysomes in Arabidopsis seedlings. Consistent with that study we observed a reversible reduction in polysome complexes in dark-treated seedlings concomitant with similar adjustments in mRNA content in polysomes (Figure 2; Figure 6C). The observed increase in monosomes simultaneous with reduced translation of a subset of cellular mRNAs is indicative of reprioritized selection of mRNAs in the initiation phase of translation. These results are reminiscent of the limitations on initiation of translation observed in response to abiotic stresses in addition to oxygen deprivation, including dehydration, salt stress, elevated temperature, high cadmium, and sucrose starvation in Arabidopsis and other plants (Bailey-Serres and Freeling, 1990; Butler et al., 1990; Kawaguchi et al., 2004; Branco-Price et al., 2005, 2008; Mustroph et al., 2009b; Sormani et al., 2011). Restriction of initiation of translation was shown to be limited during the night in rosette leaves of Arabidopsis (Piques et al., 2009). Based on calculation of ATP quantities used for protein synthesis during the day, there is insufficient carbon to maintain the same level of translational activity at night. Importantly, the restriction of translation of a subset of mRNAs by conditions including hypoxia and darkness is rapidly reversible, as most of the translationally repressed mRNAs become reassociated with polysomes following release from the unanticipated cue (Figure 9). Together, these data support our previous proposal that plant energy homeostasis is regulated in part by selective regulation of translation (Branco-Price et al., 2008).
The mRNAs that are hypersensitive to reduced initiation of translation in response to a variety of environmental stress include components of the protein synthesis machinery (cytosolic and organellar ribosomal proteins and translation factors; Butler et al., 1990; Fennoy and Bailey-Serres, 1993; Kawaguchi et al., 2004; Branco-Price et al., 2005; Nicolai et al., 2006; Mustroph et al., 2009b; Matsuura et al., 2010). By contrast, these mRNAs are translationally activated in maize embryos during germination (Jimenez-Lopez et al., 2011). Our further demonstration of coordinate repression of translation of these transcripts in a meta-analysis comparing modulation of light and oxygen availability (Figure 9), complements an earlier comparison of change in translation status in response to elevated temperature, salt stress, and dehydration stress (Matsuura et al., 2010). Both studies recognized that abundant plastid-targeted mRNAs are also present in the translationally repressed cohort. These include a subset of thylakoid membrane-localized proteins associated with light harvesting and enzymes of the Calvin cycle. Thus, translational regulation of abundant mRNAs is a general response to conditions that impact energy availability.
In mammals, the regulation of translation of mRNAs encoding the protein synthesis machinery is modulated by nutrient availability and cellular stresses through the energy-sensing mammalian target of rapamycin (mTOR) Ser/Thr kinase, TOR regulatory protein (RAPTOR), and S6 kinase (S6K) cascade (Liu et al., 2006), which modifies phosphorylation of eukaryotic initiation factor (eIF) 4E-binding protein, eIF4B, eEF2, and ribosomal protein S6 (RPS6; Proud, 2007). More recently, it has been shown that mTOR regulates translation of mRNAs with a 5′-terminal oligopyrimidine tract (5′-TOP) via stress-granule associated TIA-1 and TIAR proteins in response to changes in nutrient availability (Damgaard and Lykke-Andersen, 2011). Many ribosomal protein and translation factor mRNAs of mammals possess a 5′-TOP.
Arabidopsis possesses functional orthologs of mTOR pathway components and multiple stresses reduce and/or alter the phosphorylation of translation factors and RPS6 (Turck et al., 1998, 2004; Kawaguchi and Bailey-Serres, 2002; Williams et al., 2003; Arsham and Neufeld, 2006; Mahfouz et al., 2006). There is also some evidence that 5′-TOP-like motifs function in TOR-regulated translation in plants (Tzeng et al., 2009; Jimenez-Lopez et al., 2011), although none have been systematically studied. Here, we found that the Arabidopsis orthologs of S6K1 (At3g08730) and S6K2 (At3g08720) were differentially regulated by light availability. Early darkness induced accumulation and translation of S6K2 mRNA (Cluster 1), whereas light maintained and induced translation of S6K1 mRNA (Cluster 6; Figure 6; Table S1A in Supplementary Material). Mahfouz et al. (2006) proposed that Arabidopsis S6K1 functions in the TOR pathway and S6K2 regulates the phosphorylation of RPS6 in the nucleolus. Despite earlier contradictory reports on the rapamycin sensitivity of plant cells, recent studies confirmed that glucose-activated and TOR-mediated phosphorylation of S6K1 is inhibited by rapamycin in leaf protoplasts of Arabidopsis (Xiong and Sheen, 2011). This required the Arabidopsis ortholog of FKP12, which is known to bind rapamycin and enhance its interaction with TOR, thereby augmenting rapamycin inhibition of TOR kinase activity. Thus, through use of a combination of mutants and rapamycin or other TOR inhibitors, it should be feasible to determine if the TOR/S6K1 pathway links energy-sensing with the translation status of individual mRNAs in plants.
Translational Regulation Associated with Re-Illumination
Variation in light causes rapid cellular adjustments that could impact translation, including changes in the redox balance of the plastoquinone pool and accumulation of reactive oxygen species (ROS). We observed a group of dark-induced but poorly translated mRNAs (Cluster 10; Figure 6), which were recruited to polysomes upon re-illumination. This pattern of expression is reminiscent of a cohort of transcripts that were strongly induced at the level of transcript accumulation by hypoxia but only recruited to polysomes upon re-oxygenation (Branco-Price et al., 2008). Although Cluster 10 mRNAs were not notably enriched for any GO category, this cluster included Lesion Simulating Disease (LSD1, At4g20380). Muhlenbock et al. (2008) reported that LSD1 functions during light acclimation by regulating ROS levels and the redox state of plastoquinone. LSD1 and other mRNAs that are dark-induced but not translated until re-illumination could provide specific benefits during the recovery process. The ability to rapidly upregulate LSD1 production upon re-illumination may be important because elevation of singlet oxygen, a major ROS involved in photooxidative damage, down-regulates translation of photosynthetic mRNAs including Rubisco large and small subunits and LHCB2 chlorophyll binding protein (Khandal et al., 2009). Remarkably, this increase in singlet oxygen correlated with a decline in the phosphorylation state of RPS6, leading Reinbothe et al. (2010) to hypothesize that singlet oxygen may interfere with the S6K signaling network. We speculate that changes in cellular redox state or ROS production upon transfer to darkness or re-illumination are relevant to light-mediated regulation of translation, particularly of cytosolic mRNAs encoding chloroplast proteins.
Elusive mRNA Sequence Motifs but Evident mRNA Sequence Features
Differential translational regulation in plants can be mediated by RNA-regulatory motifs within the 5′- or 3′-UTR of the mRNA (Bailey-Serres, 1999; Petracek and Thompson, 2000). Examples of mRNA regions or elements have been reported for both environmentally and developmentally regulated transcripts. Here we sought RNA-regulatory motifs relevant light-regulated translation of mRNAs. Although unsupervised bioinformatic searches identified two candidate regulatory motifs that were significantly enriched in the translationally regulated chloroplast and ribosomal protein mRNAs, the motifs were not limited to similarly regulated mRNAs (Figure 8). A 3′-UTR A-rich motif over-represented in mRNAs encoding plastid-targeted proteins with reduced translational status in the dark was also found in dark translated and dark-unstable mRNAs. By contrast, a 5′-UTR A/C-rich motif over-represented in ribosomal protein mRNAs was better limited to mRNAs that decline in translation status in response to light or oxygen deprivation (Figure 10A). We found no evidence for enrichment of the CAUU repeat found in the 5′-UTR of the pea ferredoxin mRNAs and shown to be required for light-regulated mRNA accumulation and polysome association in tobacco (Petracek et al., 1997, 1998; data not shown). We conclude that determinants other than primary mRNA sequence motifs must be relevant to translational regulation in plants.
Despite the apparent dearth of identifiable candidate RNA-regulatory motifs, mRNAs that are translationally repressed by darkness and hypoxia have shorter than average CDSs and higher than average 5′-UTR G + C contents, suggesting that 5′-UTR G + C content and secondary structure potential contributes to differential translation of mRNAs. This is similar to an early survey of sequence characteristics associated with differential mRNA translation in response to water-deficit stress in Arabidopsis (Kawaguchi and Bailey-Serres, 2005). Additional mRNA features are likely to impact translation status. For example, global translatome studies strongly indicate that the presence of 5′-upstream open reading frames (uORFs) regulates translation initiation and polysome loading of some mRNAs (Kim et al., 2004; Kawaguchi and Bailey-Serres, 2005). Other possible determinants include mono- and di-nucleotide stretches (e.g., 5′-TOP; Proud, 2007) or tertiary structures that are not easily recognized by motif search tools (Kozak, 2005). However, we found no convincing evidence of enrichment of 5′-TOP-like or other biased stretches in the co-regulated of mRNAs. Nevertheless, elusive RNA-regulatory motifs or features could determine association of specific RBPs or the recruitment and retention of initiation factors that underlie selective translation.
Potential Roles of RNA Binding Proteins in Light-Regulated Translational Regulation
Selective translation caused by the shift to darkness is a recurring phenomenon that is likely to be regulated by RNA-regulatory motifs or sequence features, association with specific RBPs and signal transduction pathways such as the energy-sensing TOR/S6K1 cascade or a cellular redox or ROS sensing mechanism. Based on the routing of mRNAs to polysomal complexes within 10 min of re-illumination, the reversal of dark-induced translational repression is rapid. We propose that the translationally repressed mRNAs are sequestered in messenger ribonucleoprotein (mRNP) complexes in the dark. There is precedence for this in the algae Chlamydomonas reinhardtii in which the RBP NAB1 inhibits translation of LHCBm mRNAs by sequestration under high light (Mussgnug et al., 2005). The modification of NAB1 cysteine-226 by the cellular redox state regulates the binding of NAB1 to LHCBm mRNA (Wobbe et al., 2009). It follows that redox-regulated RBPs may play a role in regulation of translation status of transcripts specifically regulated by changes in light status in higher plants. Sequestration of mRNAs in darkness might also involve stress-granules (SGs) and processing bodies (PBs). PBs contain mRNA degradation machinery and function in turnover of transcripts (Balagopal and Parker, 2009). In Saccharomyces cerevisiae, PBs are involved in ribosomal protein mRNA sequestration under glucose starvation in a manner dependent on phosphorylation of decapping complex protein 2 (DCP2; Yoon et al., 2010). Arabidopsis possesses putative orthologs of mammalian PB and SG proteins, a few of which have been shown to form dynamically regulated cytosolic complexes (Bailey-Serres et al., 2009).
In this study a genome-level analysis of light-regulated adjustments in the seedling transcriptome and translatome confirmed that translation is selectively and dynamically modulated by light availability. A future challenge is to determine the signal transduction pathways that regulate these dynamics as well as the mRNP complexes involved. It should be feasible to combine the use of chemical inhibitors and immunopurification of polysome and mRNP complexes with high throughput sequencing to decipher the cellular choreography of selective mRNA translation. We predict that the elusive RNA-regulatory motifs and features relevant to translational regulation might be obtained by sequencing the regions of mRNAs protected by specific RBPs.
Conflict of Interest Statement
The authors declare that the research was conducted in the absence of any commercial or financial relationships that could be construed as a potential conflict of interest.
Acknowledgments
This work was supported by a National Science Foundation grant to Julia Bailey-Serres (IOS-0750811) and a Royal Thai Government (Ministry of Science and Technology) scholarship to Piyada Juntawong.
Supplementary Material
The Supplementary Material for this article can be found online at http://www.frontiersin.org/Plant_Genetics_and_Genomics/10.3389/fpls.2012.00066/abstract
References
Arsham, A. M., and Neufeld, T. P. (2006). Thinking globally and acting locally with TOR. Curr. Opin. Cell Biol. 18, 589–597.
Axelos, M., Bardet, C., Liboz, T., Le Van Thai, A., Curie, C., and Lescure, B. (1989). The gene family encoding the Arabidopsis thaliana translation elongation factor EF-1 alpha: molecular cloning, characterization and expression. Mol. Gen. Genet. 219, 106–112.
Bailey, T. L., Boden, M., Buske, F. A., Frith, M., Grant, C. E., Clementi, L., Ren, J., Li, W. W., and Noble, W. S. (2009). MEME SUITE: tools for motif discovery and searching. Nucleic Acids Res. 37, W202–W208.
Bailey-Serres, J. (1999). Selective translation of cytoplasmic mRNAs in plants. Trends Plant Sci. 4, 142–148.
Bailey-Serres, J., and Freeling, M. (1990). Hypoxic stress-induced changes in ribosomes of maize seedling roots. Plant Physiol. 94, 1237–1243.
Bailey-Serres, J., Sorenson, R., and Juntawong, P. (2009). Getting the message across: cytoplasmic ribonucleoprotein complexes. Trends Plant Sci. 14, 443–453.
Balagopal, V., and Parker, R. (2009). Polysomes, P bodies and stress granules: states and fates of eukaryotic mRNAs. Curr. Opin. Cell Biol. 21, 403–408.
Berry, J. O., Nikolau, B. J., Carr, J. P., and Klessig, D. F. (1986). Translational regulation of light-induced ribulose 1,5-bisphosphate carboxylase gene expression in amaranth. Mol. Cell. Biol. 6, 2347–2353.
Blasing, O. E., Gibon, Y., Gunther, M., Hohne, M., Morcuende, R., Osuna, D., Thimm, O., Usadel, B., Scheible, W. R., and Stitt, M. (2005). Sugars and circadian regulation make major contributions to the global regulation of diurnal gene expression in Arabidopsis. Plant Cell 17, 3257–3281.
Branco-Price, C., Kaiser, K. A., Jang, C. J., Larive, C. K., and Bailey-Serres, J. (2008). Selective mRNA translation coordinates energetic and metabolic adjustments to cellular oxygen deprivation and reoxygenation in Arabidopsis thaliana. Plant J. 56, 743–755.
Branco-Price, C., Kawaguchi, R., Ferreira, R. B., and Bailey-Serres, J. (2005). Genome-wide analysis of transcript abundance and translation in Arabidopsis seedlings subjected to oxygen deprivation. Ann. Bot. 96, 647–660.
Brautigam, K., Dietzel, L., Kleine, T., Stroher, E., Wormuth, D., Dietz, K. J., Radke, D., Wirtz, M., Hell, R., Dormann, P., Nunes-Nesi, A., Schauer, N., Fernie, A. R., Oliver, S. N., Geigenberger, P., Leister, D., and Pfannschmidt, T. (2009). Dynamic plastid redox signals integrate gene expression and metabolism to induce distinct metabolic states in photosynthetic acclimation in Arabidopsis. Plant Cell 21, 2715–2732.
Bruick, R. K., and Mayfield, S. P. (1999). Light-activated translation of chloroplast mRNAs. Trends Plant Sci. 4, 190–195.
Butler, W., Cook, L., and Vayda, M. E. (1990). Hypoxic stress inhibits multiple aspects of the potato tuber wound response. Plant Physiol. 93, 264–270.
Crooks, G. E., Hon, G., Chandonia, J. M., and Brenner, S. E. (2004). WebLogo: a sequence logo generator. Genome Res. 14, 1188–1190.
Damgaard, C. K., and Lykke-Andersen, J. (2011). Translational coregulation of 5′TOP mRNAs by TIA-1 and TIAR. Genes Dev. 25, 2057–2068.
Dickey, L. F., Petracek, M. E., Nguyen, T. T., Hansen, E. R., and Thompson, W. F. (1998). Light regulation of Fed-1 mRNA requires an element in the 5′ untranslated region and correlates with differential polyribosome association. Plant Cell 10, 475–484.
Dietzel, L., and Pfannschmidt, T. (2008). Photosynthetic acclimation to light gradients in plant stands comes out of shade. Plant Signal. Behav. 3, 1116–1118.
Eberhard, S., Finazzi, G., and Wollman, F. A. (2008). The dynamics of photosynthesis. Annu. Rev. Genet. 42, 463–515.
Fennoy, S. L., and Bailey-Serres, J. (1993). Synonymous codon usage in Zea mays L. nuclear genes is varied by levels of C and G-ending codons. Nucleic Acids Res. 21, 5294–5300.
Graf, A., Schlereth, A., Stitt, M., and Smith, A. M. (2010). Circadian control of carbohydrate availability for growth in Arabidopsis plants at night. Proc. Natl. Acad. Sci. U.S.A. 107, 9458–9463.
Gutierrez, R. A., Ewing, R. M., Cherry, J. M., and Green, P. J. (2002). Identification of unstable transcripts in Arabidopsis by cDNA microarray analysis: rapid decay is associated with a group of touch- and specific clock-controlled genes. Proc. Natl. Acad. Sci. U.S.A. 99, 11513–11518.
Hiratsuka, K., and Chua, N. (1997). Light-regulated transcription in higher plants. J. Plant Res. 110, 9.
Horan, K., Jang, C., Bailey-Serres, J., Mittler, R., Shelton, C., Harper, J. F., Zhu, J. K., Cushman, J. C., Gollery, M., and Girke, T. (2008). Annotating genes of known and unknown function by large-scale coexpression analysis. Plant Physiol. 147, 41–57.
Jiao, Y., and Meyerowitz, E. M. (2010). Cell-type specific analysis of translating RNAs in developing flowers reveals new levels of control. Mol. Syst. Biol. 6, 419.
Jimenez-Lopez, S., Mancera-Martinez, E., Donayre-Torres, A., Rangel, C., Uribe, L., March, S., Jimenez-Sanchez, G., and Sanchez de Jimenez, E. (2011). Expression profile of maize (Zea mays L.) embryonic axes during germination: translational regulation of ribosomal protein mRNAs. Plant Cell Physiol. 52, 1719–1733.
Kawaguchi, R., and Bailey-Serres, J. (2002). Regulation of translational initiation in plants. Curr. Opin. Plant Biol. 5, 460–465.
Kawaguchi, R., and Bailey-Serres, J. (2005). mRNA sequence features that contribute to translational regulation in Arabidopsis. Nucleic Acids Res. 33, 955–965.
Kawaguchi, R., Girke, T., Bray, E. A., and Bailey-Serres, J. (2004). Differential mRNA translation contributes to gene regulation under non-stress and dehydration stress conditions in Arabidopsis thaliana. Plant J. 38, 823–839.
Khandal, D., Samol, I., Buhr, F., Pollmann, S., Schmidt, H., Clemens, S., Reinbothe, S., and Reinbothe, C. (2009). Singlet oxygen-dependent translational control in the tigrina-d.12 mutant of barley. Proc. Natl. Acad. Sci. U.S.A. 106, 13112–13117.
Kim, B. H., Cai, X., Vaughn, J. N., and von Arnim, A. G. (2007). On the functions of the h subunit of eukaryotic initiation factor 3 in late stages of translation initiation. Genome Biol. 8, R60.
Kim, T. H., Kim, B. H., Yahalom, A., Chamovitz, D. A., and von Arnim, A. G. (2004). Translational regulation via 5′ mRNA leader sequences revealed by mutational analysis of the Arabidopsis translation initiation factor subunit eIF3h. Plant Cell 16, 3341–3356.
Kozak, M. (2005). Regulation of translation via mRNA structure in prokaryotes and eukaryotes. Gene 361, 13–37.
Kulheim, C., Agren, J., and Jansson, S. (2002). Rapid regulation of light harvesting and plant fitness in the field. Science 297, 91–93.
Lidder, P., Gutierrez, R. A., Salome, P. A., McClung, C. R., and Green, P. J. (2005). Circadian control of messenger RNA stability. Association with a sequence-specific messenger RNA decay pathway. Plant Physiol. 138, 2374–2385.
Liu, L., Li, F., Cardelli, J. A., Martin, K. A., Blenis, J., and Huang, S. (2006). Rapamycin inhibits cell motility by suppression of mTOR-mediated S6K1 and 4E-BP1 pathways. Oncogene 25, 7029–7040.
Ma, L., Li, J., Qu, L., Hager, J., Chen, Z., Zhao, H., and Deng, X. W. (2001). Light control of Arabidopsis development entails coordinated regulation of genome expression and cellular pathways. Plant Cell 13, 2589–2607.
Mahfouz, M. M., Kim, S., Delauney, A. J., and Verma, D. P. (2006). Arabidopsis TARGET OF RAPAMYCIN interacts with RAPTOR, which regulates the activity of S6 kinase in response to osmotic stress signals. Plant Cell 18, 477–490.
Manevski, A., Bardet, C., Tremousaygue, D., and Lescure, B. (1999). Characterization and properties of heteromeric plant protein complexes that interact with tef cis-acting elements in both RNA polymerase II-dependent promoters and rDNA spacer sequences. Mol. Gen. Genet. 261, 892–900.
Matsuura, H., Ishibashi, Y., Shinmyo, A., Kanaya, S., and Kato, K. (2010). Genome-wide analyses of early translational responses to elevated temperature and high salinity in Arabidopsis thaliana. Plant Cell Physiol. 51, 448–462.
McIntosh, K. B., and Bonham-Smith, P. C. (2005). The two ribosomal protein L23A genes are differentially transcribed in Arabidopsis thaliana. Genome 48, 443–454.
Muhlenbock, P., Szechynska-Hebda, M., Plaszczyca, M., Baudo, M., Mateo, A., Mullineaux, P. M., Parker, J. E., Karpinska, B., and Karpinski, S. (2008). Chloroplast signaling and LESION SIMULATING DISEASE1 regulate crosstalk between light acclimation and immunity in Arabidopsis. Plant Cell 20, 2339–2356.
Mussgnug, J. H., Wobbe, L., Elles, I., Claus, C., Hamilton, M., Fink, A., Kahmann, U., Kapazoglou, A., Mullineaux, C. W., Hippler, M., Nickelsen, J., Nixon, P. J., and Kruse, O. (2005). NAB1 is an RNA binding protein involved in the light-regulated differential expression of the light-harvesting antenna of Chlamydomonas reinhardtii. Plant Cell 17, 3409–3421.
Mustroph, A., Juntawong, P., and Bailey-Serres, J. (2009a). Isolation of plant polysomal mRNA by differential centrifugation and ribosome immunopurification methods. Methods Mol. Biol. 553, 109–126.
Mustroph, A., Zanetti, M. E., Jang, C. J., Holtan, H. E., Repetti, P. P., Galbraith, D. W., Girke, T., and Bailey-Serres, J. (2009b). Profiling translatomes of discrete cell populations resolves altered cellular priorities during hypoxia in Arabidopsis. Proc. Natl. Acad. Sci. U.S.A. 106, 18843–18848.
Nicolai, M., Roncato, M. A., Canoy, A. S., Rouquie, D., Sarda, X., Freyssinet, G., and Robaglia, C. (2006). Large-scale analysis of mRNA translation states during sucrose starvation in Arabidopsis cells identifies cell proliferation and chromatin structure as targets of translational control. Plant Physiol. 141, 663–673.
Pesaresi, P., Hertle, A., Pribi, M., Schneider, A., Kleine, T., and Leister, D. (2010). Optimizing photosynthesis under fluctuating light: the role of the Arabidopsis STN7 kinase. Plant Signal. Behav. 5, 21–25.
Petracek, M. E., Dickey, L. F., Huber, S. C., and Thompson, W. F. (1997). Light-regulated changes in abundance and polyribosome association of ferredoxin mRNA are dependent on photosynthesis. Plant Cell 9, 2291–2300.
Petracek, M. E., Dickey, L. F., Nguyen, T. T., Gatz, C., Sowinski, D. A., Allen, G. C., and Thompson, W. F. (1998). Ferredoxin-1 mRNA is destabilized by changes in photosynthetic electron transport. Proc. Natl. Acad. Sci. U.S.A. 95, 9009–9013.
Petracek, M. E., and Thompson, W. F. (2000). Post-transcriptional light regulation of nuclear-encoded genes. Genet. Eng. (N. Y.) 22, 1–10.
Piques, M., Schulze, W. X., Hohne, M., Usadel, B., Gibon, Y., Rohwer, J., and Stitt, M. (2009). Ribosome and transcript copy numbers, polysome occupancy and enzyme dynamics in Arabidopsis. Mol. Syst. Biol. 5, 314.
Pogson, B. J., Woo, N. S., Forster, B., and Small, I. D. (2008). Plastid signalling to the nucleus and beyond. Trends Plant Sci. 13, 602–609.
Proud, C. G. (2007). Signalling to translation: how signal transduction pathways control the protein synthetic machinery. Biochem. J. 403, 217–234.
Reinbothe, C., Pollmann, S., and Reinbothe, S. (2010). Singlet oxygen signaling links photosynthesis to translation and plant growth. Trends Plant Sci. 15, 499–506.
Rutitzky, M., Ghiglione, H. O., Cura, J. A., Casal, J. J., and Yanovsky, M. J. (2009). Comparative genomic analysis of light-regulated transcripts in the Solanaceae. BMC Genomics 10, 60. doi:10.1186/1471-2164-10-60
Smyth, G. K. (2004). Linear models and empirical Bayes methods for assessing differential expression in microarray experiments. Stat. Appl. Genet. Mol. Biol. 3, 3.
Sormani, R., Delannoy, E., Lageix, S., Bitton, F., Lanet, E., Saez-Vasquez, J., Deragon, J. M., Renou, J. P., and Robaglia, C. (2011). Sublethal cadmium intoxication in Arabidopsis thaliana impacts translation at multiple levels. Plant Cell Physiol. 52, 436–447.
Staiger, D., and Koster, T. (2011). Spotlight on post-transcriptional control in the circadian system. Cell. Mol. Life Sci. 68, 71–83.
Stern, D. B., Goldschmidt-Clermont, M., and Hanson, M. R. (2010). Chloroplast RNA metabolism. Annu. Rev. Plant Biol. 61, 125–155.
Sullivan, M. L., and Green, P. J. (1993). Post-transcriptional regulation of nuclear-encoded genes in higher plants: the roles of mRNA stability and translation. Plant Mol. Biol. 23, 1091–1104.
Tang, L., Bhat, S., and Petracek, M. E. (2003). Light control of nuclear gene mRNA abundance and translation in tobacco. Plant Physiol. 133, 1979–1990.
Tremousaygue, D., Garnier, L., Bardet, C., Dabos, P., Herve, C., and Lescure, B. (2003). Internal telomeric repeats and “TCP domain” protein-binding sites co-operate to regulate gene expression in Arabidopsis thaliana cycling cells. Plant J. 33, 957–966.
Turck, F., Kozma, S. C., Thomas, G., and Nagy, F. (1998). A heat-sensitive Arabidopsis thaliana kinase substitutes for human p70s6k function in vivo. Mol. Cell. Biol. 18, 2038–2044.
Turck, F., Zilbermann, F., Kozma, S. C., Thomas, G., and Nagy, F. (2004). Phytohormones participate in an S6 kinase signal transduction pathway in Arabidopsis. Plant Physiol. 134, 1527–1535.
Tzeng, T. Y., Kong, L. R., Chen, C. H., Shaw, C. C., and Yang, C. H. (2009). Overexpression of the lily p70(s6k) gene in Arabidopsis affects elongation of flower organs and indicates TOR-dependent regulation of AP3, PI and SUP translation. Plant Cell Physiol. 50, 1695–1709.
Usadel, B., Blasing, O. E., Gibon, Y., Retzlaff, K., Hohne, M., Gunther, M., and Stitt, M. (2008). Global transcript levels respond to small changes of the carbon status during progressive exhaustion of carbohydrates in Arabidopsis rosettes. Plant Physiol. 146, 1834–1861.
Williams, A. J., Werner-Fraczek, J., Chang, I. F., and Bailey-Serres, J. (2003). Regulated phosphorylation of 40S ribosomal protein S6 in root tips of maize. Plant Physiol. 132, 2086–2097.
Wobbe, L., Blifernez, O., Schwarz, C., Mussgnug, J. H., Nickelsen, J., and Kruse, O. (2009). Cysteine modification of a specific repressor protein controls the translational status of nucleus-encoded LHCII mRNAs in Chlamydomonas. Proc. Natl. Acad. Sci. U.S.A. 106, 13290–13295.
Xiong, Y., and Sheen, J. (2011). Rapamycin and glucose-target of Rapamycin (TOR) signaling in plants. J. Biol. Chem. 287, 2836–2842.
Yoon, J. H., Choi, E. J., and Parker, R. (2010). Dcp2 phosphorylation by Ste20 modulates stress granule assembly and mRNA decay in Saccharomyces cerevisiae. J. Cell Biol. 189, 813–827.
Zanetti, M. E., Chang, I. F., Gong, F., Galbraith, D. W., and Bailey-Serres, J. (2005). Immunopurification of polyribosomal complexes of Arabidopsis for global analysis of gene expression. Plant Physiol. 138, 624–635.
Keywords: light-regulated gene expression, dark-regulated gene expression, re-illumination, post-transcriptional control, mRNA sequence elements, ribosomal proteins, energy status
Citation: Juntawong P and Bailey-Serres J (2012) Dynamic light regulation of translation status in Arabidopsis thaliana. Front. Plant Sci. 3:66. doi: 10.3389/fpls.2012.00066
Received: 21 December 2011; Accepted: 20 March 2012;
Published online: 05 April 2012.
Edited by:
Richard A. Jorgensen, The National Laboratory of Genomics for Biodiversity, MexicoReviewed by:
Richard A. Jorgensen, The National Laboratory of Genomics for Biodiversity, MexicoAlbrecht Von Arnim, University of Tennessee, USA
Copyright: © 2012 Juntawong and Bailey-Serres. This is an open-access article distributed under the terms of the Creative Commons Attribution Non Commercial License, which permits non-commercial use, distribution, and reproduction in other forums, provided the original authors and source are credited.
*Correspondence: Julia Bailey-Serres, Department of Botany and Plant Sciences, Center for Plant Cell Biology, University of California, Riverside, CA 92521, USA. e-mail:c2VycmVzQHVjci5lZHU=