
 Lea L. A. Märtin1,2
- 1 IBG-2: Plant Sciences, Forschungszentrum Jülich GmbH, Jülich, Germany
- 2 Department of Biogeography, University of Bayreuth, Bayreuth, Germany
- 3 Vegetation Ecology, Technische Universität München, Freising-Weihenstephan, Germany
- 4 IBG-3: Agrosphere, Forschungszentrum Jülich GmbH, Jülich, Germany
- 5 Vegetation Ecology and Botany, University of Applied Sciences Osnabrueck, Osnabrück, Germany
δ15N signals in plant and soil material integrate over a number of biogeochemical processes related to nitrogen (N) and therefore provide information on net effects of multiple processes on N dynamics. In general little is known in many grassland restoration projects on soil–plant N dynamics in relation to the restoration treatments. In particular, δ15N signals may be a useful tool to assess whether abiotic restoration treatments have produced the desired result. In this study we used the range of abiotic and biotic conditions provided by a restoration experiment to assess to whether the restoration treatments and/or plant functional identity and legume neighborhood affected plant δ15N signals. The restoration treatments consisted of hay transfer and topsoil removal, thus representing increasing restoration effort, from no restoration measures, through biotic manipulation to major abiotic manipulation. We measured δ15N and %N in six different plant species (two non-legumes and four legumes) across the restoration treatments. We found that restoration treatments were clearly reflected in δ15N of the non-legume species, with very depleted δ15N associated with low soil N, and our results suggest this may be linked to uptake of ammonium (rather than nitrate). The two non-legume species differed considerably in their δ15N signals, which may be related to the two species forming different kinds of mycorrhizal symbioses. Plant δ15N signals could clearly separate legumes from non-legumes, but our results did not allow for an assessment of legume neighborhood effects on non-legume δ15N signals. We discuss our results in the light of what the δ15N signals may be telling us about plant–soil N dynamics and their potential value as an indicator for N dynamics in restoration.
Introduction
Species-rich grasslands on nutrient-poor soils form important cultural landscapes of high conservation value in Europe but their area has declined due to the opposing drivers of land abandonment or agricultural intensification (Poschlod and Wallis De Vries, 2002; Isselstein et al., 2005). As a consequence considerable effort has gone into their restoration with various levels of success (Bakker and Berendse, 1999) and limitations often include seed dispersal and abiotic constraints (e.g., in ex-arable fields where restoration often takes place). Recent restoration experiments have shown that seed limitation can be overcome by measure of species introduction but long-term success of restoration projects also depends on the suitability of the abiotic conditions (Kiehl et al., 2010). Since the high diversity of such grasslands is linked to adaptation to their often extreme abiotic conditions, including N limitation and low water availability, knowledge of plant–soil N dynamics of the ecosystem should play a key role in ecosystem functioning and hence restoration success.
Stable isotope methods using the heavy isotope of nitrogen 15N, either as natural abundance (NA) or added in enriched form, are traditionally used in terrestrial ecosystems to follow paths or sources of N in systems (tracer studies). There are advantages and disadvantages of using either NA or enriched 15N methods. For nitrogen, the NA method measures the ratio of the naturally occurring rare and heavy 15N and the naturally prevalent lighter 14N isotopes and provides the δ15N signal of a sample. The δ15N in plants is per se a function of δ15N of all N sources and thus an integrator of net N dynamics in a system (Robinson, 2001). A number of studies have used ecosystem δ15N as a proxy of N availability, and higher availability of N or more active N transformation rates have been linked to enriched δ15N values (Coetsee et al., 2011). As such 15N NA studies have the potential to provide insights into a number of plant–soil processes of importance to restoration: e.g., issues of effectiveness of restoration actions, such as whether topsoil removal does significantly alter soil–plant N dynamics and hence diversity in systems with high nutrient loads as often found in Central Europe. In addition, restoration experiments and projects, especially those with drastic manipulation of abiotic conditions such as topsoil removal on ex-arable land (Marrs, 2002), can provide a broad range of different abiotic and biotic conditions within which to test how variability of δ15N in plants may relate to their functional identity (FI) or to the soil conditions they experience.
The complexity of the N cycle in soils (including lack of knowledge of δ15N of various pools in the N cycle) as well as relatively small discrimination during natural processes (compared to the isotope 13C) make the δ15N NA method more appropriate for providing integrated information rather than a clear signal of particular process or source of N in nature (Handley and Raven, 1992). Exceptions are that δ15N in plants enables species to be identified as N-fixers (δ15N around zero) or non-fixers (δ15N significantly different to zero, e.g., Virginia and Delwiche, 1982). The NA method can also be used for estimating the percent of N derived from atmosphere (%Ndfa) in aboveground plant parts of N2-fixing species (Shearer and Kohl, 1986) and to study facilitative legume neighbor interactions (Temperton et al., 2007).
In a broader context and depending of the study-scale, δ15N in plants and soils can also provide information on climate (Amundson et al., 2003), nutrient retention in ecosystems (openness or closedness of the N cycle; Frank and Evans, 1997), and site history including N cycling and plant development (Chang and Handley, 2000; Coetsee et al., 2011). The study of Coetsee et al. (2011) in grazed pastures found that grazing can directly increase δ15N in plants even if soil N remains the same, and linked this to altered rates of N transformation during grazing. Other examples of the integrative use of NA methods are studies on C and N dynamics in plant–mycorrhizal ecosystems but “questions remain about how different N forms, fungal symbionts, and N availabilities influence δ15N signatures” (Hobbie et al., 2008).
Nevertheless, the limitations of such methods need to be kept in mind and we need to explicitly test what information these methods can and cannot provide, as well as their potential and relevance for addressing key issues in ecology and restoration. In order to do this, we first need additional information on the variability of δ15N signatures in plants and soil and preliminary information on how these signatures may be affected by abiotic and biotic conditions at a site. Although NA methods using δ15N signatures have been widely used as integrators of the N cycle within a whole range of ecosystems (Amundson et al., 2003, or southern Nothofagus forests in Peri et al., 2012), in grasslands most of the data on typical δ15N signatures and their variability within and between plant species derives from relatively nutrient-rich grasslands (so-called mesic grasslands; Spehn et al., 2002; Kahmen et al., 2008; Gubsch et al., 2011). There are very few studies in nutrient-poor dry grasslands, such as primary succession grasslands on dunes (van der Heijden et al., 2006) or dry acidic grassland (Beyschlag et al., 2009). The few studies in dry grasslands have found, however, that δ15N signatures of plants in these systems are more depleted in δ15N than in mesic grasslands.
We therefore used a calcareous grassland restoration experiment established on ex-arable land that provided a range of abiotic and biotic conditions (ranging from relatively nutrient-rich soils to nutrient-poor soils) to screen the δ15N signatures of plant species across the treatments. This allowed us to test whether similar patterns of more negative (depleted) δ15N plant signals would be found in more nutrient-poor conditions compared to the more nutrient-rich conditions in mesic grassland habitats. In addition it allowed us to investigate the link between δ15N plant signals with both soil characteristics and functional plant characteristics. The restoration experiment provided sites with and without topsoil removal and sites with and without hay transfer for the introduction of target species, thus representing a gradient in restoration effort from no action (no topsoil removal, no hay transfer) to maximum action (topsoil removal and hay transfer).
In particular we aimed to see if
(a) δ15N signals in plant species at a calcareous grassland restoration site would clearly reflect the different restoration treatments, particularly whether the abiotic topsoil removal treatment could be clearly separated from the treatment without topsoil removal?
(b) Whether δ15N signals could be used to clearly separate legume species (N2-fixers) from non N2-fixing species?
(C) Whether the vicinity of a legume species to a plant affected the δ15N signature of the plant?
To test this we sampled a range of grassland species in the four different restoration treatments and measured N concentration and δ15N in leaves of these species, as well as the soil nutrient availability and δ15N in bulk soil. Species included either stress-tolerant target species (typical dry grassland species as indicators for restoration success) as well as non-target species more typically found in more nutrient-rich (mesic) grasslands.
Materials and Methods
Experimental Design
The study site consists of ex-arable fields in the vicinity of the nature reserve “Garchinger Heide” (48°18′N, 11°39′E, 469 masl, Germany), located in the Munich gravel plain on pararendzina soil (see Figure 1). The fields had been used as arable fields since the beginning of the twentieth century and were converted in 1993 in the course of a large-scale restoration project to reestablish nutrient-poor, species-rich calcareous grasslands (Pfadenhauer et al., 2000). The climate is temperate, mean annual temperature is 7.8°C, total annual precipitation is ∼865 mm (data for Oberschleiß heim and Haimhausen-Ottershausen, DWD, 2009).
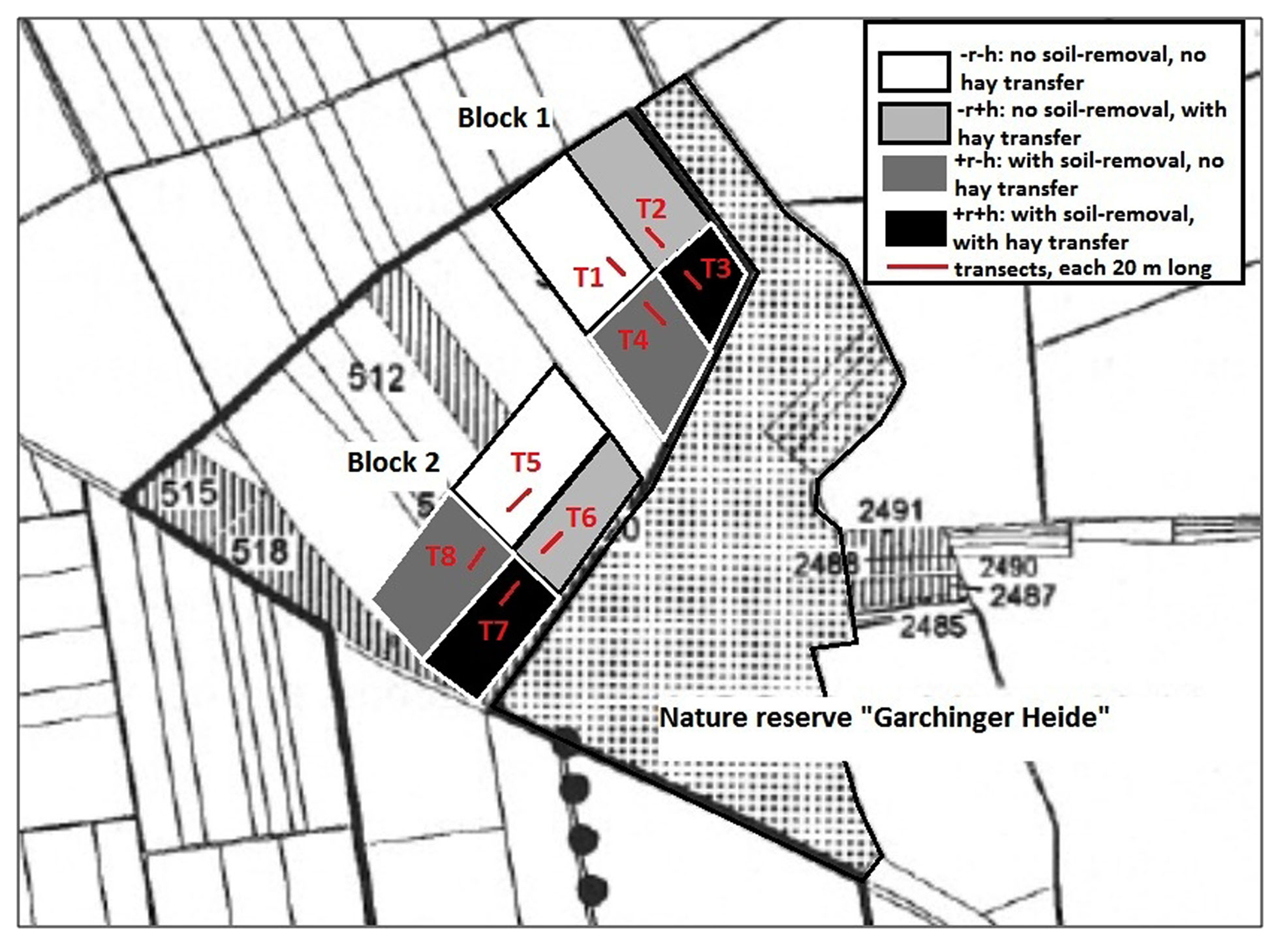
Figure 1. The Garchinger Heide restoration site near Munich showing the experimental design with the four restoration treatments repeated over two blocks, and the eight transects used for sampling plant material. Transects (each 20 m long) were positioned within the treatment fields (size approximately 70 m × 150 m): T1–T4 are in Block 1, transects T5–T8 are in block two. The restoration treatments ranging from topsoil removal and hay transfer (+r+h) to no action (−r−h) are shown in different colors on the fields.
The restoration treatments were hay transfer (from the reference grassland nature reserve “Garchinger Heide”) and topsoil removal, thus representing increasing restoration effort, from no restoration measures, through biotic manipulation to major abiotic manipulation. Restoration treatments were performed at field scale (approximately 200–300 m long, 70 m wide) in two different sets of fields providing two experimental blocks: blocks 1 and 2, with all four restoration treatments within each block (see Figure 1). The four restoration treatments were topsoil removal with hay transfer (+r+h) and without hay transfer (+r−h), no topsoil removal with hay transfer (−r+h) and no topsoil removal without hay transfer (−r−h). Each restoration treatment covered an area of around 70 m × 150 m depending on the exact field in question (see Figure 1). Treatment −r−h represents the natural succession from old field to grassland and hence forms a restoration control. Topsoil removal consisted of mechanical removal of 40 cm agricultural topsoil down to the calcareous gravel and resulted in a strong reduction of total N and exchangeable P and K in the substrate (Table 1). Hay transfer aimed to overcome dispersal limitation of calcareous grassland species, and indeed number and cover of calcareous grassland species (including many legume species) was much higher on +h than on −h sites, even 13 years after start of the restoration (Table 1; Kiehl, 2009).
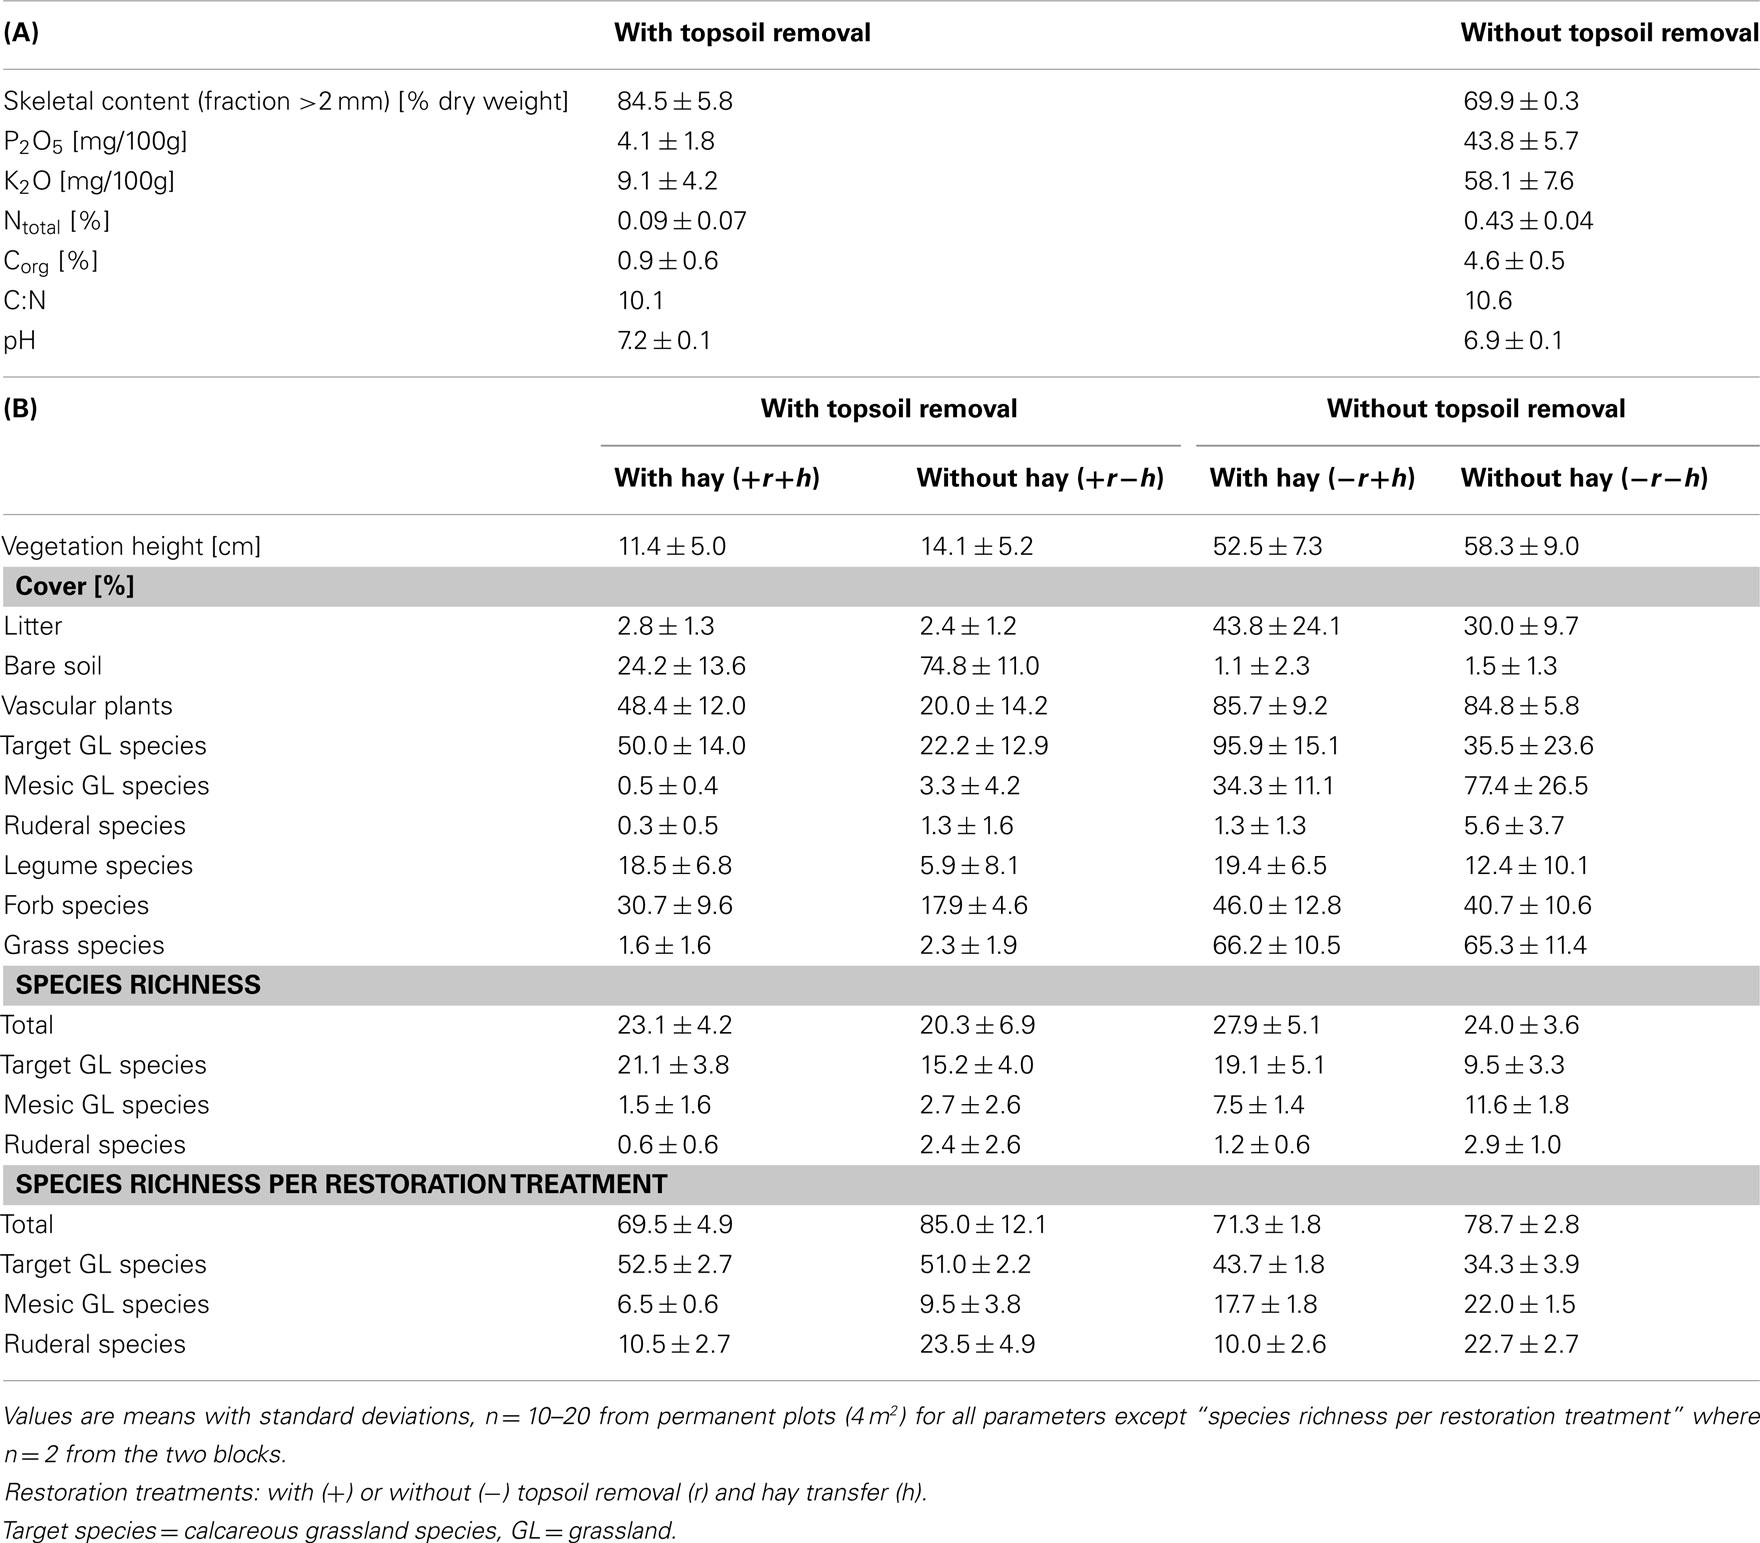
Table 1. Compilation of abiotic and biotic characteristics in different restoration treatments from previous evaluations at the field site: (A) abiotic soil properties in 2000 (0–10 cm, summarized from Pfadenhauer and Kiehl, 2003; Kiehl, 2005), note that nutrient contents and ratios relate to the weight of the fine soil fraction only not the total soil volume, and (B) species cover and species richness in 2006 (summarized from Hummitzsch, 2007).
Since 1995, the −r areas were either grazed by sheep or mown annually in July/August and the +r areas were mown only occasionally to remove woody species as mowing was usually not possible due to low biomass production (Pfadenhauer et al., 2000; Pfadenhauer and Kiehl, 2003). Sheep grazing occurred only in Block 2 (not Block 1) and then only for a period of 2 weeks. Different management types showed only minor effects on flora and fauna compared to the major treatments topsoil removal and hay transfer (see Kiehl and Wagner, 2006).
Plant Sampling and Analysis
Plant and soil material were sampled along a 20-m transect in the middle of each treatment area. In August 2007, we sampled plant material (1–2 individuals) at eight equally distributed measuring points along each transect or within a distance of maximum 2 m perpendicular to the transect when species were not found close to the transect. This gave a total transect area sampled of 80 m2 per treatment per block. An exception to this sampling method was made in the +r−h treatment, where plant cover was very low, such that we sampled in an area of approximately 50 m × 100 m. We used every sample per treatment per block as a replicate giving n = 6–17 per species and restoration treatment (Table 2; varying n depended on how many individuals per species were found along the transect).
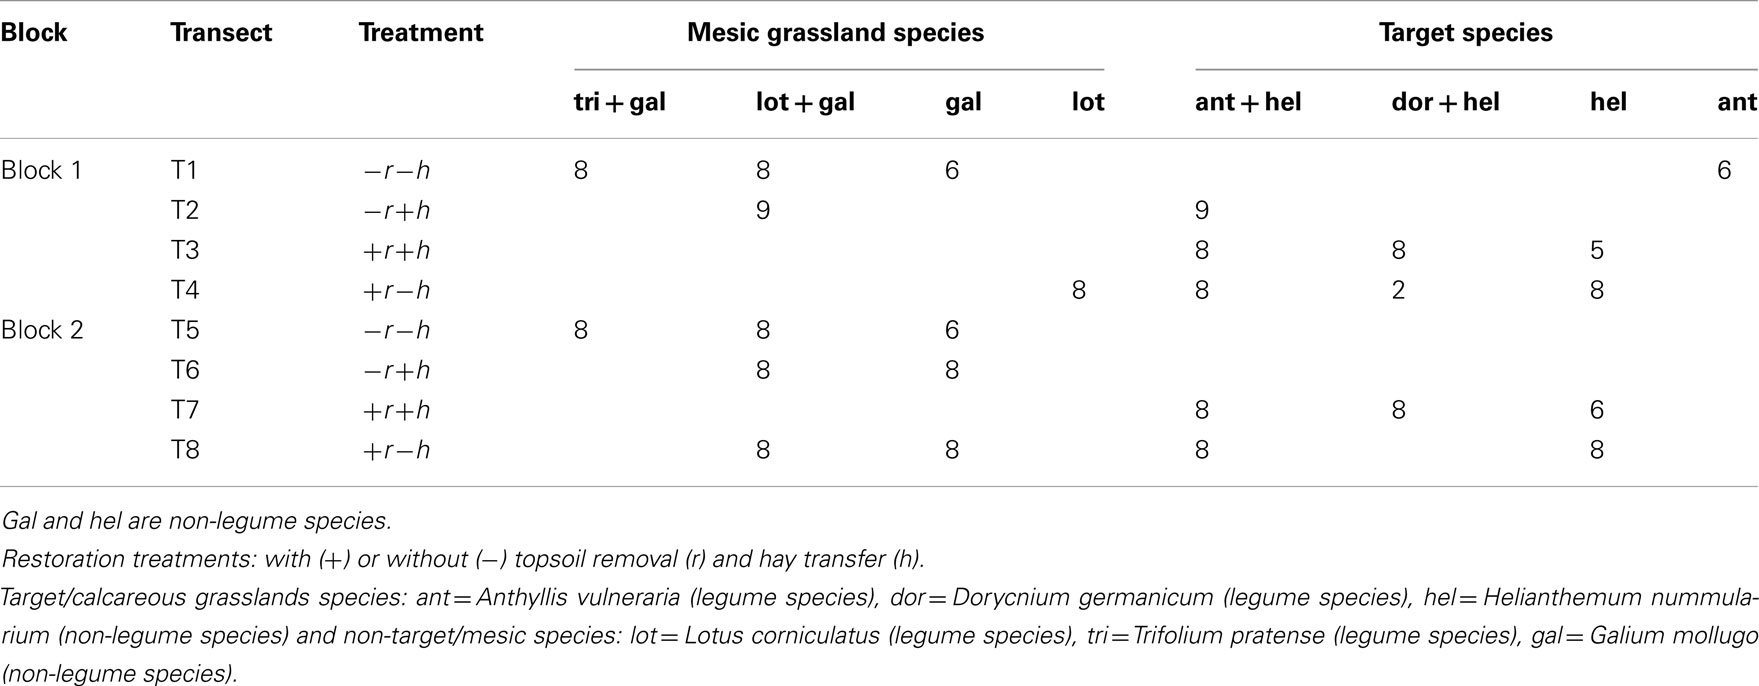
Table 2. Overview of the number of plant pairs (non-legume species and their legume neighbor), control plants (non-legume species without legume neighbor) and legume species without non-legume neighbor sampled along transects in different restoration treatments, depending on availability of each species along transects.
To address the question of whether δ15N signatures in plants could be used to clearly separate legume species (N2-fixers) from non N2-fixing species we sampled four legume species and two non-legume forb across the restoration treatments. To address the question of whether the vicinity of a legume species to a plant affected its δ15N signature, we collected leaves of legume/non-legume pairs (<10 cm distance between each other) and control plants of the non-legume species (>30 cm distance to the next legume species). As far as possible we collected pairs (legume/non-legume) of stress-tolerant target species (typical for calcareous grasslands) as well as pairs of non-target species (typical for mesic grasslands) in all restoration treatments (but not all species were present in all treatments, as ecological sorting had occurred in response to the different abiotic conditions produced by the topsoil removal).
We sampled four legume and two non-legume species overall (see Table 2). The stress-tolerant target species were: Anthyllis vulneraria L. (hereafter ant), Dorycnium germanicum (Gremli) Rikli (hereafter dor), and Helianthemum nummularium (L.) Mill. (small shrub, hereafter hel; two legume and one non-legume forb respectively). Mesic, non-target species were: Trifolium pratense L. (hereafter tri), Lotus corniculatus (hereafter lot), and Galium mollugo (forb, hereafter gal; again two legume and one non-legume species respectively; Oberdorfer, 2001). Plant samples were dried (60 h/60°C), ground to fine powder and analyzed for δ15N and N concentration (hereafter %N). We collected root samples in November 2008 and estimated whether they had been colonized by mycorrhizae and measured δ15N and %N in the soil samples.
Soil Sampling and Analysis
In November 2008, one mixed soil sample (0 to −15 cm) was obtained at four positions along each transect for analysis of δ15N and other abiotic parameters in the bulk soil. Soil samples were sieved (<2 mm) to homogenize the substrate and exclude roots and stones. An aliquot of the sieved soil was dried (72 h/30°C), ground to fine powder and analyzed per restoration treatment for %N, δ15N (n = 8) and P concentration (n = 2, hereafter %P). For analysis of mineralized soil N (n = 8, Nmin: plant-available and [ppm]) 5 g of fresh soil were shaken with 50 ml 1 M KCl for 6 h and Nmin was determined chromatographically in the soil solution using ion chromatography. P concentration in soil was determined with ICP-OES (Thermo Fisher Scientific, Waltham, USA).
δ15N and %N analyses
For analyses of δ15N NA signals (‰; hereafter δ15N) and %N, ground plant or soil material was measured using an element analyzer coupled with an isotope ratio mass spectrometer (EA-IRMS; EA = EURO-EA 3000 by HEKAtech GmbH, Wegberg, Germany, IRMS = IsoPrime by Micromass UK Limited, Manchester, UK).
The δ15N of a sample denotes the ratio of the heavier over the lighter stable isotope of nitrogen (15N over 14N) in a sample in relation to a standard (atmospheric N2; see Mariotti, 1983): δ15N = [(Rsample/Rstandard) − 1] * 1000 [‰], Rsample or Rstandard is the ratio of 15N over 14N for sample or standard, respectively.
Statistical Analysis
The restoration experiment was conducted at landscape scale on restoration fields of several hectares and thus, according to Oksanen (2001), replications per site can be considered as independent samples in statistical analyses and not as pseudoreplicates sensu Hurlbert (1984). Due to the size of the sites, we were able to avoid edge effects and undesired between-treatment dispersal which often confound results on small plots. We tested effects of restoration treatments in a two factor (topsoil removal, hay transfer) factorial design on N parameters in plants and soil. The block effect was negligible for most subsets of data.
Since not all species combinations were present in all treatments, we used all data together only for a few analyses (for all species over all restoration treatments) testing for effects of species identity (SI), and functional identity (FI; whether a species was a legume or not) on leaf δ15N and %N in a one-way ANOVa (and data were log10 transformed when variances found to be inhomogeneous).
All other analyses were performed using subsets of data separated either by FI, SI, neighborhood (NH), or restoration treatment. Here we performed an overall two-way ANOVA (Type III Sum of Squares) with topsoil removal (r), hay transfer (h), and an interaction between both (r × h) as fixed factors. In general for soil parameters, n = 8 (four replicates per transect per treatment in each block) except for P where only two samples were taken (one pooled sample per transect; since P was not the main focus of the study). For plant leaf data the exact number of replicates depended on the number of individuals per species found along the transects (see below for exact replicate values per species). For plant %N (untransformed) and δ15N (log transformed) we performed one ANOVA on the whole dataset (all species in all restoration treatments together, n of all samples = 293, Table 3).
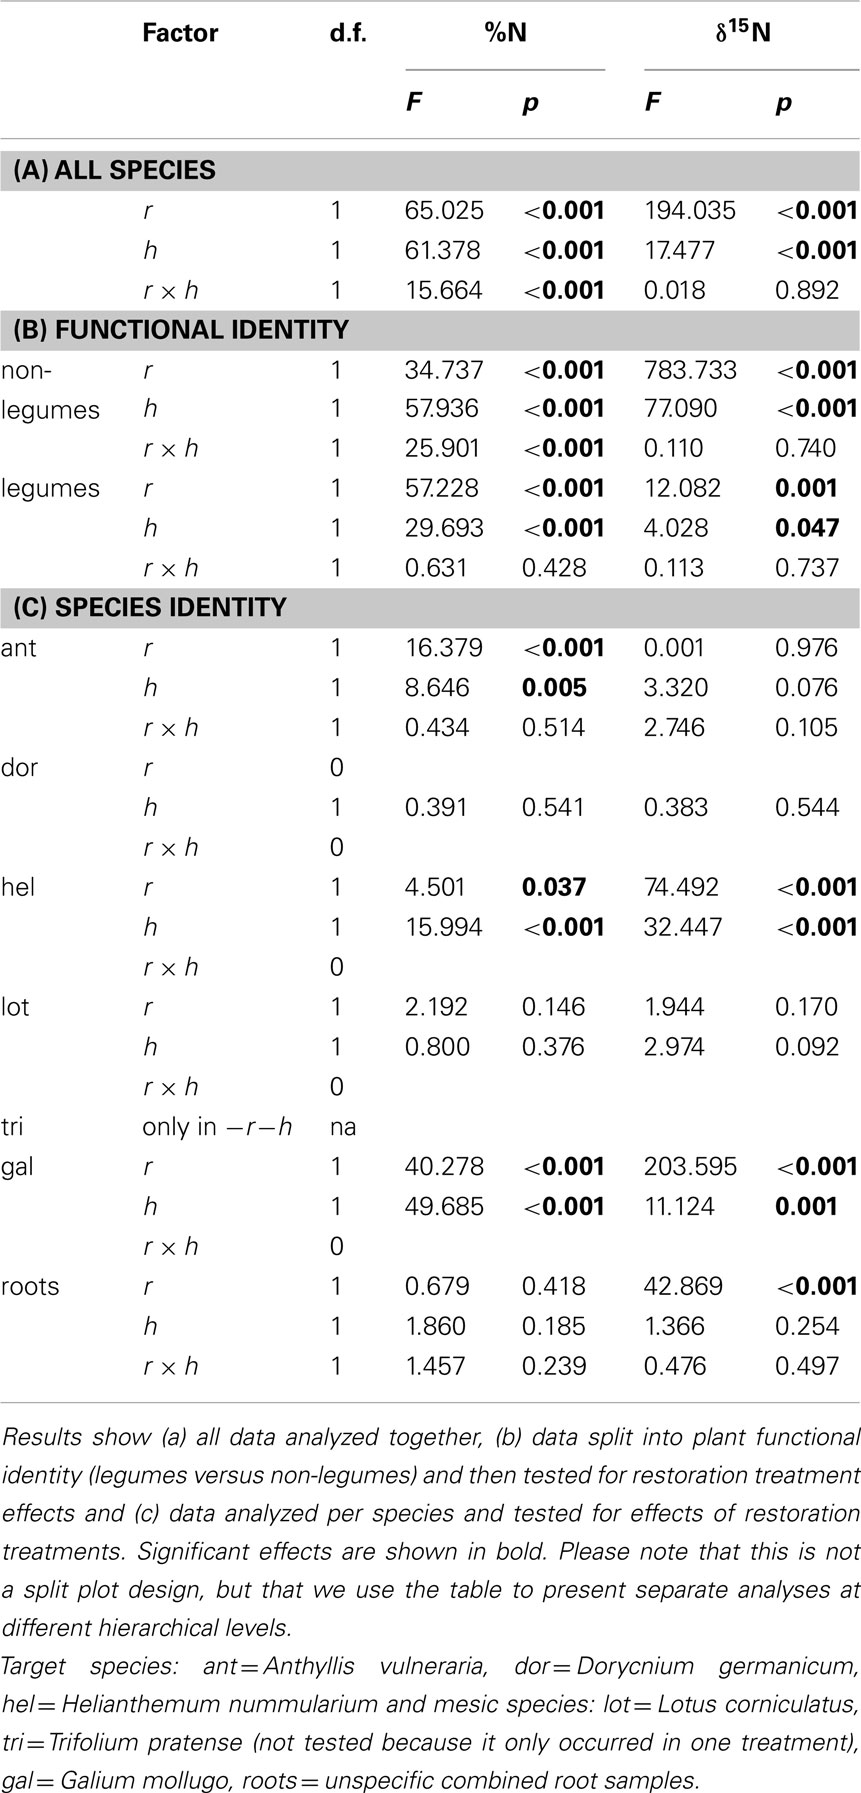
Table 3. ANOVA results (Type III Sum of Squares) for effects of topsoil removal (r), hay transfer (h), and their interaction effect (r × h) on N concentration and δ15N in plant leaves.
In addition, we tested effects of restoration treatments on legume (n = 126) and non-legume species (n = 167), separately using two-way ANOVAs (Table 3). For effects on single species, the dataset was split into different species (ant: n = 46, dor: n = 18, hel: n = 85, lot: n = 47, tri: n = 15, gal: n = 82; Table 3). We used PASW Statistics 18 (2009, SPSS, USA). All data were tested for homogeneity of variance (Levene’s test) and normality, and log10 transformed if assumptions were not met.
Results
Restoration Treatment Effects on Soil
The restoration treatments represented increasing restoration effort, from no restoration measures (control, −r−h), through biotic manipulation (with hay transfer, +h) to major abiotic manipulation (with topsoil removal, +r). Topsoil removal was very effective in persistently reducing plant-available nutrients, whereas hay transfer had no effect on soil nutrient parameters (except for -ratios: p = 0.014; Table 1; Figure 2). Sites without topsoil removal had twice as much %N in the substrate than those with topsoil removal, and this difference remained constant over time (in 2003: Table 1 and in 2008: Figure 2). In this study we link 2007 plant data mainly to 2008 soil data (rather than earlier soil values). In 2008 (Figure 2) topsoil removal reduced plant-available mineral N %N and %P strongly by 60–70%, respectively (p ≤ 0.020). In contrast, the ratio of Nmin to %N (Nmin/Ntotal [%]) was stable across the restoration treatments (p = 0.162; Figure 2), but the ratio of ammonium to nitrate was significantly higher in topsoil removal sites than in non-removal sites (p < 0.001) and this corresponded to extremely low nitrate concentrations after topsoil removal (Figure 2). Topsoil removal reduced δ15Nsoil in bulk soil on average by around 1.2‰ compared to non-removal sites (+r: 3.23‰ <−r: 4.51‰, p = 0.005).
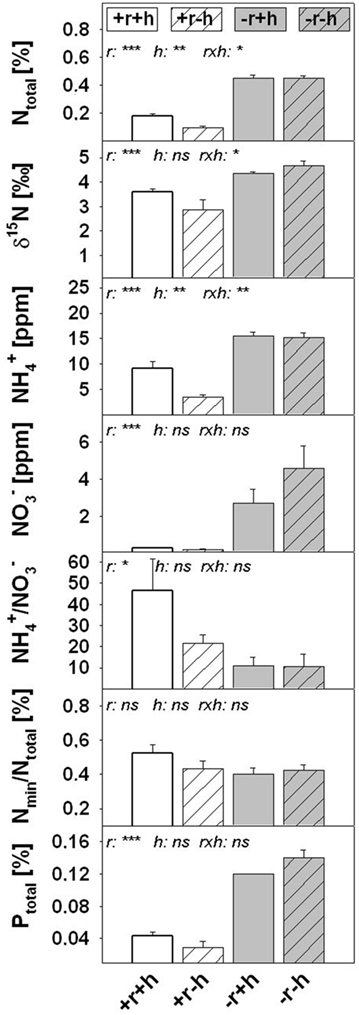
Figure 2. Soil properties of the four restoration treatments in 2008 (see also Table 1 for comparison with data from earlier evaluations); parameters include Ntotal and Ptotal (concentrations [%] measured in bulk soil; fraction <2 mm) and mineral N forms [ammonium nitrate measured in soil solution). Values are means ± 1 SEM (n = 8 for N parameters, n = 2 for Ptotal). Restoration treatments: with topsoil removal and hay transfer (+r+h, white bars), topsoil removal and without hay transfer (+r−h, white striped bars), no topsoil removal and with hay transfer (−r+h, gray bars), no topsoil removal and without hay transfer (−r−h, gray striped bars). Significant effects of restoration treatments (r = topsoil removal, h = hay transfer, r × h = interaction between both factors) on soil properties are shown as *p < 0.05, **p < 0.01, ***p < 0.001; ns, not significant; na, not available; p-values from ANOVA (Type III Sum of Squares).
Restoration Treatment Effects on Leaves and Roots
Restoration treatments affected %N as well as δ15N significantly in leaf tissue (Figures 3 and 4) when tested over all six plant species (Table 3). A significant interaction effect between topsoil removal and hay transfer (r × h) was found for %N but not for δ15N (Table 3). Splitting data into subsets based on FI (legume versus non-legume species) produced the same overall result, except that the interaction effect (r × h) on %N did not occur for legumes (Table 3). Restoration treatment effects on single species had significant effects on %N in leaf tissue of three of the species ant, hel, and gal (Table 3; Figure 4). Restoration treatment effects on leaf δ15N were found for both non-legume species, hel and gal (Table 3; Figure 4). Here both foliar %N and δ15N decreased (δ15N became more negative) with increasing restoration effort (Figure 3 and reading Figure 4 from right to left across restoration treatments). Changes in δ15N of non-legumes were even more pronounced than changes in %N.
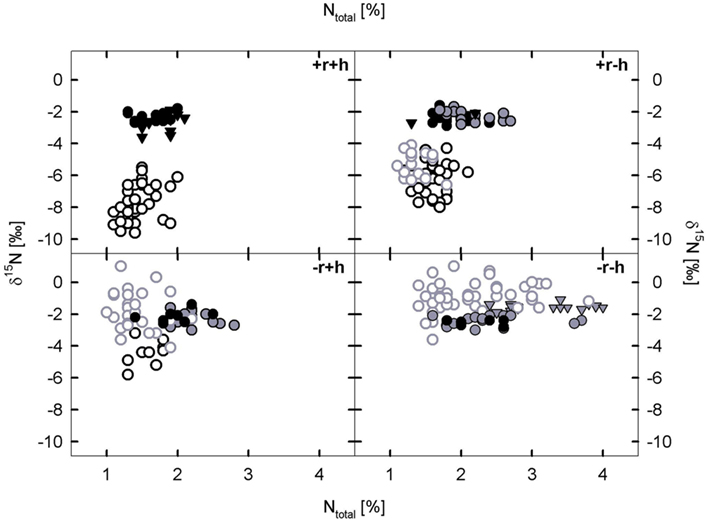
Figure 3. The relationship between δ15N values and N concentration [%] in leaves of six plant species across four restoration treatment. Restoration treatments are: with topsoil removal and hay transfer (+r+h), with topsoil removal and without hay transfer (+r−h), without topsoil removal and with hay transfer (−r+h), without topsoil removal and without hay transfer (−r−h). Closed symbols indicate legume species, open symbols non-legume species; black symbols indicate target species: Anthyllis vulneraria (●) and Dorycnium germanicum (▼), Helianthemum nummularium (black-open: ^) and gray symbols indicate mesic, non-target species: Lotus corniculatus ( ), Trifolium pratense (
 ) and Galium mollugo (
 ). Every symbol in this figure represents one replicate per species and restoration treatment, mean values are given in Figure 3, neighborhood effects of legumes on non-legume species are shown in Figure 4.
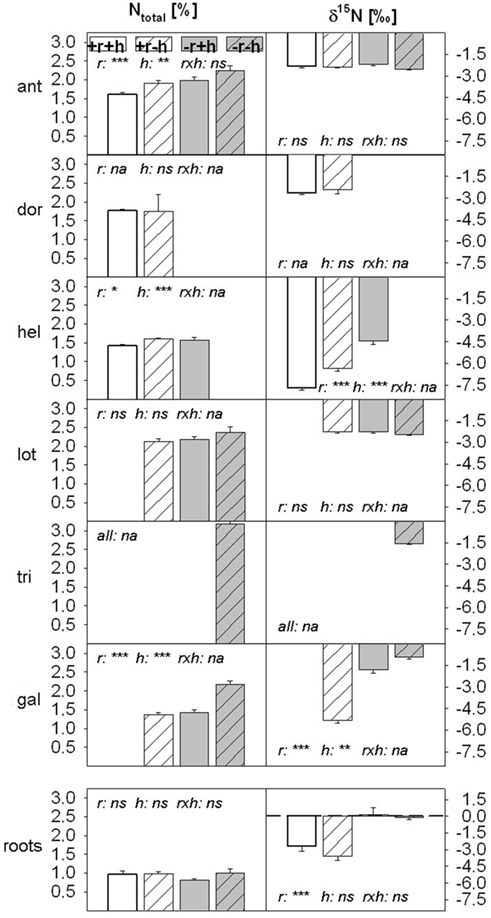
Figure 4. N concentration [%] and δ15N in plant leaves of all six species (three target calcareous grassland and three mesic species) and in root samples (species not identified) in the four restoration treatments. Values are means ± 1 SEM (plant: n = 6 – 42, except for D. germanicum in +r−h treatment: n = 2; root: n = 8). Data for some species in some treatments are missing, as the species was not growing in that treatment (see Table 2). Restoration treatments: with topsoil removal and hay transfer (+r+h, white bars), with topsoil removal and without hay transfer (+r−h, white striped bars), without topsoil removal and with hay transfer (−r+h, gray bars), without topsoil removal and without hay transfer (−r−h, gray striped bars). Target species: ant = Anthyllis vulneraria, dor = Dorycnium germanicum, hel = Helianthemum nummularium (two legume and one non-legume species, respectively) and mesic species: lot = Lotus corniculatus, tri = Trifolium pratense and gal = Galium mollugo (two legume and one non-legume species, respectively). Significant effects of restoration treatments (r = topsoil removal, h = hay transfer, r × h = interaction between both factors) on plant N parameters are shown as *p < 0.05, **p < 0.01, ***p < 0.001; ns, not significant; na, not available; p-values from ANOVA (Type III Sum of Squares, compare to Table 3).
All unspecific root samples contained some nodulated legume roots and all root samples were heavily infected with mycorrhizal fungi (50–95% of root tissues). Other kinds of fungal material were also visible and some of the significantly thicker, brownish stained material may have been ectomycorrhizial fungi components which often occur in symbiosis with H. nummularium (hel; Harley and Harley, 1987). Root samples did not vary in their %N between restoration treatments (p = 0.368; Figure 4) but δ15Nroot values were significantly lower (p = 0.016) in topsoil removal sites than in non-removal sites.
Differences in δ15N between Non-Legume and Legume Species
We found a low variability of δ15N signal in the legume species across restoration treatments (signatures were generally around −2‰, Figures 3 and 4). Values for the two non-legume species however, ranged overall from around −6 to +1‰ for gal and between around −4 and −10‰ for hel, the ectomycorrhizal species. In order to address our second aim of seeing whether δ15N signals could be used to clearly separate legumes from non-legumes, we tested the whole dataset for effects of FI (legume or not) or effects of SI on leaf δ15N and %N. We found that FI had a very significant effect on both leaf δ15N (p < 0.004) and %N (p < 0.0001 for log10 transformed data). Effects of SI mirrored the results of FI in that significant differences were found between leaf δ15N in legume species versus non-legume species (p < = 0.05).
When data were tested within each restoration treatment (data split into four subsets; see Table 4) for effects of FI or SI, both factors had a significant effect on foliar %N in topsoil removal sites, whereas there were more differentiated effects of the different factors in non-removal sites. FI almost always had a significant effect on foliar δ15N (except in the +r+h treatment; p = 0.267; Table 4), whereas SI only sometimes affected δ15N.
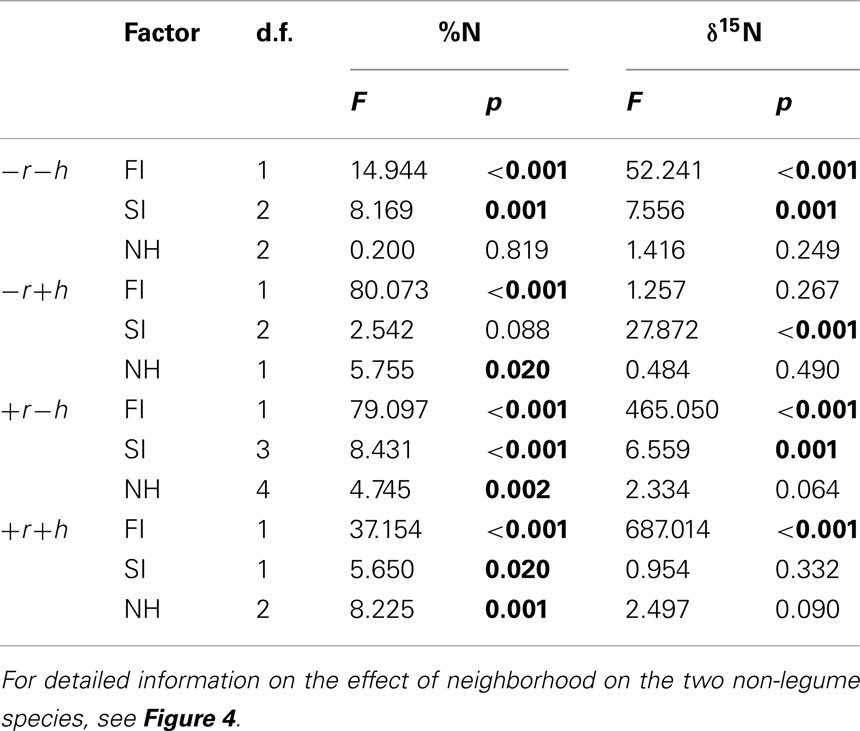
Table 4. ANOVA (sequential Type I Sum of Squares) results for effects of functional identity (FI), species identity (SI), and effect of neighborhood (NH) on N concentration and δ15N in plant leaves in all species, analyzed separately by restoration treatment [with (+) or without (−) topsoil removal (r) and hay transfer (h)].
Detection of Effect of Legume in Neighborhood on δ15N of Non-Legume Species
δ15N in legume species was generally around −2‰ (Figures 2 and 3) suggesting high levels of N2 fixation (with little N derived from soil) such that legume species studied would in theory be able to provide a source of atmospherically fixed N2 for non-legume neighbors and thus affect the δ15N signal of neighbors (sensu Spehn et al., 2002; Temperton et al., 2007).
In the field, the abundance of legume species was much higher than expected across all treatments, however, such that collection of control plants of hel and gal unaffected by legume vicinity was difficult and was generally only possible at a distance of <30 cm to a legume. The non-legume control plants (not in vicinity of legume) seldom differed from plants growing as direct neighbor of a legume (see neighborhood, NH, effects in Table 4 and Figure 5). Generally we found no legume neighbor identity effect except for hel growing in +r−h, where δ15N was differently affected by growth next to lot versus tri (p < 0.05). Overall, however, the lack of clear separation of species neighborhoods did not allow us to adequately assess our third aim of testing whether the vicinity of a legume altered leaf δ15N and %N.
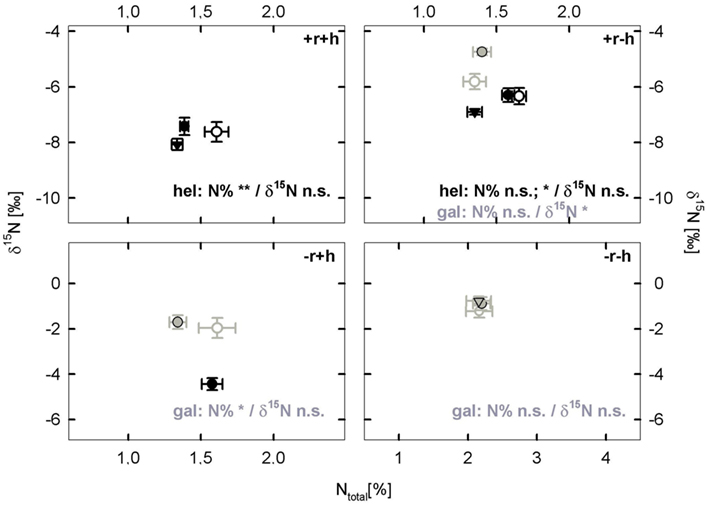
Figure 5. Neighborhood legume effects on the two non-legume species (hel: Helianthemum nummularium and gal: Galium mollugo), showing the relationship between δ15N and N concentration [%]. Hel (black type and symbols) was collected as a neighbor of the legumes Anthyllis vulneraria (●) or Dorycnium germanicum (▼) and as a control without legume neighbors (^). Similarly, gal (gray type and symbols) was collected as a neighbor of the legumes Lotus corniculatus () or Trifolium pratense () and as control without legume neighbors (). Values are means ± 1 SEM. The number of samples per species (see Table 2) varied with species and treatment but in general n = 6–16 (only hel as neighbor of D. germanicum in +r−h had n = 2). Significant effects of legume neighborhood on δ15N and N concentration within each restoration treatment are shown as *p < 0.05, **p < 0.01; ns, not significant, p-values from LSD-tests following ANOVA (Type I Sum of Squares). Generally, there was no legume neighbor identity effect on δ15N and %N, except for hel growing in +r−h, where %N was differentially affected by ID of the legume neighbor (hence two significance levels provided in graph).
Discussion
Detection of Restoration Treatment in the Plant δ15N Signal
In our study, foliar δ15N in both non-legumes gal and hel growing in topsoil removal sites were very δ15N depleted and much more negative than δ15N of legumes (Figures 2 and 3; compared with generally positive δ15N signals in non-legumes in mesic grasslands; Spehn et al., 2002). In addition, we found clear differences in δ15N signals in plants across the gradient of restoration effort (Figures 3 and 4), such that in combination with clear effects of topsoil removal on soil nutrients, this suggests that δ15N signals in plants may be revealing interesting relationships between soil N dynamics and plant N use. A number of studies suggest that enriched δ15N signals in plant may be linked to higher soil N availability or higher N transformation rates (Coetsee et al., 2011). Confirming this, Kahmen et al. (2008) combined the δ15N NA method with enriched tracers in grasslands and found that low foliar δ15N generally corresponded to low N availability in soil. For this reason we present Figure 6 as an indication of how mean δ15N in leaves of the two non-legumes hel and gal (δ15Nnon-legume) related to abiotic (see also Figure 2) aspects of the restoration sites. Due to low replication we could not perform robust correlation analysis and hence these relationships are provided as supporting data and pointers for future research needs. One can tentatively say that the higher the ratio of was, the more negative was the δ15Nnon-legume (Figure 6 last panel).
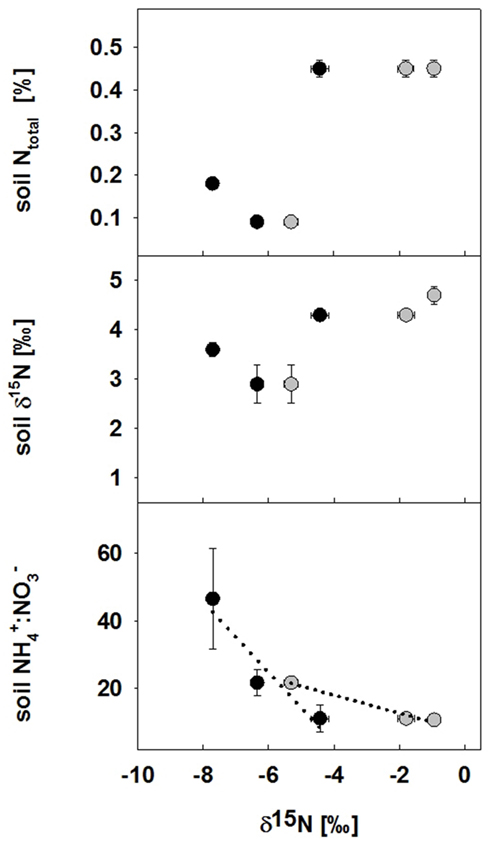
Figure 6. Relationship between foliar δ15N of the two non-legume species (hel and gal) and abiotic aspects of the four restoration treatments. Parameters include N concentration, δ15Nsoil values and ratios for bulk soil in all four restoration treatments in 2008. Tentative correlations are shown as dotted lines. Values are means ± 1 SEM and each symbol represents the δ15N value of a species (without separation into different legume neighborhoods) in one of the four restoration treatments (note that hel was not present in the control treatment, and gal was not present in the topsoil and hay addition treatment); black symbols (●) represent hel (Helianthemum nummularium), gray symbols () gal (Galium mollugo).
Separating Legumes from Non-Legumes and Effects of Having Legume Neighbors on Plant δ15N
Perhaps not surprisingly, we found that δ15N in leaves of non-legumes differed significantly from that in legumes. Even if there were still sometimes significant differences in δ15N between legume species, these differences were always largest between the legumes and the non-legumes (Figures 3 and 4). Although this may seem somewhat trivial, it does indicate that the legume species in the study were in all likelihood fixing atmospheric N2 (which is used as a standard during isotope ratio mass spectrometry, hence producing values close to zero for N-fixing legumes when a sample is divided by standard 15N). In addition, given the assumption that mycorrhizae may discriminate strongly against the heavier 15N during nitrate uptake, we do not find clear evidence for this occurring in the legumes species studied here. Unfortunately, although the roots in general (not separable into species) were found to by mycorrhizal, we could not assess to what extent the legumes formed symbioses with mycorrhizae versus the non-legume species.
In our study, we could not come to any conclusions about legume neighborhood effects on the δ15N of the two non-legume species studied, since the non-legume control plants (not in vicinity of legume) seldom differed in δ15N from plants growing as direct neighbor of a legume. In addition, the relatively small differences in δ15N between legumes and non-legumes within a restoration treatment in this study did not allow us to unequivocally show a facilitative effect of legume species on their neighbors in terms of improved N status. As such we cannot really answer our third question of to what extent the proximity of a legume or the identity of a legume neighbor affected leaf δ15N. Interestingly, in other studies that were able to show a facilitative effect of legume neighborhood, foliar δ15N of non-legume species was more positive than those of their legume neighbors (Spehn et al., 2002; Temperton et al., 2007; Gubsch et al., 2011), whereas in studies where δ15N of non-legume species was lower (more depleted, negative) than those of their legume neighbor, no clear facilitation was evident (van der Heijden et al., 2006; Beyschlag et al., 2009 and this study). Thus, while it is possible, that the δ15N of plant-available soil N in our study was close to that of legume δ15N such that facilitation may have taken place, but was not visible in the data, our data on soil and plant N and δ15N do point more toward a possible change in δ15Nfoliar non-legume in relation to changing plant N source (ammonium, nitrate) across the restoration gradient.
Other Possible Influences on the δ15N Signal in Plants: Soil N Dynamics and Plant N Uptake, Grazing, and Mycorrhizal Discrimination Against Heavy 15N
A number of studies using the δ15N NA method (alone or combined with enriched tracers), provide some key pointers which may help to interpret our results and how they may relate to soil nutrient status and plant N source. Decreases in foliar δ15N have been related to decreasing N availability in soils, lower nitrification, and mineralization rates and thus an overall more closed N cycle. Kahmen et al. (2008) investigated grassland plant’s Δδ15N (i.e., foliar δ15N standardized by background δ15Nsoil) in relation to N uptake preferences from the soil, and found decreasing Δδ15N values with increasing proportion of uptake (i.e., higher -ratios). Our results seem to confirm this trend: more negative foliar δ15Nnon-legume was linked to increasing -ratios in the soil at the restoration sites. In our study, was present across all treatments, but was present only in sites without topsoil removal (Figure 2).
Curtis et al. (2011) synthesized stable isotope study results on N saturation and N leaching in terrestrial and aquatic systems and concluded that N has maximum retention in carbon-rich ecosystems, versus maximum leaching of nitrate N from carbon-poor systems, exposed to elevated atmospheric N inputs. Our restoration system may have been affected by elevated atmospheric N inputs, and it certainly is a carbon-poor system with low nitrate concentrations in the soil (Figure 2). Martinelli et al. (1999) also found within the tropics that more depleted δ15N was correlated with lower N availability. Austin et al. (2006) inhibited nitrification and found significantly lower δ15N in dominant vegetation with the switch in N form from to taken up by plants. Schulze et al. (1994) showed that differences in foliar δ15N between different plant life forms disappeared with increasing N availability in the substrate. We also found a gradual convergence of δ15N in non-legume and legume species when moving from the most restoration intensive sites (topsoil removal and hay transfer, +r+h) to control sites (−r−h; Figures 3 and 4). In addition to soil N dynamics, lower δ15N in plants has also been linked to increasing environmental severity (by increasing elevation in the Alps Jacot et al., 2005; Huber et al., 2007) and to increasing species richness within plant communities (Gubsch et al., 2011). Jacot et al. (2005) showed an increase in the difference between δ15N of legume species and non-legume species with increasing altitude which may reflect N cycling changes or other effects such as water availability and symbioses.
Grazing has been shown to affect the N cycle and N availability, with grazing found to both increase (Coetsee et al., 2011) as well as deplete (Golluscio et al., 2009) plant δ15N. In our study, grazing played a very minor role compared to mowing, with sheep only grazing on one of the experimental blocks for a short time period. Any potential driving effects on plant δ15N should have been picked up testing for block effects on δ15N which were not significant.
A number of publications have addressed the potential for linking δ15N signals to the level of openness of the N cycle (its “leakiness”) in relation to the availability of N, with more N-rich systems predicted to have more open cycles than N-poor systems (Martinelli et al., 1999). Wetter and colder ecosystems seem to more efficient at retaining mineral N. Martinelli et al. (1999) predict that N losses in N-rich systems are more likely to discriminate against heavier 15N, “because losses by fractionating pathways leave the remaining N within the system enriched.” In our nutrient-poor, dry soils after topsoil removal N inputs and outputs were probably small compared to N cycling, and plants seemed to compete very effectively via help from mycorrhizae for the few available nutrients. It appears that the site of perhaps the largest discrimination against 15N in the plant–fungi–soil system is by mycorrhizal fungi during plant N uptake (Hobbie and Hobbie, 2008). We hypothesize that the differences in δ15N found between our two non-legume species may be attributable to their different mycorrhizal symbioses and life-histories. Helianthemum (hel), a woody shrub, forms a symbiosis with ectomycorrhizal fungi (ECM) and thus should have low δ15N based on knowledge that δ15N of non-fixing plants declines with longevity and woodiness of the species (Virginia and Delwiche, 1982), and that ECM normally discriminates against δ15N more strongly than arbuscular mycorrhizal fungi (Michelsen et al., 1998).
Conclusion
We found that δ15N values in plant species across four different restoration treatments in a calcareous grassland on ex-arable land were affected by the restoration treatments, particularly differences between topsoil removal and non-removal. Both foliar %N and δ15N decreased (δ15N became more negative) with increasing restoration effort (i.e., were most depleted in topsoil removal and hay addition) and this corresponded to a number of other NA 15N studies that suggest more depleted plant δ15N is associated with lower soil N availability and N transformations.
Legume species could be clearly separated from non-legume species using δ15N signals indicating strong N2 fixation, but we were not able to assess effects of legume neighborhood on δ15N signals in non-legumes.
Very depleted (negative) plant δ15N values were associated with low soil N but were also quite different between the two non-legume species, and this may have been a result of the different mycorrhizal symbioses (VA versus ECM) these plant species enter into with fungi.
Our study provides evidence of how δ15N in plants can inform us about plant-soil N dynamics, including successful soil N reduction in restoration settings but also the type of mycorrhizal symbioses plants enter into. Further research would endeavor to separate the link between soil N and water availability and δ15N in plants from fractionation effects of mycorrhizal symbioses.
Conflict of Interest Statement
The authors declare that the research was conducted in the absence of any commercial or financial relationships that could be construed as a potential conflict of interest.
Acknowledgments
We thank the “Heideflächenverein Münchener Norden e.V.” for permission to sample at the restoration site and the Forschungszentrum Jülich for analyses (P, and Nmin by ZCH, δ15N by Holger Wissel). Lea Märtin was funded by the Tenure Track Program of Vicky Temperton at the Forschungszentrum Jülich research centre. We thank Gerhard Gebauer for good discussions on plant δ15N and possible mycorrhizal fractionation.
References
Amundson, R., Austin, A. T., Schuur, E. A. G., Yoo, K., Matzek, V., Kendall, C., Uebersax, A., Brenner, D., and Baisden, W. T. (2003). Global patterns of the isotopic composition of soil and plant nitrogen. Global Biogeochem. Cycles 17, 31–31.
Austin, A., Sala, O., and Jackson, R. (2006). Inhibition of nitrification alters carbon turnover in the patagonian steppe. Ecosystems 9, 1257–1265.
Bakker, J. P., and Berendse, F. (1999). Constraints in the restoration of ecological diversity in grassland and heathland communities. Trends Ecol. Evol. (Amst.) 14, 63–68.
Beyschlag, W., Hanisch, S., Friedrich, S., Jentsch, A., and Werner, C. (2009). d15N natural abundance during early and late succession in a middle-European dry acidic grassland. Plant Biol. 11, 713–724.
Chang, S. X., and Handley, L. L. (2000). Site history affects soil and plant N-15 natural abundances (delta N-15) in forests of northern Vancouver Island, British Columbia. Funct. Ecol. 14, 273–280.
Coetsee, C. W. D., Stock, J. M., and Craine, J. M. (2011). Do grazers alter nitrogen dynamics on grazing lawns in a South African savannah? Afr. J. Ecol. 49, 62–69.
Curtis, C., Evans, C., Goodale, C., and Heaton, T. (2011). What have stable isotope studies revealed about the nature and mechanisms of N saturation and nitrate leaching from semi-natural catchments? Ecosystems 14, 1021–1037.
DWD. (2009). Klimadaten Deutschland – Mittelwerte. Deutscher Wetterdienst – Bundestministerium für Verkehr, Bau und Stadtentwicklung.
Frank, D. A., and Evans, R. D. (1997). Effects of native grazers on grassland N cycling in Yellowstone National Park. Ecology 78, 2238–2248.
Golluscio, R. A., Austin, A. T., Martinez, G. C. G., Gonzalez-Polo, M., Sala, O. E., and Jackson, R. B. (2009). Sheep grazing decreases organic carbon and nitrogen pools in the patagonian steppe: combination of direct and indirect effects. Ecosystems 12, 686–697.
Gubsch, M., Roscher, C., Gleixner, G., Habekost, M., Lipowsky, A., Schmid, B., Schulze, E.-D., Steinbeiss, S., and Buchmann, N. (2011). Foliar and soil δ15N values reveal increased nitrogen partitioning among species in diverse grassland communities. Plant Cell Environ. 34, 895–908.
Handley, L. L., and Raven, J. A. (1992). The use of natural abundance of nitrogen isotopes in plant physiology and ecology. Plant Cell Environ. 15, 965–985.
Harley, J. L., and Harley, E. L. (1987). A checklist of mycorrhiza in the British Flora – addenda, errrata and index. New Phytologist 107, 741–749.
Hobbie, E., Colpaert, J., White, M., Ouimette, A., and Macko, S. (2008). Nitrogen form, availability, and mycorrhizal colonization affect biomass and nitrogen isotope patterns in Pinus sylvestris. Plant Soil 310, 121–136.
Hobbie, E. A., and Hobbie, J. E. (2008). Natural abundance of N-15 in nitrogen-limited forests and tundra can estimate nitrogen cycling through mycorrhizal fungi: a review. Ecosystems 11, 815–830.
Huber, E., Wanek, W., Gottfried, M., Pauli, H., Schweiger, P., Arndt, S., Reiter, K., and Richter, A. (2007). Shift in soil–plant nitrogen dynamics of an alpine–nival ecotone. Plant Soil 301, 65–76.
Hummitzsch, U. (2007). Langfristige Vegetationsentwicklung auf neu angelegten Kalkmagerrasen unter besonderer Berücksichtigung der Leguminosen und der Kryptogamen. Lehrstuhl für Vegetationsökologie. Technische Universität München, Freising – Weihenstephan, 64.
Hurlbert, S. H. (1984). Pseudoreplication and the design of ecological field experiments. Ecol. Monogr. 54, 187–211.
Isselstein, J., Jeangros, B., and Pavlu, V. (2005). Agronomic aspects of biodiversity targeted management of temperate grasslands in Europe – a review. Agron. Res. 3, 139–151.
Jacot, K. A., Lüscher, A., Suter, M., Nösberger, J., and Hartwig, U. A. (2005). Significance of legumes for the distribution of plant species in grassland ecosystems at different altitudes in the Alps. Plant Ecol. 180, 1–12.
Kahmen, A., Wanek, W., and Buchmann, N. (2008). Foliar δ15N values characterize soil N cycling and reflect nitrate or ammonium preference of plants along a temperate grassland gradient. Oecologia 156, 861–870.
Kiehl, K. (2005). Einfluss von Renaturierungsmaß nahmen auf die Phytodiversität von Grasländern. Technische Universität München, Freising, 247.
Kiehl, K. (2009). Langfristige Perspektiven für die Entwicklung neu angelegter Kalkmagerrasen in der Münchner Schotterebene. Laufener Spezialbeiträge: Vegetationsmanagement und Renaturierung, 87–96.
Kiehl, K., Kirmer, A., Donath, T., Rasran, L., and Hölzel, N. (2010). Species introduction in restoration projects – evaluation of different techniques for the establishment of semi-natural grasslands in Central and Northwestern Europe. Basic Appl. Ecol. 11, 285–299.
Kiehl, K., Thormann, A., and Pfadenhauer, J. (2006). Evaluation of initial restoration measures during the restoration of calcareous grasslands on former arable fields. Restor. Ecol. 14, 148–156.
Kiehl, K., and Wagner, C. (2006). Effect of hay transfer on long-term establishment of vegetation and grasshoppers on former arable fields. Restor. Ecol. 14, 157–166.
Mariotti, A. (1983). Atmospheric nitrogen is a reliable standard for natural N-15 abundance measurements. Nature 303, 685–687.
Marrs, R. H. (2002). Manipulating the chemical environment of the soil,” in Handbook of Ecological Restoration. Vol. 1: Principles of Restoration, eds M. R. Perrow, and A. J. Davy (Cambridge: Cambridge University Press), 155–183.
Martinelli, L. A., Piccolo, M. C., Townsend, A. R., Vitousek, P. M., Cuevas, E., McDowell, W., Robertson, G. P., Santos, O. C., and Treseder, K. (1999). Nitrogen stable isotopic composition of leaves and soil: tropical versus temperate forests. Biogeochemistry 46, 45–65.
Michelsen, A., Quarmby, C., Sleep, D., and Jonasson, S. (1998). Vascular plant N-15 natural abundance in heath and forest tundra ecosystems is closely correlated with presence and type of mycorrhizal fungi in roots. Oecologia 115, 406–418.
Oberdorfer, E. (2001). Pflanzensoziologische Exkursionsflora für Deutschland und angrenzende Gebiete. Stuttgart: Eugen Ulmer GmbH & Co.
Oksanen, L. (2001). Logic of experiments in ecology: is pseudoreplication a pseudoissue? Oikos 94, 27–38.
Peri, P. L., Ladd, B., Pepper, D. A., Bonser, S. P., Laffan, S. W., and Amelung, W. (2012). Carbon (δ 13C) and nitrogen (δ 15N) stable isotope composition in plant and soil in Southern Patagonia’s native forests. Glob. Chang. Biol. 18, 311–321.
Pfadenhauer, J., Fischer, F. P., Helfer, W., Joas, C., Lösch, R., Miller, U., Miltz, C., Schmid, H., Sieren, E., and Wiesinger, K. (2000). “Safeguarding and development of the heaths north of Munich,” in Bundesamt für Naturschutz (Ed.) Angewandte Landschaftsökologie Heft, 32, :311.
Pfadenhauer, J., and Kiehl, K. (2003). “Renaturierung von Kalkmagerrasen,” in Bundesamt für Naturschutz (Ed.). Angewandte Landschaftsökologie Heft, 55, :292.
Poschlod, P., and Wallis De Vries, M. F. (2002). The historical and socioeconomic perspective of calcareous grasslands – lessons from the distant and recent past. Biol. Conserv. 104, 361–376.
Robinson, D. (2001). delta N-15 as an integrator of the nitrogen cycle. Trends Ecol. Evol. (Amst.) 16, 153–162.
Schulze, E. D., Chapin, F. S., and Gebauer, G. (1994). Nitrogen nutrition and isotope differences among life forms at the Northern Treeline of Alaska. Oecologia 100, 406–412.
Shearer, G., and Kohl, D. H. (1986). N2-Fixation in field settings – estimations based on natural N-15 abundance. Aust. J. Plant Physiol. 13, 699–756.
Spehn, E. M., Scherer-Lorenzen, M., Schmid, B., Hector, A., Caldeira, M. C., Dimitrakopoulos, P. G., Finn, J. A., Jumpponen, A., O’Donnovan, G., Pereira, J. S., Schulze, E. D., Troumbis, A. Y., and Korner, C. (2002). The role of legumes as a component of biodiversity in a cross-European study of grassland biomass nitrogen. Oikos 98, 205–218.
Temperton, V. M., Mwangi, P. N., Scherer-Lorenzen, M., Schmid, B., and Buchmann, N. (2007). Positive interactions between nitrogen-fixing legumes and four different neighbouring species in a biodiversity experiment. Oecologia 151, 190–205.
van der Heijden, M. G. A., Bakker, R., Verwaal, J., Scheublin, T. R., Rutten, M., Logtestijn, R. V., and Staehelin, C. (2006). Symbiotic bacteria as a determinant of plant community structure and plant productivity in dune grassland. FEMS Microbiol. Ecol. 56, 178–187.
Keywords: stable isotopes, restoration, topsoil removal, functional type, legumes, plant–soil interactions
Citation: Temperton VM, Märtin LL, Röder D Lücke A and Kiehl K (2012) Effects of four different restoration treatments on the natural abundance of 15N stable isotopes in plants. Front. Plant Sci. 3:70. doi: 10.3389/fpls.2012.00070
Received: 03 November 2011; Accepted: 26 March 2012;
Published online: 26 April 2012.
Edited by:
José M. Grünzweig, The Hebrew University of Jerusalem, IsraelReviewed by:
Rubén Retuerto, Universidad de Santiago de Compostela, SpainCristina Maria Máguas, Faculdade de Ciências da Universidade de Lisboa, Portugal
Copyright: © 2012 Temperton, Märtin, Röder, Lücke and Kiehl. This is an open-access article distributed under the terms of the Creative Commons Attribution Non Commercial License, which permits non-commercial use, distribution, and reproduction in other forums, provided the original authors and source are credited.
*Correspondence: Vicky M. Temperton, IBG-2 Plant Sciences, Forschungszentrum Jülich GmbH, 52425 Jülich, Germany. e-mail:di50ZW1wZXJ0b25AZnotanVlbGljaC5kZQ==