 Adrian O. Stec1‡
 Pudota B. Bhaskar1†‡ Yung-Tsi Bolon1
 Rebecca Nolan2,3†
 Randy C. Shoemaker2,3 Carroll P. Vance1,4
 Robert M. Stupar1*
- 1Department of Agronomy and Plant Genetics, University of Minnesota, Saint Paul, MN, USA
- 2Department of Agronomy, Iowa State University, Ames, IA, USA
- 3Corn Insects and Crop Genetics Research Unit, Agricultural Research Service, United States Department of Agriculture, Ames, IA, USA
- 4Plant Research Unit, Agricultural Research Service, United States Department of Agriculture, Saint Paul, MN, USA
Near isogenic lines (NILs) are a critical genetic resource for the soybean research community. The ability to identify and characterize the genes driving the phenotypic differences between NILs is limited by the degree to which differential genetic introgressions can be resolved. Furthermore, the genetic heterogeneity extant among NIL sub-lines is an unaddressed research topic that might have implications for how genomic and phenotypic data from NILs are utilized. In this study, a recently developed high-resolution comparative genomic hybridization (CGH) platform was used to investigate the structure and diversity of genetic introgressions in two classical soybean NIL populations, respectively varying in protein content and iron deficiency chlorosis (IDC) susceptibility. There were three objectives: assess the capacity for CGH to resolve genomic introgressions, identify introgressions that are heterogeneous among NIL sub-lines, and associate heterogeneous introgressions with susceptibility to IDC. Using the CGH approach, introgression boundaries were refined and previously unknown introgressions were revealed. Furthermore, heterogeneous introgressions were identified within seven sub-lines of the IDC NIL “IsoClark.” This included three distinct introgression haplotypes linked to the major iron susceptible locus on chromosome 03. A phenotypic assessment of the seven sub-lines did not reveal any differences in IDC susceptibility, indicating that the genetic heterogeneity among the lines does not have a significant impact on the primary NIL phenotype.
Introduction
The soybean (Glycine max) research community has developed valuable new molecular and genomic resources in recent years. Foremost among these was the public release of the genome sequence, assembled from the reference cultivar “Williams 82” (Schmutz et al., 2010). The genome sequence facilitated the development of additional genomics platforms, including new simple sequence repeat (SSR) panels, single nucleotide polymorphism (SNP) arrays, gene expression arrays, and resequencing-based genotyping methodologies (Hyten et al., 2010; Lam et al., 2010; Song et al., 2010; Varala et al., 2011; Le et al., 2012). While most of the developments have focused on high-throughput resolution of single nucleotide changes, a comparative genomic hybridization (CGH) microarray was also developed to detect larger structural genomic changes, such as deletions and duplications. This CGH platform has been utilized for detecting natural and induced genomic variants for a sub-set of interesting soybean accessions and mutant lines (Bolon et al., 2011; Haun et al., 2011; McHale et al., 2012).
Just as the genomic tools available to soybean researchers have been rapidly expanding in recent years, the expansion of soybean genetic resources has continued, but at a more modest rate. As such, the newer genomic tools have been used to address long-standing questions that are relevant to the community (i.e., enabling researchers to reassess old questions in new ways). One of the great long-standing genetic resources available to the soybean community is a large collection of near isogenic lines (NILs), developed decades ago, that exhibit variation for an extensive suite of traits (Bernard, 1975; Bernard et al., 1991).
Previous work on the physical mapping of genetic introgressions in soybean NILs found that expression arrays, SNP panels, and resequencing approaches were complementary in resolving the introgression boundaries (Severin et al., 2010). More specifically, Severin et al. (2010) identified seven introgression differences between cultivar “Clark” and its NIL “IsoClark.” “IsoClark” was developed by backcrossing susceptibility to iron deficiency chlorosis (IDC) traits from the donor line “T203” into the “Clark” genetic background. In this study, we were interested in adding another layer to this analysis, by exploring the genomic structural variants that are introgressed in soybean NIL stocks. Previous work in maize used CGH data on a panel of NILs to discover and validate quantitative trait loci (QTL) for plant height variation (Eichten et al., 2011), thereby demonstrating that structural variants can be used as high-resolution genetic markers for introgression mapping. Our first goal in this study was to use CGH polymorphisms as genetic markers to better resolve soybean NIL introgression boundaries, in both the “Clark” – “IsoClark” IDC NIL pair and a distinct seed protein NIL pair. Furthermore, we sought to identify genetic heterogeneity among “IsoClark” sub-lines and explore the possible relationship between sub-line variation and IDC susceptibility.
Results
High-Resolution Mapping of Genomic Introgressions in Seed Protein Near Isogenic Lines
The HiPro and LoPro NILs were derived by introgressing a portion of the Glycine soja genome into a soybean background. As their names suggest, the HiPro line exhibits a higher seed protein content than the LoPro line (Nichols et al., 2006; Bolon et al., 2010). These lines have been previously genotyped using SNP and resequencing approaches, identifying large differential introgressions on chromosomes 18 and 20, and a small differential introgression on chromosome 16 (Severin et al., 2010). Since the introgressions are donated from G. soja, we reasoned that they would exhibit profound structural variation compared to Glycine max at these loci, and may reveal introgressions that have not been identified to date.
We used the 700-k CGH microarray (Haun et al., 2011) to profile the structural difference between HiPro and LoPro (Figure 1). While the introgression on chromosome 16 was not detected using this approach (it is estimated to be only ∼10 kb), the differential introgressions on chromosomes 18 and 20 were clearly visible. Furthermore, the density of the polymorphic features in these regions allowed for a higher resolution estimate of the introgression positions than have been previously obtained. In effect, the CGH data expanded the estimated introgression regions by 1.20 and 1.74 Mb, respectively (Table 1). These findings indicated that CGH analyses can be used to further resolve the genomic positioning and structure of donor introgressions.
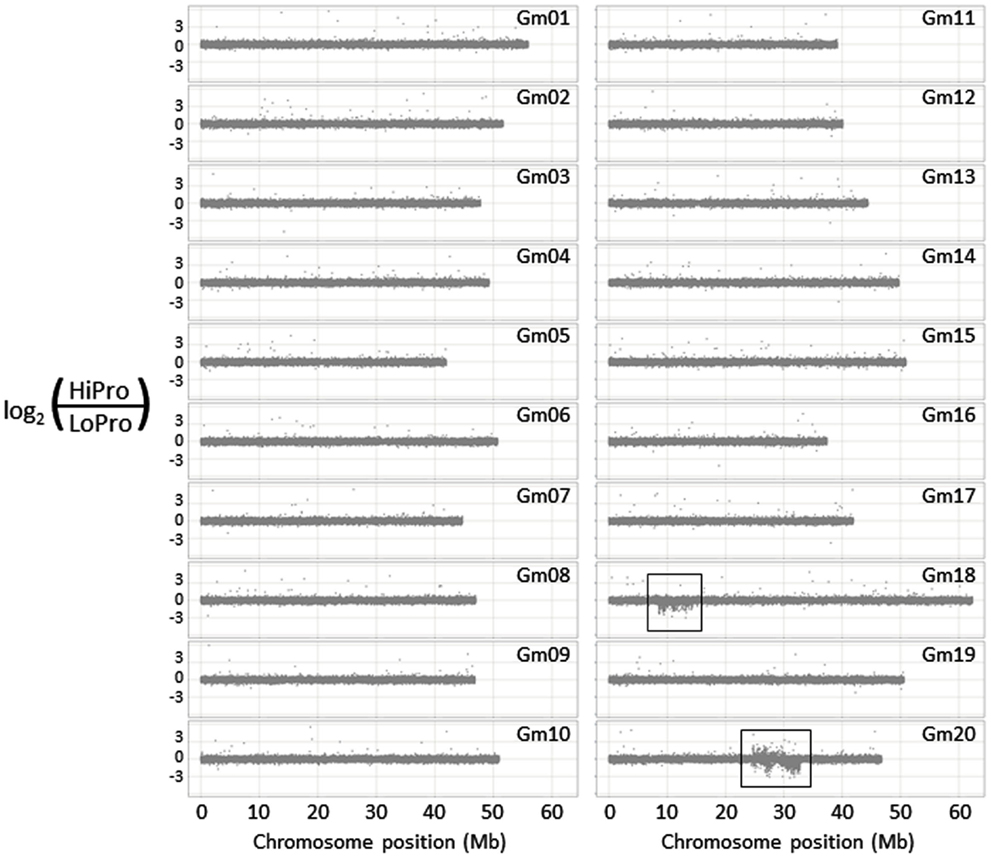
Figure 1. Structural genomic analysis of the HiPro versus LoPro near isogenic lines. Two conspicuous polymorphic regions are visible on chromosomes 18 and 20 (boxed regions), corresponding to previously identified loci.
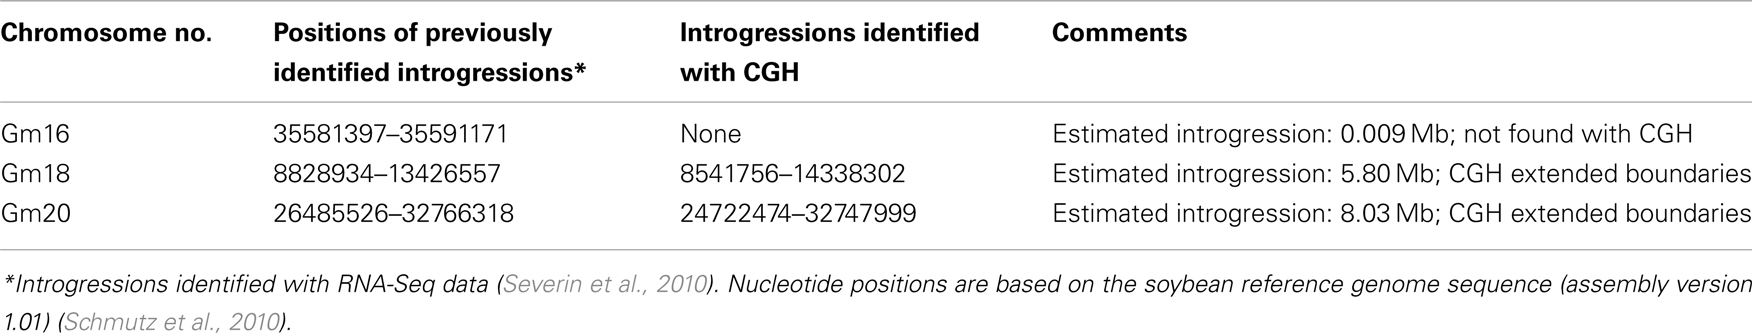
Table 1. Comparison of differential G. soja introgression sites among the HiPro and LoPro NILs.
Diversity of Genomic Introgressions for Sub-Lines of Iron Deficiency Chlorosis NILs
The iron susceptible genotype “T203” was previously backcrossed into the iron-tolerant “Clark” genetic background to form a NIL, called “IsoClark,” with enhanced iron susceptibility. The “Clark” – “IsoClark” NIL pair has been extensively characterized at the genomic, transcriptomic, and phenotypic levels to elucidate the genetic mechanisms that underlie IDC. However, all studies to date have presented the analysis of a single “IsoClark” line, without considering the possibility that genetically distinct sub-lines may exist within the “IsoClark” population.
We used CGH with an updated 1.3-million feature long-oligo microarray to scan the genetic differences that may be present among seven “IsoClark” individuals (the seven sub-lines were renamed IsoClark 1, IsoClark 2, and so on). “Clark” was labeled as the common Cy5 reference in each experiment, with each “IsoClark” individual labeled with Cy3. The “T203” parental line was also hybridized with the “Clark” reference to determine the structural genomic differences between the parental lines. “T203” introgressions in “IsoClark” individuals were identified on chromosomes 03, 04, 05, 08, 09, 13, 14, and 16 (Table 2). While most of these introgressions were previously found using other methods, this was the first identification of the chromosome 09 and 14 introgressions. Furthermore, the mapped regions for several of the introgression boundaries were better resolved using the CGH method (Table 2).
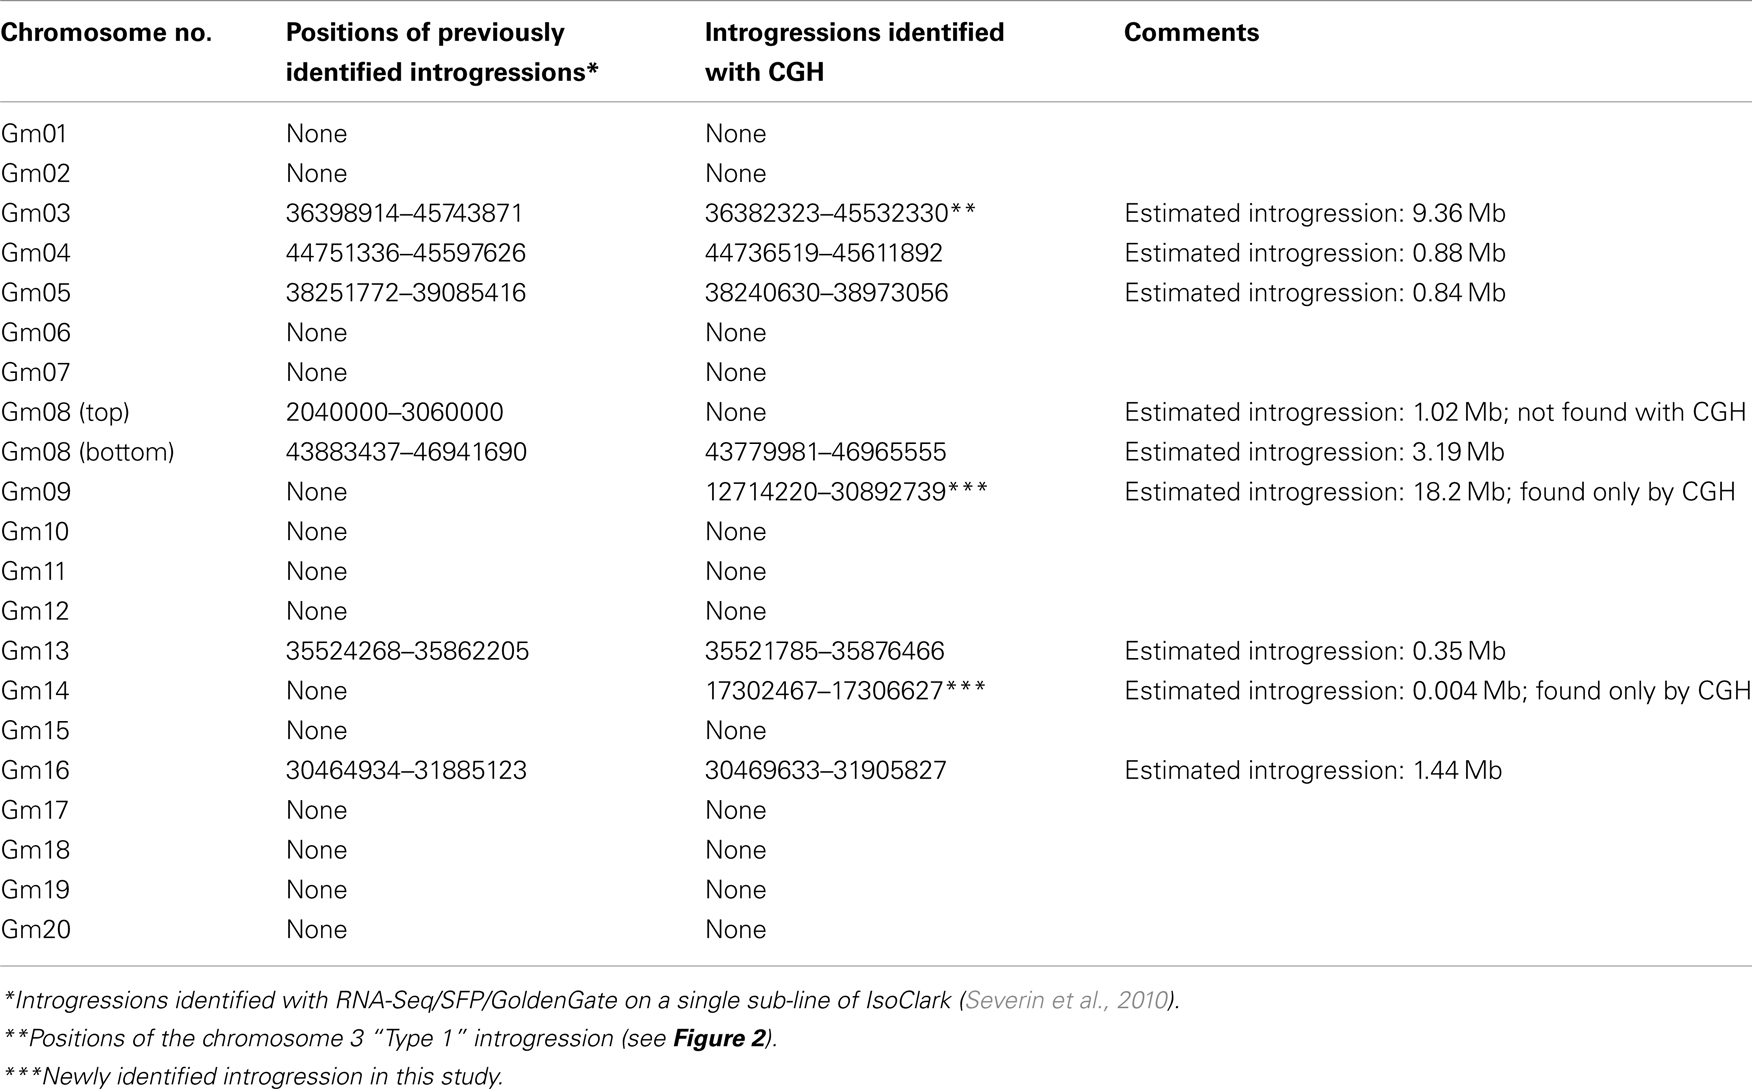
Table 2. Comparison of introgression sites and CNV boundaries among IsoClark/Clark lines using CGH and other approaches.
The seven different “IsoClark” sub-lines exhibited some chromosomes with uniformity among the individuals, and some chromosomes with differential introgressions among the individuals (Table 3). All seven “IsoClark” sub-lines exhibited introgressions on chromosomes 04, 13, 14, and 16, while only a sub-set exhibited introgressions on chromosomes 05, 08, and 09 (Figure S1 in Supplementary Material). Only two “IsoClark” sub-lines (#1 and #6) exhibited identical introgression profiles, indicating that there are at least six genetically distinct “IsoClark” sub-lines in the population.
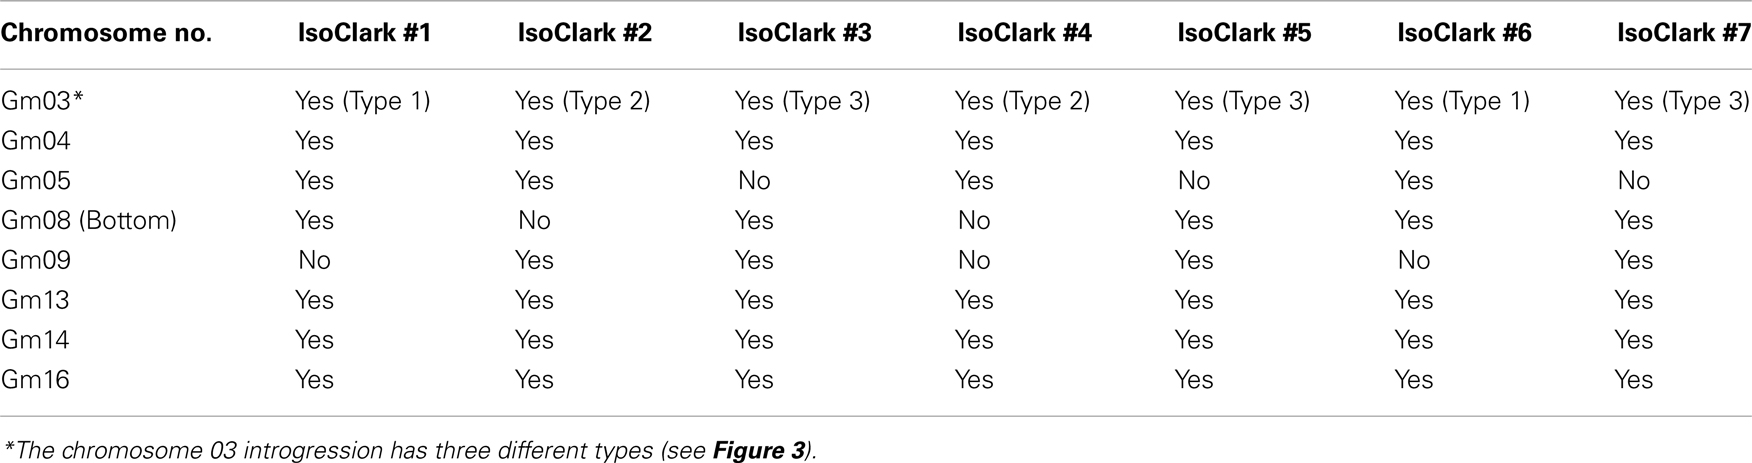
Table 3. Frequency and presence of introgressed regions within seven sub-lines of IsoClark.
Particularly interesting introgression patterns were observed on chromosome 03. While all seven “IsoClark” sub-lines exhibited introgressions on chromosome 03, three different forms were observed (Figure 2). Two sub-lines (#1 and #6) exhibited a substantially larger introgression that the others. Furthermore, the smaller introgression was found to be either continuous (#2 and #4) or interrupted (#3, #5, and #7) by the “Clark” haplotype around position 41 Mb. The interruption of the “Clark” DNA, presumably caused by additional recombination events within this haplotype, was further confirmed by SNP genotyping calls on these sub-lines (Figure 3).
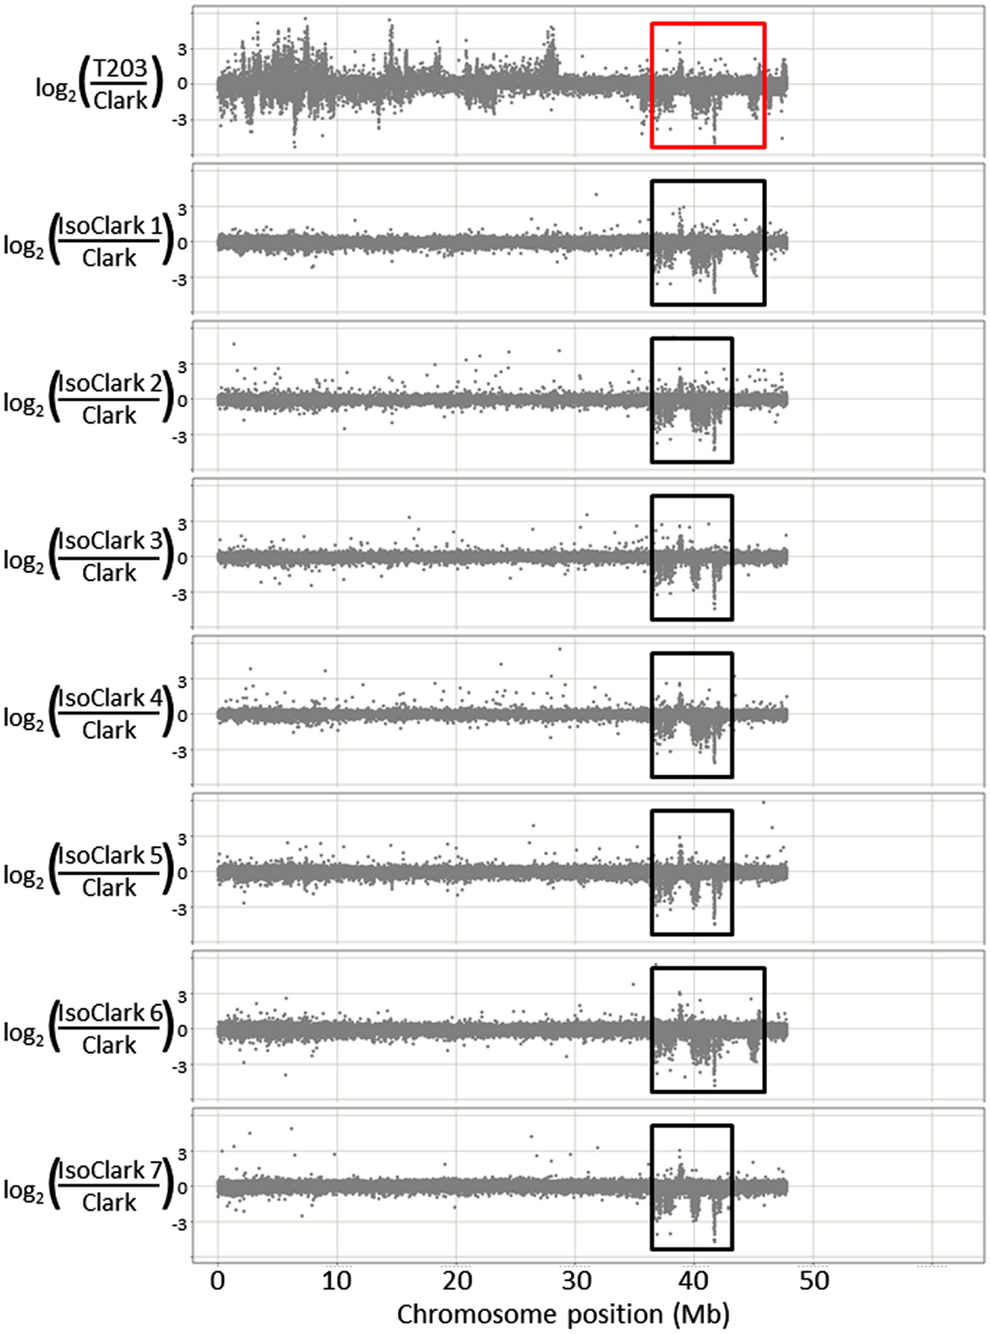
Figure 2. Genomic structural variation on chromosome 03 for seven different “IsoClark” NILs.
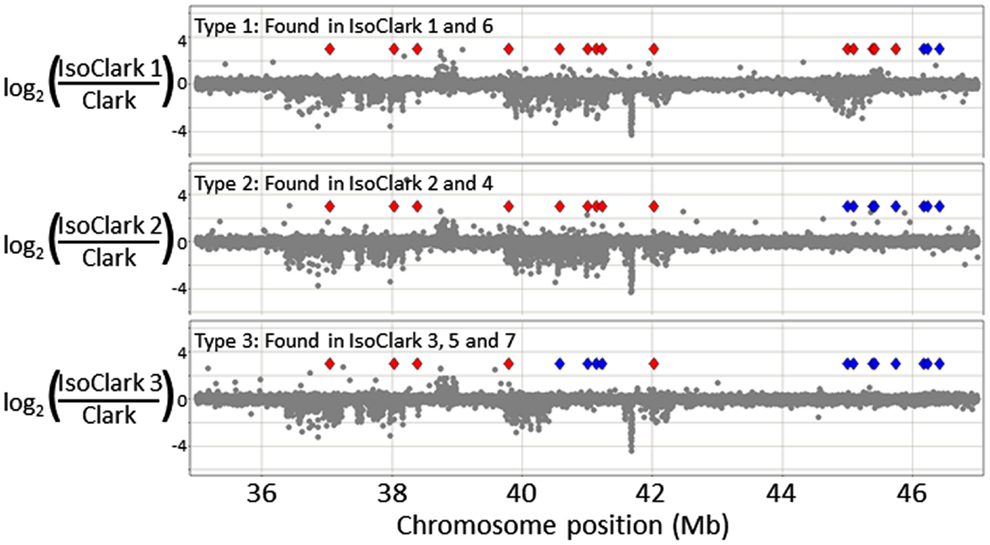
Figure 3. A detailed view of thee different “IsoClark” introgressions on chromosome 03. The CGH data is shown as gray spots. Diamonds represent the positions of SNP markers in this region: red diamonds indicate SNPs matching the “T203” haplotype, while blue diamonds indicate SNPs matching the “Clark” haplotype. As expected, the introgressed “T203” regions exhibit structural variation (UpCNV and DownCNV) relative to the “Clark” control. Haplotype 1 (top) appears to be a continuous ∼10 Mb introgression of “T203,” haplotype 2 appears to be a smaller (∼6–8 Mb) introgression, and haplotype three appears to be a quadruple recombinant where part of the introgression is interrupted by the “Clark” haplotype (at position ∼41 Mb).
Phenotypic Assessment of Iron Deficiency Traits in the Different “IsoClark” Sub-Lines
The “IsoClark” sub-lines displayed genetic heterogeneity on some chromosomes, posing the question of whether the different “T203” introgressions result in differences in IDC susceptibility. We grew the seven “IsoClark” sub-lines, along with the “Clark” and “T203” controls, in the greenhouse under hydroponic conditions to test for IDC responses under limited iron conditions as previously described (O’Rourke et al., 2007). Differential yellowing in the foliage was clearly observed among the plants (Figures 4A,B). Yellowing was scored both visually and with a SPAD meter at three different time points early in development (Figure 4C). As expected, the “IsoClark” sub-lines exhibited more yellowing than “Clark,” but less yellowing than “T203,” during the earliest developmental stage. In the subsequent two time points, the “IsoClark” sub-lines exhibited a phenotype similar to “Clark,” while “T203” continued to show the greatest degree of yellowing. Importantly, our data indicate that the seven “IsoClark” sub-lines were similar across all time points using both the visual and SPAD measurements. The different genetic introgressions among the seven sub-lines apparently did not have a major influence on the IDC phenotype, suggesting that the introgressed susceptibility loci are present in all seven “IsoClark” individuals.
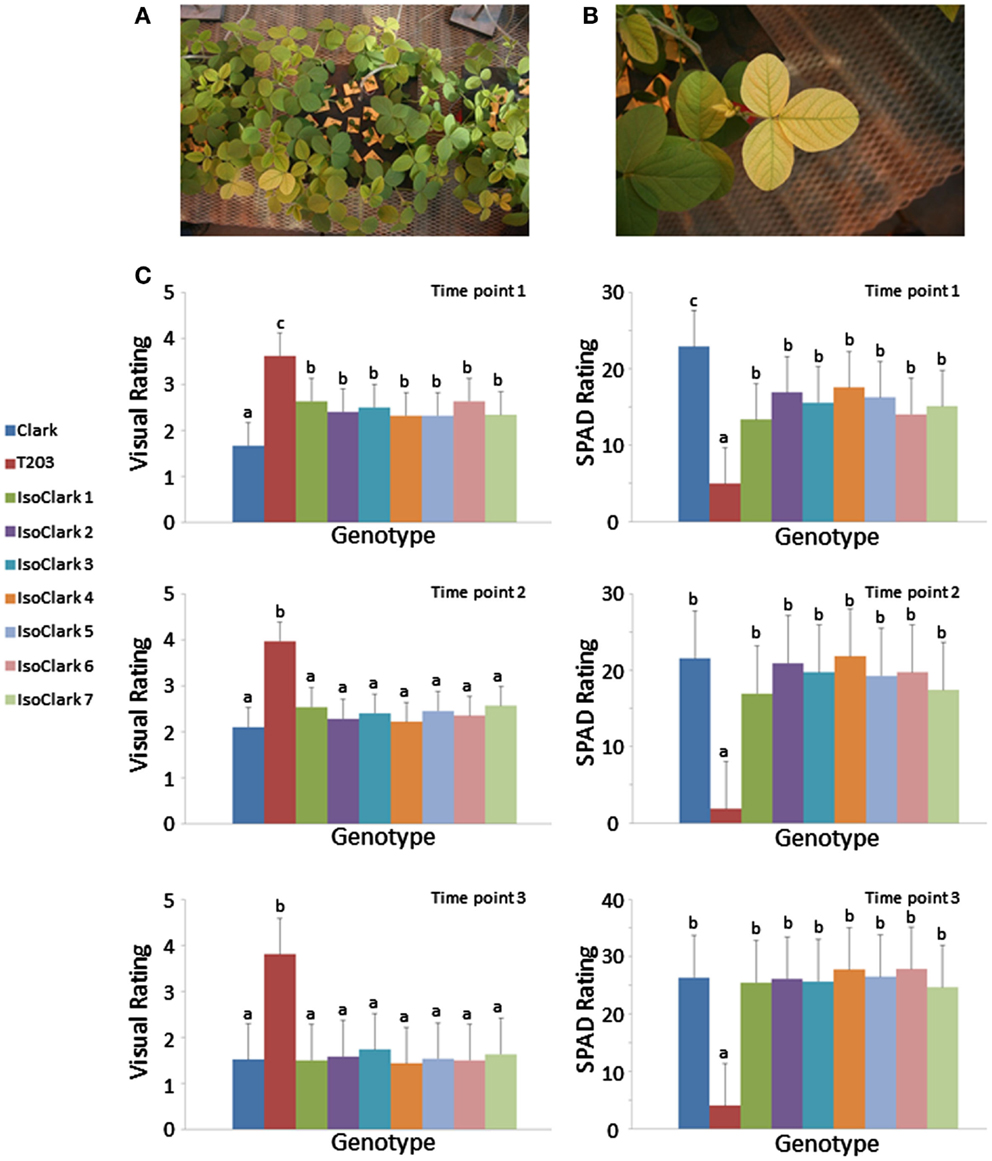
Figure 4. Yellowing responses of the “IsoClark” sub-lines to hydroponic treatments of limited iron. (A) All nine genotypes (including “Clark” and “T203” control) were grown together within each treatment unit. (B) Conspicuous yellowing of a “T203” trifoliate. (C) Mean separation (LSD) for phenotypes as scored by visual ratings and SPAD measurements over three time points. Letters a, b, c, indicate when treatment means are in significantly different groups.
Discussion
Technical Considerations: Resolution and Newly Discovered Introgressions in Soybean NILs
The best previous assessments of genetic introgression in the soybean “Clark” – “IsoClark” isolines relied on SNP-based platforms, ranging from a pre-ascertained set of 1,536 markers to an RNA-Seq approach which identified hundreds of markers specifically within the introgressed regions (Severin et al., 2010). It has been shown that a combination of the different marker systems complemented one another, resulting in increased resolution of introgression events and boundaries. In this study, we expand upon this finding, as the CGH microarray platform identified introgressions that had previously not been detected in “IsoClark,” and further resolved the introgression boundaries of the known introgressions in “IsoClark” and the HiPro – LoPro NIL pair.
Most strikingly, the CGH analysis revealed a putative ∼18.2 Mb introgression on “IsoClark” chromosome 09 that had been previously undetected. At first glance, it may seem improbable that such a large introgression would have previously escaped detection. However, the chromosome 09 introgression is heterogeneous among “IsoClark” sub-lines. Furthermore, the previous study that most aggressively genotyped “IsoClark” (Severin et al., 2010) utilized a sub-line (renamed here as IsoClark 1) that lacked this particular introgression. However, assaying seven sub-lines with a high density 1.3-million feature CGH platform revealed that this introgression is found in a sub-set of the “IsoClark” individuals.
One other previously undetected “IsoClark” introgression event, on chromosome 14, was detected in this study. The situation at this locus is very different than the chromosome 09 locus. The chromosome 09 introgression is large and heterogeneous among sub-lines, while the chromosome 14 introgression appears to be small and homogenous (always present) among the sub-lines, exhibiting a prominent single CGH peak. It is not surprising that this event has been previously undetected, due to the small size of the introgression. However, as stated above, the high density of the CGH microarray enabled this discovery. These data further confirm the value of using high density marker platforms to detect genetic polymorphisms that are generally recalcitrant to identification.
Genetic Considerations: Implications for Gene Discovery in the IDC NILs
It has long been known from mapping studies using multiple populations that a major QTL for IDC maps to soybean chromosome 03 (Lin et al., 1997, 2000). The “Clark” – “IsoClark” NIL pair has been a model for dissecting the genetic and molecular variation that is associated with this chromosome 03 QTL. While the physical mapping of the “T203” genetic introgression has provided a roadmap for this locus (Severin et al., 2010), transcriptome-based studies have provided further insights into the gene expression reprogramming that accompanies the IDC differences in the NIL pair (O’Rourke et al., 2007, 2009). The introgression and transcription data suggest that the IDC difference may be conferred by a transcription factor within the chromosome 03 introgression. Furthermore, recent genetic fine-mapping of the “Clark” – “IsoClark” NIL pair indicates that the major QTL conferring the differential IDC responses in this material resides within a specific region of the chromosome 03 introgression (Peiffer et al., 2012). Peiffer et al. (2012) recently proposed that the IDC intolerance of certain soybean lines (including “T203” and “IsoClark”) may be caused by a 12-bp deletion in the second exon of a Fe-DEFICIENCY-INDUCED TRANSCRIPTION FACTOR (Glyma03g28610) that affects the induction of iron acquisition genes.
While the seven “IsoClark” sub-lines used in this study revealed three different chromosome 03 haplotypes, all forms included the mapped IDC locus and the accompanying candidate gene. Furthermore, while it was tempting to hypothesize that the genetic background differences between the seven sub-lines may influence the IDC trait, the phenotyping analyses performed in this study did not identify any statistical difference between the seven individuals. Therefore, our data offer further evidence that the major “IsoClark” IDC QTL may be conferred by this single chromosome 03 locus, and perhaps by a single gene.
Materials and Methods
Plant Materials
Two sets of soybean (Glycine max) NILs were obtained for comparative analyses. The HiPro – LoPro NIL pair was derived from introgressing G. soja (PI468916) DNA into soybean (A81-356022) and has been previously described (Nichols et al., 2006; Bolon et al., 2010; Severin et al., 2010). The IDC “IsoClark” NIL (PI 547430) was derived from backcrossing an iron susceptible locus from soybean line “T203” (PI 54619) into the “Clark” (PI 548533) genetic background (Bernard et al., 1991). Four of the seven “IsoClark” sub-lines (#1, #2, #3, and #6) used for this study were derived from a single packet of seed obtained from Iowa State University, which had been previously harvested from a bulked seed increase. The remaining three “IsoClark” sub-lines were derived from seeds harvested from a bulked seed increase at the University of Minnesota in 2009 and 2010; however, the original source of these sub-lines is undocumented. The “Clark,” “T203” genotypes, and the IsoClark 1 sub-line were used for genotyping in a previous study (Severin et al., 2010).
To prepare the samples for CGH analysis, seeds for the above described lines were planted in individual 4′′ pots containing a 50:50 mix of sterilized soil and Metro Mix and grown under standard greenhouse conditions. Young trifoliate leaves from 3-week-old plants were harvested and immediately frozen in liquid nitrogen. Frozen leaf tissue was ground with a mortar and pestle with liquid nitrogen. DNA was extracted from ∼100 mg of ground tissue using the Qiagen Plant DNeasy Mini Kit according to the manufacturer’s protocol (including an RNA degradation step). DNA was quantified on a NanoDrop spectrophotometer.
Comparative Genomic Hybridization and SNP Data Analysis
Comparative genomic hybridization for the HiPro – LoPro comparison was performed as described (Haun et al., 2011) on the NimbleGen soybean CGH 700 k microarray, which consists of 696,139 unique oligonucleotide probes (50–75 m) designed from the reference “Williams 82” sequence (assembly version 1.01) (Schmutz et al., 2010) and placed at ∼1.1 kb intervals. The HiPro individual was labeled with Cy3 and the LoPro individual was labeled with Cy5. The segMNT algorithm in the NimbleScan software (version 2.5) was used to extract the raw data and make segmentation calls. The parameters of the algorithm were as follows: minimum segment difference = 0.1, minimum segment length (number of probes) = 2, acceptance percentile = 0.99, number of permutations = 10, non-unique probes were included, and spatial correction and qspline normalization were applied. The log2 ratio between the HiPro and LoPro signal for each probe were computed and visual displays of the CGH data were generated using Spotfire DecisionSite software. An approximation of the introgression boundaries were inferred from visual examination of the log2 plots.
The “Clark” – “IsoClark” CGH experiments were conducted on an updated 1.3-million feature NimbleGen soybean CGH microarray. This microarray consists of 1,344,283 unique oligonucleotide probes (50–75 nucleotides) also designed from the reference soybean genome sequence (assembly version 1.01) (Schmutz et al., 2010). The probes are placed at a median interval of ∼500 bp between probes. The “T203” and “IsoClark” individuals were labeled with Cy3 and the “Clark” individual was labeled with Cy5 (the Cy5 “Clark” samples served as the common reference for all hybridizations). The segMNT algorithm in the NimbleScan software (version 2.5) was used to extract the raw data and make segmentation calls, with the same parameters as described above for the HiPro – LoPro comparison. The log2 ratio between the Cy3 genotype and “Clark” were computed and visual displays of the CGH data were generated using Spotfire DecisionSite software. An approximation of the introgression boundaries were inferred from visual examination of the log2 plots.
Genotyping of “Clark,” “T203,” and the seven “IsoClark” sub-lines was performed using the Illumina 1,536 SNP platform for soybean (Hyten et al., 2010). The DNA samples were processed at the University of Minnesota BioMedical Genomics Center.
Phenotyping of IDC Traits in Hydroponic Conditions
Iron deficiency chlorosis phenotyping in iron limited conditions essentially used the hydroponic methodology that has been previously described (O’Rourke et al., 2007; Peiffer et al., 2012). Briefly, the seeds were started on moist germination paper and transferred to hydroponic solutions after 6 days. The plants were grown in 10 L buckets under greenhouse conditions in an iron deficient hydroponic solution containing 50 μm Fe(NO3)3·9H2O (the full hydroponic formulation and detailed growth conditions are provided in previously published work (Peiffer et al., 2012)). The greenhouse photoperiod was 16 h of light and 8 h of dark. Each of six buckets contained 18 plants, with two technical replicates for each genotype (“Clark,” “T203,” and “IsoClark” sub-lines 1–7). Foliage color was scored visually and with a SPAD meter at three different time points. The visual scoring system was based on a previously defined 1–5 scale (Cianzio et al., 1979), and examples of the phenotypic distribution along this spectrum are shown in Figure S2 in Supplementary Material. For Time point 1, the first trifoliate of each plant was scored following 14 days in the hydroponic conditions. For time point 2, the second trifoliate was scored following 18 days in the hydroponic conditions. For Time point 3, the third trifoliate was scored following 22 days in the hydroponic conditions.
For statistical analysis, the two technical replicates per genotype per bucket were averaged to give a replicate value. Therefore, the six buckets were treated as biological replicates for each genotype. We did an Analysis of Variance (Yi,j = μ + Genotypei + ε) to detect significant genotype effects and Fisher’s Least Significant Difference analysis to identify significant differences between individual genotypes.
Accession Numbers
The CGH data from this study have been submitted to the National Center for Biotechnology Information Gene Expression Omnibus (http://www.ncbi.nlm.nih.gov/geo). The comparison involving HiPro and LoPro can be found as accession number GSE44725 and the comparisons involving “Clark,” “T203,” and the “IsoClark” sub-lines are under accession number GSE44789.
Conflict of Interest Statement
The authors declare that the research was conducted in the absence of any commercial or financial relationships that could be construed as a potential conflict of interest.
Acknowledgments
We are grateful to Gregory Peiffer for contributing his expertise to the hydroponic phenotyping. We are also grateful to Michael Kantar, Justin Anderson, and Thomas Kono for contributing statistical and computing expertise to this project. We thank the University of Minnesota BioMedical Genomics Center for processing the GoldenGate SNP assays. This work was supported by the United Soybean Board (project #1320-532-5688) and the North Central Soybean Research Program (project #FAR-0020127).
Supplementary Material
The Supplementary Material for this article can be found online at http://www.frontiersin.org/Plant_Genetics_and_Genomics/10.3389/fpls.2013.00104/abstract
Figure S1. “T203” introgressions in seven “IsoClark” sub-lines on chromosomes 04, 05, 08, 09, 13, 14, and 16.
Figure S2. Examples of the 1–5 scale used for the visual scoring of IDC in the hydroponic treatments.
References
Bernard, R. L., Nelson, R. L., and Cremeens, C. R. (1991). USDA soybean genetic collection: isoline collection. Soyb. Genet. Newsl. 18, 27–57.
Bolon, Y. T., Haun, W. J., Xu, W. W., Grant, D., Stacey, M. G., Nelson, R. T., et al. (2011). Phenotypic and genomic analyses of a fast neutron mutant population resource in soybean. Plant Physiol. 156, 240–253.
Bolon, Y. T., Joseph, B., Cannon, S. B., Graham, M. A., Diers, B. W., Farmer, A. D., et al. (2010). Complementary genetic and genomic approaches help characterize the linkage group I seed protein QTL in soybean. BMC Plant Biol. 10:41. doi:10.1186/1471-2229-10-41
Cianzio, S. R. D., Fehr, W. R., and Anderson, I. C. (1979). Genotypic evaluation for iron-deficiency chlorosis in soybeans by visual scores and chlorophyll concentration. Crop Sci. 19, 644–646.
Eichten, S. R., Foerster, J. M., de Leon, N., Kai, Y., Yeh, C. T., Liu, S., et al. (2011). B73-Mo17 near-isogenic lines demonstrate dispersed structural variation in maize. Plant Physiol. 156, 1679–1690.
Haun, W. J., Hyten, D. L., Xu, W. W., Gerhardt, D. J., Albert, T. J., Richmond, T., et al. (2011). The composition and origins of genomic variation among individuals of the soybean reference cultivar Williams 82. Plant Physiol. 155, 645–655.
Hyten, D. L., Choi, I. Y., Song, Q. J., Specht, J. E., Carter, T. E., Shoemaker, R. C., et al. (2010). A high density integrated genetic linkage map of soybean and the development of a 1536 universal soy linkage panel for quantitative trait locus mapping. Crop Sci. 50, 960–968.
Lam, H. M., Xu, X., Liu, X., Chen, W., Yang, G., Wong, F. L., et al. (2010). Resequencing of 31 wild and cultivated soybean genomes identifies patterns of genetic diversity and selection. Nat. Genet. 42, 1053–1059.
Le, D. T., Nishiyama, R., Watanabe, Y., Tanaka, M., Seki, M., Ham le, H., et al. (2012). Differential gene expression in soybean leaf tissues at late developmental stages under drought stress revealed by genome-wide transcriptome analysis. PLoS ONE 7:e49522. doi:10.1371/journal.pone.0049522
Lin, S., Cianzio, S., and Shoemaker, R. (1997). Mapping genetic loci for iron deficiency chlorosis in soybean. Mol. Breed. 3, 219–229.
Lin, S. F., Grant, D., Cianzio, S., and Shoemaker, R. (2000). Molecular characterization of iron deficiency chlorosis in soybean. J. Plant Nutr. 23, 1929–1939.
McHale, L. K., Haun, W. J., Xu, W. W., Bhaskar, P. B., Anderson, J. E., Hyten, D. L., et al. (2012). Structural variants in the soybean genome localize to clusters of biotic stress-response genes. Plant Physiol. 159, 1295–1308.
Nichols, D. M., Glover, K. D., Carlson, S. R., Specht, J. E., and Diers, B. W. (2006). Fine mapping of a seed protein QTL on soybean linkage group I and its correlated effects on agronomic traits. Crop Sci. 46, 834–839.
O’Rourke, J. A., Charlson, D. V., Gonzalez, D. O., Vodkin, L. O., Graham, M. A., Cianzio, S. R., et al. (2007). Microarray analysis of iron deficiency chlorosis in near-isogenic soybean lines. BMC Genomics 8:476. doi:10.1186/1471-2164-8-476
O’Rourke, J. A., Nelson, R. T., Grant, D., Schmutz, J., Grimwood, J., Cannon, S., et al. (2009). Integrating microarray analysis and the soybean genome to understand the soybeans iron deficiency response. BMC Genomics 10:376. doi:10.1186/1471-2164-10-376
Peiffer, G. A., King, K. E., Severin, A. J., May, G. D., Cianzio, S. R., Lin, S. F., et al. (2012). Identification of candidate genes underlying an iron efficiency quantitative trait locus in soybean. Plant Physiol. 158, 1745–1754.
Schmutz, J., Cannon, S. B., Schlueter, J., Ma, J., Mitros, T., Nelson, W., et al. (2010). Genome sequence of the palaeopolyploid soybean. Nature 463, 178–183.
Severin, A. J., Peiffer, G. A., Xu, W. W., Hyten, D. L., Bucciarelli, B., O’Rourke, J. A., et al. (2010). An integrative approach to genomic introgression mapping. Plant Physiol. 154, 3–12.
Song, Q. J., Jia, G. F., Zhu, Y. L., Grant, D., Nelson, R. T., Hwang, E. Y., et al. (2010). Abundance of SSR motifs and development of candidate polymorphic SSR markers (BARCSOYSSR_1.0) in soybean. Crop Sci. 50, 1950–1960.
Keywords: soybean, NIL, CGH, iron, heterogeneity
Citation: Stec AO, Bhaskar PB, Bolon Y-T, Nolan R, Shoemaker RC, Vance CP and Stupar RM (2013) Genomic heterogeneity and structural variation in soybean near isogenic lines. Front. Plant Sci. 4:104. doi: 10.3389/fpls.2013.00104
Received: 05 March 2013; Paper pending published: 03 April 2013;
Accepted: 04 April 2013; Published online: 24 April 2013.
Edited by:
Scott Jackson, University of Georgia, USAReviewed by:
Olivier Panaud, Université de Perpignan VIa Domitia, FranceZhixi Tian, Chinese Academy of Sciences, China
Copyright: © 2013 Stec, Bhaskar, Bolon, Nolan, Shoemaker, Vance and Stupar. This is an open-access article distributed under the terms of the Creative Commons Attribution License, which permits use, distribution and reproduction in other forums, provided the original authors and source are credited and subject to any copyright notices concerning any third-party graphics etc.
*Correspondence: Robert M. Stupar, Department of Agronomy and Plant Genetics, University of Minnesota, 1991 Upper Buford Circle, 411 Borlaug Hall, Saint Paul, MN 55108, USA e-mail:cnN0dXBhckB1bW4uZWR1
†Present address: Pudota B. Bhaskar, Dow AgroSciences LLC, 9330 Zionsville Road, Indianapolis, IN, USA;
Rebecca Nolan, Donald Danforth Plant Science Center, 975 North Warson Road, St. Louis, MO, USA.
‡Adrian O. Stec and Pudota B. Bhaskar have contributed equally to this work.