Abstract
We describe the general background and the recent advances in research on underwater photosynthesis of leaf segments, whole communities, and plant dominated aquatic ecosystems and present contemporary methods tailor made to quantify photosynthesis and carbon fixation under water. The majority of studies of aquatic photosynthesis have been carried out with detached leaves or thalli and this selectiveness influences the perception of the regulation of aquatic photosynthesis. We thus recommend assessing the influence of inorganic carbon and temperature on natural aquatic communities of variable density in addition to studying detached leaves in the scenarios of rising CO2 and temperature. Moreover, a growing number of researchers are interested in tolerance of terrestrial plants during flooding as torrential rains sometimes result in overland floods that inundate terrestrial plants. We propose to undertake studies to elucidate the importance of leaf acclimation of terrestrial plants to facilitate gas exchange and light utilization under water as these acclimations influence underwater photosynthesis as well as internal aeration of plant tissues during submergence.
Knowledge of plant and environmental factors determining photosynthesis by submerged plants is essential for understanding aquatic plant ecophysiology and ecosystem productivity, as well as submergence tolerance of terrestrial plants. Following the pioneering studies by Arens (1933) and Steemann Nielsen (1946) on the use of dissolved inorganic carbon (DIC) for photosynthesis of aquatic plants, numerous studies on the regulatory role of light and DIC for underwater photosynthesis of aquatic plants have been conducted. Particularly, the use of DIC by aquatic plants has fascinated researchers and been reviewed several times (e.g., Madsen and Sand-Jensen, 1991; Maberly and Madsen, 2002; Raven and Hurd, 2012) because this process is important for growth and survival and the uptake mechanisms are very different from those of terrestrial, amphibious, and floating leaved plants exposed to atmospheric air (definitions of these life forms and examples of species are in Sculthorpe (1967)). Since the physical conditions differ markedly between water and air, we have often been approached by researchers asking for practical advice, unavailable in the literature, before engaging in work with underwater photosynthesis. Thus, this review serves to offer the background and a practical guide for measurements of carbon fixation by plants when under water.
Moreover, a growing number of researchers are interested in tolerance of terrestrial plants during flooding (Figure 1A). Torrential rains sometimes result in overland floods that inundate terrestrial plants (Vervuren et al., 2003) and with the current projection on climate change, the frequency of such flooding events are expected to increase (Parry et al., 2007). We therefore predict that research on underwater photosynthesis will extend greatly beyond its current focus on aquatic plants as natural wetlands and many crops will become submerged in future flooding events. Researchers engaging in underwater photosynthesis should be aware that physical restrictions on light availability and gas exchange are much more profound under water than on land (Sand-Jensen and Krause-Jensen, 1997). Moreover, the aquatic sources and mechanisms of inorganic carbon use are complex, difficult to study, and often challenging to fully understand (Madsen and Sand-Jensen, 1991; Raven and Hurd, 2012).
Figure 1
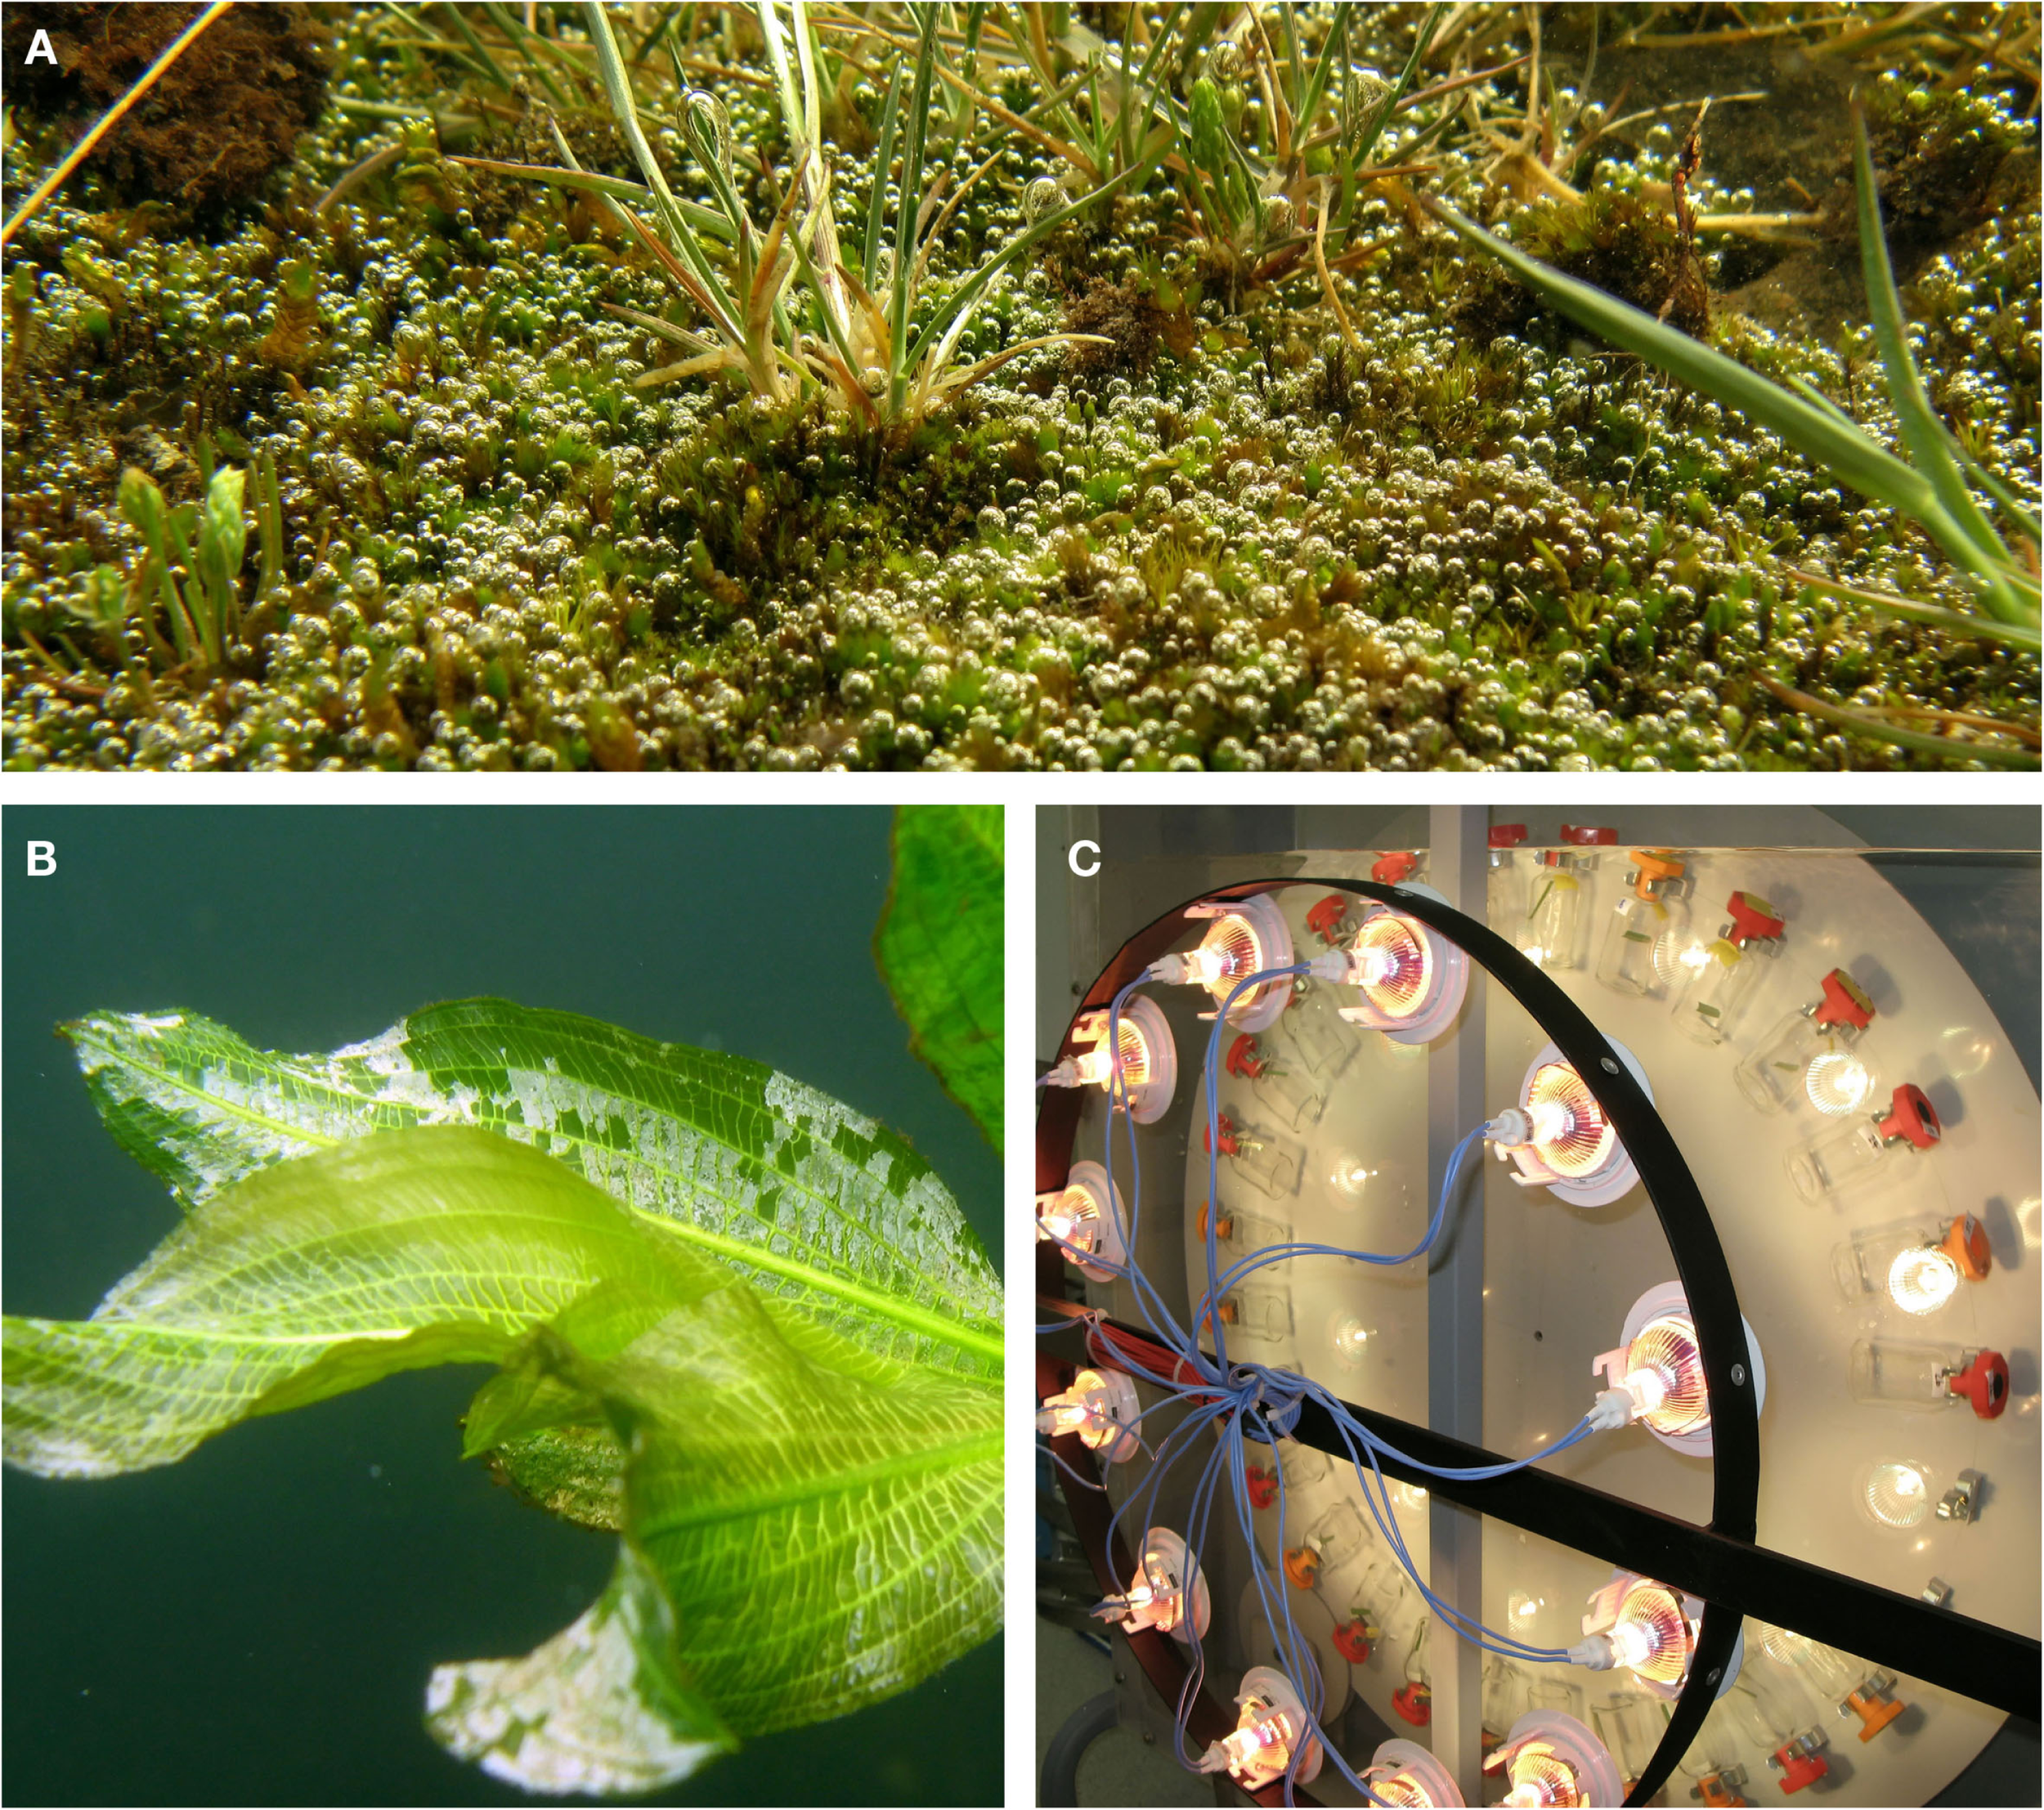
Completely submerged terrestrial vegetation (A), white flakes of CaCO3 on leaves of a pondweed (Potamogeton lucens) (B) and an incubator with a vertically rotating wheel holding vials with leaf segments for measurements of underwater net photosynthesis (C) or dark respiration when in complete darkness. The bubbles on the submerged mosses (A) are obvious signs that underwater photosynthesis takes place with O2 evolution causing the bubble formation. Moreover, the submerged grasses possess superhydrophobic self cleansing leaf surfaces that retain a thin gas film when under water, evident as a silvery reflecting surface. In (B), high pH on the adaxial leaf surfaces following extensive underwater photosynthesis has resulted in precipitation of CaCO3 (See “Challenges Under Water – Reduced Gas Diffusion and Light Penetration”). Photos: a shallow puddle on Öland, Sweden (A), the bicarbonate rich (1.8 mmol DIC L−1) Lake Slåen, Denmark (B) and the custom built wheel incubator by Ray Scott at the University of Western Australia (C); photos by Ole Pedersen.
Photosynthesis provides sugars and O2. The importance of underwater photosynthesis to internal O2 status (Figure 1B), including via internal long-distance transport into roots growing in anoxic sediments, has been demonstrated for aquatic species (e.g., Borum et al., 2005; Sand-Jensen et al., 2005; Holmer et al., 2009; Pedersen et al., 2011) and terrestrial wetland plants when completely submerged (Pedersen et al., 2006; Winkel et al., 2011, 2013). By contrast, during the night submerged plants rely on O2 uptake from the surrounding water to sustain their respiration and belowground organs can suffer from O2 deficiency.
The majority of studies on photosynthesis by submerged aquatic plants have been carried out on detached leaves and algal thalli. These may experience very different environmental conditions than entire communities of submerged plants or plant dominated ecosystems, which have rarely been examined (e.g., Sand-Jensen et al., 2007; Christensen et al., 2013). We thus recommend undertaking studies on communities and ecosystems because they may reveal very different principles of regulation of greater relevance for the ecology and natural performance of submerged aquatic plants, as well as survival of terrestrial species during overland floods.
With the present review, we describe the general background and the recent advances in underwater photosynthesis of phytoelements (shoots, excised thalli, or leaf portions), communities, and plant dominated aquatic ecosystems and present contemporary methods tailor made to quantify photosynthesis and carbon fixation under water.
Underwater Photosynthesis
Challenges under water – reduced gas diffusion and light penetration
The 104-fold lower diffusion coefficient of gases in water, compared with in air, presents a major challenge to submerged plants (Armstrong, 1979; Maberly and Madsen, 2002). Diffusive boundary layers (DBL) develop on all surfaces and their thickness adjacent to leaves in water is of the same order of magnitude as those for leaves in air (Vogel, 1994; Raven and Hurd, 2012). Although the transport distance for gases across the DBL is similar, the much lower diffusion coefficient in water results in a 104-fold lower flux for the same concentration gradient and thus the DBL constitutes a much larger proportion of the total resistance to gas exchange for leaves under water than in air (Maberly and Madsen, 2002). The “bottleneck effect” of the DBL on underwater gas exchange was demonstrated in a study of four submerged aquatic species, where the DBL accounted for 90% of the total resistance to carbon fixation (Black et al., 1981). Hence, inorganic carbon limitation of photosynthesis is a much more common and prominent feature for aquatic than terrestrial leaves (Stirling et al., 1997). On average, the underwater photosynthesis increased threefold in a study of 14 submerged freshwater species at saturating relative to ambient supply of DIC supply (Nielsen and Sand-Jensen, 1989). The immediate acclimation of photosynthesis of five fast growing annual terrestrial species by doubling of atmospheric CO2 was 1.6- to 2.1-fold while the average increase of relative growth rate over 56 day was 1.25-fold and only significant for one of the five species (Stirling et al., 1998).
The restricted gas exchange under water has resulted in evolution of a suite of adaptive features in aquatic leaves and macroalgal thalli to reduce the influence of DBL on the exchange of O2 and CO2, including the supplementary use of (bicarbonate) (Sculthorpe, 1967; Maberly, 1990; Colmer et al., 2011). In seawater and in many freshwaters, the pool of is several fold higher than of CO2 and thus presents an attractive alternative to CO2. Use of has evolved many times among unicellular algae, macroalgae, and angiosperms in freshwater and marine environments (Raven and Hurd, 2012) and can involve direct uptake into the cells or external conversion to CO2 in the DBL catalyzed by surface bound carbonic anhydrase and/or extrusion of protons in acids bands (charophytes; Lucas and Smith, 1973) or lower leaf surfaces in e.g., species of Potamogeton and Elodea (Prins et al., 1980) often with precipitation of CaCO3 on the alkaline upper leaf surfaces (Figure 1B). While the DBL reduces the direct flux to the leaf surface, the “stagnant” layer is required to forming high CO2 concentrations by acid titration of (Helder, 1985). Use of is prominent for marine macroalgae and seagrasses, freshwater charophytes, and in 50% of 80 tested species of freshwater angiosperms (Sand-Jensen and Gordon, 1984; Maberly and Madsen, 2002), but the ability is absent among mosses and pteridophytes. Also 12 amphibious species alternating between emergent and submerged forms in Danish lowland streams relied solely on CO2 use although high concentrations may still benefit photosynthesis by stabilizing pH and permitting rapid uncatalyzed replenishment of the CO2 consumed (Maberly, 1990). The proportion of users among angiosperm species in lakes increases significantly with alkalinity and, thus, availability of (Maberly and Madsen, 2002) in accordance with the increasing advantage of use for photosynthesis and growth. Assuming for simplicity a 10-fold higher apparent preference for CO2 than by leaves in alkaline water containing 0.015 mmol L−1 CO2 and 1.5 mmol L−1, the supply rate of would be 10-fold higher than that of CO2. In softwater containing only 0.15 mmol L−1 the supply rate of the two carbon species would be the same. Terrestrial plant species lack these adaptive features for aquatic life, and when underwater their leaves show dramatically reduced net photosynthesis (Sand-Jensen et al., 1992; Nielsen, 1993) and dark respiration (Colmer and Pedersen, 2008; Pedersen et al., 2009). Thus, 13 terrestrial species submerged in CO2 rich stream water were unable to use and median rates of underwater net photosynthesis were sevenfold lower than of 10 permanently submerged stream plants and the terrestrial species were unable to support substantial growth (Sand-Jensen et al., 1992; Figure 2).
Figure 2
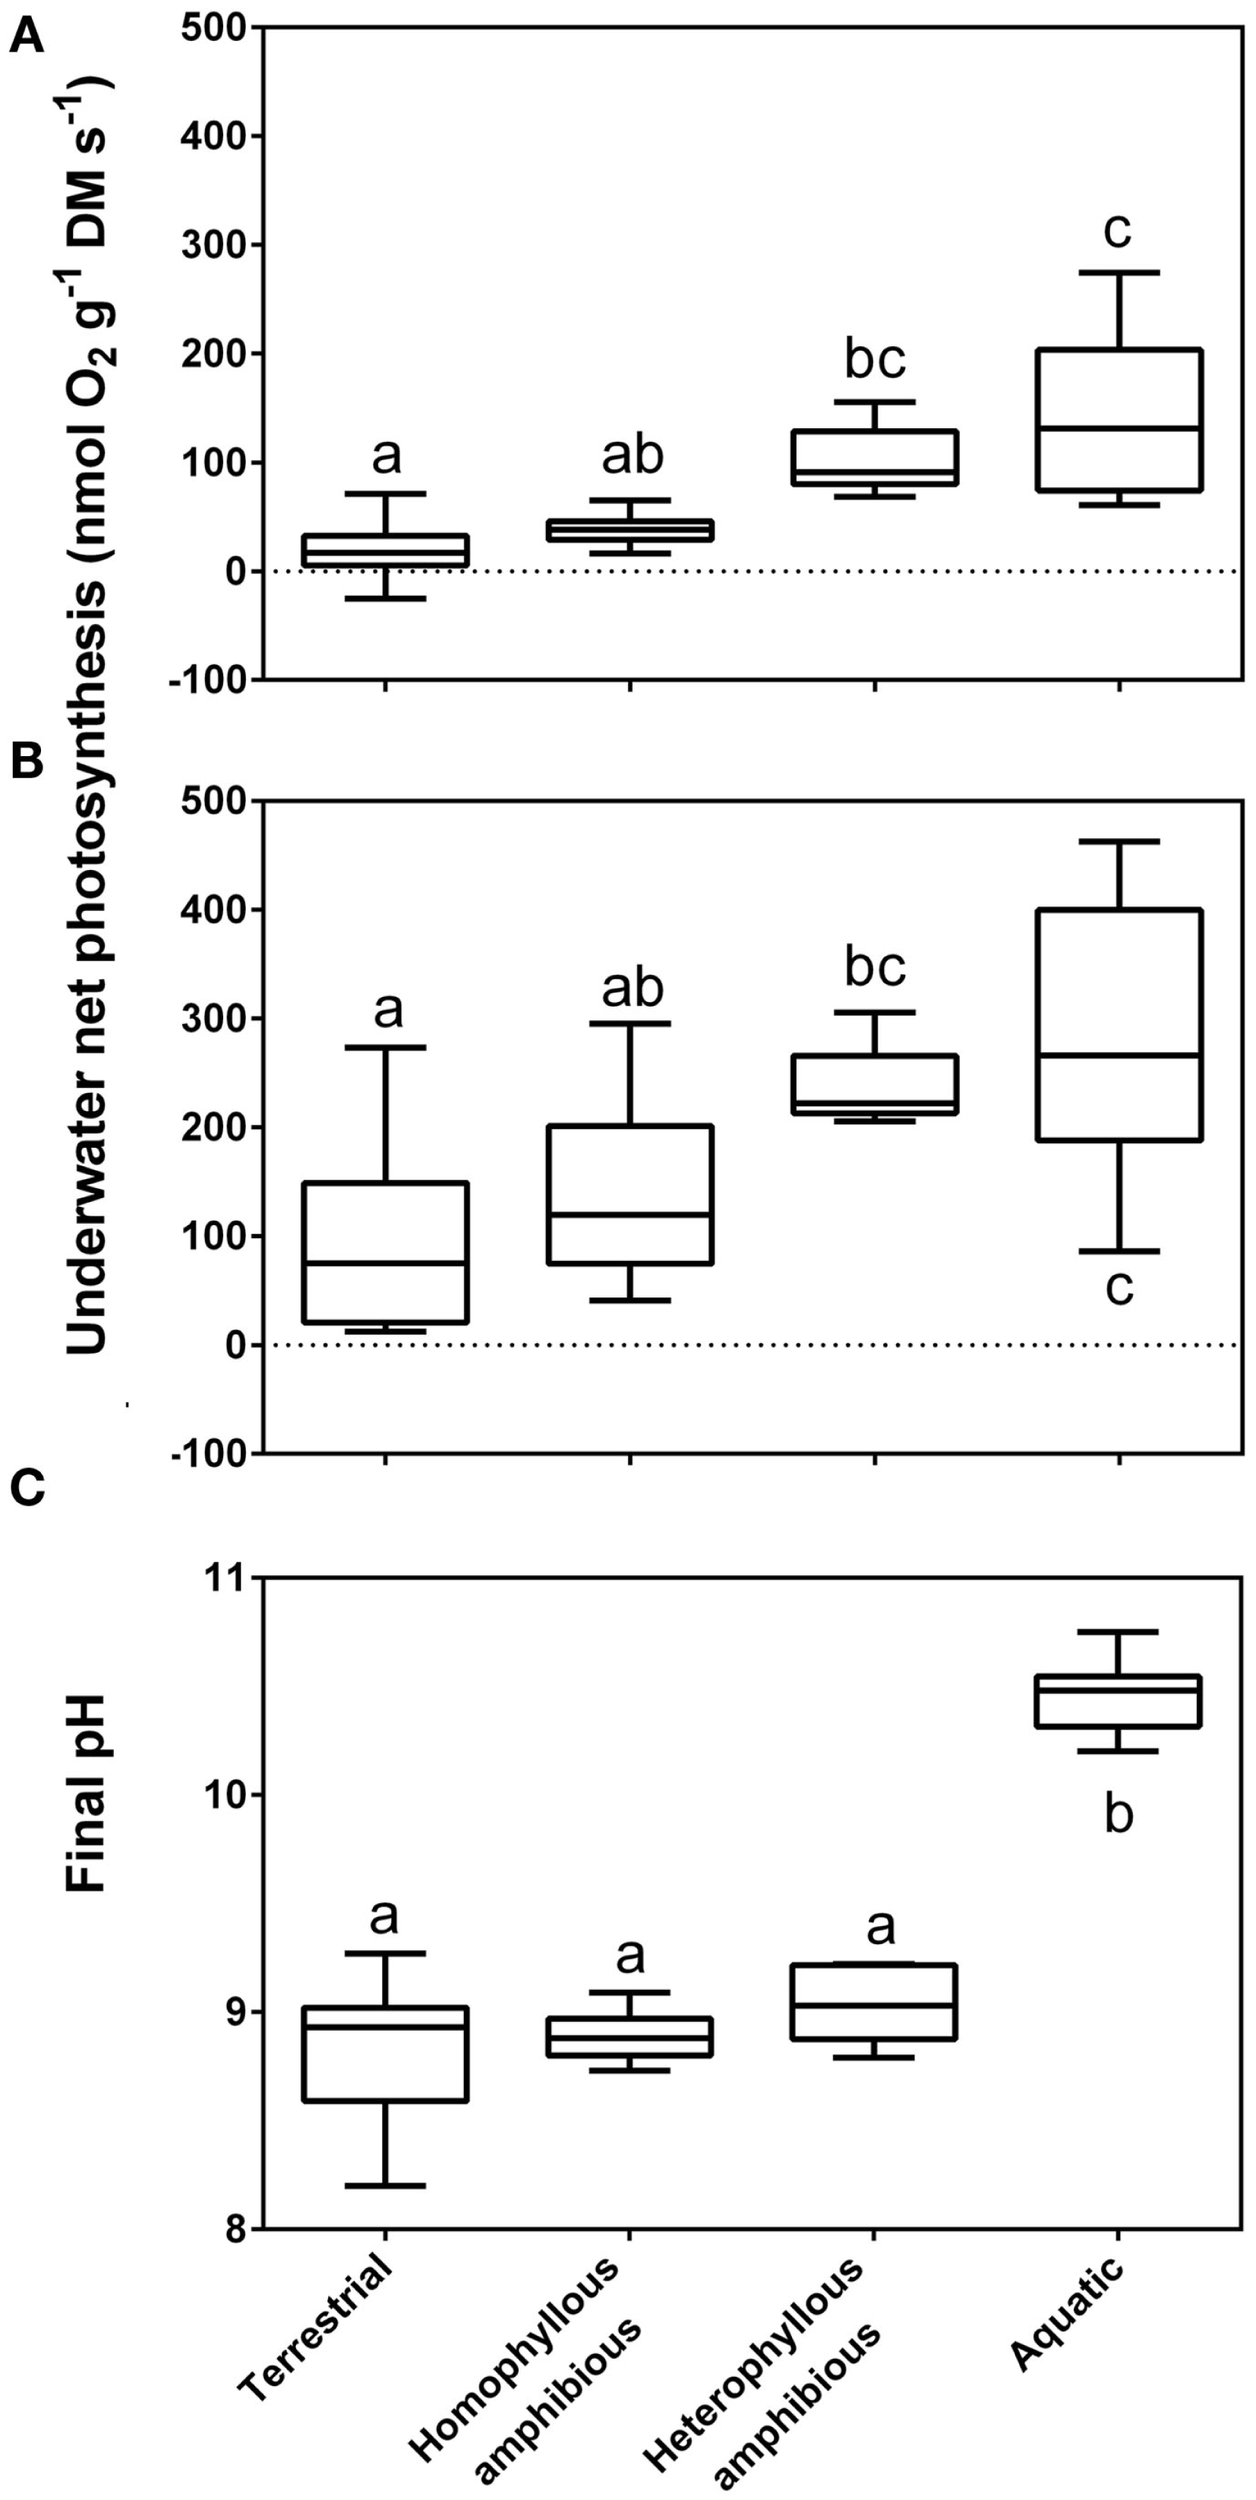
Rates of underwater net photosynthesis (nmol O2 g−1 DM s−1) in ambient [(A), 90–400 μmol CO2 L−1] and CO2 enriched water [(B), 800 μmol CO2 L−1] and final pH from a pH drift experiment; Section “pH Drift Approach to Establish CO2 Compensation Points” (C) in four groups of life forms defined in Sculthorpe (1967). The box whisker plot indicates the range of the observations (bars), 50% of the observations (boxes) and the median (horizontal line). The amount of free CO2 present at median final pH of the four groups was 6.20, 6.00, 4.80, and 0.04 μmol L−1, respectively. Leaves of aquatic plants species (n = 10), heterophyllous amphibious plants (n = 5), homophyllous amphibious plants (n = 7) were all produced under water while leaves of terrestrial plant species were formed in air (n = 12). Letters indicate significant differences (P < 0.05); Tukey test. Data from Sand-Jensen et al. (1992), with measurements taken at 15°C.
The extraction capacity of the DIC pool is only some 1–4% for obligate CO2 users while it is typically 40–70% among users; 16 of 19 species (Madsen and Sand-Jensen, 1991). This is because of the ability of users to continue photosynthesizing despite very high external pH and low DIC in the water. In vegetation rich water bodies of high pH, users can eventually out compete all obligate CO2 users (Sand-Jensen et al., 2010). Submerged aquatic plants unable to use typically have final pH’s in the external medium of the order of 8.6–9.8 in alkaline solutions and final CO2 concentrations equivalent to CO2 compensation points of 2–10 μmol L−1, while active users typically have final pH’s of 9.8–11.0 and final CO2 concentrations mostly below 0.3 μmol L−1 (Sand-Jensen et al., 1992). For a large collection of stream plants, median final CO2 values among the supposedly obligate CO2 users were 6.0 μmol L−1 for homophyllous and 4.8 μmol L−1 for heterophyllous amphibious plants, within the typical range of CO2 compensation points, while the median final CO2 concentration for the putative users was only 0.04 μmol L−1 reflecting the supplementary use of (Figure 2). Heterophyllous amphibious species form morphologically and anatomically distinct leaf types under water as compared to in air (Sculthorpe, 1967). The underwater leaf forms are an acclimation that enhances underwater gas exchange (Sand-Jensen et al., 1992; Colmer et al., 2011).
Photosynthesis of submerged aquatic plants and flooded terrestrial plants can also be severely limited by light (Kirk, 1994). In water, light is exponentially attenuated with depth following the equation: ; where Iz is the available irradiance at a given depth (z), I0 is the irradiance at the surface, and ε is the attenuation coefficient. The proportional reflection and back scattering at the water surface (f) is variable but typically about 0.1 such that the proportion of down welling irradiance is 0.9 (Kirk, 1994). The attenuation coefficient of pure water averaged across the photosynthetic spectrum is about 0.03 m−1, so in ultra clear water such as oligotrophic oceanic water, rooted plants could grow as deep as 70 m with 10% of surface irradiance still being available, which happens to be the approximate lower depth limit of seagrasses (Duarte, 1991). In most cases, however, colored dissolved organic matter (CDOM), pigments in planktonic algae and suspended particles, together reduce light penetration much more profoundly (Staehr et al., 2012b). Because freshwaters compared with marine waters are typically richer in nutrients, phytoplankton, CDOM exported from land and particles suspended from shallow sediments, attenuation coefficients typically range from 0.3 to 10 m−1 and thus have lower depth limits of rooted plants from 7 m to only 0.2 m (Middelboe and Markager, 1997). Flooding after heavy rain is commonly associated with erosion, high particle loads and high release of CDOM from inundated terrestrial soils. Flooded terrestrial plants can, therefore, experience extreme shading corresponding to attenuation coefficients between 1 and 8 m−1 (Parolin, 2009) making light limitation also of terrestrial plants a prominent feature during flooding events (Colmer et al., 2011).
Underwater photosynthesis in submerged aquatic plants and recent advances
The net process of photosynthesis (Eq. 1) is often described simply as the fixation of CO2 (or in water; Eq. 2) catalyzed by several enzymes, including Rubisco, driven by light and resulting in production of organic matter, O2 and OH−:
The rate of the process can be determined by the production of O2 and new organic matter (e.g., by isotopic tracing with 13C and 14C) and the consumption of CO2, , or more generally the pool of DIC: CO2, and . Photosynthesis is an alkalinization process as reflected by the release of OH− in Eq. 2 and the equivalent consumption of CO2 and protons in Eq. 1 (i.e., CO2 + H2O ↔ H+ + ) such that photosynthesis can be determined by the pH increase when converted to DIC consumption accounting for the buffer capacity [mainly due to carbonate alkalinity (CA), See, The CO2 Equilibria in Water].
In charophytic macroalgae, use of in photosynthesis can be closely coupled stochiometrically to carbonate precipitation (McConnaughey, 1991):
This process is pH neutral because conversion of to generates the necessary proton for conversion of to CO2 for assimilation. Thus, is equally divided between production of organic matter and CaCO3 and the photosynthetic quotient (PQ: mol O2 evolved mol−1 DIC consumed) is only about 0.5 compared with the typical value of 1.0 in Eqs 1 and 2. The active processes are apparently active antiport of H+ and Ca2+ in the acid bands and Ca2+ extrusion in the alkaline bands resulting in gradual accumulation of CaCO3 from inside the carbonate layer (McConnaughey, 1991). Carbonate precipitation closely coupled to photosynthesis is also found in coralline red algae, several green algae, and numerous freshwater angiosperms developing polar leaves with high pH and carbonate precipitation being confined to the upper leaf surfaces (Raven and Hurd, 2012). However, it remains to be tested whether active Ca2+ extrusion is involved in angiosperm use of as in charophytes (Prins et al., 1980). Even though photosynthesis and carbonate precipitation may not be closely coupled, the alkalinization process in Eqs 1 and 2 may still result in carbonate precipitation on leaf surfaces (Figure 1B) or in the surrounding water because of increase of pH and , though with a variable ratio to the fixation of CO2 in organic matter. Consequently, O2 evolution is a more reliable measure of underwater photosynthesis, while DIC use and production of organic matter and carbonate are essential parameters in the analysis of plant growth and carbon dynamics in ecosystems and on regional and global scales (McConnaughey et al., 1994; Cole et al., 2007). While coupled calcification photosynthesis leads to extensive drawdown of DIC and sediment accumulation of organic carbon and carbonates, carbonate formation per se generates H+ tending to reduce pH and increase CO2. During geological periods of intense formation of coral reefs, CO2 concentrations are suggested to have increased in the ocean and the atmosphere (Opdyke and Walker, 1992). The coupled photosynthesis calcification process has three major ecological or physiological implications: (i) in coral and coralline algae carbonates are directly used to build up the structural skeleton, (ii) in all phototrophs, surface precipitates will protect them against grazing animals, and (iii) calcification will prevent alkalinization during intensive photosynthesis which could otherwise have led to such high pH levels that tissues are damaged and photosynthesis is severely inhibited.
The photosynthetic capacity under optimum light, temperature, and DIC conditions varies among species and within species depending on their investment in active transport processes and catalytic machinery. On dry mass basis, maximum rates of photosynthesis of detached leaves of submerged aquatic plants from lakes typically vary 25-fold and dark respiration only fourfold between slow-growing, oligotrophic isoetid species and fast growing, eutrophic elodeid species (Nielsen and Sand-Jensen, 1989). Photosynthetic rates per unit dry mass increase significantly with reduced leaf thickness, higher relative surface area, and higher concentrations of pigments and nitrogen in structural and catalytic proteins, including Rubisco (Madsen et al., 1993). Because metabolism on a dry mass basis increases with declining leaf thickness, photosynthesis expressed per surface area only varies eightfold among species (Nielsen and Sand-Jensen, 1989). A comparison with terrestrial leaves characterizes the aquatic leaves by their lower chlorophyll and Rubisco concentrations and lower photosynthetic rates per surface area mainly due to the thin leaves of most aquatic species. This finding has been interpreted by Maberly and Madsen (2002) as a result of selection of submerged plants to match the low rates of carbon influx predominantly because of high transport resistance. Thin submerged leaves with chloroplasts in epidermal layers will also increase the cost effectiveness of light use and can also be regarded as a particular advantage in a low light aquatic environment with no risk of desiccation damage to the epidermal layers.
Realized rates of underwater photosynthesis for a given plant tissue varies from zero at compensation levels for light and DIC to maximum rates at saturating light and DIC. Light and DIC levels required to saturate photosynthesis increase with temperature and are highly dependent on the extent of self shading and, therefore, the scale of analysis of either detached leaves, individuals or populations (See Underwater Photosynthesis – Approaches and Methods). On a daily level, light limitation takes place early in the morning (low light but plenty of CO2, Figure 3) and co-limitation of both light and CO2 takes place late in the afternoon where also CO2 is low (Figure 3). On a seasonal level, light limitation is present from late autumn to early spring outside the tropical regions. Populations in deep or turbid waters and dense populations with high self shading face permanent light limitation. Photosynthetic rates at saturating light and DIC increase with temperature due to stimulation of enzyme activity up to an optimum level depending on the adaptation and acclimation of the species but are usually located between 25 and 32°C for temperate submerged aquatic plants (Santamaría and van Vierssen, 1997). The temperature exponent gradually declines and reaches zero as temperature approaches the optimum temperature and it turns negative above the optimum due to increasing influence of photorespiration (Long, 1991) and risk of damage of macromolecules, membranes, and structural organization of membrane proteins (Johnson et al., 1974; Lambers et al., 2008). Respiration continues to increase up to higher temperatures than photosynthesis resulting in proportionally greater losses of organic matter and optima for growth being located at lower temperature than optima for photosynthesis (Olesen and Madsen, 2000; Pilon and Santamaría, 2001).
Figure 3
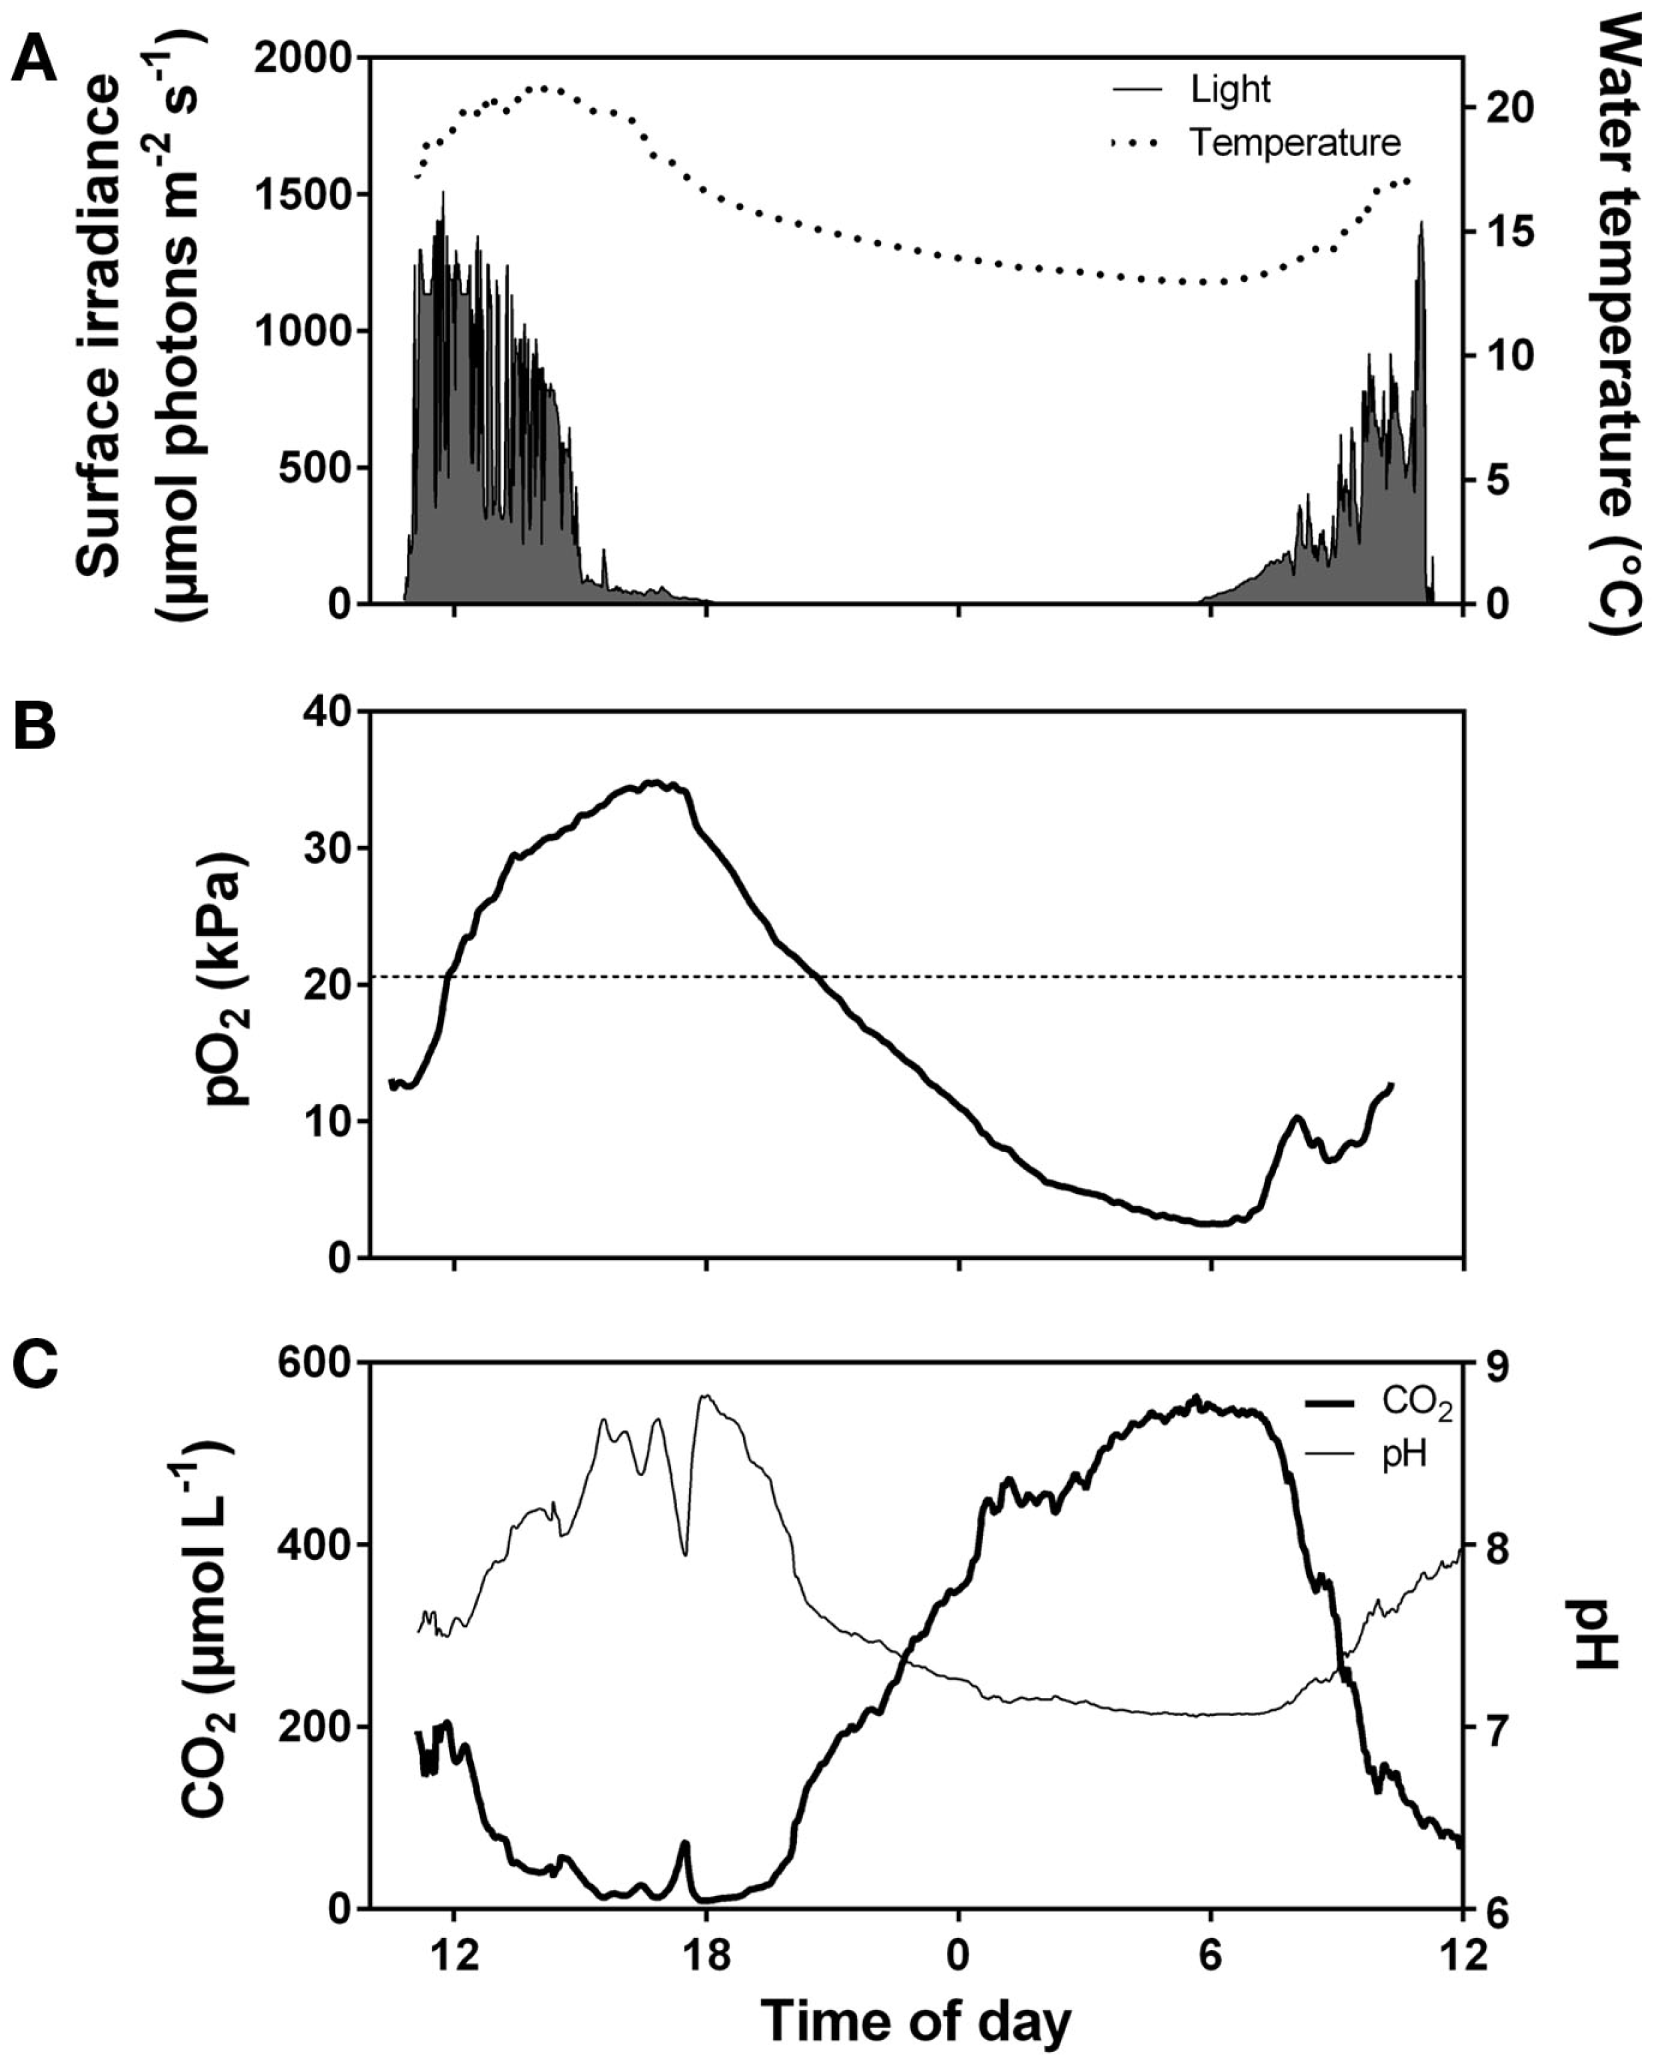
Diurnal fluctuations in surface irradiance and water temperature (A), O2 partial pressure (B), and CO2 concentration and pH (C) in the water of a vegetation rich pond in Western Australia. The pond was densely vegetated by Meionectes brownii which in late afternoon had extracted CO2 from the water down to below air equilibrium (<15 μmol L−1). During the night, total system respiration consumed O2 (pO2 dropped to 2.5 kPa early in the morning) and CO2 rose to 550 μmol L−1. Data extracted from Rich et al. (2013).
Ninety nine percent of all studies of aquatic photosynthesis have been carried out with detached leaves or thalli and this selectiveness influences the perception of the regulation of aquatic photosynthesis (Sand-Jensen and Krause-Jensen, 1997). The influence of light, DIC, and temperature on underwater photosynthesis show mutual interdependencies and are, moreover, strongly dependent on the spatial scale. From detached phytoelements to closed communities, light compensation points typically increase three- to eightfold and light saturation levels increase from 200 to 400 μmol m−2 s−1 to more than the maximum irradiances at noon of about 1500 μmol m−2 s−1 (Table 1; Sand-Jensen et al., 2007). The stimulation of photosynthesis in alkaline water by rising CO2 concentrations from 20 (close to air equilibrium) to 250 μmol L−1 (more than 10-fold above air equilibrium) is about ninefold for detached leaves and only 1.9- to 2.5-fold for dense communities of freshwater CO2 users while for efficient users the CO2 stimulation is only about twofold for individual leaves and insignificant for dense communities (Table 2; Sand-Jensen et al., 2007). Open communities of less self shading take an immediate position between detached individual leaves and dense communities. Profound self shading and light limitation of photosynthesis in dense aquatic communities imply that the influence of temperature and inorganic carbon supply is smaller than observed for well illuminated phytoelements. The full scale influence of temperature and CO2 on community photosynthesis is confined to tissues in the upper part of the canopy receiving irradiances above light saturation.
Table 1
| Thallus (mean) | Community LAI (m2 m−2) |
||||
|---|---|---|---|---|---|
| 3.0 | 6.3 | 8.9 | 13.8 | ||
| GPmax (μmol O2 m−2 s−1) | 7.95 | 11.5 | 17.4 | 22.0 | 23.7 |
| A (μmol O2 mol−1 photon) | 0.064 | 0.031 | 0.049 | 0.069 | 0.072 |
| EC (μmol photon m−2 s−1) | 22 | 67 | 99 | 94 | 175 |
| EK (μmol photon m−2 s−1) | Approx. 300 | Not sat. | Not sat. | Not sat. | Not sat. |
Photosynthetic parameters for thallus segments and communities of Fucus serratus of varying leaf area index (LAI).
GPmax: light saturated photosynthesis, α: the initial linear slope of photosynthesis versus irradiance, Ec: the light compensation points when net photosynthesis is zero, Ek: the irradiance for onset of light saturated photosynthesis. From Binzer and Sand-Jensen (2002b).
Table 2
| Temperature (°C) | Leaves | Community (LAI 2 m2 m−2) | Community (LAI 10 m2 m−2) | |
|---|---|---|---|---|
| USERS | ||||
| Potamogeton crispus | 15 | 2.1 | 1.45 | 1.16 |
| Potamogeton pectinatus | 15 | 2.0 | 1.33 | 0.96 |
| CO2 USERS | ||||
| Callitriche cophocarpa | 15 | 9.0 | 3.32 | 2.46 |
| 25 | 2.14 | 1.91 | ||
| Sparganium simplex | 15 | 9.3 | 4.24 | 1.91 |
| 25 | 4.16 | 1.54 | ||
Increase (x-fold) of maximum gross production of O2 at high (250 μmol L−1) relative to low (20 μmol L−1) CO2 concentration in alkaline water (5000 μmol L−1 DIC) of leaves and freshwater plant communities at two densities (LAI; 2 or 10 m2 m−2).
Up scaling of metabolic analyses from communities of submerged aquatic plants to entire ecosystems dominated by rooted plants have only been done in a few instances. Kelly et al. (1983) studied a shallow, densely vegetated stream (Gryde Stream, Denmark) by open water O2 measurements and confirmed that incoming irradiance was the main determinant of daily and seasonal variations of underwater photosynthesis which was only light saturated for a few hours at noon on clear summer days. The high CO2 concentrations (typically 10-fold air equilibrium) in lowland streams is a prerequisite for the high photosaturated rates and strong light dependency of submerged plants in general and CO2 users in particular (Sand-Jensen and Frost-Christensen, 1998). With natural CO2 concentrations close to air equilibrium, as observed in most lakes and ponds and in streams in the afternoon after several hours of planktonic photosynthesis (Sand-Jensen and Frost-Christensen, 1998; Christensen et al., 2013), CO2 plays a stronger regulatory role for photosynthesis particularly in open plant stands of low self shading (Sand-Jensen and Frost-Christensen, 1998). Moreover, the species rich group of terrestrial plants in lowland streams would be unable to survive if the water had not been greatly supersaturated as their CO2 compensation points resemble or exceed the CO2 concentrations at air equilibrium (Sand-Jensen and Frost-Christensen, 1999). Recent use of open water measurements of O2 and pH in shallow, alkaline ponds dominated entirely by charophytes documents that high biomass densities in late summer are attained by sustained slow growth over the preceding 3 months at very low nutrients concentrations in the water, and that daily photosynthesis is mostly limited by light (Figure 4) and only briefly by DIC at high pH (>9.5), and with virtually no CO2 available in the afternoon (Christensen et al., 2013). Only submerged aquatic plants capable of using and concentrating CO2 internally at the site of Rubisco can thrive in this environment (Sand-Jensen et al., 2010). Plant species forming dense communities in shallow ponds must also be able to tolerate substantial diurnal variations in temperature (e.g., 18–32°C) and O2 (hypoxic to twice air equilibrium) (Christensen et al., 2013). Daily photosynthesis and respiration were high in the pond and closely interrelated showing that newly produced organic matter was mostly rapidly respired by plants and bacteria.
Figure 4
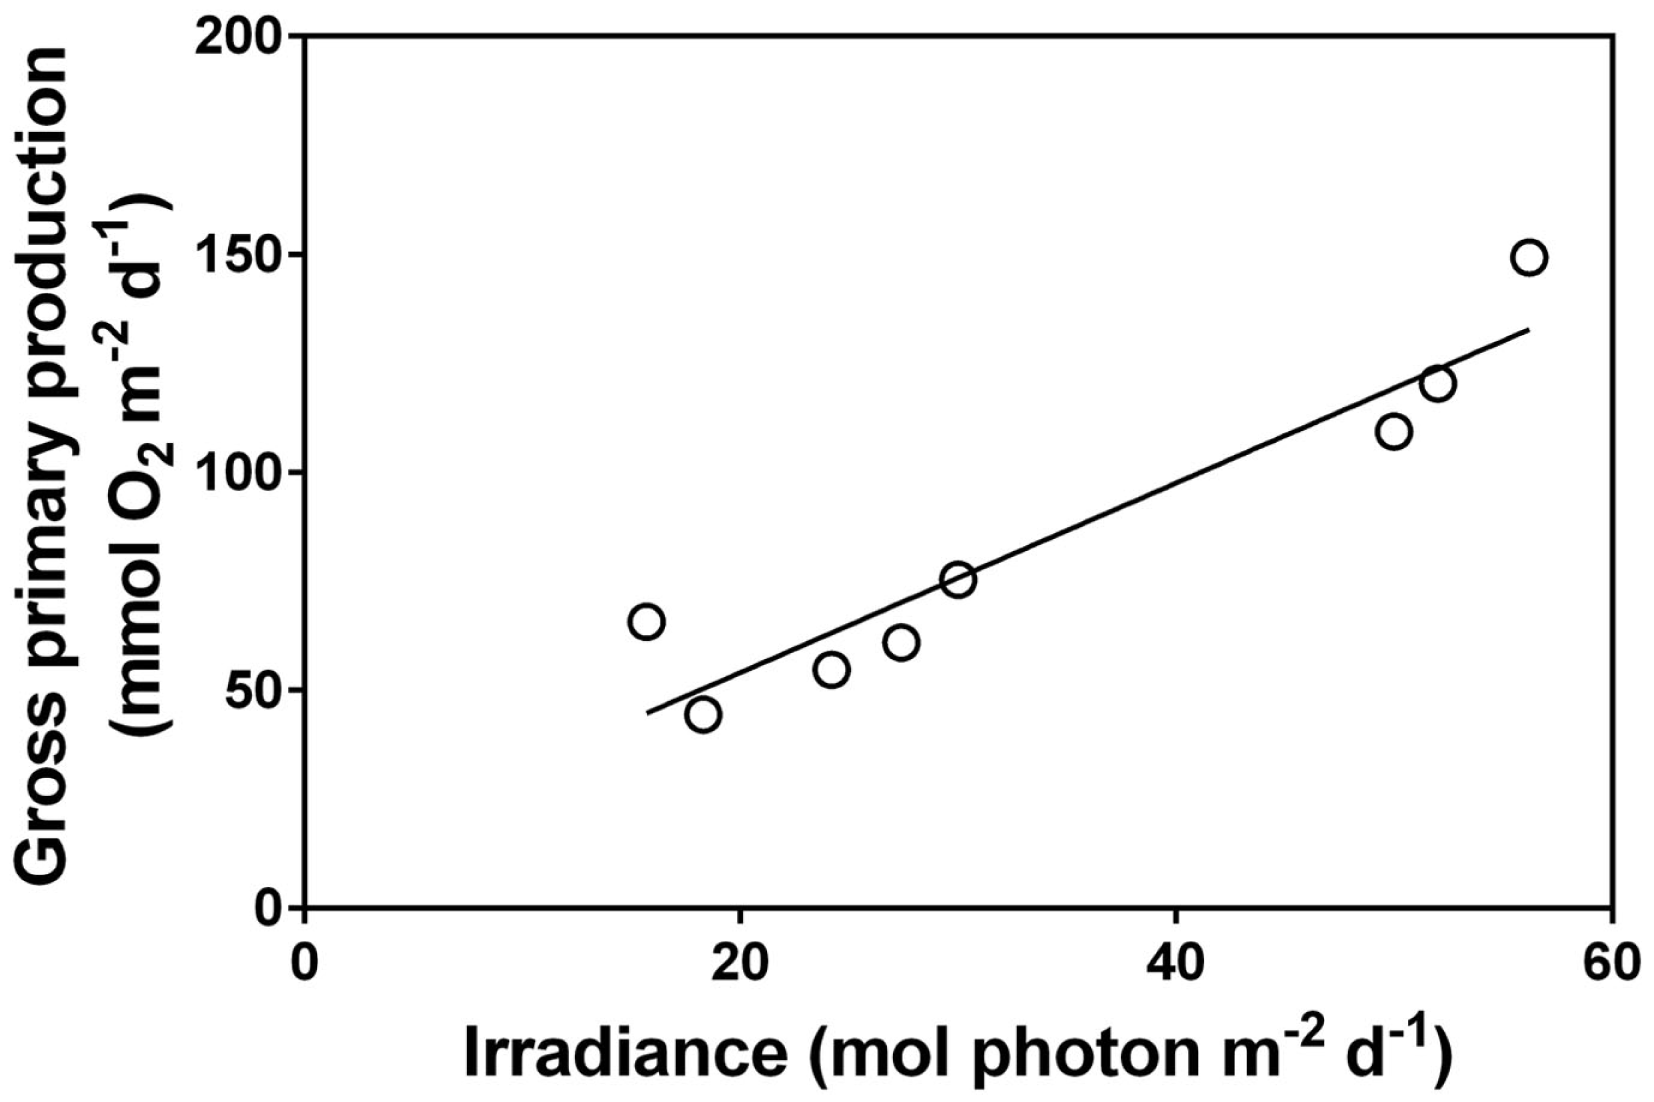
Relationship between daily surface irradiance and community gross primary production in a shallow pond in Öland, Sweden over a daily time course of 8 days with naturally variable light conditions (each data point represents 1 day). The dominant submerged aquatic plant in the pond was, Chara virgata (data extracted from Christensen et al., 2013). Pearson correlation = 0.96, P < 0.001.
Overall, the analyses of individual phytoelements, communities, and ecosystems confirm that the relative roles of light and DIC for determining photosynthesis are closely interrelated and highly dependent on plant density and species affinities for CO2 and . Maximum photosynthetic rates under light and inorganic carbon saturation are quite variable both between and within species depending on selected strategies and the investment in catalytic machinery coupled to supply of resources (e.g., nutrients). While photosaturated photosynthetic rates are strongly dependent on species, acclimation, and temperature, light limited rates are rather temperature independent and relatively similar among species (Frost-Christensen and Sand-Jensen, 1992). As the importance of light limitation for community photosynthesis increases in dense plant stands, the influence of species, temperature, and DIC supply decline and enable us to predict community photosynthesis primarily from the overall distribution and absorptance of light in the canopy (Binzer and Sand-Jensen, 2002a; b; Binzer et al., 2006).
Recent advances in underwater photosynthesis in terrestrial wetland plants
Terrestrial wetland plants grow in waterlogged soils and/or sediments with shallow standing water, so that a large proportion of the shoot is in contact with air. So, aerial photosynthesis predominates but these plants can experience episodes of complete submergence during floods. Although much more tolerant of submergence than non-wetland terrestrial species, submergence is regarded as a serious abiotic stress for terrestrial wetland plants, but species (and genotypes within a species) differ markedly in submergence tolerance (Bailey-Serres and Voesenek, 2008; Colmer and Voesenek, 2009). The impeded gas exchange under water restricts respiration and photosynthesis (See Challenges Under Water – Reduced Gas Diffusion and Light Penetration); photosynthesis can also be limited by low light when submerged (See Challenges Under Water – Reduced Gas Diffusion and Light Penetration and Underwater Photosynthesis in Submerged Aquatic plants and Recent Advances). Thus, submergence disrupts energy metabolism of terrestrial plant species as a result of a reduced O2 supply (at least during the night, in some tissues) and/or diminished carbohydrate status because of the restricted photosynthesis when under water.
Terrestrial wetland species lack most of the adaptive leaf features for inorganic carbon acquisition for photosynthesis as described in Section “Underwater Photosynthesis in Submerged Aquatic Plants and Recent Advances” for aquatic and acclimated amphibious plants. Thus, when compared with leaves of aquatic plants, those of terrestrial plants generally have larger overall apparent resistance to diffusion of CO2 from the bulk medium to chloroplasts, so that slow CO2 uptake restricts underwater photosynthesis. Underwater photosynthesis by leaves of terrestrial wetland species is lower than that achieved by aquatic species, when compared per unit of leaf dry mass (Sand-Jensen et al., 1992; Colmer et al., 2011).
The few studies available show, however, that the low photosynthesis when under water enhances survival of submerged terrestrial plants (Vervuren et al., 1999; Mommer et al., 2006b; Vashisht et al., 2011). Both the sugars and O2 produced would likely contribute to enhanced survival when submerged (Mommer and Visser, 2005), and in the case of sugars especially when submergence lasts more than a few days and internal carbohydrates become depleted. Depletion of carbohydrates during submergence is considered a major factor influencing survival of submerged rice (Setter and Laureles, 1996) and determining recovery following desubmergence and ultimately grain yield in flood-prone areas (Bailey-Serres et al., 2010; Mackill et al., 2012). The O2 produced in photosynthesis can travel from leaves to roots via aerenchyma, and so this endogenously produced O2 improves the internal aeration of submerged plants (e.g., rice; Pedersen et al., 2009; Winkel et al., 2013).
A recent review (Colmer et al., 2011) highlighted there are few studies of underwater photosynthesis by terrestrial wetland plants, and few of these compared rates underwater with those achieved by leaves in air. Similarly, a quantitative understanding of the potential role of underwater photosynthesis to whole plant carbon budgets during submergence seems to be lacking for terrestrial wetland species, whereas carbon budgets for several aquatic species (e.g., van der Bijl et al., 1989) and systems (e.g., Christensen et al., 2013) have been evaluated. For some terrestrial wetland species, only a few crude leaf level estimates of carbon budgets have been considered (e.g., in Colmer and Pedersen, 2008), but the potential contribution of underwater photosynthesis to carbon gain was demonstrated in growth studies of completely submerged rice, albeit under controlled conditions (e.g., Pedersen et al., 2009). Studies of whole plant carbon budgets in field conditions are generally lacking, even understanding of this aspect for the important wetland crop rice submerged in various field scenarios appears to be incomplete.
Detailed studies of underwater photosynthesis of terrestrial wetland species have focused on production and performance of submergence acclimated leaves. New leaves produced when under water by some terrestrial wetland species are better acclimated for underwater photosynthesis than the aerial leaves (Mommer et al., 2007). The acclimated leaves have a thin cuticle and overall are also thinner and of less breath (Mommer and Visser, 2005). These morphological and anatomical differences as compared with the usual leaves produced in air, reduce the resistance to CO2 (and O2) diffusion between the bulk medium and chloroplasts in submerged leaves, owing to narrower DBLs (suggested by Colmer et al., 2011), lower cuticle resistance (Mommer et al., 2006b), and shorter internal diffusion path lengths (Mommer et al., 2006a). However, although a reduced cuticle that enhanced underwater gas exchange occurs in several terrestrial wetland species (few species have been evaluated to date), the magnitude of the reduction in apparent resistance to gas exchange with the medium was not correlated with submergence tolerance for the species tested (Mommer et al., 2007), highlighting the need for further experimental investigations.
Some recent work on underwater photosynthesis by submerged terrestrial wetland plants has evaluated the contribution of gas films on superhydrophobic leaf surfaces to gas exchange with floodwaters. Leaf surface hydrophobicity (i.e. water repellence) is a feature that sheds off water in wet aerial environments (Smith and McClean, 1989; Brewer and Smith, 1997) and promotes “self cleansing,” enhancing leaf performance and reputably lowering susceptibility to pathogens (Neinhuis and Barthlott, 1997). Some terrestrial wetland species have super hydrophobic leaves that when submerged retain a gas film, e.g., rice (Raskin and Kende, 1983) and Phragmites australis and others (Colmer and Pedersen, 2008). Gas films enhance CO2 uptake for underwater photosynthesis (Raskin and Kende, 1983; Colmer and Pedersen, 2008; Pedersen et al., 2009) and O2 entry for respiration in darkness (Colmer and Pedersen, 2008; Pedersen and Colmer, 2012). The enhancement by leaf gas films of CO2 uptake (in light) and of O2 (in darkness) was demonstrated by the marked declines in underwater photosynthesis and respiration when the films were experimentally removed (Colmer and Pedersen, 2008; Pedersen et al., 2009; Pedersen and Colmer, 2012). In addition, leaves produced in air by terrestrial wetland species that did not form gas films when submerged (i.e. leaves of these species were not sufficiently hydrophobic), had lower rates of underwater photosynthesis than those that did form gas films (Colmer and Pedersen, 2008; Colmer et al., 2011). As one example, leaf segments of rice with dissolved CO2 set as in a field pond and with underwater photosynthesis measured as described in Section “The Rotating Wheel Incubator,” showed rates four- to fivefold higher for leaf segments with intact gas films compared to those with the films experimentally removed (Winkel et al., 2013). Moreover, a field study using in situ monitoring of O2 in rhizomes of Spartina anglica demonstrated the benefit of having leaf gas films to internal aeration during complete submergence, both during day and night tides (Winkel et al., 2011). Summing up, leaf gas films enhance underwater photosynthesis and internal aeration of some terrestrial wetland plants when submerged, with benefits also demonstrated to growth when submerged in controlled experiments (e.g., rice; Pedersen et al., 2009).
Underwater Photosynthesis – Approaches and Methods
Conventional infrared gas analyzer (IRGA) systems following CO2 exchange in air do not work under water, so dedicated measuring systems are required to quantify underwater net photosynthesis and dark respiration. DIC can be measured by injection of small aliquots of water into concentrated acid in a bubble chamber purged with gaseous N2 carrying the released CO2 into an IRGA (Vermaat and Sand-Jensen, 1987). However, photosynthesis measurements based on DIC determinations are thus based on discrete measurements at selected times and can be complicated because of the large and variable combined pool of DIC in water (See Underwater Photosynthesis in Submerged Aquatic plants and Recent Advances and The CO2 Equilibria in Water). Indirect methods to track DIC changes can be based on continuous measurements of pH in solution (Maberly, 1996). The DIC technique to measure photosynthess has potential errors if: (i) DIC is removed by external carbonate precipitation, (ii) internal DIC accumulates in tissues or colony gels, (iii) DIC dissolution of solid carbonates occurs, or (iv) DIC is released from internal pools (McConnaughey et al., 1994; Sand-Jensen et al., 2009). External measurements of pH to estimate DIC changes have the same potential errors as above and, moreover, also due to direct exchange of protons from tissues not always being closely coupled to DIC exchange. Therefore, most methods for studies of underwater net photosynthesis are based upon O2 detection.
In contrast to gas exchange measurements of photosynthesis by leaves in air using open systems and CO2 detection, underwater measurements commonly use closed systems and detection of O2. In addition to the rationale for O2 detection described in the preceding paragraph, O2 detection also enables measurements in waters of substantially different DIC concentrations (e.g., softwater lakes up to 100 μmol L−1, ocean approximately 2000 μmol L−1 and hardwater lakes up to 10000 μmol L−1). The drawback of closed systems is that these are non-steady-state (i.e. DIC declining and O2 increasing with time). Use of open systems with O2 detection is constrained by reliable continuous detection of differences in O2 concentrations between incoming and outgoing solutions from an appropriate chamber.
Changes in O2 concentration over time are straightforward to measure with Clark type amperometric electrodes or more recently by use of O2 sensitive optodes. Oxygen partial pressure (pO2) or dissolved O2 can be continuously monitored in water with an accuracy of 0.01 kPa or 0.2 μmol L−1 (Strickland and Parsons, 1972). Photosynthesis determined from changes in O2 and DIC pools dissolved in the surrounding water requires that those are much greater than changes in such pools within the plant tissue (Sand-Jensen and Prahl, 1982). This is best achieved by having large incubation volumes relative to plant volumes. Alternatively, changes in tissue pools can be measured (Sand-Jensen et al., 2005) or be deduced by establishment of true steady state where tissue concentrations remain constant or quasi steady state where tissue concentrations changes proportionally to external concentrations (Sand-Jensen and Prahl, 1982). Measurements of underwater photosynthesis based upon O2 evolution can include great error when plants with highly porous tissues (perhaps variable in volume and having much higher “solubility” of O2 than water; See Medium and Tissue) are incubated in small chambers (Hartman and Brown, 1967; Richardson et al., 1984). On the other hand, measurements of underwater photosynthesis based upon changes in DIC can include extreme error when plant tissues (or colony matrices in the case of algae and cyanobacteria) hold very large pools of DIC that do not change in concert with those in the surrounding water. For example, DIC in the colony gel of Nostoc zetterstedtii continues to support photosynthesis after water pools have been exhausted, and in darkness respiratory CO2 replenishes this internal pool before being released to the water (Sand-Jensen et al., 2009).
Measurements of radioactive labeling of the DIC pool with 14C and the use of pulse amplitude modulated (PAM) fluorometry are also methods to measure photosynthetic performance under water; these technique are beyond the focus of the present paper so readers are referred to e.g., Adams et al. (1978) or Kemp et al. (1986) for methods on 14C and to Silva et al. (2009) or Suggett et al. (2011) and chapters therein for PAM approaches.
The CO2 equilibria in water
Understanding the chemistry of dissolved DIC and the proportional changes in its three constituents (CO2, and ) depending on ionic strength, temperature, and primarily pH (Mackereth et al., 1978) is essential because it determines the availability of the preferred CO2 source and the supplementary source for underwater net photosynthesis. When CO2 dissolves in water, the following equilibrium is established:
CO2’s reaction with water (H2O) forming carbonic acid (H2CO3) is a time dependent process which in some organisms is catalyzed by the enzyme carbonic anhydrase. H2CO3 can dissociate immediately into a proton (H+) and bicarbonate () so the dissolution of CO2 into water causes pH to drop. At high pH, can further dissociate into a second H+ and carbonate (). The relative distribution of the three main inorganic carbon species with pH is shown (Figure 5). The pKa1 is 6.532 and is referred to as the apparent pKa1 as only little CO2 is converted into carbonic acid (hence the brackets in Eq. 4) while the majority remains in solution as CO2(aq) also referred to as free CO2; pKa2 is 10.329 (Schwarzenbach and Meier, 1958; Stumm and Morgan, 1996; Gutz, 2012). Below pH 6, most of the DIC is present as CO2, which is usually more readily used for underwater photosynthesis than . Between pH 7 and 10, dominates, a carbon species that can be used as an additional carbon source among species in most taxonomic groups of aquatic plants except for pteridopytes and mosses (Raven and Hurd, 2012). Only at pH higher than 10, a significant proportion of the DIC is in the form of which apparently is not taken up by any phototrophs in ionic form but can perhaps be made available in acid zones on plant surfaces by back titration with released protons (conversion toward the left in Eq. 4).
Figure 5
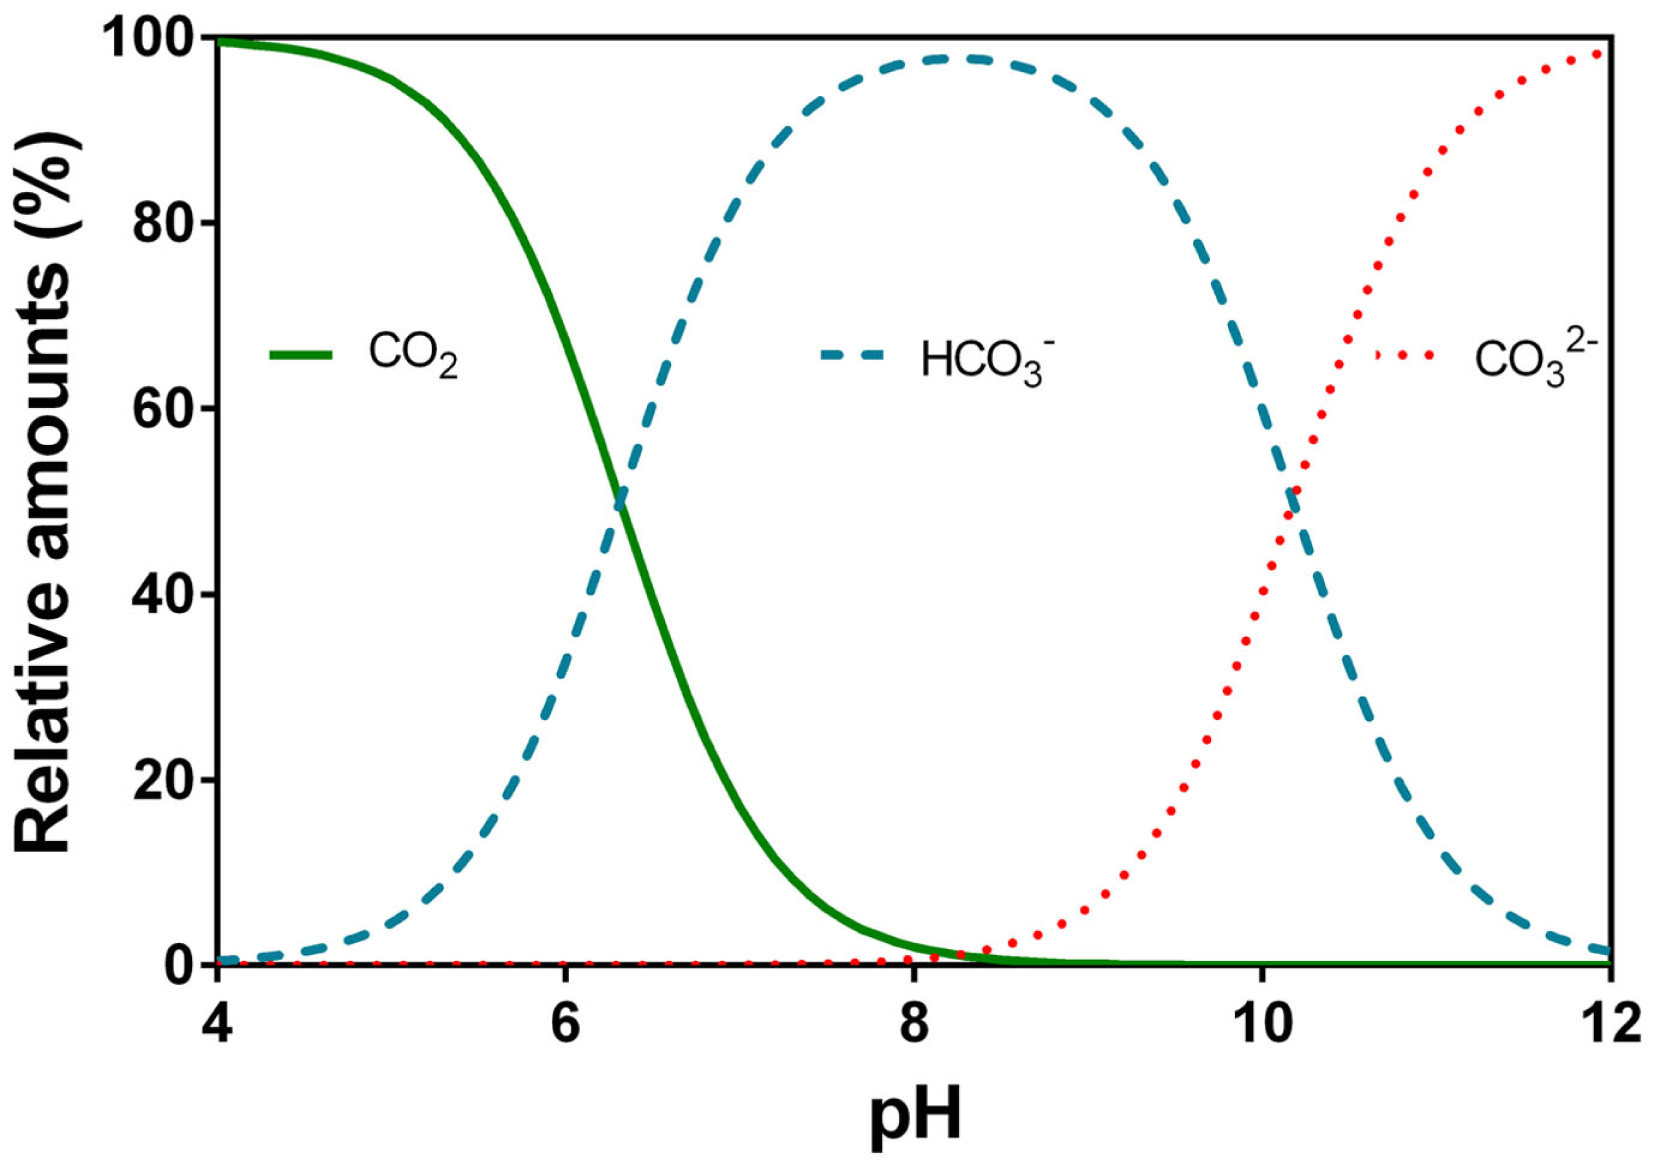
Relative speciation (%) of carbon dioxide (CO2), bicarbonate (), and carbonate () in water as a function of pH. The example given is at 20°C and electrical conductivity of 250 μS cm−1. Data were calculated using Gutz (2012) with the apparent pK1 = 6.532 and pK2 = 10.329 (Schwarzenbach and Meier, 1958).
In freshwaters and seawater, the alkalinity (sum of alkaline ions buffering added H+; units in mequiv. L−1 or mmol L−1 for monovalent in water which is in air equilibrium of negligible OH− and ) is almost entirely controlled by the carbonate systems with insignificant contribution from silicate and phosphate, and with some contribution by borate in seawater. At pH above 9, OH− has a significant contribution to alkalinity being 0.074 mmol L−1 at pH 10 and 0.74 mmol L−1 at pH 11 at an alkalinity of 2 mmol equivalents L−1 (Table 3). It is thus convenient to distinguish between the total alkalinity (TA) and the CA (Dickson, 1981; Stumm and Morgan, 1996). The chemical species contributions to the two alkalinities are:
Table 3
| pH | DIC (mmol L−1) | CO2 (mmol L−1) | (mmol L−1) | (mmol L−1) | OH− (mmol L−1) |
|---|---|---|---|---|---|
| 6.00 | 6.5073 | 4.5074 | 1.9998 | 0.0001 | 0.0000 |
| 6.05 | 6.0170 | 4.0172 | 1.9997 | 0.0001 | 0.0000 |
| 6.10 | 5.5801 | 3.5803 | 1.9997 | 0.0001 | 0.0000 |
| 6.15 | 5.1907 | 3.1909 | 1.9997 | 0.0002 | 0.0000 |
| 6.20 | 4.8436 | 2.8438 | 1.9996 | 0.0002 | 0.0000 |
| 6.25 | 4.5343 | 2.5345 | 1.9996 | 0.0002 | 0.0000 |
| 6.30 | 4.2586 | 2.2588 | 1.9995 | 0.0002 | 0.0000 |
| 6.35 | 4.0128 | 2.0131 | 1.9995 | 0.0002 | 0.0000 |
| 6.40 | 3.7938 | 1.7941 | 1.9994 | 0.0003 | 0.0000 |
| 6.45 | 3.5986 | 1.5990 | 1.9994 | 0.0003 | 0.0000 |
| 6.50 | 3.4246 | 1.4250 | 1.9993 | 0.0004 | 0.0000 |
| 6.55 | 3.2696 | 1.2700 | 1.9992 | 0.0004 | 0.0000 |
| 6.60 | 3.1313 | 1.1318 | 1.9991 | 0.0004 | 0.0000 |
| 6.65 | 3.0082 | 1.0087 | 1.9990 | 0.0005 | 0.0000 |
| 6.70 | 2.8983 | 0.8989 | 1.9988 | 0.0006 | 0.0000 |
| 6.75 | 2.8004 | 0.8011 | 1.9987 | 0.0006 | 0.0000 |
| 6.80 | 2.7132 | 0.7139 | 1.9985 | 0.0007 | 0.0000 |
| 6.85 | 2.6354 | 0.6362 | 1.9984 | 0.0008 | 0.0001 |
| 6.90 | 2.5661 | 0.5670 | 1.9982 | 0.0009 | 0.0001 |
| 6.95 | 2.5042 | 0.5053 | 1.9979 | 0.0010 | 0.0001 |
| 7.00 | 2.4491 | 0.4503 | 1.9977 | 0.0011 | 0.0001 |
| 7.05 | 2.3999 | 0.4013 | 1.9974 | 0.0012 | 0.0001 |
| 7.10 | 2.3561 | 0.3576 | 1.9971 | 0.0014 | 0.0001 |
| 7.15 | 2.3169 | 0.3186 | 1.9968 | 0.0016 | 0.0001 |
| 7.20 | 2.2820 | 0.2839 | 1.9964 | 0.0018 | 0.0001 |
| 7.25 | 2.2509 | 0.2530 | 1.9959 | 0.0020 | 0.0001 |
| 7.30 | 2.2230 | 0.2254 | 1.9954 | 0.0022 | 0.0001 |
| 7.35 | 2.1982 | 0.2008 | 1.9949 | 0.0025 | 0.0002 |
| 7.40 | 2.1760 | 0.1789 | 1.9942 | 0.0028 | 0.0002 |
| 7.45 | 2.1561 | 0.1594 | 1.9935 | 0.0031 | 0.0002 |
| 7.50 | 2.1383 | 0.1420 | 1.9927 | 0.0035 | 0.0002 |
| 7.55 | 2.1223 | 0.1265 | 1.9919 | 0.0039 | 0.0003 |
| 7.60 | 2.1080 | 0.1127 | 1.9909 | 0.0044 | 0.0003 |
| 7.65 | 2.0951 | 0.1004 | 1.9898 | 0.0050 | 0.0003 |
| 7.70 | 2.0835 | 0.0894 | 1.9885 | 0.0056 | 0.0004 |
| 7.75 | 2.0730 | 0.0796 | 1.9871 | 0.0062 | 0.0004 |
| 7.80 | 2.0635 | 0.0709 | 1.9856 | 0.0070 | 0.0005 |
| 7.85 | 2.0548 | 0.0632 | 1.9838 | 0.0078 | 0.0005 |
| 7.90 | 2.0469 | 0.0562 | 1.9819 | 0.0088 | 0.0006 |
| 7.95 | 2.0396 | 0.0501 | 1.9797 | 0.0098 | 0.0007 |
| 8.00 | 2.0328 | 0.0446 | 1.9772 | 0.0110 | 0.0007 |
| 8.05 | 2.0265 | 0.0397 | 1.9745 | 0.0123 | 0.0008 |
| 8.10 | 2.0205 | 0.0353 | 1.9714 | 0.0138 | 0.0009 |
| 8.15 | 2.0149 | 0.0314 | 1.9680 | 0.0155 | 0.0010 |
| 8.20 | 2.0094 | 0.0279 | 1.9641 | 0.0173 | 0.0012 |
| 8.25 | 2.0041 | 0.0248 | 1.9598 | 0.0194 | 0.0013 |
| 8.30 | 1.9989 | 0.0221 | 1.9550 | 0.0217 | 0.0015 |
| 8.35 | 1.9937 | 0.0196 | 1.9497 | 0.0243 | 0.0017 |
| 8.40 | 1.9884 | 0.0174 | 1.9437 | 0.0272 | 0.0019 |
| 8.45 | 1.9830 | 0.0155 | 1.9371 | 0.0304 | 0.0021 |
| 8.50 | 1.9774 | 0.0138 | 1.9297 | 0.0340 | 0.0023 |
| 8.55 | 1.9716 | 0.0122 | 1.9214 | 0.0380 | 0.0026 |
| 8.60 | 1.9655 | 0.0108 | 1.9122 | 0.0424 | 0.0029 |
| 8.65 | 1.9590 | 0.0096 | 1.9020 | 0.0474 | 0.0033 |
| 8.70 | 1.9520 | 0.0085 | 1.8907 | 0.0528 | 0.0037 |
| 8.75 | 1.9445 | 0.0075 | 1.8781 | 0.0589 | 0.0041 |
| 8.80 | 1.9364 | 0.0067 | 1.8642 | 0.0656 | 0.0047 |
| 8.85 | 1.9277 | 0.0059 | 1.8489 | 0.0729 | 0.0052 |
| 8.90 | 1.9182 | 0.0052 | 1.8319 | 0.0811 | 0.0059 |
| 8.95 | 1.9079 | 0.0046 | 1.8133 | 0.0901 | 0.0066 |
| 9.00 | 1.8967 | 0.0040 | 1.7928 | 0.0999 | 0.0074 |
| 9.05 | 1.8846 | 0.0036 | 1.7703 | 0.1107 | 0.0083 |
| 9.10 | 1.8714 | 0.0031 | 1.7457 | 0.1225 | 0.0093 |
| 9.15 | 1.8570 | 0.0027 | 1.7189 | 0.1353 | 0.0104 |
| 9.20 | 1.8415 | 0.0024 | 1.6898 | 0.1493 | 0.0117 |
| 9.25 | 1.8246 | 0.0021 | 1.6582 | 0.1643 | 0.0131 |
| 9.30 | 1.8065 | 0.0018 | 1.6241 | 0.1806 | 0.0147 |
| 9.35 | 1.7870 | 0.0016 | 1.5874 | 0.1981 | 0.0165 |
| 9.40 | 1.7661 | 0.0014 | 1.5480 | 0.2167 | 0.0185 |
| 9.45 | 1.7438 | 0.0012 | 1.5061 | 0.2366 | 0.0208 |
| 9.50 | 1.7201 | 0.0010 | 1.4615 | 0.2576 | 0.0233 |
| 9.55 | 1.6950 | 0.0009 | 1.4144 | 0.2797 | 0.0262 |
| 9.60 | 1.6686 | 0.0008 | 1.3649 | 0.3028 | 0.0294 |
| 9.65 | 1.6408 | 0.0007 | 1.3132 | 0.3269 | 0.0329 |
| 9.70 | 1.6118 | 0.0006 | 1.2594 | 0.3518 | 0.0370 |
| 9.75 | 1.5817 | 0.0005 | 1.2039 | 0.3773 | 0.0415 |
| 9.80 | 1.5506 | 0.0004 | 1.1469 | 0.4033 | 0.0465 |
| 9.85 | 1.5186 | 0.0003 | 1.0887 | 0.4295 | 0.0522 |
| 9.90 | 1.4858 | 0.0003 | 1.0297 | 0.4559 | 0.0586 |
| 9.95 | 1.4525 | 0.0002 | 0.9703 | 0.4820 | 0.0657 |
| 10.00 | 1.4188 | 0.0002 | 0.9109 | 0.5077 | 0.0738 |
| 10.05 | 1.3847 | 0.0002 | 0.8519 | 0.5327 | 0.0828 |
| 10.10 | 1.3505 | 0.0001 | 0.7936 | 0.5568 | 0.0929 |
| 10.15 | 1.3162 | 0.0001 | 0.7364 | 0.5797 | 0.1042 |
| 10.20 | 1.2820 | 0.0001 | 0.6807 | 0.6012 | 0.1169 |
| 10.25 | 1.2478 | 0.0001 | 0.6267 | 0.6211 | 0.1312 |
| 10.30 | 1.2138 | 0.0001 | 0.5747 | 0.6391 | 0.1472 |
| 10.35 | 1.1800 | 0.0001 | 0.5249 | 0.6550 | 0.1651 |
| 10.40 | 1.1462 | 0.0000 | 0.4776 | 0.6686 | 0.1853 |
| 10.45 | 1.1124 | 0.0000 | 0.4327 | 0.6797 | 0.2079 |
| 10.50 | 1.0786 | 0.0000 | 0.3905 | 0.6881 | 0.2333 |
| 10.55 | 1.0446 | 0.0000 | 0.3508 | 0.6937 | 0.2617 |
| 10.60 | 1.0101 | 0.0000 | 0.3138 | 0.6963 | 0.2937 |
| 10.65 | 0.9750 | 0.0000 | 0.2794 | 0.6956 | 0.3295 |
| 10.70 | 0.9389 | 0.0000 | 0.2475 | 0.6914 | 0.3697 |
| 10.75 | 0.9017 | 0.0000 | 0.2181 | 0.6835 | 0.4148 |
| 10.80 | 0.8628 | 0.0000 | 0.1910 | 0.6718 | 0.4654 |
| 10.85 | 0.8220 | 0.0000 | 0.1662 | 0.6558 | 0.5222 |
| 10.90 | 0.7788 | 0.0000 | 0.1435 | 0.6353 | 0.5859 |
| 10.95 | 0.7327 | 0.0000 | 0.1228 | 0.6099 | 0.6574 |
| 11.00 | 0.6831 | 0.0000 | 0.1039 | 0.5792 | 0.7377 |
Distribution of DIC, CO2, , , and OH− as a function of pH at constant total alkalinity of 2 mmol H+ equivalents L−1 at 20°C.
Calculated from Mackereth et al. (1978) and Gutz (2012). See Figure 5 for the relative distribution between CO2, and versus pH. The yellow highlight refers to Example 1, Section “Medium and Tissue.”
Purging an aqueous solution with pure CO2 alters the CA through the addition of ionic carbon species and also through pH related shifts in the partitioning of carbon species already present in the solution (Eqs 4 and 5). However, the TA is not affected by bubbling with CO2 as every negatively charged ion is balanced by a proton (Eq. 6). For example, water fresh from the tap often contains CO2 above air equilibrium and so bringing it to equilibrium by purging with atmospheric air would thus lower pCO2 until a new equilibrium has been reached. According to Eq. 5, CA would decrease slightly as both and decrease equivalent to the rise of OH− and pH.
For experimental purposes, an aqueous photosynthesis solution is usually prepared with a certain amount of DIC and then pH is adjusted with acid or base to that required to achieve the desired concentration of “free” (i.e. dissolved) CO2 and . Table 3 lists the relationship between pH and amounts of CO2, , , and OH− at 20°C and a fixed TA, calculated from Gutz (2012). The examples provided in the sections below demonstrate how to apply all the above information in practice.
In the next sections (See “The Rotating Wheel Incubator” to “The Open Natural System”) we describe methods in use for measurements of underwater photosynthesis. The methods scale from phytoelements to communities. The approaches involve laboratory and field techniques and so have different levels of control of key environmental variables influencing photosynthesis.
The rotating wheel incubator
Principle: Leaf samples or algal thalli are incubated in glass vials of a known concentration of CO2 in an aqueous medium, and the sealed vials of known volume are rotated on an incubator under well defined light and temperature conditions. O2 produced during incubation is measured by an electrode/optode and underwater net photosynthesis can be calculated based on e.g., leaf area, fresh mass, dry mass, and/or chlorophyll. Alternatively, consumption of DIC can be used as a photosynthetic measure. Incubation in darkness provides data on dark respiration.
Medium and tissue
The choice of medium is basically between an artificial medium with a well defined ion and gas composition or ambient water with the ion and gas composition of natural habitats (essential chemical parameters such as pH, DIC, and alkalinity should be characterized). An example of an artificial medium is the Smart and Barko (1985) general purpose culture medium. This medium contains (mmol L−1) 0.62 Ca2+, 0.28 Mg2+, 0.28 SO42−, and 1.24 Cl− and KHCO3 (sometimes mixed with NaHCO3) is used to generate the required DIC. HCl, NaOH (or KOH), atmospheric air or gas mixtures of known pCO2 can be used to adjust pH to a required value based on the desired amount of free CO2. Since all incubations are short term, there are no micro nutrients or vitamins in this medium. Some studies have also used submergence solutions or “ambient” water from streams or lakes in order to establish a rate of photosynthesis under specific conditions (Sand-Jensen et al., 1992; Nielsen, 1993; Sand-Jensen and Frost-Christensen, 1998) and these can also be adjusted to predefined pH, CO2 and/or O2 levels. Any production of O2 by microalgae or consumption by microbial organisms in ambient water is accounted for in the blanks; micro-filtration of water is commonly used to remove background microflora.
Photorespiration, as previously demonstrated for rice (Setter et al., 1989) and the aquatic pteridophyte, Isoetes australis, (Pedersen et al., 2011), during incubation is a potential issue as the evolved O2 is trapped in solution of the closed glass vial. The risk of photorespiration is increased during experiments at high temperature (Long, 1991) and with very low DIC and CO2 concentrations leading to low ratios of CO2 to O2 at the site of Rubisco (Maberly and Spence, 1989; Sand-Jensen and Frost-Christensen, 1999). Therefore, the starting partial pressure of O2 (pO2) should be brought down to approximately 50% of air equilibrium, i.e., 10 kPa. This is sufficient to address the issue of photorespiration (provided that incubation do not last long periods so that O2 produced increases above air equilibrium) and at the same time there is still enough O2 in the medium to prevent tissue anoxia before photosynthesis starts producing O2 (Colmer and Pedersen, 2008). In practice, equal volumes of medium (including all ions) are bubbled with either air or N2. After mixing the two solutions, the pO2 will be approximately 10 kPa and can be added to the medium and pH adjusted accordingly to achieve the desired amount of free CO2 (see example below).
In some situations, an organic buffer may be used to maintain a constant pH in the medium during incubation. In practice, however, is a natural and often sufficient buffer in itself and we do not recommend using buffers if the CA is above 1 mmol L−1 as would be sufficient to buffer against large pH fluctuations during incubation (Sand-Jensen et al., 1992; Colmer and Pedersen, 2008). Moreover, organic buffers can also modify membrane porters and pH at plant surfaces modifying use and influx/efflux of CO2 (Price and Badger, 1985; Larsson and Axelsson, 1999; Moulin et al., 2011). pH of the medium should be measured in a sample taken of the initial solution and then also in vials after incubations. With the ongoing advancement of optodes, pH may even be measured without opening the vials if applying pH sensitive microdots (See “O2 Measurements” for description of O2 sensitive microdots). If additional buffering is required, i.e. pH measurements after incubation show unacceptable drift in pH, then MES or TES buffers may be used, e.g., at a concentration of 5 mmol L−1 (Pedersen et al., 2009, 2010), though the possible influence of these buffers on use must be kept in mind.
The vials (10–100 mL glass vials with ground glass stoppers) are filled with medium using a siphon. By siphoning the medium into the bottom of each vial, exchange of O2 and particularly CO2 with the atmosphere is minimized; prepare sufficient medium to flush the vials at least twice the volume, and fill the vials completely. An air bubble can hold 36-fold more O2 as the same volume of deionized (DI) water at 25°C, so bubbles in the vials introduce significant error to the net photosynthesis measurements. A set of vials without tissue serves as blanks and is incubated along with the vials containing tissue samples in the rotating incubator. The blanks serve to provide the starting pO2 in the vials and also to correct for any O2 production or consumption (e.g., by algae, bacteria, or chemical processes) if ambient water is used as medium. Glass beads (Ø = 3–5 mm; two in each 25 mL vial) are added to each vial to provide mixing as the vials are rotating in the incubator.
The amount of tissue added to each vial depends on the activity of the tissue, the amount of DIC and free CO2, the light level (PAR), and the temperature. At saturating light and CO2 levels and at 25°C, 0.5 mg fresh mass mL−1 medium is often a good choice as this will result in a rise of pO2 by approximately 2–5 kPa within an hour of incubation providing reproducible and accurate determination of O2 regardless of the technique employed (see below). However, both microelectrodes and optodes have a resolution of approximately 0.01 kPa so a change in 1 kPa could also be sufficient. At lower CO2 and/or light levels, more tissue may be required or alternatively, longer incubation times are needed. However, small tissue samples are preferred to prevent self shading and to promote good mixing in the vials so that tissues are well exposed to light and chemicals during incubation.
Example 1: Preparation of artificial floodwater with CA of 2.0 mmol L−1 and 200 μmol free CO2 L−1. Prepare a solution of DI water containing Ca2+, Mg2+, SO42−, and Cl− at the concentrations described above. Divide the solution into two containers and bubble one half of the solution with air and the other half with N2 for 20 min and then mix the two solutions. Add the required amount of DIC (Table 3, highlighted in yellow for this example) which is 2.2 mmol L−1. Add the DIC in the form of KHCO3, NaHCO3 or a mixture, and acidify the solution to pH 7.35 using HCl. This results in a solution with a CA of 2 mmol L−1 (in mmol L−1: 1.995 + 0.002 ) and 200 μmol L−1 CO2 (Table 3).
Incubator with light and temperature control
The incubator provides constant temperature and mixing throughout the incubation. It consists of a vertically rotating wheel where glass bottles or vials can be clipped on facing the light source. The wheel rotates at about 10 rpm in a tank with temperature controlled water and a transparent glass or Perspex wall for illumination at various irradiances (Figure 1C).
The rotating wheel incubator was originally invented for photosynthesis measurements in phytoplankton (Steemann Nielsen, 1952) and the typical light source in commercially available models consists of a rack of fluorescent tubes. However, it is hard to achieve PAR levels much above 500 μmol photons m−2 s−1 with fluorescent light so high pressure metal halide lamps (mercury or sodium) or light emitting plasma lamps are required to provide the levels of light needed to light saturate net photosynthesis by leaves of many terrestrial species and some macroalgae with thick thalli.
Photosynthesis versus light curves (i.e. light response curves) are obtained by: (i) regulating light intensities by varying the distance of the light source to the incubator, (ii) placing neutral shading filters in front of the light source, (iii) placing a box with neutral shading filters of variable transmission in front of individual vials, or (iv) by wrapping the vials in layers of neutral shading mesh, or by a combination of these various approaches.
O2 measurements
The O2 produced or consumed during incubation can be measured directly in the glass vials using O2 electrodes or optodes. In the absence of good electrodes or optodes, the Winkler titration can also be applied; see Strickland and Parsons (1972) for details.
Contemporary methods for O2 measurements in water involve either Clark type electrodes or optodes. A Clark type O2 electrode measures pO2 as molecular O2 transverses a membrane before the electrochemical reaction on the cathode results in a current which is linearly proportional to the pO2 of the medium. Since the electrode consumes O2, a conventional large O2 electrode is quite stirring sensitive and it is thus much more convenient to use an O2 microelectrode which consumes little O2 to address the stirring issue during measurements; O2 microelectrodes can have a stirring sensitivity of less than 1% (Revsbech and Jørgensen, 1986; Revsbech, 1987). Oxygen microelectrodes typically have a temperature coefficient of approximately 1–3%°C−1 (Revsbech, 1987; Gundersen et al., 1998) so temperature control during measurements is essential. The temperature effect on electrodes (and optodes, see below) is primarily caused by changes in diffusion and electrochemistry. In addition, temperature also influences solubility of gases, and metabolic rate of the tissues.
The measuring principle of optodes is quite different from that of a Clark type electrode. In the optode, light excites a fluorophore coated onto the tip of fiber optics and the excited light is subsequently transmitted back and measured by a spectroradiometer (Klimant et al., 1997). Alternatively, the fluorophore can be coated onto tiny plastic patches which (microdots) can be mounted directly in the medium where O2 is to be measured; the microdot with the fluorophore is then illuminated from the outside through the transparent wall of the container. Molecular O2 quenches the florescence so that the transmitted signal can be calibrated toward O2 in the medium; the relationships between quenching and pO2 is non-linear. Optodes do not consume O2 and are thus completely insensitive to stirring. However, O2 optodes can have higher temperature coefficients than Clark type microelectrodes and require even better temperature control during measurements (Kragh et al., 2008). On the other hand, optodes can be built into the individual glass vials (microdots glued onto the glass wall inside the vial) and the O2 concentration can be measured in a non-destructive manner (Kragh et al., 2008). The great advance of this approach is that vials can remain sealed and be returned to the rotating wheel if a preliminary reading shows that longer incubation is required in order to obtain the necessary accuracy, or O2 evolution can be followed over time to ensure quasi steady state measurements or to elucidate possible temporal patterns.
Supporting measurements and calculations
After measuring O2 of each vial, the tissue must be processed according to standard procedures to establish the area, the fresh mass or dry mass, the chlorophyll concentration, or all of the above. The underwater net photosynthesis is calculated as the net O2 evolution rate per unit tissue per unit time. In practice, the change in O2 content in each vial (change in O2 concentration multiplied by the volume of the vial; individual volumes of vials (i.e. minus the volume of the glass beads, etc.) must be established) divided by the incubation time and divided by the amount of tissue (i.e., mass, area or any other of the above mentioned parameters used to scale photosynthesis per sample unit). An example of a CO2 response curve established with the technique described here in Section “The Rotating Wheel Incubator” is shown in Figure 6.
Figure 6
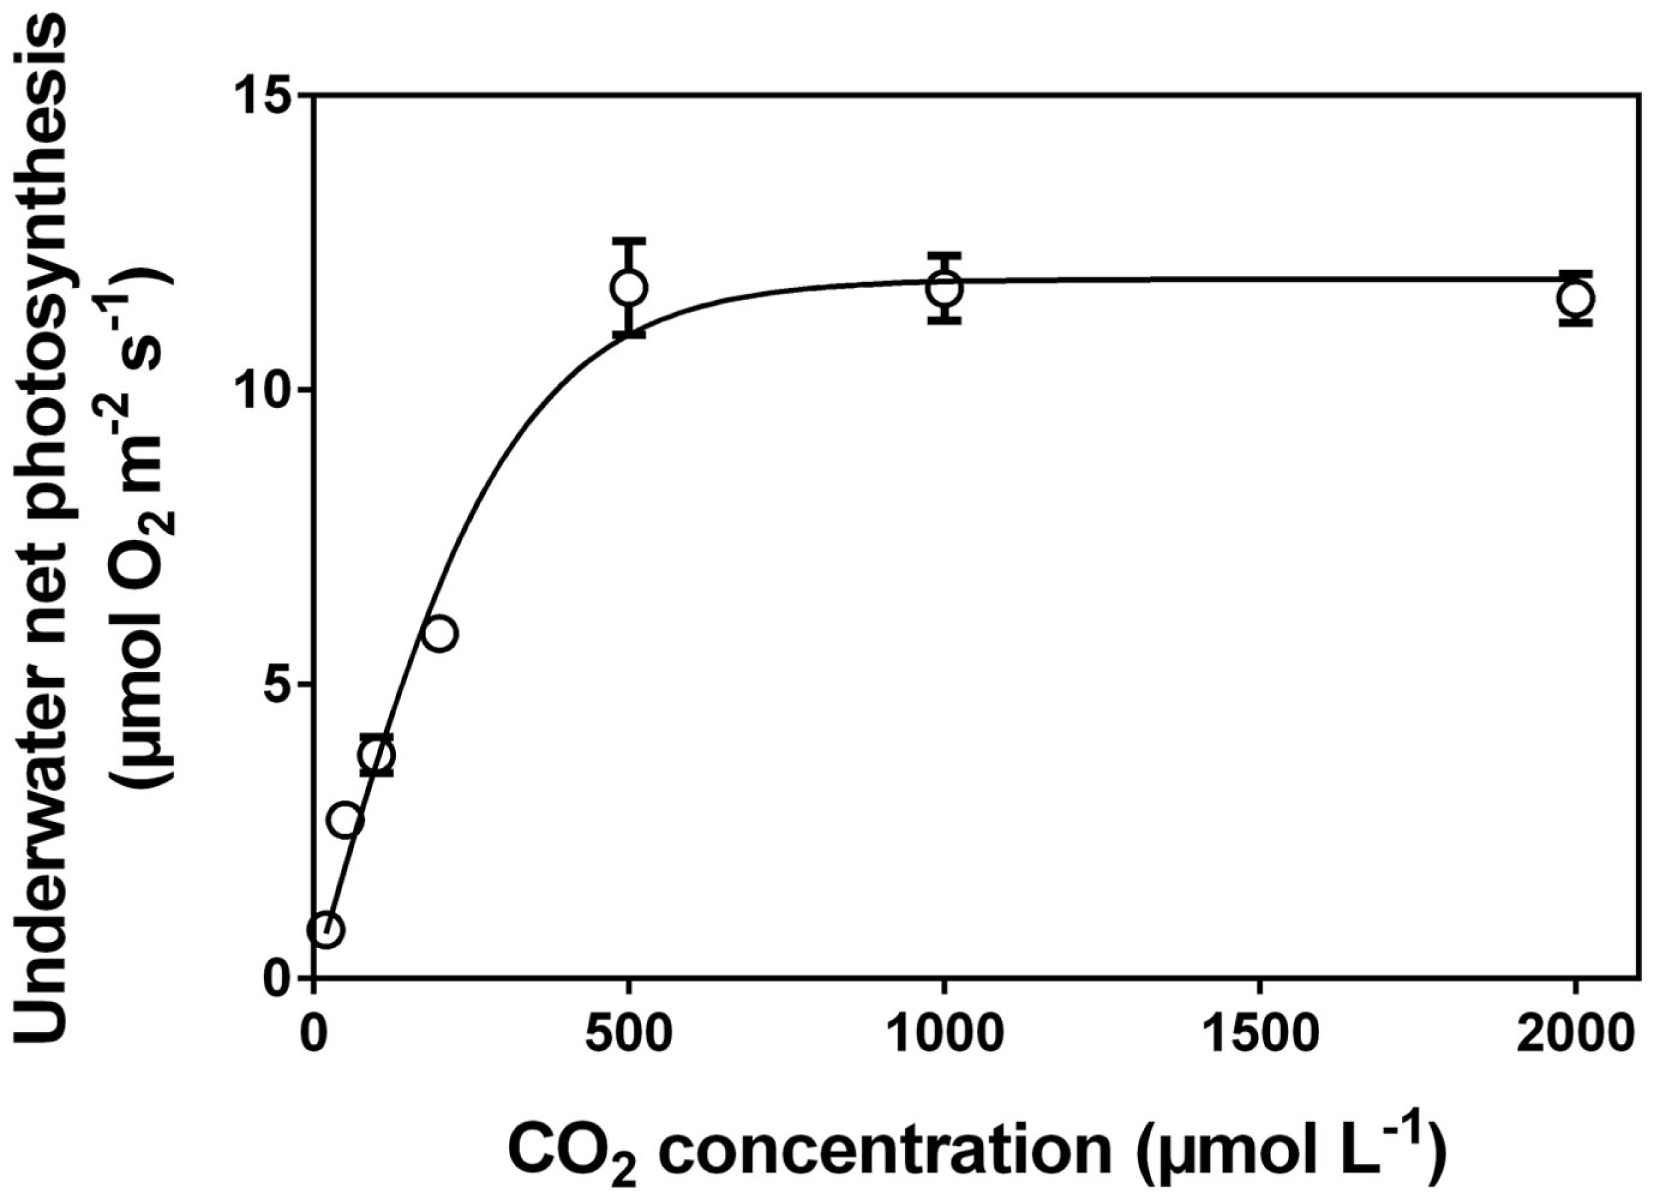
Underwater net photosynthesis versus CO2 concentration in the medium for excised leaf segments of Hordeum marinum. Leaf segments (30 mm) were incubated in 35 mL glass vials with various well defined CO2 concentrations on a rotating wheel with PAR of 350 μmol photons m−2 s−1 at 20°C (see Figure 1C). O2 evolution was measured with a Clark type O2 microelectrode and underwater net photosynthesis was calculated as O2 evolution per projected area per unit time (See “The Rotating Wheel Incubator”). Data (mean ± SE, n=5) from (Pedersen et al., 2010). Note: leaves of H. marinum are superhydrophobic and so possess a gas film when underwater.
The closed chamber with injection ports
Principle: a leaf or algal thalli sample is incubated in a closed chamber with internal mixing and possessing injection ports and fitted with an electrode/optode that follows O2 concentration. The amount of free CO2 can be manipulated by injection of acid or base while a fitted pH electrode allows calculation of the exact CO2 level. The approach enables production of a complete light or CO2 response curve based on the same sample, and underwater net photosynthesis can be calculated based on e.g., leaf area, fresh mass, dry mass, and/or chlorophyll concentration. Incubation in darkness can provide data on dark respiration.
Chamber with light and temperature control
The chamber for measurements of underwater net photosynthesis enables measurements with light, temperature, and CO2 manipulations in water, with monitoring of O2 with time. Chambers are commercially available for underwater photosynthesis measurements on macro algae, phytoplankton, or isolated chloroplasts and these are made from glass, acrylic glass, or acetal. These chambers can also be custom built to match specific electrodes, light sources, and fitted with extra ports for temperature and PAR sensors and injection of acid/bases or inhibitors. The chamber must be made from a material the can be sterilized and also have a least one transparent side to enable illumination of the sample. The light source can be diode based (650 nm red diode) or “full spectrum” halogen light to simulate white sunlight. Pay attention to the fact that some lighting devices are unable to produce sufficient light to saturate the photosynthesis of some terrestrial leaves or thick macroalgae thalli. Illumination (even by means of fiber optics) produces heat, so cooling of the chamber by a water jacket is crucial.
A light sensor small enough to measure inside the chamber is also essential. The spherical PAR sensor US-SQS/L (Walz, Effeltrich, Germany) is of a size (Ø = 3.7 mm) that enables permanent installation in most chambers.
Finally, the issue of mixing must be addressed. The simplest solution is to use a glass coated stir bar (avoid Teflon coated stir bars as these can hold O2) which is isolated from the sample with a coarse mesh to prevent contact with the tissue. It may be necessary to fix the tissue in the swirling current; if the tissue rotates with the water current in the chamber, the DBL will be larger than if the tissue is fixed. The thicker DBL increases the apparent resistance to CO2 uptake or O2 escape.
O2 and pH measurements
O2 measurements in the closed chamber are similar to O2 measurements in the vials described in Section “O2 Measurements.” An O2 sensor (Clark type electrode or optode) is fixed in the chamber in one of the ports, or if an optode is used, a patch with fluorophore can be glued onto the interior wall. A pH electrode is fitted in a second port and the signals from both sensors are logged onto a computer with data acquisition software. Calibration of both O2 and pH sensors should be performed in the chamber to avoid stirring related artifacts to the calibrations. Remember to pay extra attention to temperature if using O2 optodes. It may take a while for the temperature of the solution inside the chamber to equilibrate with that of the cooling jacket, and working in a constant temperature room or keeping solutions in a thermostated water bath will significantly reduce the time it takes before a temperature steady state is obtained; always measure temperature directly in the chambers. Temperature influences electrode or optode performance, solubility of gases, and metabolic rate of the tissues (see Section “O2 Measurements”). After insertion of tissue and filling of the chamber with medium (see below), pH can be manipulated by injection of small amounts of acid or base through one of the injection ports. Fit a 27G needle in one of the injection ports and let it function as “over pressure valve” to prevent pressurization during injection of acid or base (or inhibitors); the needle may be left in the stopper during the experiment as diffusion of gases in water is too slow to result in experimental artifacts.
As described in Section “The Rotating Wheel Incubator” for incubations of tissues in closed vials on the wheel, substantial photorespiration can occur if O2 is allowed to build up in the medium. Therefore, the susceptibility to photorespiration should initially be established for each tissue type. The linearity of O2 production with increasing external pO2 is easily tested the following way: a medium with total DIC of 5.0 mmol L−1 is prepared from KHCO3 in a 5.0 mmol L−1 TES buffer adjusted to pH 8.00 and with a pO2 of 10 kPa. The tissue is then allowed to photosynthesize up to a pO2 of 30 kPa. Here, approximately 500 μmol O2 has been produced from 500 μmol CO2 and because of the TES buffer the pH has remained at 8.0. Although the DIC pool has declined to 4.5 mmol L−1, free CO2 has changed by only 10% from 110 to 100 μmol L−1. If the O2 evolution occurs linearly in this range, it means that the approximately threefold lower CO2:O2 in the medium, with likely even greater changes in internal CO2:O2, has not increased photorespiration. If the curve exhibits a saturation tendency (i.e. declining rate of net O2 production with increasing pO2), photorespiration has probably increased with increasing pO2 in the chamber.
Medium and tissue may be prepared as described in Section “Medium and Tissue.” However, as a CO2 response curve in the closed photosynthesis chamber often involves conversion of into free CO2 (dissolved), e.g., by manipulation of pH, enough must initially be present in the medium to produce the required levels of free CO2. Following injection of small amounts of acid or base to manipulate free CO2, the rate of net photosynthesis changes accordingly so that a new rate of net O2 production (slope of dissolved O2 with time) is established at each dissolved CO2. However, pH may also change slightly in the time interval because CO2 is extracted from the system as it is fixed via photosynthesis (Eqs 1 and 4). Hence, for every rate of underwater net photosynthesis determined in a time interval, the mean CO2 concentration must be calculated in order to present the CO2 response curve of the tissue.
Example 2: average free CO2 concentration in the pH range from 7.25 to 7.30 in a medium with total DIC of 2.0 mmol L−1. According to Gutz (2012), CA of such a solution at pH 7.25 would be 1.77 mmol L−1 having 223 μmol CO2 L−1; at pH 7.30 CA would be 1.80 mmol L−1 and have 203 μmol CO2 L−1. Consequently, the average free CO2 concentration in the pH range was 213 μmol CO2 L−1.
After each experiment, the incubated tissue must be characterized to enable calculation of underwater net photosynthesis rates; the supporting measurements are as those described in section “Supporting Measurements and Calculations.”
pH drift approach to establish CO2 compensation points
Principle: Leaf or algal thalli samples are incubated in glass vials for 16–18 h where after pH and CA or DIC are measured. CO2 compensation points and carbon extraction capacity of tissues can be calculated. The method is also used as a diagnostic test for bicarbonate () use in underwater photosynthesis.
These long term incubations are used to test how far net photosynthesis of a given plant sample at saturating light can extract DIC, i.e. to deplete CO2 and and drive up pH. Because the objective is to determine the ultimate DIC extraction capacity and maximum upper pH in a standardized way, all incubation vials are prepared to have an equal standard DIC concentration (usually 1–2 mmol L−1 for alkaline waters and 0.1–0.3 mmol L−1 for softwaters) and a pH, CO2, and O2 concentration corresponding to air equilibrium (Sand-Jensen et al., 1992, 2009). Artificial media and natural waters can be applied. However, to minimize O2 build up and the risk of photorespiration during extended incubation the initial O2 can be reduced to 20–50% of air equilibrium. To ensure the maximum possible DIC depletion, the amount of plant material is typically three times larger than in the incubations described in Sections “The rotating Wheel Incubator” and “The Closed Chamber with Injection Ports” though it must still be able to move freely in the vials to ensure adequate mixing.
The initial and final DIC and pH must be determined in order to calculate the DIC extraction capacity during incubation and the CO2 compensation point after incubation. Provided no internal pools of DIC and protons interfere with conditions in the water/medium and no precipitation or dissolution of carbonates takes place, DIC can be determined in the medium from CA, pH, temperature, and ionic strength; CA in turn can be determined by acidimetric titration (Stumm and Morgan, 1996). The risk of carbonate precipitation is small in artificial media of KHCO3 and much larger in natural waters and artificial media where Ca(HCO3)2 dominates, the reason being that K2CO3 is highly soluble and CaCO3 is poorly soluble. Calcium carbonate precipitation is likely to take place in pH drift experiments where final pH exceeds 10. Therefore, it is always recommended to directly measure DIC. This can be done by injecting of small water samples into concentrated acid in a bubble chamber purged with N2 gas carrying the released CO2 into an IRGA (Vermaat and Sand-Jensen, 1987). Water samples may need to be filtered (with no atmospheric contact) if minute CaCO3 crystals have been formed in the external water of high pH. It is generally recommendable to determine (or check) CO2 compensation points by depletion experiments in media of low initial DIC (<50 μmol L−1) and low pH (<6.5) where the interference by is low and CaCO3 is not formed.
The pH drift technique has also been used to determine DIC consumption at intervals during the ongoing drift of pH upwards (Maberly and Spence, 1983; Spence and Maberly, 1985). DIC, pH, the proportion of carbon species and O2 change during the time of incubation. Because all parameters may influence photosynthesis, and exchange with internal DIC and proton pools in the incubated tissue may interfere with calculations, we cannot recommend the procedure for determining rates of net photosynthesis considering the much more accurate and straightforward methods being available today (as described in this review).
Community photosynthesis in large chambers
Principle: Community photosynthesis is measured in large closed chambers with linear dimensions of 0.5–0.6 m, or larger, to minimize edge effects and make certain that natural changes of plant density, tissue capacity and irradiance through the canopy are maintained. Photosynthetic rates are measured by O2 and DIC, as for phytoelements in small chambers (See The Closed Chamber with Injection Ports), but photosynthetic parameters and their dependence on DIC and temperature are markedly different for communities than phytoelements.
Submerged aquatic plants grow in communities of variable density where the spatial structure and self shading are prominent features (Sand-Jensen, 1989). Light limitation is substantial and the efficiency of photosynthesis at low light is therefore important (Binzer and Sand-Jensen, 2002a,b). The photosynthetic chamber needs to be large enough to include tall communities (Binzer et al., 2006; Middelboe et al., 2006). It is made of glass or transparent acrylic glass and viewed from above, the shape of photosynthetic chambers can be cylindrical, rectangular, or quadratic. The cylindrical shape can be advantageous because the surface area of side walls relative to chamber volume is smaller than in rectangular or quadratic chambers, and these two latter types may also have “dead corners” with stagnant waters. The light sources are high pressure metal halide lamps (mercury or sodium) or light emitting plasma lamps because only those provide a sufficiently high irradiance (>1000 μmol photon m−2 s−1). The light sources must be placed more than 0.5 m above the photosynthetic chamber and the light path both above the chamber and around the chamber walls are surrounded by totally reflecting material to reduce the influence of distance with depth in the chamber both when plants are absent or present. Irradiance is measured with depth in the water and through canopies of different densities using a small spherical PAR sensor. To ensure statistically reliable determinations of vertical attenuation a series (e.g., 10) of measurements are performed at different positions (Middelboe et al., 2006). Temperature, O2, DIC, and pH are set and measured as described in Section “The Closed Chamber with Injection Ports,” while mixing is provided by large submersible pumps ensuring current velocities above 2 cm s−1. Temperature control is attained by direct cooling and warming of the water in the incubation chamber or by placing it in a larger temperature controlled holding tank. In the latter case some temperature variations (1–3°C) is difficult to avoid between light and darkness.
Algal communities for measurements can be collected attached to stones or established over a period of one or several years on artificial tiles of desired size set out in the field and later brought to the laboratory for measurements in the photosynthetic chamber (Binzer et al., 2006; Middelboe et al., 2006). Rooted submerged plants can be harvested from natural stands with the 3D structure kept intact when roots and rhizomes are interwoven. In other cases, individual plants are placed in a homogeneous pattern on the chamber bottom in small plastic bags surrounding the root system. Alternatively the individuals are tied to a frame on the chamber bottom. Plant density is determined as fresh mass, dry mass, or plant surface area normalized to bottom area. Leaf area indices (LAI) ranging from 1 to 12 are useful for comparisons among species. Vertical distribution of plant biomass and surface can be determined by cutting the plants sequentially in well defined strata starting at the top of the canopy.
The setup is suited to evaluate the influence on community photosynthesis by variable irradiance, temperature, DIC (including variable CO2 and ), canopy density, and spatial structure (Sand-Jensen et al., 2007).
Community photosynthesis can also be determined over longer periods of time by employing the large chambers in an open mode. This allows for exchange of O2 and CO2 with the atmosphere to prevent that the chambers undergo too extensive accumulation and depletion in the water during several days of alternating light or dark periods. For calculation of photosynthesis and respiration, exchange rates between air and water must be determined. The flux (Fexch, mol m−2 s−1) between water and air for O2 is given by the equation: where K is the exchange coefficient (piston velocity, ms−1), Cact is the actual and Cequ is the equilibrium concentration of O2 (mol m−3) in water at the actual temperature (Staehr et al., 2012b). Piston velocity is controlled by surface turbulence and can, therefore, be considered a constant for a given mixing regime determined by the strength and location of the pumps and the dampening influence of the plant community. Thus, K must be directly measured for a given plant density and mixing regime. This is best done in the dark, where only dark respiration (mol m−2 s−1) takes place, by modifying Cact to for example 10 or 30 kPa and measuring the total O2 flux (F) over time as a result of respiration and exchange with the atmosphere above from time changes in O2 concentrations in the water:
From 30 kPa the actual pO2 will first rapidly decline as a combined result of respiration and loss to the atmosphere and gradually decline less rapidly as pO2 approaches equilibrium with the atmosphere and respiration alone drives pO2 further downwards. Calculations of pO2 changes over time in relation to differences in the pO2 gradient between water and air produces a straight line (Eq. 8) permitting calculation of R and K assuming that they remain constant for a given mixing intensity and plant density.
Community measurements operated in an open mode have the main advantage for future application that fluxes of O2, DIC, Ca2+, H+, and nutrient ions (NH4+, NO3−, and PO43−) can be determined during repeated diel light dark cycles for several weeks while the submerged plants may also grow. Combined field measurements have been operated in open chambers and mesocosms under a strict mixing regime under natural temperature and light conditions both for phytoplankton (e.g., Markager and Sand-Jensen, 1989), submerged aquatic plants (e.g., Liboriussen et al., 2005), and flooded terrestrial plants (e.g., Setter et al., 1988).
The open natural system
Principle: Natural ecosystems dominated by submerged aquatic plants have free undisturbed gas exchange with the atmosphere and input/output of water. Determination of ecosystem metabolism by open water measurements requires accurate calculations of atmospheric exchange of O2 and CO2. The main advantages of the ecosystem approach is that environmental conditions and processes are natural and temporal patterns can be followed over months or years, while allowing plant density and acclimation to gradients in light, DIC, and other environmental variables to develop.
Photosynthesis of submerged aquatic plants derived from analysis of ecosystems can only be determined when rooted plants or macroalgae are the main phototrophs responsible of more than 90% of ecosystem photosynthesis. Only then can the patterns obtained be referred to the metabolism of macrophytes accepting that a minor error (<10%) due to photosynthesis of microalgae may be present. The dominance of submerged aquatic plants can be realized in shallow plant rich ponds, lakes, streams, and coastal lagoons. Open water measurements are used to follow changes in O2, DIC, pH, temperature, and irradiance, and enable calculation of ecosystem net production, plant gross production, and community respiration assuming fully mixed conditions (Odum, 1956; Staehr et al., 2012a). Meteorological observations of wind direction, wind velocity, atmospheric pressure, etc., in standing waters and current velocity, water depth, slope, and bed roughness in flowing waters, can be used to estimate physical exchange coefficients of gases (i.e. piston velocities) and thus calculate fluxes between water and atmosphere using empirical models (Sand-Jensen and Staehr, 2011). Flow chambers, floating chambers, inert gases, and coverage of water surfaces by impermeable floating plastic can be used for direct determination of exchange coefficients which are critical in all determinations of ecosystem metabolism (Staehr et al., 2012a,b). Rooted plants with gas filled lacunae formation and release of gas bubbles can introduce error. Oxygen storage may delay establishment of steady state exchange of O2 following dark light switches by some 10–20 min for most rooted plants (Westlake, 1978) and loss of bubbles is negligible in swift flowing waters, while bubble release may account for 10% of net O2 release in slow flowing waters (Kragh et al., unpublished data).
The strength of these measurements is that they provide natural rates under fully realistic and undisturbed environmental conditions. They can reveal the coupling between O2 and carbon metabolism, the natural precipitation and dissolution of carbonates and the direct involvement of accumulation and release of acids in the photosynthetic process. Measurements have shown fast exchange rates of protons between macrophytes and water following diurnal light dark switches partly uncoupled from exchanges of DIC during photosynthesis and respiration; a phenomenon that is not unraveled in short term laboratory measurements with detached phytoelements (Kragh et al., unpublished data). Ecosystem measurements can also reveal how early summer growth in biomass and late summer senescence influence plant metabolism and how ongoing desiccation of ponds may suddenly stop photosynthesis and accelerate decomposition, while refilling may restart photosynthesis and growth (Christensen et al., 2013). Modeling approaches, as successfully used for canopy level understanding of terrestrial systems systems (Ainsworth and Long, 2005), should also be applied more widely in studies of aquatic systems (e.g., Binzer and Sand-Jensen, 2002a,b). All techniques for measuring and calculating ecosystem process are basically available (Staehr et al., 2012a) and awaits broad scale application.
Outlook
Studies of photosynthesis by aquatic and submerged wetland plants are few compared with research on photosynthesis in air, but underwater systems are attracting more attention. Light and CO2 availability under water are often low to submerged plants. Low CO2 together with impeded escape of O2 can result in high photorespiration as a component determining net photosynthesis. Focus studies of contrasting species and systems are required to develop our understanding of “models” since the environment under water is more complex than in air and there is a diversity of photosynthetic mechanisms (i.e. C3, C4, CAM, and bicarbonate use) in aquatic species.
The physical and chemical environments of overland floods are only poorly known and few data exist on light extinction and CO2 and O2 concentrations in floodwaters. Such data are crucial to design relevant laboratory experiments on submergence tolerance of terrestrial plants and to establish, for example, carbon budgets during submergence on leaf lamina as well as for whole plants. Also, studies on leaf acclimation of terrestrial plants to facilitate gas exchange and light utilization under water are also only in their infancy; these acclimations influence underwater photosynthesis as well as internal aeration of plant tissues during submergence.
Finally, a challenge also exists to assess the influence of light, inorganic carbon, and temperature on natural aquatic communities of variable density instead of only studying detached leaves in the scenarios of rising CO2 and temperature. Use of mathematical modeling, both at the leaf and community levels, will provide valuable additional understanding of underwater photosynthesis. Improved knowledge of plant and environmental factors determining rate of underwater net photosynthesis at various scales (leaf-to-community) is essential for understanding aquatic plant ecophysiology, submergence tolerance of terrestrial plants, and productivity of the many aquatic and flood-prone ecosystems worldwide.
Statements
Acknowledgments
The present work was carried out with support of the Danish Council for Independent Research grant no. 09-072482 and under the Lake Restoration Centre, a Villum Kann Rasmussen Centre of Excellence. Timothy D. Colmer acknowledges support from the Australian Research Council (Discovery Grant).
Conflict of interest
The authors declare that the research was conducted in the absence of any commercial or financial relationships that could be construed as a potential conflict of interest.
References
1
Adams M. S. Guilizzoni P. Adams S. (1978). Relationship of dissolved inorganic carbon to macrophyte photosynthesis in some Italian lakes. Limnol. Oceanogr.23, 912–919.10.4319/lo.1978.23.5.1025
2
Ainsworth E. A. Long S. P. (2005). What have we learned from 15 years of free-air CO2 enrichment (FACE)? A meta-analytic review of the responses of photosynthesis, canopy properties and plant production to rising CO2. New Phytol.165, 351–372.10.1111/j.1469-8137.2004.01224.x
3
Arens K. (1933). Physiologisch polarisierter Massenaustausch und Photosynthese bei submersen Wasserpflanzen. I. Planta20, 621–658.10.1007/BF01910650
4
Armstrong W. (1979). Aeration in higher plants. Adv. Bot. Res.7, 225–332.10.1016/S0065-2296(08)60089-0
5
Bailey-Serres J. Fukao T. Ismail A. M. Heuer S. Mackill D. J. (2010). Submergence tolerant rice: SUB1’s journey from landrace to modern cultivar. Rice3, 138–147.10.1007/s12284-010-9048-5
6
Bailey-Serres J. Voesenek L. A. C. J. (2008). Flooding stress: acclimations and genetic diversity. Annu. Rev. Plant Biol.59, 313–339.10.1146/annurev.arplant.59.032607.092752
7
Binzer T. Sand-Jensen K. (2002a). Importance of structure and density of macroalgae communities (Fucus serratus) for photosynthetic production and light utilisation. Mar. Ecol. Prog. Ser.235, 53–62.10.3354/meps235053
8
Binzer T. Sand-Jensen K. (2002b). Production in aquatic macrophyte communities: a theoretical and empirical study of the influence of spatial light distribution. Limnol. Oceanogr.47, 1742–1750.10.4319/lo.2002.47.6.1742
9
Binzer T. Sand-Jensen K. Middelboe A. L. (2006). Community photosynthesis of aquatic macrophytes. Limnol. Oceanogr.51, 2722–2733.10.4319/lo.2006.51.6.2722
10
Black M. A. Maberly S. C. Spence D. H. N. (1981). Resistances to carbon dioxide fixation in four submerged freshwater macrophytes. New Phytol.89, 557–568.10.1111/j.1469-8137.1981.tb02335.x
11
Borum J. Pedersen O. Greve T. M. Frankovich T. A. Zieman J. C. Fourqurean J. W. et al (2005). The potential role of plant oxygen and sulphide dynamics in die-off events of the tropical seagrass, Thalassia testudinum. J. Ecol.93, 148–158.10.1111/j.1365-2745.2004.00943.x
12
Brewer C. A. Smith W. K. (1997). Patterns of leaf surface wetness for montane and subalpine plants. Plant Cell Environ.20, 1–11.10.1046/j.1365-3040.1997.d01-15.x
13
Christensen J. P. A. Sand-Jensen K. Staehr P. A. (2013). Fluctuating water levels control water chemistry and metabolism of a charophyte pond. Freshw. Biol.10.1111/fwb.12132
14
Cole J. J. Prairie Y. T. Caraco N. F. McDowell W. H. Tranvik L. J. Striegl R. G. et al (2007). Plumbing the global carbon cycle: integrating inland waters into the terrestrial carbon budget. Ecosystems10, 172–185.10.1007/s10021-006-9013-8
15
Colmer T. D. Pedersen O. (2008). Underwater photosynthesis and respiration in leaves of submerged wetland plants: gas films improve CO2 and O2 exchange. New Phytol.177, 918–926.10.1111/j.1469-8137.2007.02318.x
16
Colmer T. D. Voesenek L. A. C. J. (2009). Flooding tolerance: suites of plant traits in variable environments. Funct. Plant Biol.36, 665–681.10.1071/FP09144
17
Colmer T. D. Winkel A. Pedersen O. (2011). A perspective on underwater photosynthesis in submerged terrestrial wetland plants. AoB Plants2011, lr030.10.1093/aobpla/plr030
18
Dickson A. G. (1981). An exact definition of total alkalinity and a procedure for the estimation of alkalinity and total inorganic carbon from titration data. Deep Sea Res. A28, 609–623.10.1016/0198-0149(81)90121-7
19
Duarte C. M. (1991). Seagrass depth limits. Aquat. Bot.40, 363–377.10.1016/0304-3770(91)90081-F
20
Frost-Christensen H. Sand-Jensen K. (1992). The quantum efficiency of photosynthesis in macroalgae and sumberged angiosperms. Oecologia91, 377–384.10.1007/BF00317627
21
Gundersen J. K. Ramsing N. B. Glud R. N. (1998). Predicting the signal of O2 microsensors from physical dimensions, temperature, salinity, and O2 concentration. Limnol. Oceanogr.43, 1932–1937.
22
Gutz I. G. R. (2012). CurTiPot – pH and Acid-base Titration Curves: Analysis and Simulation Software, Version 3.6.1 [Online]. Available at: http://www2.iq.usp.br/docente/gutz/Curtipot.html [accessed 16 Dec 2012 2013].
23
Hartman R. T. Brown D. L. (1967). Changes in internal atmosphere of submersed vascular hydrophytes in relation to photosynthesis. Ecology48, 252–258.10.2307/1933107
24
Helder R. J. (1985). Diffusion of inorganic carbon across an unstirred layer: a simplified quantitative approach. Plant Cell Environ.8, 399–408.10.1111/j.1365-3040.1985.tb01675.x
25
Holmer M. Pedersen O. Krause-Jensen D. Olesen B. Petersen M. H. Schopmeyer S. et al (2009). Sulfide intrusion in the tropical seagrasses Thalassia testudinum and Syringodium filiforme. Estuar. Coast. Shelf Sci.85, 319–326.10.1016/j.ecss.2009.08.015
26
Johnson F. H. Eyring H. Stover B. J. (1974). The Theory of Rate Processes in Biology and Medicine. New York: Wiley.
27
Kelly M. G. Thyssen N. Moeslund B. (1983). Light and the annual variation of oxygen- and carbon-based measurements of productivity in a macrophyte-dominated river. Limnol. Oceanogr.28, 503–515.10.4319/lo.1983.28.3.0503
28
Kemp W. M. Marlon R. L. Jones T. W. (1986). Comparison of methods for measuring production by the submersed macrophyte, Potamogeton perfoliatus L. Limnol. Oceanogr.31, 1322–1334.10.4319/lo.1986.31.6.1322
29
Kirk J. T. O. (1994). Light and Photosynthesis in Aquatic Ecosystems. New York: Cambridge Univ Press.
30
Klimant I. Kühl M. Glud R. N. Holst G. (1997). Optical measurement of oxygen and temperature in microscale: strategies and biological applications. Sens. Actuators B Chem.38, 29–37.10.1016/S0925-4005(97)80168-2
31
Kragh T. Søndergaard M. Tranvik L. (2008). Exposure to sunlight and phosphorus-limitation on bacterial degradation of coloured dissolved organicmatter (CDOM) in freshwater. FEMS Microbiol. Ecol.64, 230–239.10.1111/j.1574-6941.2008.00449.x
32
Lambers H. Chapin F. S. III Pons T. L. (2008). Plant Physiological Ecology. Heidelberg: Springer Verlag.
33
Larsson C. Axelsson L. (1999). Bicarbonate uptake and utilization in marine macroalgae. Eur. J. Phycol.34, 79–86.10.1080/09670269910001736112
34
Liboriussen L. Landkildehus F. Meerhoff M. Bramm M. E. Søndergaard M. Christensen C. et al (2005). Global warming: design of a flow-through shallow lake mesocosm climate experiment. Limnol. Oceanogr. Methods3, 1–9.10.4319/lom.2005.3.1
35
Long S. P. (1991). Modification of the response of photosynthetic productivity to rising temperature by atmospheric CO2 concentrations: has its importance been underestimated?Plant Cell Environ.14, 729–739.10.1111/j.1365-3040.1991.tb01439.x
36
Lucas W. J. Smith F. A. (1973). The formation of alkaline and acid regions at the surface of Chara corallina cells. J. Exp. Bot.24, 1–14.10.1093/jxb/24.1.1
37
Maberly S. C. (1990). Exgenous sources of inorganic carbon for photosynthesis by marine macroalgae. J. Phycol.26, 439–449.10.1111/j.0022-3646.1990.00439.x
38
Maberly S. C. (1996). Diel, episodic and seasonal changes in pH and concentrations of inorganic carbon in a productive lake. Freshw. Biol.35, 579–598.10.1111/j.1365-2427.1996.tb01770.x
39
Maberly S. C. Madsen T. V. (2002). Freshwater angiosperm carbon concentrating mechanisms: processes and patterns. Funct. Plant Biol.29, 393–405.10.1071/PP01187
40
Maberly S. C. Spence D. H. N. (1983). Photosynthetic inorganic carbon use by freshwater plants. J. Ecol.71, 705–724.10.2307/2259587
41
Maberly S. C. Spence D. H. N. (1989). Photosynthesis and photorespiration in freshwater organisms: amphibious plants. Aquat. Bot.34, 267–286.10.1016/0304-3770(89)90059-4
42
Mackereth F. J. H. Heron J. Talling J. F. (1978). Water Analysis: Some Revised Methods for Limnologists. Cumbria: Freshwater Biological Association.
43
Mackill D. J. Ismail A. M. Singh U. S. Labios A. V. Paris T. R. (2012). Development and Rapid Adoption of Submergence-Tolerant (Sub1) Rice Varieties. San Diego: Academic Press, 299–352.
44
Madsen T. V. Sand-Jensen K. (1991). Photosynthetic carbon assimilation in aquatic macrophytes. Aquat. Bot.41, 5–40.10.1016/0304-3770(91)90037-6
45
Madsen T. V. Sand-Jensen K. Beer S. (1993). Comparison of photosynthetic performance and carboxylation capacity in a range of aquatic macrophytes of different growth forms. Aquat. Bot.44, 373–384.10.1016/0304-3770(93)90078-B
46
Markager S. Sand-Jensen K. (1989). Patterns of night-time respiration in a dense phytoplankton community under a natural light regime. J. Ecol.77, 49–61.10.2307/2260915
47
McConnaughey T. A. (1991). Calcification in Chara corallina: CO2 hydroxylation generates protons for bicarbonate assimilation. Limnol. Oceanogr.36, 619–628.10.4319/lo.1991.36.4.0619
48
McConnaughey T. A. La Baugh J. W. Rosenberry D. O. Striegl R. G. Reddy M. M. Schuster P. F. et al (1994). Carbon budget for a groundwater-fed lake: calcification supports summer photosynthesis. Limnol. Oceanogr.39, 1319–1332.10.4319/lo.1994.39.6.1319
49
Middelboe A. L. Markager S. (1997). Depth limits and minimum light requirements of freshwater macrophytes. Freshw. Biol.37, 553–568.10.1046/j.1365-2427.1997.00183.x
50
Middelboe A. L. Sand-Jensen K. Binzer T. (2006). Highly predictable photosynthetic production in natural macroalgal communities from incoming and absorbed light. Oecologia150, 464–476.10.1007/s00442-006-0526-9
51
Mommer L. Lenssen J. P. M. Huber H. Visser E. J. W. De Kroon H. (2006a). Ecophysiological determinants of plant performance under flooding: a comparative study of seven plant families. J. Ecol.94, 1117–1129.10.1111/j.1365-2745.2006.01175.x
52
Mommer L. Pons T. L. Visser E. J. W. (2006b). Photosynthetic consequences of phenotypic plasticity in response to submergence: Rumex palustris as a case study. J. Exp. Bot.57, 283–290.10.1093/jxb/erj015
53
Mommer L. Visser E. J. W. (2005). Underwater photosynthesis in flooded terrestrial plants: a matter of leaf plasticity. Ann. Bot.96, 581–589.10.1093/aob/mci212
54
Mommer L. Wolters-Arts M. Andersen C. Visser E. J. W. Pedersen O. (2007). Submergence-induced leaf acclimation in terrestrial species varying in flooding tolerance. New Phytol.176, 337–345.10.1111/j.1469-8137.2007.02166.x
55
Moulin P. Andría J. R. Axelsson L. Mercado J. M. (2011). Different mechanisms of inorganic carbon acquisition in red macroalgae (Rhodophyta) revealed by the use of TRIS buffer. Aquat. Bot.95, 31–38.10.1016/j.aquabot.2011.03.007
56
Neinhuis C. Barthlott W. (1997). Characterization and distribution of water-repelent, self-cleaning plant surfaces. Ann. Bot.79, 667–677.10.1006/anbo.1997.0400
57
Nielsen S. L. (1993). A comparison of aerial and submerged photosynthesis in some Danish amphibious plants. Aquat. Bot.45, 27–40.10.1016/0304-3770(93)90050-7
58
Nielsen S. L. Sand-Jensen K. (1989). Regulation of photosynthetic rates of submerged rooted macrophytes. Oecologia81, 364–368.
59
Odum H. T. (1956). Primary production in flowing waters. Limnol. Oceanogr.1, 102–117.10.4319/lo.1956.1.2.0102
60
Olesen B. Madsen T. V. (2000). Growth and physiological acclimation to temperature and inorganic carbon availability by two submerged aquatic macrophyte species, Callitriche cophocarpa and Elodea canadensis. Funct. Ecol.14, 252–260.10.1046/j.1365-2435.2000.00412.x
61
Opdyke B. N. Walker J. C. G. (1992). Return of the coral reef hypothesis: basin to shelf partitioning of CaCO3 and its effect on atmospheric CO2. Geology20, 733–736.10.1130/0091-7613(1992)020<0733:ROTCRH>2.3.CO;2
62
Parolin P. (2009). Submerged in darkness: adaptations to prolonged submergence by woody species of the Amazonian floodplains. Ann. Bot.103, 359–376.10.1093/aob/mcn216
63
Parry M. L. Canziani O. F. Palutikof J. P. van der Linden P. J. Hanson C. E. (eds) (2007). Climate change 2007: impacts, adaptation and vulnerability. Contribution of Working Group II to the Fourth Assessment Report of the Intergovernmental Panel on Climate Change (Cambridge: Cambridge University Press), 982.
64
Pedersen O. Colmer T. D. (2012). Physical gills prevent drowning of many wetland insects, spiders and plants. J. Exp. Biol.215, 705–709.10.1242/jeb.065128
65
Pedersen O. Malik A. I. Colmer T. D. (2010). Submergence tolerance in Hordeum marinum: dissolved CO2 determines underwater photosynthesis and growth. Funct. Plant Biol.37, 524–531.10.1071/FP09298
66
Pedersen O. Pulido C. Rich S. M. Colmer T. D. (2011). In situ O2 dynamics in submerged Isoetes australis: varied leaf gas permeability influences underwater photosynthesis and internal O2. J. Exp. Bot.62, 4691–4700.10.1093/jxb/err193
67
Pedersen O. Rich S. M. Colmer T. D. (2009). Surviving floods: leaf gas films improve O2 and CO2 exchange, root aeration, and growth of completely submerged rice. Plant J.58, 147–156.10.1111/j.1365-313X.2008.03769.x
68
Pedersen O. Vos H. Colmer T. D. (2006). Oxygen dynamics during submergence in the halophytic stem succulent Halosarcia pergranulata. Plant Cell Environ.29, 1388–1399.10.1111/j.1365-3040.2006.01522.x
69
Pilon J. Santamaría L. (2001). Seasonal acclimation in the photosynthetic and respiratory temperature responses of three submerged freshwater macrophyte species. New Phytol.151, 659–670.10.1046/j.0028-646x.2001.00212.x
70
Price G. D. Badger M. R. (1985). Inhibition by proton buffers of photosynthetic utilization of bicarbonate in Chara corallina. Aust. J. Plant Physiol.12, 257–267.10.1071/PP9850241
71
Prins H. B. A. Snel J. F. H. Helder R. J. Zanstra P. E. (1980). Photosynthetic HCO3- utilization and OH- excretion in aquatic angiosperms: light-induced pH changes at the leaf surface. Plant Physiol.66, 818–822.10.1104/pp.66.5.818
72
Raskin I. Kende H. (1983). How does deep water rice solve its aeration problem?Plant Physiol.72, 447–454.10.1104/pp.72.2.447
73
Raven J. A. Hurd C. L. (2012). Ecophysiology of photosynthesis in macroalgae. Photosyn. Res.113, 105–125.10.1007/s11120-012-9768-z
74
Revsbech N. P. (1987). An oxygen microelectrode with a guard cathode. Limnol. Oceanogr.34, 474–478.10.4319/lo.1989.34.2.0474
75
Revsbech N. P. Jørgensen B. B. (1986). “Microelectrodes: their use in microbial ecology,” in Advances in Microbial Ecology, ed. MarshallK. C. (New York: Plenum Press), 293–352.
76
Rich S. M. Pedersen O. Ludwig M. Colmer T. D. (2013). Shoot atmospheric contact is of little importance to aeration of deeper portions of the wetland plant Meionectes brownii; submerged organs mainly acquire O2 from the water column or produce it endogenously in underwater photosynthesis. Plant Cell Environ.36, 213–223.10.1111/j.1365-3040.2012.02568.x
77
Richardson K. Griffiths H. Reed M. L. Raven J. A. Griffiths N. M. (1984). Inorganic carbon assimilation in the Isoetids, Isoetes lacustris L. and Lobelia dortmanna L. Oecologia61, 115–121.10.1007/BF00379096
78
Sand-Jensen K. (1983). Photosynthetic carbon-sources of stream macrophytes. J. Exp. Bot.34, 198–210.10.1093/jxb/34.2.198
79
Sand-Jensen K. (1989). Environmental variables and their effect on photosynthesis of aquatic plant-communities. Aquat. Bot.34, 5–25.10.1016/0304-3770(89)90048-X
80
Sand-Jensen K. Baastrup-Spohr L. Winkel A. Moller C. L. Borum J. Brodersen K. P. et al (2010). Plant distribution patterns and adaptations in a limestone quarry on Oland. Svensk Botanisk Tidskrift104, 23–31.
81
Sand-Jensen K. Binzer T. Middelboe A. L. (2007). Scaling of photosynthetic production of aquatic macrophytes - a review. Oikos116, 280–294.10.1111/j.2006.0030-1299.15093.x
82
Sand-Jensen K. Frost-Christensen H. (1998). Photosynthesis of amphibious and obligately submerged plants in CO2-rich lowland streams. Oecologia117, 31–39.10.1007/s004420050628
83
Sand-Jensen K. Frost-Christensen H. (1999). Plant growth and photosynthesis in the transition zone between land and stream. Aquat. Bot.63, 23–35.10.1016/S0304-3770(98)00107-7
84
Sand-Jensen K. Gordon D. M. (1984). Differential ability of marine and fresh-water macrophytes to utilize HCO3- and CO2. Mar. Biol.80, 247–253.10.1007/BF00392819
85
Sand-Jensen K. Krause-Jensen D. (1997). Broad-scale comparison of photosynthesis in terrestrial and aquatic plant communities. Oikos80, 203–208.10.2307/3546536
86
Sand-Jensen K. Pedersen M. F. Nielsen S. L. (1992). Photosynthetic use of inorganic carbon among primary and secondary water plants in streams. Freshw. Biol.27, 283–293.10.1111/j.1365-2427.1992.tb00539.x
87
Sand-Jensen K. Pedersen O. Binzer T. Borum J. (2005). Contrasting oxygen dynamics in the freshwater isoetid Lobelia dortmanna and the marine seagrass Zostera marina. Ann. Bot.96, 613–623.10.1093/aob/mci214
88
Sand-Jensen K. Prahl C. (1982). Oxygen-exchange with the lacunae and across leaves and roots of the submerged vascular macrophyte, Lobelia dortmanna L. New Phytol.91, 103–120.10.1111/j.1469-8137.1982.tb03296.x
89
Sand-Jensen K. Raun A. L. Borum J. (2009). Metabolism and resources of spherical colonies of Nostoc zetterstedtii. Limnol. Oceanogr.54, 1282–1291.10.4319/lo.2009.54.4.1282
90
Sand-Jensen K. Staehr P. (2011). CO2 dynamics along Danish lowland streams: water–air gradients, piston velocities and evasion rates. Biogeochemistry111, 615–628.10.1007/s10533-011-9696-6
91
Santamaría L. van Vierssen W. (1997). Photosynthetic temperature responses of fresh- and brackish-water macrophytes: a review. Aquat. Bot.58, 135–150.10.1016/S0304-3770(97)00015-6
92
Schwarzenbach G. Meier J. (1958). Formation and investigation of unstable protonation and deprotonation products of complexes in aqueous solution. J. Inorg. Nuclear Chem.8, 302–312.10.1016/0022-1902(58)80195-5
93
Sculthorpe C. D. (1967). The Biology of Aquatic Vascular Plants. London: Edward Arnold Ltd.
94
Setter T. L. Kupkanchanakul T. Waters I. Greenway H. (1988). Evaluation of factors contributing to diurnal changes in O2 concentrations in floodwater of deepwater rice fields. New Phytol.110, 151–162.10.1111/j.1469-8137.1988.tb00248.x
95
Setter T. L. Laureles E. V. (1996). The beneficial effect of reduced elongation growth on submergence tolerance of rice. J. Exp. Bot.47, 1551–1559.10.1093/jxb/47.10.1551
96
Setter T. L. Waters I. Wallace I. Bekhasut P. Greenway H. (1989). Submergence of rice. I. Growth and photosynthetic response to CO2 enrichment of floodwater. Aust. J. Plant Physiol.16, 251–263.10.1071/PP9890251
97
Silva J. Sharon Y. Santos R. Beer S. (2009). Measuring seagrass photosynthesis: methods and applications. Aquatic Biol.7, 127–141.10.3354/ab00173
98
Smart R. Barko J. (1985). Laboratory culture of submersed freshwater macrophytes on natural sediments. Aquat. Bot.21, 251–263.10.1016/0304-3770(85)90053-1
99
Smith W. K. McClean T. M. (1989). Adaptive relationship between leaf water repellency, stomatal distribution, and gas exchange. Am. J. Bot.76, 465–469.10.2307/2444481
100
Spence D. H. N. Maberly S. C. (1985). “Occurence and ecological importance of HCO3- use among aquatic higher plants,” in Carbon Uptake by Aquatic Photosynthetic Organisms, eds LucasW. J.BerryJ. L. (Rockville: American Society of Plant Physiologists), 125–143.
101
Staehr P. Testa J. Kemp W. M. Cole J. Sand-Jensen K. Smith S. (2012a). The metabolism of aquatic ecosystems: history, applications, and future challenges. Aquatic Sci.74, 15–29.10.1007/s00027-011-0207-6
102
Staehr P. A. Baastrup-Spohr L. Sand-Jensen K. Stedmon C. (2012b). Lake metabolism scales with lake morphometry and catchment conditions. Aquat Sci74, 1–15.10.1007/s00027-011-0187-6
103
Steemann Nielsen E. (1946). Carbon sources in the photosynthesis of aquatic plants. Nature158, 594–596.10.1038/158594a0
104
Steemann Nielsen E. (1952). The use of radioactive carbon (C14) for measuring organic production in the sea. J. Conseil18, 117–140.10.1093/icesjms/18.2.117
105
Stirling C. M. Davey P. A. Williams T. G. Long S. P. (1997). Acclimation of photosynthesis to elevated CO2 and temperature in five British native species of contrasting functional type. Glob. Chang. Biol.3, 237–246.10.1046/j.1365-2486.1997.00071.x
106
Stirling C. M. Heddell-Cowie M. Jones M. L. Ashenden T. W. Sparks T. H. (1998). Effects of elevated CO2 and temperature on growth and allometry of five native fast-growing annual species. New Phytol.140, 343–354.10.1046/j.1469-8137.1998.00273.x
107
Strickland J. D. H. Parsons T. R. (1972). A Practical Handbook of Seawater Analysis. Ottawa: Bulletin of Fisheries Reseach Board of Canada.
108
Stumm W. Morgan J. J. (1996). Aquatic Chemistry. New York: John Wiley & Sons.
109
Suggett D. J. Prásil O. Borowitzka M. A. (2011). Chlorophyll a Fluorescence in Aquatic Sciences: Methods and Applications. Dordrecht: Springer.
110
van der Bijl L. Sand-Jensen K. Hjermind A. L. (1989). Photosynthesis and canopy structure of a submerged plant Potamogeton pectinatus in a Danish lowland stream. J. Ecol.77, 947–962.10.2307/2260815
111
Vashisht D. Hesselink A. Pierik R. Ammerlaan J. M. H. Bailey-Serres J. Visser E. J. W. et al (2011). Natural variation of submergence tolerance among Arabidopsis thaliana accessions. New Phytol.190, 299–310.10.1111/j.1469-8137.2010.03552.x
112
Vermaat J. E. Sand-Jensen K. (1987). Survival, metabolism and growth of Ulva lactuca under winter conditions - a laboratory study of bottlenecks in the life-cycle. Mar. Biol.95, 55–61.10.1007/BF00447485
113
Vervuren P. J. A. Beurskens S. M. J. H. Blom C. W. P. M. (1999). Light acclimation, CO2 response and long-term capacity of underwater photosynthesis in three terrestrial plant species. Plant Cell Environ.22, 959–968.10.1046/j.1365-3040.1999.00461.x
114
Vervuren P. J. A. Blom C. W. P. M. De Kroon H. (2003). Extreme flooding events on the Rhine and the survival and distribution of riparian plant species. J. Ecol.91, 135–146.10.1046/j.1365-2745.2003.00749.x
115
Vogel S. (1994). Life in Moving Fluids: The Physical Biology of Flow. Princeton: Princeton University Press.
116
Westlake D. F. (1978). Rapid exchange of oxygen between plant and water. Verh. Int. Verein. Limnol.20, 2363–2367.
117
Winkel A. Colmer T. D. Ismail A. M. Pedersen O. (2013). Internal aeration of paddy field rice (Oryza sativa L.) during complete submergence – importance of light and floodwater O2. New Phytol.197, 1193–1203.10.1111/nph.12048
118
Winkel A. Colmer T. D. Pedersen O. (2011). Leaf gas films of Spartina anglica enhance rhizome and root oxygen during tidal submergence. Plant Cell Environ.34, 2083–2092.10.1111/j.1365-3040.2011.02405.x
Summary
Keywords
flooding tolerance, light extinction, carbon dioxide, wetland plants, photorespiration
Citation
Pedersen O, Colmer TD and Sand-Jensen K (2013) Underwater Photosynthesis of Submerged Plants – Recent Advances and Methods. Front. Plant Sci. 4:140. doi: 10.3389/fpls.2013.00140
Received
17 February 2013
Accepted
24 April 2013
Published
21 May 2013
Volume
4 - 2013
Edited by
Rens Voesenek, Utrecht University, Netherlands
Reviewed by
Masanori Arita, University of Tokyo, Japan; Thijs Leendert Pons, Utrecht University, Netherlands
Copyright
© 2013 Pedersen, Colmer and Sand-Jensen.
This is an open-access article distributed under the terms of the Creative Commons Attribution License, which permits use, distribution and reproduction in other forums, provided the original authors and source are credited and subject to any copyright notices concerning any third-party graphics etc.
*Correspondence: Ole Pedersen, The Freshwater Biological Laboratory, Department of Biology, University of Copenhagen, Helsingørsgade 51, 3400 Hillerød, Denmark. e-mail: opedersen@bio.ku.dk
This article was submitted to Frontiers in Plant Physiology, a specialty of Frontiers in Plant Science.
Disclaimer
All claims expressed in this article are solely those of the authors and do not necessarily represent those of their affiliated organizations, or those of the publisher, the editors and the reviewers. Any product that may be evaluated in this article or claim that may be made by its manufacturer is not guaranteed or endorsed by the publisher.