 Jessada Sopharat1*
 Frederic Gay2,3
 Philippe Thaler2,3
 Sayan Sdoodee1
 Supat Isarangkool Na Ayutthaya4Charlchai Tanavud5
 Claude Hammecker6
 Frederic C. Do6
- 1Department of Plant Science, Faculty of Natural Resources, Prince of Songkla University, Songkhla, Thailand
- 2UMR Eco&Sols, French Agricultural Research Centre for International Development (CIRAD), Montpellier, France
- 3Hevea Research Platform in Partnership, DORAS Centre, Kasetsart University, Bangkok, Thailand
- 4Department of Plant Science and Agricultural Resources, Faculty of Agriculture, Khon Kaen University, Khon Kaen, Thailand
- 5Department of Earth Science, Faculty of Natural Resources, Prince of Songkla University, Songkhla, Thailand
- 6UMR Eco&Sols, Institut de Recherche pour le Développement, Montpellier, France
Climate change and fast extension in climatically suboptimal areas threaten the sustainability of rubber tree cultivation. A simple framework based on reduction factors of potential transpiration was tested to evaluate the water constraints on seasonal transpiration in tropical sub-humid climates, according pedoclimatic conditions. We selected a representative, mature stand in a drought-prone area. Tree transpiration, evaporative demand and soil water availability were measured every day over 15 months. The results showed that basic relationships with evaporative demand, leaf area index and soil water availability were globally supported. However, the implementation of a regulation of transpiration at high evaporative demand whatever soil water availability was necessary to avoid large overestimates of transpiration. The details of regulation were confirmed by the analysis of canopy conductance response to vapor pressure deficit. The final objective of providing hierarchy between the main regulation factors of seasonal and annual transpiration was achieved. In the tested environmental conditions, the impact of atmospheric drought appeared larger importance than soil drought contrary to expectations. Our results support the interest in simple models to provide a first diagnosis of water constraints on transpiration with limited data, and to help decision making toward more sustainable rubber plantations.
Introduction
The rubber tree (Hevea brasiliensis) is a major tree crop in Southeast Asia. Globally, it covers 9.82 million hectares mainly exploited by smallholders (UNCTAD, 2013). The tree is a native from the rainforests of the equatorial region of the Amazon basin (Priyadarshan et al., 2005). Traditionally, it has been cultivated in the equatorial belt and humid zones with a tropical and monsoonal climate (Raj et al., 2005). Currently, Thailand is the world's top producer of natural rubber. The plantations are mainly located where conditions are optimal in southern Thailand. However, in the last 30 years, the rubber plantations have largely expanded into climatically sub-optimal areas in north and northeast Thailand. The dynamic of land use is similar to that in other rubber-producing countries, with expansions also recorded in northeast India, the highlands and coastal areas of Vietnam, southern China, and the southern plateau of Brazil (Priyadarshan et al., 2005). In such areas, rubber can be constrained by drought, low temperature and high altitude or conversely by periodic heavy rainfall. Moreover, with climate change, higher frequencies of extreme events (flooding, drought) in the rainy season and an increase in temperature and evaporative demand in the dry season are expected in both traditional and new areas (Masaki et al., 2011). In addition, despite the large extension of land covered by rubber plantation, little is known of its environmental impacts and particularly about carbon and water balances (Guardiola-Claramonte et al., 2010; Kumagai et al., 2013). To address the sustainability of rubber plantations and to choose appropriate plant material and management practices, it is necessary to forecast rubber tree behavior on a large scale and over long periods of time. Hence the availability of simple models with limited data to analyze water constraints on tree transpiration and consequences on growth, production and soil water balance is a key issue (Guardiola-Claramonte et al., 2010; Boithias et al., 2012; Carr, 2012).
Our final objective is to evaluate, on an annual basis, the relative contributions of soil water shortage and atmospheric drought to the regulation of maximal transpiration in rubber tree stands under various pedoclimatic conditions. The use of a robust and simple model based on reduction factors of potential transpiration simulation appeared as a reasonable first approach to schematically separate the main controls. Granier et al. (1999) proposed such a model of daily water balance called BILJOU to evaluate water constraints in forest stands. It has been successfully used in temperate and tropical humid forests (Granier et al., 1999; Wagner et al., 2011). Transpiration models based on canopy conductance regulation have been also assessed and used (Jarvis, 1976; Stewart, 1988; Granier et al., 2000, 2007). However, they require an hourly step, more parameters and input data. As a first approach we chose to use the framework of BILJOU99 (Granier et al., 1999). The model assumes, under non-limiting soil water, a linear response of maximal transpiration (Tmax) vs. potential evapotranspiration (PET) for a leaf area index (LAI) inferior to 6, the slope being the ratio “rm” depending on the LAI. The model assumes that under a soil water shortage, rm decreases linearly below a threshold of relative extractable water (REW) of 0.4. Like many models, it does not consider direct constraint due to atmospheric drought (Boote et al., 2013). However, Isarangkool Na Ayutthaya et al. (2011) have shown that transpiration in mature rubber trees was strongly regulated above a threshold of evaporative demand, whatever the soil water availability. Such a regulation was related to an isohydric behavior expressed by stability of minimum leaf water potential and maximum whole-tree hydraulic conductance. The idea was to add a reduction factor above a critical climatic demand.
To test our modeling approach based on BILJOU99 framework, we selected a representative mature stand where trees faced the full range of soil and atmospheric drought conditions over a complete annual cycle. Tree transpiration, the evaporative demand and the soil water availability were measured every day over 15 months. The first objective was to test simplified controls of transpiration through evaporative demand, leaf area index and relative extractable water. We hypothesized that the basic relationships hold, except when the evaporative demand becomes too high. The second objective was to test an evolution of the model including sensitivity to atmospheric drought. We assumed that it would provide a reasonable indication of the trend in seasonal transpiration. The third objective was to assess by modeling the hierarchy between soil water and atmospheric constraints on transpiration on an annual basis. We assumed a predominant control by soil drought according to common thinking.
Materials and Method
Study Site
The plantation was located at Baan Sila (N15° 16′ 23″ E103° 04′ 51.3″), Khu-Muang, Buri Ram province in northeast Thailand. The experiments were conducted in a monoclonal plot (clone RRIM 600), planted at 2.5 × 7.0 m spacing (571 trees ha−1). The trees were 11 years old and had been tapped for 4 years for latex harvesting. The soil is deep with a loamy sand texture. The mean contents of clay, loam and organic matter varied from 9.9, 24.2, to 0.78% in the surface layer (0–0.2 m) to 20.2, 23.6, and 0.34% at a depth of 1.5 m, respectively. In this non-traditional rubber tree plantation area, the environmental conditions are water limiting for H. brasiliensis. The dry season lasts 6 months, from November to April, and average annual rainfall is 1176 mm. Canopy yellowing and defoliation occurred between December and March. In a sample of 237 trees, canopy fullness was assessed every 2 weeks for each tree according to seven categories of the percentage of green leaves (100, 90, 75, 50, 25, 10, and 0%). When the defoliation was almost complete, the maximum leaf area index (LAImax) was estimated from leaves collected in nine 1 m2 litter traps. A schematic change in the LAI over the year was deduced from observations of canopy fullness and litter fall measurements.
Climatic Measurements
The local microclimate was monitored automatically in an open field at a distance of 50 m from any trees. An automatic weather station (Minimet automatic weather station, Skye Instruments Ltd, Llandrindod Wells, UK) recorded half-hourly values of air temperature, relative humidity, incoming short wave radiation, wind speed and rainfall. The reference evapotranspiration was calculated according to the FAO 56 formula in Allen et al. (1998).
Soil Water Content Measurements
Volumetric soil water content (θ) was measured with a neutron probe (3322, Troxler, Research Triangle Park, NC, USA) calibrated for the experimental soil with separate calibrations for the upper (0–0.2 m) and lower (below 0.2 m) layers. Twelve 2 m-long tubes were set up in pairs; in each pair, one tube was located in the planting line between two trees, and the other in the middle of the inter-row. Measurements were made every 0.2 m, from a depth of 0.1 to 1.5 m every 2 weeks. Based on observed fluctuations in soil water, the soil profile was separated into two layers: topsoil (0–0.6 m) and subsoil (0.6–1.6 m). The average field capacity and permanent wilting points were measured as 0.21 and 0.07 m3 m−3 for the topsoil, and 0.25 and 0.10 m3 m−3 for the subsoil, respectively (Isarangkool Na Ayutthaya et al., 2010). Additionally, θ was measured continuously with a capacitance probe (EnvironSCAN System, Sentek Sensor Technologies, Adelaide, SA, Australia). The vertical probe included nine sensors located every 0.2 m at the same level as the neutron probe measurements. For each sensor, θ was estimated from cross-calibration with the neutron probe measurements over the whole seasonal range. Relative extractable water was calculated for each layer according to Granier et al. (1999):
where REWi is the relative extractable water in each soil layer i, Wm is the minimum soil water content, Wf is the soil water content at field capacity and W is the actual soil water content. To calculate the total REW for the sensitive root zone, REWi was weighted by the percentage of fine root length within each layer. As the soil profiles showed low soil water availability and little change in the subsoil (Figure 1B), for modeling purpose the total REW was calculated for the top soil (0–0.6 m). In this site, the top soil contained 83% of the fine root length accumulated down to 1.6 m (Gonkhamdee et al., 2009). The fraction of fine root length used for weighting the REW in the top soil was 0.63, 0.32, and 0.05 for the layers 0–0.2, 0.2–0.4, and 0.4–0.6 m, respectively.
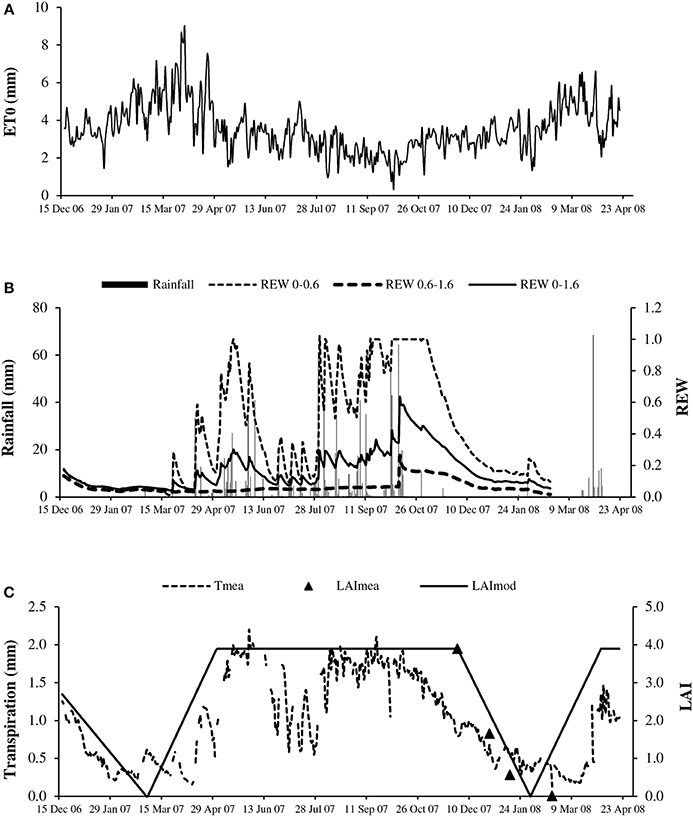
Figure 1. Seasonal course of: (A) reference evapotranspiration (ET0); (B) rainfall (solid bar) and relative extractable water of bulk soil (REW) for layers 0–0.6 m (REW 0–0.6), 0.6–1.6 m (REW 0.6–1.6) and 0–1.6 m (REW 0–1.6); and (C) measured transpiration (Tmea, dotted line) and leaf area index estimated from litterfall (LAImea, triangles) and schematic shape (LAImod, solid line).
Transpiration Measurement
The xylem sap flow density was measured using the transient thermal dissipation method (TTD, Isarangkool Na Ayutthaya et al., 2010). The TTD method is based on using the same Granier probe design and heating power but uses a cyclic schedule of heating and cooling to assess a transient thermal index over a 10-min rise in temperature. The hourly sap flux density (Js; kg m−2 h−1) was calculated according to the non-species-specific calibration assessed by Isarangkool Na Ayutthaya et al. (2010):
where Ka is the transient thermal index. A temperature signal (ΔTa) was defined as
where ΔTon is the temperature difference reached at the end of the 10-min heating period and ΔToff is the temperature difference before heating. To measure Js every half hour with a heating period of 10 min, a cycle of 10 min heating and 20 min cooling was applied and the temperature signals were recorded every 10 min. ΔToff wasinterpolated at the time of ΔTon from ΔToff surrounding measurements. The transient thermal index was calculated as:
where ΔT0a is the maximum temperature difference obtained under zero flow conditions and ΔTua is the measured signal at a given Js. the zero flux signal was determined every night assuming that sap flow was negligible at the end of the night. This assumption was strongly supported by slight change of daily ΔT0a over the study period and minimum nocturnal VPD always lower than 0.3 kPa (Donovan et al., 2001). The probes were inserted into the trunks at a height of 1.8 m above the soil. At this height, average sapwood area was estimated to be 1.97 × 10⁻² m2. After removal of the bark, the 2-cm-long probes were inserted to a depth of 2.5 cm into the sapwood, in such a way that the whole probe was fully inside the conductive sapwood. Three probes were inserted into each trunk to account for circumferential variability. The trunk area containing the probes was protected from direct solar radiation and rainfall by a deflector. Probes were connected to a data logger (CR10X, Campbell Scientific, Leicester, UK). Hourly sap flow density (Js), measured in the outermost ring of the sapwood, was accumulated over 24 h to calculate daily Js (Jout_day expressed in kg m−2 d−1). To account for radial variation in the sap flux density in the deep sapwood, a reduction coefficient of 0.874 was applied to the Js measured in the outermost ring of conducting xylem (Isarangkool Na Ayutthaya et al., 2010). Finally, neglecting tree water storage, transpiration (T; mm d−1) was estimated according to the equation:
Canopy Conductance Calculation
The canopy conductance (Gc; mm s−1) was calculated by inverting an approximate of the Penman-Monteith equation. The approximation assumes that tree stand transpiration is well coupled to the atmosphere, i.e., decoupling coefficient (Ω) close to 0 (Jarvis and McNaughton, 1986; Phillips and Oren, 1998):
where γ is the psychrometric constant (Pa K−1), γ is the latent heat of water vaporization (J kg−1), T is transpiration, Cp is the specific heat of dry air at constant pressure (J kg−1 K−1), ρ is the atmospheric density (kg m−3) and VPD is the air vapor pressure deficit (kPa). Gc was calculated at midday (Gc_md) from the maximum vapor pressure deficit (VPDmax) and the daily maximum transpiration estimated from the sap flow (Tmax; mm s−1).
Modeling
Basic relationships
The main relationships of BILJOU99 framework have been described in the introduction and more details are provided in Granier et al. (1999). The model inputs are daily data of leaf area index, rainfall and Penman potential evapotranspiration (PET). Instead of PET we used the FAO reference evapotranspiration ET0 (Allen et al., 1998) which is currently available in world weather networks. The model can simulate the soil water balance by daily tipping buckets if runoff is negligible, which was not the case here. The present study was focused on transpiration controls and for the sake of accuracy we used only measured soil water availability.
Details of calculation
Potential, climatic or maximal transpiration was first calculated from the following equation:
where rm depends on LAImax;
Second, Tmax could be decreased according to the LAI pattern by the following reduction coefficient:
The effect of soil water shortage was simulated by the calculation of a reduction coefficient (rREWc) as:
where REWc is the critical value of relative soil water content.
Hence the transpiration was calculated according to the following formula:
The expected saturation of transpiration at high evaporative demand was introduced in the BILJOU99 framework by applying a reduction coefficient above a critical value of ET0:
For simplicity of writing we could have included the negative effect of high ET0 in equation [7]. But we have preferred to separate the effects because of functional reasons. Equation [7] represents a general climatic driving effect (positive) on transpiration whatever plant species. While rET0c in equation [11] expresses a negative effect which varies according species and which is attributed to plant hydraulic limitations (Oren and Pataki, 2001; Bush et al., 2008; Isarangkool Na Ayutthaya et al., 2011; Ocheltree et al., 2014).
Diagnosis of hierarchy between water constraints
The approach was to use the calibrated framework to simulate independently or in combination the factors that control the regulation of transpiration on an annual basis and to separate the rainy season and dry season. The regulations of transpiration was expressed as the ratio between the cumulated potential transpiration, driven by evaporative demand and stand characteristics under full canopy conditions (LAImax), and the cumulated actual transpiration possibly reduced by defoliation, soil water availability or sensitivity to air dryness. Such a calculation assumes that reduction factors act independently which is certainly not true in the details. The annual cycle of transpiration was considered from January 1 to December 31, and the rainy season from May 1 to October 31. The few gaps in the daily transpiration were interpolated from ET0 using an average ratio T/ET0 measured on surrounding data (at least 4 days).
Data Analysis
Statistics were performed using the XLSTAT software (Addinsoft, Paris, France). The agreement between measured and simulated data was quantified by using the coefficient of determination (R2), root mean square error (RMSE) and relative root mean square error (RRMSE). Absolute and relative root mean square errors were calculated according to the following formulas:
where xmea, i is the measured value, xmod, i is the simulated value at place i and n is the number of values.
Results
Seasonal Variations of Environmental Water Constraints, LAI, and Transpiration
The evaporative demand as expressed by ET0 largely fluctuated between 1 and 9 mm d−1 with a cumulative value of 1247 mm year−1 (Figure 1A), 23% above the cumulative rainfall (965 mm) in 2007. ET0 values were particularly high during the 6 months of the dry season, from 3 mm d−1 in November up to 9 mm d−1 in March, corresponding to a VPD value above 1.0 kPa. The evaporative demand remained relatively high in the first part of the rainy season (from May to July) and decreased markedly in August, September and October, with ET0 and VPD values below 2.0 mm d−1 and 0.7 kPa, respectively.
The water availability of the bulk soil or REW logically followed the rain occurrence (Figure 1B), with values close to 1.0 at the start of the rainy season in the topsoil (0–0.6 m). The availability decreased sharply to 0.2 in July, in the middle of the rainy season. The REW again reached high values (above 0.5) from August to October. REW values above 1 at the end of October suggested temporary water logging in the topsoil which was confirmed by observations. The REW quickly decreased in the dry season, reaching 0.2 in January. In the deep soil (0.6–1.6 m), the REW value indicated low water availability with little change over the year (maximum 0.26).
As represented by the schematic change in the LAI (Figure 1C), leaf shedding occurred in January and February, immediately followed by leaf flushing, with the latter occurring when the evaporative demand was the highest. The maximum LAI deduced from litterfall measurements averaged 3.9 at the end of 2007 (n = 9, SD = 0.7). The period with full canopy included approximately the period of highest soil water availability and lowest evaporative demand.
The maximum transpirations estimated by sap flow measurements (Tmea) were steady (approximately 2.0 mm d−1) throughout the period with full canopy (Figure 1C). The intermittent decreases evident in June and July related to the evolution of the REW in the topsoil (Figure 1B). The lowest transpiration corresponded to the time of leaf shed. However, it never reached zero values despite almost complete defoliation. However, the sap flow measurement using the TTD method has low accuracy at very low flow rates (Isarangkool Na Ayutthaya et al., 2010). The minimum recorded transpiration was 0.1 mm d−1 on April 11, 2007 and the maximum value was 2.2 mm d−1 on May 31, 2007.
Transpiration vs. ET0, REW, and LAI
ET0
Under conditions of full canopy and non-limiting soil water (REW> 0.5), transpiration plotted vs. ET0 showed a linear response at low evaporative demand but it exhibited a pseudo-plateau above approximately 2.3 mm d−1 (Figure 2A). The average slope of the linear section crossing the origin was estimated as 0.9 (± 0.052). Such a slope corresponds to rm, the Tmax/ET0 ratio, in the model framework (Equation [7]). Several values of Tmax/ET0 were above 1.0 at low ET0. First, ET0 is a reference value which does not necessarily represent the maximum ET for this particular stand. Second, transpiration could have been overestimated by sap flow measurement, particularly for rainy days and low flow rates. In Figure 2B, Tmax/ET0 was plotted vs. ET0 discarding y values above 1. The relationship fitted well a Lohammar's function (y = −0.585ln(x) + 1.2492; R2 = 0.87). The R2 has little meaning here because the variables were directly related by ET0 in the calculation. However, Lohammar's function provided better results of Tmod_ET0c than a linear adjustment. The plot of midday canopy conductance (Gc_md) vs. VPDmax confirmed the underlying mechanism of stomatal regulation at increasing VPD (Figure 3). According to the fitted Lohammar's function (Lohammar et al., 1980), the reference Gc at 1 KPa and the sensitivity term equal 4.74 mm s−1 and 7.6, respectively.
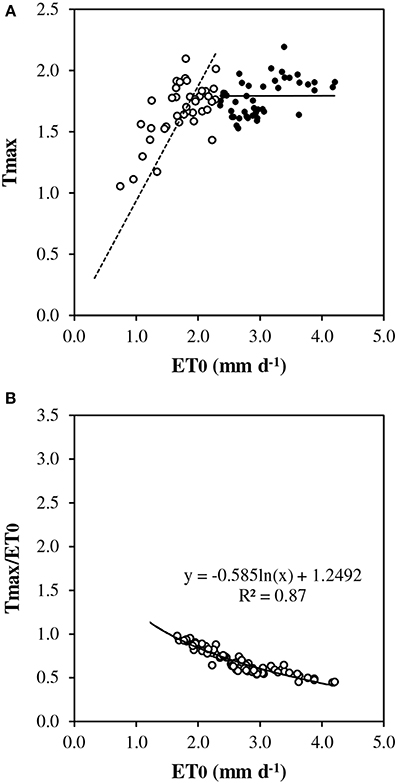
Figure 2. Daily transpiration vs. reference evapotranspiration (ET0): (A) measured maximum transpiration (Tmax) in the absence of soil water stress (REW 0–0.6 ≥ 0.5), closed circles indicate ET0 > 2.3 mm d−1, open circles indicate ET0 < 2.3 mm d−1, dotted line represents the linear regression below 2.3 ET0 and crossing origin; (B) relative transpiration (Tmax/ET0).
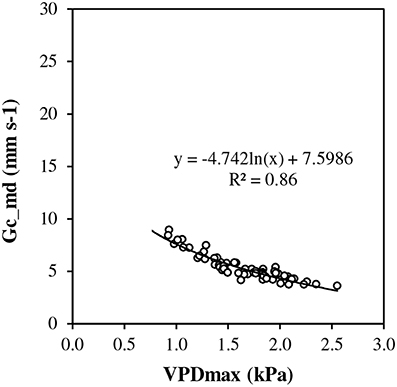
Figure 3. Midday canopy conductance (Gc_md) vs. maximum vapor pressure deficit (VPDmax) at full canopy period and in the absence of soil water stress (REW 0–0.6 ≥ 0.5).
LAI
Transpiration estimated by sap flow measurements (Tmea) followed in the expected manner the LAI seasonal pattern (Figure 1C) which supports a strong control of transpiration by the LAI. However, the soil water availability decreased at the same time in the dry season.
REW
The plot of T/ET0 vs. REW showed scatters of points consistent with the assumption of a threshold around REW = 0.4 (Figure 4). Above a threshold between 0.4 and 0.5, T/ET0 exhibited a pseudo-plateau averaging 1.0, with large variability. Below the critical REW, a linear decrease toward 0:0 crossed the scatter of points. However, the assessment of the value critical REW was approximate due to the lack of soil data between 0.4 and 0.5 REW.
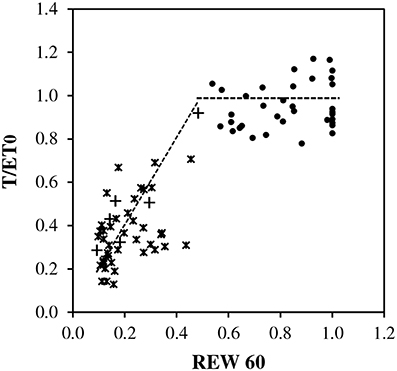
Figure 4. Relative transpiration (T/ET0) vs. relative extractable soil water (REW) in top soil (0–0.6 m) during full canopy period (LAImax), closed circles indicate REW ≥ 0.5 and ET0 < 2.3 mm d−1, asterisks indicate REW < 0.5 and ET0 ≥ 2.3 mm d−1 and plus signs indicate REW < 0.5 and ET0 < 2.3 mm d−1. Trends are shown as dotted lines, averaged as 1.0 for REW ≥ 0 0.5 and as a reduction coefficient for REW < 0.5.
Simulation of Transpiration
Conditions of simulation
For the calculations described in the Modeling paragraph of Material and Methods:
- rm was tested between 0.9 and 1.0 according to Figures 2A, 4, and finally 1.0 was kept.
- LAImax was taken equal to 3.9 as measured.
- REW was calculated for the top soil (0–0.6 m) with weighting by percentage of fine root length distribution as described in paragraph 2.3.
- The active soil depth and weighting by root distribution were kept constant over the annual cycle.
- REWc was taken equal to 0.4 according to BILJOU99 framework and Figure 4.
- rET0c was calculated according the function deduced from Figure 2B:
If ET0 ≤ ET0c, rET0c = 1
If ET0 > ET0c, rET0c = a *ln(ET0) + b
with ET0c = 2.3 mm d−1, a = −0.585 and b = 1.2492.
Simulated transpiration
The transpirations simulated with the original framework of BILJOU99 (Tmod), largely overestimated during the full canopy period, particularly in April, May, June, August and November, during periods of high evaporative demand (Figure 5). The values simulated with regulation at high ET0 (Tmod_ET0c) logically better expressed the seasonal change of transpiration; however substantial inaccuracy remained in the dry season with overestimates in November and underestimates in other periods (Figure 5). Table 1 summarizes the previous observations: large errors with Tmod and the substantial improvement with regulation at high evaporative demand in the rainy season (RRMSE < 35%). In the dry season, the errors were substantial (RRMSE > 60%); however they are emphasized by the relative expression vs. the low absolute values.
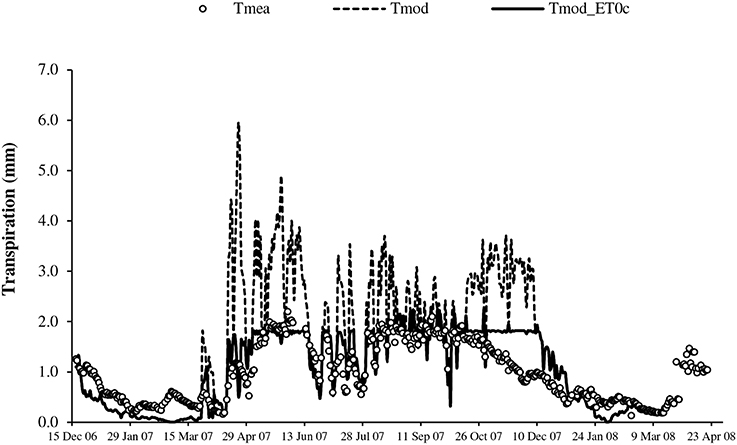
Figure 5. Seasonal change of transpiration from measurement (Tmea), simulation with original BILJOU99 framework (Tmod) and with evolution including threshold of ET0 (Tmod_ET0c).
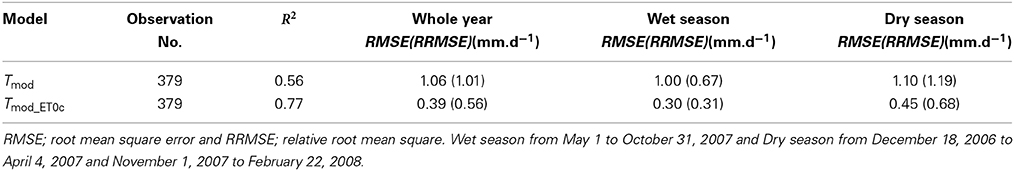
Table 1. Evaluation metrics of simulations of transpiration according to two frameworks: original BILJOU (Tmod), simulation with reduction coefficient of ET0 (Tmod_ET0c).
Hierarchy between Reduction Factors of Annual Transpiration
On an annual basis, the cumulative measured transpiration (430 mm) was 66% lower than the potential annual transpiration (1247 mm). The regulation was substantial in the rainy season (−39%) and twofold higher in the dry season (−81%). The simulated data provided close estimates of transpiration reduction (−64.5%) when all constraints were considered (LAI × REWc × ET0c in Figure 6). When considering only one reduction factor, the LAI variation induced the lowest reduction, logically located in the dry season, at the time of defoliation. The impacts of REWc and ET0c were similar with substantial reduction around −45%, slightly higher for ET0c (−50.1%). The ET0c constraint was significantly higher than the REWc constraint in the rainy season (Figure 6B). It was noteworthy that the overall effect of the ET0c constraint alone already represented 76% of the total reduction with the combination of the three factors of constraint. The combination with two factors of constraints supported the proposal that ET0c had a larger impact than REWc. The small difference in the simulation between REWc and REWc x LAI suggested that the REWc constraint included already the LAI effect. The REWc × ET0c interaction induced a reduction equivalent to the reduction with three factors, which confirmed the previous suggestion.
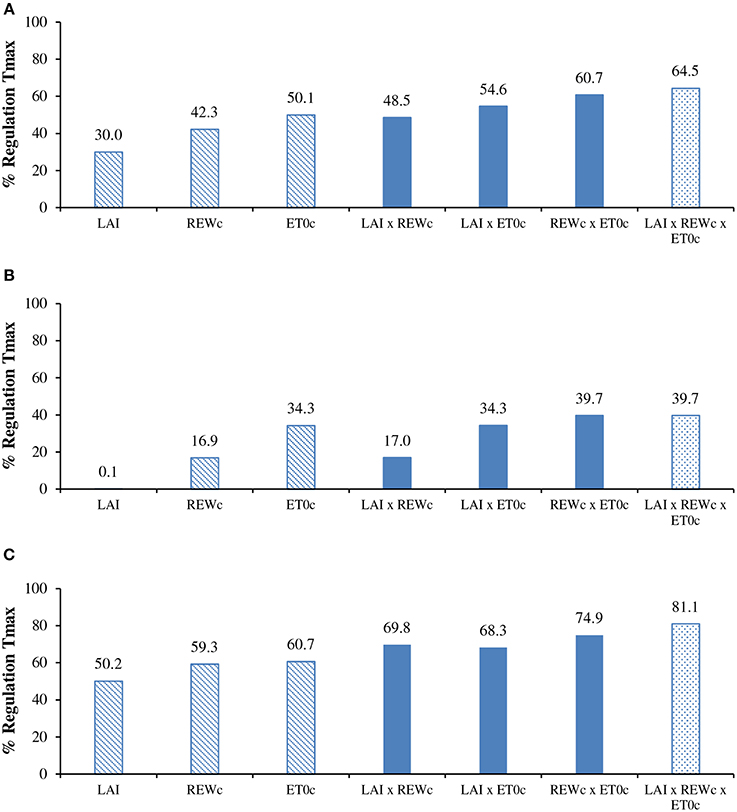
Figure 6. Regulation of seasonal transpiration (simulated with constraints/maxima) for: (A) the annual cycle; (B) the rainy season; and (C) the dry season, according to reduction factors issued from the LAI change, critical relative extractable water (REWc) and critical potential evapotranspiration (ET0c). For details of simulation see paragraphs Modeling and Simulation of transpiration.
Discussion
Basic Relationships of BILJOU99 Framework
Our results confirmed that the basic relationships of the original framework (Granier et al., 1999) hold except that the regulation of transpiration at high evaporative demand was not well simulated.
ET0c
Experimental data showed a strong regulation of transpiration under non-limiting soil water at high evaporative demand, when the ET0 was approximately above 2.3 mm d−1. The analysis of the corresponding canopy conductance confirmed a dramatic decrease above VPD values equal to 1 kPa. This result supports the previous analysis of Isarangkool Na Ayutthaya et al. (2011) where such a response was related to isohydric behavior with a stable maximal value of the whole tree hydraulic conductance and a stable minimum value of the leaf water potential. Such regulation of transpiration vs. high evaporative demand is known for several species (Pataki and Oren, 2003; David et al., 2004; Ocheltree et al., 2014). However, the sensitivity of this response appears dependent on wood anatomy and hydraulic conductivity. Hevea brasiliensis is a diffuse-porous species (Richter and Dallwitz, 2000). And our results follow the general trend that stomatal control vs. high evaporative demand is stricter in diffuse-porous species than in ring-porous species. (Oren and Pataki, 2001; McCulloh and Woodruff, 2012).
Tmax/ET0
Below the threshold of critical evaporative demand, the simple and common concept of a stable rm ratio between maximal transpiration and reference evapotranspiration under non-limiting conditions held with our data, as rm ranged around 1.0 for a maximum LAI estimated at 3.89. These values appear relatively high compared to the range of 0.70–0.80 quoted by Granier et al. (1999). However, the latter quotation concerned the ratio vs. PET (Potential Evapotranspiration with the Penman equation) which should be higher than ET0, the reference evapotranspiration using the Penman-Monteith formula and FAO56 coefficients (Allen et al., 1998). Moreover the accuracy on absolute value of transpiration by sap flow measurement including scaling from tree to stand level is estimated around 20% (Isarangkool Na Ayutthaya et al., 2010).
REWc
Our data supported the general assumption of a linear decrease of Tmax/ET0 below a critical value around 0.4 for the REW (Granier et al., 1999; Bréda et al., 2006). This threshold of 0.4 was also quoted for other classical expressions of soil water availability, i.e., the plant available soil moisture or PAW (Sadras and Milroy, 1996) or the fraction of transpirable soil water or FTSW (Sinclair et al., 2005).
LAI
The seasonal pattern of transpiration followed remarkably the main trend in the LAI. However, this observation did not confirm here the well-known control of transpiration by the LAI because the REW was also decreasing in the dry season. Moreover, simulations in paragraph 3.3 have shown that the decrease in the REW was already sufficient to reduce transpiration.
Simulation of Transpiration with Model Evolution
Transpiration
Our results confirmed that including regulation by high evaporative demand in the model largely improved the accuracy in simulation of transpiration. However, substantial errors remained and particularly in the dry season. Besides inaccuracy on estimate of absolute transpiration by sap flow measurement, several points could explain this result with such a simple model. The model relationships were mainly tested in the rainy season and under full canopy conditions and they were applied on the annual cycle. The change in the LAI was estimated roughly from litter fall measurements and canopy fullness observations. Temporary water logging could have decreased transpiration in November. Also, stomatal regulation could change with leaf age, particularly during senescence and refoliation (Kositsup et al., 2010). Moreover, the profile of fine root length activity changes in the dry season as shown by Gonkhamdee et al. (2009) while in the simulation, the REW calculation used the same soil depth and root profile for weighting. However, at the end, the simulation provided a reasonable indication of trends in seasonal regulation of transpiration which was the objective of the tested framework.
Several models of water balance previously used for rubber tree did not consider atmospheric constraints on transpiration: CROPWAT (Allen et al., 1998), WANULCAS (VanNoordwich and Lusiana, 1999; Guardiola-Claramonte et al., 2010; Boithias et al., 2012). The consequences could be (1) an overestimate of transpiration and root water uptake and (2) a further underestimation of stomatal regulation and consequently an overestimation of C assimilation. In a recent review, Boote et al. (2013) included this process as a current limitation of many crop models. Bregaglio et al. (2014) reported the good performance of a simple approach in arid environments based on transpiration use efficiency that explicitly accounts for the negative impact of vapor pressure deficit on photosynthesis.
A limitation of the reduction factor based on ET0c is likely the generality of the relationship and value of ET0c which has to be tested in different experimental conditions.
Diagnosis of the Hierarchy between Water Constraints
The simple framework of simulation has allowed comparing the relative impact of the different constraints on annual and seasonal transpiration. The soil water shortage did not appear as the major water constraint on transpiration in the studied area. High evaporative demand, as expressed by ET0, appeared at least of similar importance, if not higher, than soil water shortage. The provided hierarchy is contrary to expectations in this growing area known as climatically under-optimal due to the low amount and variability of rainfall. Clermont-Dauphin et al. (2013) recently provided evidence that soil water shortage was not the main cause of low growth rates in young rubber plantations of North East Thailand and they suggested the importance of high evaporative demand and temporary water logging.
The results from the simulation are directly due to the fact that the sensitivity to air dryness was taken into account in the model. Such a type of response is dependent on the species or variety. We studied the most-planted clone in Thailand (RRIM 600) and the response may change with other varieties of Hevea brasiliensis. But the recent of work of Kobayashi et al. (2014) in Cambodia confirmed the sensitivity of canopy stomatal conductance to VPD for mature rubber trees of another clone (RRIC 100). However, the details of the response may likely change according to the clone, age and stand characteristics, root development (Devakumar et al., 1999), spatiotemporal acclimation and root proliferation (Liu et al., 2014). We doubt in the generality of the relationship and critical ET0 used in the framework to simulate sensitivity to air dryness. The results of Sangsing et al. (2004) on young plants of RRIM 600 and RRIT 251 did not show isohydric behavior under water constraints as observed in mature trees. The variability of water relations and sensitivity to air dryness certainly deserves more study.
On the other end, the lower influence of soil water shortage vs. evaporative demand cannot be attributed to a relatively low soil water constraint in the experiment. The growing area of Buri Ram (south of Northeast Thailand) is known as soil water limited with an average annual rainfall of around 1150 mm, which is far below the recommended threshold of 1500 mm. Moreover, the year of study was particularly dry with a rainfall amount of 965 mm. The measurements of soil water availability confirmed the severity of water shortage in both the top soil and deep soil, in the dry season as in the rainy season (Figure 1B).
Defoliation is usually limited to 1–2 months, with the defoliation peak between mid-January and mid-February. However, in dry years such as in the year of study, the period of defoliation could last over 3 months, from January to March. In addition to internal controls, canopy phenology can be influenced by both soil and atmospheric droughts (Eamus and Prior, 2001; Do et al., 2005). These relationships were not taken explicitly into account in the model. It is likely that such inclusions could have changed the results of simulation in the details. However, it is doubtful that they could change completely the conclusion and particularly the fact that impact of atmospheric drought on transpiration regulation was at least of similar importance than soil drought.
Conclusion
In conclusion, the adapted framework of BILJOU99 had allowed analyzing the relative contribution of soil water shortage and atmospheric drought to the regulation of transpiration on a seasonal scale. This paper provides two main insights. The first stresses the importance of taking into account the direct regulation of transpiration vs. high evaporative demand which often is omitted in simple agro-climatic models. According species, water constraint due to evaporative demand could have been underestimated in previous studies in the sub-humid tropics. The second relies on the interest in simple agro-climatic models to provide a first diagnosis of water constraints on transpiration, in order to help the evolution of cultural choices and practices toward greater sustainability.
Authors Contribution
Jessada Sopharat: data analysis, modeling, paper writing. Supat Isarangkool Na Ayutthaya: experimental design, data collection, data analysis. Frederic Gay: paper writing, editorial advising. Philippe Thaler: paper writing, editorial advising. Sayan Sdoodee: paper writing, editorial advising. Charlchai Tanavud: paper writing, editorial advising. Claude Hammecker: paper writing, editorial advising. Frederic C. Do: experimental design, data collection, supervising the work, modeling, paper writing.
Conflict of Interest Statement
The authors declare that the research was conducted in the absence of any commercial or financial relationships that could be construed as a potential conflict of interest.
Acknowledgments
This work was carried out as part of a PhD and was supported by the Higher Education Research Promotion and National Research University Project of Thailand (NRU), Office of the Higher Education Commission and the Graduate School, Prince of Songkla University. In particular, the field experiment was supported by funding from the French Institute for Rubber (IFC) and associate companies (Michelin, Socfinco, SIPH).
References
Allen, R. G., Pereira, L. S., Raes, D., and Smith, M. (1998). “Crop evapotranspiration guidelines for computing crop water requirements,” in FAO Irrigation and Drainage Paper 56 (Rome: Food and Agriculture Organization of the United Nations).
Boithias, L., Do, F. C., Isarangkool Na Ayutthaya, S., Junjittakarn, J., Siltecho, S., et al. (2012). Transpiration, growth and latex production of a Hevea brasiliensis stand facing drought in Northeast Thailand: the use of the WaNuLCAS model as an exploratory tool. Exp. Agric. 48, 49–63. doi: 10.1017/S001447971100086X
Boote, K. J., Jones, J. W., White, J. W., Asseng, S., and Lizaso, J. I. (2013). Putting mechanisms into crop production models. Plant. Cell. Environ. 36, 1658–1672. doi: 10.1111/pce.12119
Pubmed Abstract | Pubmed Full Text | CrossRef Full Text | Google Scholar
Bréda, N., Huc, R., Granier, A., and Dreyer, E. (2006). Temperate forest trees and stands under severe drought: a review of ecophysiological responses, adaptation processes and long-term consequences. Ann. For. Sci. 63, 625–644. doi: 10.1051/forest:2006042
Bregaglio, S., Frasso, N., Pagani, V., Stella, T., Francone, C., Cappelli, G., et al. (2014). New multi-model approach gives good estimations of wheat yield under semi-arid climate in Morocco. Agron. Sustain. Dev. doi: 10.1007/s13593-014-0225-6. (in press).
Bush, S. E., Pataki, D. E., Hultine, K. R., West, A. G., Sperry, J. S., and Ehleringer, J. R. (2008). Wood anatomy constrains stomatal responses to atmospheric vapor pressure deficit in irrigated, urban trees. Oecologia 156, 13–20. doi: 10.1007/s00442-008-0966-5
Pubmed Abstract | Pubmed Full Text | CrossRef Full Text | Google Scholar
Carr, M. K. V. (2012). The water relations of rubber (Hevea brasiliensis): a review. Exp. Agric. 48, 176–193. doi: 10.1017/S0014479711000901
Clermont-Dauphin, C., Suvannang, N., Hammecker, C., Cheylan, V., Pongwichian, P., and Do, F. C. (2013). Unexpected absence of control of rubber tree growth by soil water shortage in dry subhumid climate. Agron. Sustain. Dev. 33, 531–538. doi: 10.1007/s13593-012-0129-2
David, T. S., Ferreira, M. I., Cohen, S., Pereira, J. S., and David, J. S. (2004). Constraints on transpiration from an evergreen oak tree in southern Portugal. Agr. Forest. Meteorol. 122, 193–205. doi: 10.1016/j.agrformet.2003.09.014
Devakumar, A. S., Prakash, P. G., Sathik, M. B. M., and Jacob, J. (1999). Drought alters the canopy architecture and micro-climate of Hevea brasiliensis trees. Trees 13, 161–167. doi: 10.1007/PL00009747
Do, F., Goudiaby, V. A., Gimenez, O., Diagne, A. L., Diouf, M., Rocheteau, A., et al. (2005). Environmental influence on canopy phenology in the dry tropics. Forest Ecol. Manag. 215, 319–328. doi: 10.1016/j.foreco.2005.05.022
Donovan, L., Linton, M., and Richards, J. (2001). Predawn plant water potential does not necessarily equilibrate with soil water potential under well-watered conditions. Oecologia 129, 328–335. doi: 10.1007/s004420100738
Eamus, D., and Prior, L. (2001). Ecophysiology of trees of seasonally dry tropics: comparisons among phenologies. Adv. Ecol. Res. 32, 113–197. doi: 10.1016/S0065-2504(01)32012-3
Gonkhamdee, S., Maeght, J. L., Do, F., and Pierret, A. (2009). Growth dynamics of fine Hevea brasiliensis root along a 4.5 m soil profile. Khon. Kaen. Agr. J. 37, 265–276.
Granier, A., Bréda, N., Biron, P., and Villette, S. (1999). A lumped water balance model to evaluate duration and intensity of drought constraints in forest stands. Ecol. Model. 116, 269–283. doi: 10.1016/S0304-3800(98)00205-1
Granier, A., Loustau, D., and Bréda, N. (2000). A generic model of forest canopy conductance dependent on climate, soil water availability and leaf area index. Ann. For. Sci. 57, 755–765. doi: 10.1051/forest:2000158
Granier, A., Reichstein, M., Bréda, N., Janssens, I. A., Falge, E., Ciais, P., et al. (2007). Evidence for soil water control on carbon and water dynamics in European forests during the extremely dry year: 2003. Agr. Forest. Meteorol. 143, 123–145. doi: 10.1016/j.agrformet.2006.12.004
Guardiola-Claramonte, M., Troch, P. A., Ziegler, A. D., Giambelluca, T. W., Durcik, M., Vogler, J. B., et al. (2010). Hydrologic effects of the expansion of rubber (Hevea brasiliensis) in a tropical catchment. Ecohydrol. 3, 306–314. doi: 10.1002/eco.110
Isarangkool Na Ayutthaya, S., Do, F. C., Pannengpetch, K., Junjittakarn, J., Maeght, J., Rocheteau, A., et al. (2010). Transient thermal dissipation method of xylem sap flow measurement: multi-species calibration and field evaluation. Tree Physiol. 30, 139–148. doi: 10.1093/treephys/tpp092
Pubmed Abstract | Pubmed Full Text | CrossRef Full Text | Google Scholar
Isarangkool Na Ayutthaya, S., Do, F. C., Pannangpetch, K., Junjittakarn, J., Maeght, J. L., Rocheteau, A., et al. (2011). Water loss regulation in mature Hevea brasiliensis: effects of intermittent drought in the rainy season and hydraulic regulation. Tree Physiol. 31, 751–762. doi: 10.1093/treephys/tpr058
Pubmed Abstract | Pubmed Full Text | CrossRef Full Text | Google Scholar
Jarvis, P. G. (1976). The interpretation of the variations in leaf water potential and stomatal conductance found in canopies in the field. Philos. Trans. R. Soc. Lond. B 273, 593–610. doi: 10.1098/rstb.1976.0035
Jarvis, P. G., and McNaughton, K. G. (1986). Stomatal control of transpiration: scaling up from leaf to region. Adv. Ecol. Res. 15, 1–49. doi: 10.1016/S0065-2504(08)60119-1
Kobayashi, N., Kumagai, T., Miyazawa, Y., Matsumoto, K., Tateishi, M., Lim, T. K., et al. (2014). Transpiration characteristics of a rubber plantation in central Cambodia. Tree Physiol. 34, 285–301. doi: 10.1093/treephys/tpu009
Pubmed Abstract | Pubmed Full Text | CrossRef Full Text | Google Scholar
Kositsup, B., Kasemsap, P., Thanisawanyangkura, S., Chairungsee, N., Satakhun, D., Teerawatanasuk, K., et al. (2010). Effect of leaf age and position on light-saturated CO2 assimilation rate, photosynthetic capacity, and stomatal conductance in rubber trees. Photosynthetica 48, 67–78. doi: 10.1007/s11099-010-0010-y
Kumagai, T., Mudd, R. G., Miyazawa, Y., Liu, W., Giambelluca, T. W., Kobayashi, N., et al. (2013). Simulation of canopy CO2/H2O fluxes for a rubber (Hevea brasiliensis) plantation in central Cambodia: the effect of the regular spacing of planted trees. Ecol. Model. 265, 124–135. doi: 10.1016/j.ecolmodel.2013.06.016
Liu, W., Li, J., Lu, H., Wang, P., Luo, Q., Liu, W., et al. (2014). Vertical patterns of soil water acquisition by non−native rubber trees (Hevea brasiliensis) in Xishuangbanna, southwest China. Ecohydrology 7, 1234–1244. doi: 10.1002/eco.1456
Lohammar, T., Larsson, S., Linder, S., and Falk, S. O. (1980). “FAST – Simulation models of gaseous exchange in Scots pine,” in Structure and Function of Northern Coniferous Forests. An Ecosystem Study, ed T. Persson (Stockholm: Ecological Bulletins), 505–523.
Masaki, Y., Ishigooka, Y., Kuwagata, T., Goto, S., Sawano, S., and Hasegawa, T. (2011). Expected changes in future agro-climatological conditions in Northeast Thailand and their differences between general circulation models. Theor. Appl. Climatol. 106, 383–401. doi: 10.1007/s00704-011-0439-3
McCulloh, K. A., and Woodruff, D. R. (2012). Linking stomatal sensitivity and whole-tree hydraulic architecture. Tree physiol. 32, 369–372. doi: 10.1093/treephys/tps036
Pubmed Abstract | Pubmed Full Text | CrossRef Full Text | Google Scholar
Ocheltree, T. W., Nippert, J. B., and Prasad, P. V. V. (2014). Stomatal responses to changes in vapor pressure deficit reflect tissue-specific differences in hydraulic conductance. Plant Cell. Environ. 37, 132–139 doi: 10.1111/pce.12137
Pubmed Abstract | Pubmed Full Text | CrossRef Full Text | Google Scholar
Oren, R., and Pataki, D. E. (2001). Transpiration in response to variation in microclimate and soil moisture in southeastern deciduous forests. Oecologia 127, 549–559. doi: 10.1007/s004420000622
Pataki, D. E., and Oren, R. (2003). Species differences in stomatal control of water loss at the canopy scale in a mature bottomland deciduous forest. Adv. Water. Resour. 26, 1267–1278. doi: 10.1016/j.advwatres.2003.08.001
Phillips, N., and Oren, R. (1998). A comparison of daily representations of canopy conductance based on two conditional time averaging methods and the dependence of daily conductance on environmental factors. Ann. For. Sci. 55, 217–235. doi: 10.1051/forest:19980113
Priyadarshan, P. M., Hoa, T. T. T., Huasun, H., and de Gonçalves, P. S. (2005). Yielding potential of rubber (Hevea brasiliensis) in sub-optimal environments. JCRIP 14, 221–247. doi: 10.1300/J411v14n01_10
Raj, S., Das, G., Pothen, J., and Dey, S. K. (2005). Relationship between latex yield of Hevea brasiliensis and antecedent environmental parameters. Int. J. Biometeorol. 49, 189–196. doi: 10.1007/s00484-004-0222-6
Pubmed Abstract | Pubmed Full Text | CrossRef Full Text | Google Scholar
Richter, H. G., and Dallwitz, M. J. (2000). Commercial Timbers: Descriptions, Illustrations, Identification, and Information Retrieval. Version: 25th June 2009. Available online at: http://delta-intkey.com
Sadras, V. O., and Milroy, S. P. (1996). Soil-water thresholds for the responses of leaf expansion and gas exchange: a review. Field. Crop. Res. 47, 253–266. doi: 10.1016/0378-4290(96)00014-7
Sangsing, K., Kasemsap, P., Thanisawanyangkura, S., Sangkhasila, K., Gohet, E., Thaler, P., et al. (2004). Xylem embolism and stomatal regulation in two rubber clones (Hevea brasiliensis Muel. Arg.). Trees 18, 109–114. doi: 10.1007/s00468-003-0286-7
Sinclair, T. R., Holbrook, N. M., and Zwieniecki, M. A. (2005). Daily transpiration rates of woody species on drying soil. Tree Physiol. 25, 1469–1472. doi: 10.1093/treephys/25.11.1469
Pubmed Abstract | Pubmed Full Text | CrossRef Full Text | Google Scholar
Stewart, J. B. (1988). Modelling surface conductance of pine forest. Agric. For. Meteorol. 43, 19–35. doi: 10.1016/0168-1923(88)90003-2
Pubmed Abstract | Pubmed Full Text | CrossRef Full Text | Google Scholar
UNCTAD. (2013). Area Under NR Cultivation. Available online at: http://www.unctad.info/en/Infocomm/Agricultural_Products/Caoutchouc/Crop/Area-under-NR-cultivation/ Accessed 19 November 2013
VanNoordwich, M., and Lusiana, B. (1999). WaNuLCAS, a model of water, nutrient and light capture in agroforestry systems. Agrofor. Syst. 43, 217–242. doi: 10.1023/A:1026417120254
Keywords: potential transpiration model, drought, high evaporative demand, canopy phenology, relative extractable soil water
Citation: Sopharat J, Gay F, Thaler P, Sdoodee S, Isarangkool Na Ayutthaya S, Tanavud C, Hammecker C and Do FC (2015) A simple framework to analyze water constraints on seasonal transpiration in rubber tree (Hevea brasiliensis) plantations. Front. Plant Sci. 5:753. doi: 10.3389/fpls.2014.00753
Received: 29 September 2014; Accepted: 08 December 2014;
Published online: 06 January 2015.
Edited by:
Laurent Deluc, Oregon State University, USAReviewed by:
Jyostna Devi Mura, North Carolina State University, USAClaudio Lovisolo, University of Turin, Italy
Copyright © 2015 Sopharat, Gay, Thaler, Sdoodee, Isarangkool Na Ayutthaya, Tanavud, Hammecker and Do. This is an open-access article distributed under the terms of the Creative Commons Attribution License (CC BY). The use, distribution or reproduction in other forums is permitted, provided the original author(s) or licensor are credited and that the original publication in this journal is cited, in accordance with accepted academic practice. No use, distribution or reproduction is permitted which does not comply with these terms.
*Correspondence: Jessada Sopharat, Department of Plant Science, Faculty of Natural Resources, Prince of Songkla University, Hat Yai, Songkhla 90112, Thailand e-mail:amVzc2FkYXNvQGdtYWlsLmNvbQ==