 Xiaoyan Peng
 Zhongliang Qin
 Guopeng Zhang
 Junli Huang
- Key Laboratory of Biorheological Science and Technology, Ministry of Education, Bioengineering College, Chongqing University, Chongqing, China
Leaf vascular system differentiation and venation patterns play a key role in transporting nutrients and maintaining the plant shape, which is an important agronomic trait for improving photosynthetic efficiency. However, there is little knowledge about the regulation of leaf vascular specification and development. Here we utilized the rice midribless mutant (dl2) to investigate the molecular changes in transcriptome and proteome profiles during leaf vascular specification and differentiation. Using isobaric tags for relative and absolute quantification (iTRAQ) with digital gene expression (DGE) techniques, a nearly complete catalog of expressed protein and mRNA was acquired. From the catalog, we reliably identified 3172 proteins and 9,865,230 tags mapped to genes, and subsets of 141 proteins and 98 mRNAs, which were differentially expressed between the dl2 mutant and wild type. The correlation analysis between the abundance of differentially expressed mRNA and DEPs (differentially expressed proteins) revealed numerous discordant changes in mRNA/protein pairs and only a modest correlation was observed, indicative of divergent regulation of transcription and translational processes. The DEPs were analyzed for their involvement in biological processes and metabolic pathways. Up- or down- regulation of some key proteins confirmed that the physiological process of vascular differentiation is an active process. These key proteins included those not previously reported to be associated with vascular differentiation processes, and included proteins that are involved in the spliceosome pathway. Together, our results show that the developmental and physiological process of the leaf vascular system is a thoroughly regulated and complicated process and this work has identified potential targets for genetic modification that could be used to regulate the development of the leaf vasculature.
Introduction
The plant vascular system performs important functions, such as delivery of nutrients to the various plant tissues, supply of mechanical support, as well as acting as an effective long-distance communication system relating to abiotic and biotic conditions above and below ground (Lucas et al., 2013). Plant leaves are the principal organs for photosynthesis. Independent origins of the plant leaf in different plant families indicate that it is a necessary evolutionary adaptation for land plants to capture solar energy efficiently (Campitelli and Stinchcombe, 2013). Plant leaf vascular differentiation and venation patterns play a key role in determining plant shape, which is an important agronomic trait. Leaf vascular systems consist of a continuous network of interconnected cells throughout the leaf. Considerable effort has been made examining genetic control of vascular differentiation using vascular system mutants, with several factors identified that affect developmental and physiological processes of the plant vascular system (Mahonen et al., 2000; Dettmer et al., 2009; Ohashi-Ito and Fukuda, 2010). However, a global view of gene activity around the process of vascular differentiation is required. In spite of extensive descriptions about vascular development and patterning, the molecular and physiological mechanisms governing the strictly regulated process remain to be elucidated.
Deciphering the regulation networks of functional genes that coordinately control biological processes will reveal a more comprehensive description of the biological processes and will provide candidates for improving the fitness and performance of plants. Bottom-up profiling of transcripts or proteins is a powerful approach to analyze changes in biological processes such as development or response to environmental perturbations, which are also an essential aspect of systems biology. High-throughput tag-sequencing for digital gene expression (DGE) analysis is a new and powerful tool that permits deep coverage of transcriptome profiles and enables the examination of expression changes with a high dynamic range (Bentley, 2006). This approach supplies a more qualitative and quantitative detection of gene expression than previous microarray-based assays (‘t Hoen et al., 2008). Due to the low cost, transcriptional profiling is the main choice for many laboratories investigating plant development or adaptation to environmental stresses. However, since biological processes are ultimately controlled by proteins, interrogation of changes in the protein profile is crucial for providing an accurate picture of the events triggered. Also, due to post-translational turnover and alternate translation efficiency, mRNA abundance is not a reliable embodiment of protein abundance, and only a modest correlation of the two has been reported (Ideker et al., 2001; Chen et al., 2002; Rogers et al., 2008; Kuss et al., 2011). The technique of isobaric tags for relative and absolute quantification (iTRAQ) combined with LC-MS/MS is popular because of its high resolution and detailed protein expression profiles (Ross et al., 2004). Bioinformatic knowledge has made it possible to analyze and display the data more quickly and accurately (Guo et al., 2008). iTRAQ-based proteomics has been widely applied in systems ranging from pathogen induced stress response in plants to mammalian organ development (Palmieri et al., 2012; Moczulska et al., 2014). A recent study addressing the adjustment of mRNA and protein abundance in mammalian cells emphasized the importance of translational regulation of protein abundance (Schwanhaeusser et al., 2011), underlining the significance of a comprehensive view on gene expression.
This study investigates genome-wide expression of the proteome and transcriptome of plant leaf vascular differentiation in the rice midribless dl2 mutant. In an attempt to have a global view of gene activity in the process of leaf vascular differentiation in rice, and probe candidate genes involved in plant vascular differentiation, we examined the abundance of transcripts and proteins by DGE and iTRAQ technology, respectively, and correlated the abundance difference between mRNAs and proteins. The result indicated that the transcriptomic and proteomic expression profiles were poorly correlated, and there is a modest correlation between transcript and protein levels. In addition, according to their functional annotation, we found some differentially expressed proteins (DEPs) which might be involved in leaf vascular patterning and may help to elucidate the drooping leaf phenotype in dl2 mutants. Our analysis also revealed different control mechanisms that dictate gene activity, uncovering several novel aspects in the metabolism of leaf vascular differentiation in rice. This study provides new clues to address the relationship between the abundance of mRNAs and proteins in plant vascular patterning.
Materials and Methods
Plant Materials and Growth Conditions
The dl2 mutant (MT) of rice (Huang et al., 2011) was isolated from indica cultivar “N45-2” (WT), and the corresponding WT was used as a control in all studies. Rice plants were cultivated in a greenhouse under a 12 h photoperiod (300 μmol photons m−2 s−1) and at 30°C. Humidity was controlled at approximately 60%. Both MT and WT were of the same age and grown under the same conditions. The leaves were sampled for analysis from two-month-old rice plants when the leaves were fully expanded and the MT plants displayed a drooping leaf phenotype. Two biological replicates for each experiment were performed for transcriptome and proteome analysis, and each with pooled leaves from 10 independent plants per replicate. In addition, the leaf samples were flash-frozen in liquid nitrogen and preserved at −80°C for subsequent quantitative real-time PCR (qPCR) analysis.
Protein Extraction
Protein extraction was performed based on a previous report (Yang et al., 2012), with minor modification. Briefly, leaf tissue was ground in liquid nitrogen, and suspended in the Lysis buffer (7 M Urea, 4% CHAPS, 2 M Thiourea, 40 mM Tris-HCl, pH 8.5, 1 mM PMSF, 2 mM EDTA). The proteins were reduced with DTT (10 mM, final concentration) at 56°C for 1 h and then alkylated by 55 mM IAM (final concentration) in the darkroom for 1 h. The reduced and alkylated protein mixtures were precipitated by adding 4 volumes of chilled acetone at −20°C overnight. After centrifugation at 4°C, 30,000 g, the pellet was dissolved in 0.5 M TEAB (Applied Biosystems, Milan, Italy) and sonicated on ice. After centrifuging at 30,000 g at 4°C, the supernatant was analyzed for protein concentration using the Protein Assay Kit (Bio-Rad, Hercules, CA, USA) based on the Bradford method using a BSA standard. The quality of each protein sample was evaluated by SDS-PAGE and samples that showed no degradation and good resolution with low background were kept at −80°C for further analysis.
Protein iTRAQ Labeling and SCX Fractionation of Peptides
Protein iTRAQ labeling was carried out by Huada Genomics Co., Ltd. (Shenzhen, China). The trypsin digestion protocol has been previously described in detail (Lan et al., 2011). Desalted peptides were labeled with iTRAQ reagents (Applied Biosystems, Foster City, CA, USA) according to the manufacturer's instructions. Two WT samples were labeled with reagent 116 and 117, and two MT samples were labeled with reagent 119 and 121, respectively. The reactions were controlled to proceed for 2 h at room temperature. Subsequently, the WT and the MT peptides were combined in equal parts and further fractionated offline using strong cation exchange (SCX) chromatography (LC-20AB, Shimadzu, Japan).
SCX chromatography was performed on a high performance liquid chromatography system (Shimadzu, Kyoto, Japan) using a 250 × 4.6 mm (5-μm particle size) ultremex SCX column (Shimadzu, Kyoto, Japan), based on the following study (Fan et al., 2011). A 10-min elution was used by buffer A (a combination of 25 mM NH2PO4 in 25% acetonitrile, pH 2.7), and followed by 11-min gradient with 5–35% buffer B (25 mM NH2PO4, 1 M KCl in 25% acetonitrile, pH 2.7), and then by ramping up to 80% solvent B for 1 min. The absorbance at 214 nm was monitored and a total of 20 fractions were collected, lyophilized and desalted using the Strata X column (Shimadzu, Kyoto, Japan). Eluents were lyophilized and stored at −80°C before LC-ESI-MS/MS analysis.
LC-ESI-MS/MS Mass Spectrometry Based on TripleTOF 5600
Liquid chromatography was performed using a LC-20AD nanoHPLC (Shimadzu, Kyoto, Japan) and loaded by an autosampler onto a 2 cm C18 trap column. Then, peptides were eluted onto a 10 cm analytical C18 column (inner diameter 75 μm) packed in-house. The samples were loaded at 8 μl/min for 4 min, then the 35 min gradient was run at 300 nL/min starting from 2 to 35% B (95% ACN, 0.1% FA), followed by 5 min linear gradient to 60%, then, followed by 2 min linear gradient to 80%, and maintenance at 80% B for 4 min, and finally return to 5% in 1 min.
Data acquisition was performed with a TripleTOF 5600 System (AB SCIEX, Concord, ON) fitted with a Nanospray III source (AB SCIEX, Concord, ON) and a pulled quartz tip as the emitter (New Objectives, Woburn, MA), based on a recent report (Wang et al., 2013; Guo et al., 2014). Data was acquired using an ion spray voltage of 2.5 kV, curtain gas of 30 psi, nebulizer gas of 15 psi, and an interface heater temperature of 150°C. The MS was performed with an RP of greater than or equal to 30,000 FWHM for TOF MS scans. For IDA, survey scans were acquired in 250 ms and as many as 30 product ion scans were collected if exceeding a threshold of 120 counts per second and with a 2+ to 5+ charge-state. Total cycle time was fixed to 3.3 s. Q2 transmission window was 100 Dafor 100%. Four-time bins were summed for each scan at a pulser frequency value of 11 kHz through monitoring of the 40 GHz multichannel TDC detector with four-anode channel detect ion. A sweeping collision energy setting of 35 ± 5 eV coupled with iTRAQ adjust rolling collision energy was applied to all precursor ions for collision-induced dissociation. Dynamic exclusion was set for 1/2 of peak width (15 s), and then the precursor was refreshed off the exclusion list.
iTRAQ Data Analysis
Raw data files obtained from the TripleTOF 5600 System (AB SCIEX, Concord, ON) were transformed into MGF files using Proteome Discoverer 1.2 (Thermo Fisher Scientific), and the MGF file was searched. Protein identification was performed by using Mascot search engine (version 2.3.02) against a database containing 66,338 rice protein sequences (http://www.ricedata.cn/gene/).
For protein identification, a mass tolerance of ± 0.05 Da was permitted for intact peptide masses and ± 0.1 Da for fragment ions, with allowance for one missed cleavage by trypsin. Gln->pyro-Glu (N-term Q), Oxidation (M), Deamidated (NQ) as the potential variable modifications, and Carbamidomethyl (C), iTRAQ 8 plex (N-term), iTRAQ 8 plex (K) as fixed modifications. The charge states of peptides were set to +2 and +5. Specifically, an automatic decoy database search was carried out in Mascot by choosing the decoy checkbox. To reduce the probability of false peptide characterization, only peptides with scores (≥20) at 99% or greater confidence by Mascot probability analysis were considered as greater than “identity” and counted as identified, and each confident protein identification involved at least one unique peptide. For protein quantification, it was required that a protein contain at least two unique peptides. The quantitative protein ratios were evaluated and normalized by the median ratio in Mascot. We only used ratios with p-values < 0.05, and only a fold change ≥1.6 was considered as significant.
RNA Extraction, DGE Library Preparation and Sequencing
Total RNA was obtained with the RNeasy Plant Mini Kit (Qiagen, Valencia, CA), and contaminating DNA was digested with the DNA-free Kit (Ambion, Austin, TX), according to the kit instructions. RNA quantity was measured in a NanoDrop ND-1000 spectrophotometer (NanoDrop Technologies, Wilmington, DE). RNA quality was evaluated with an Agilent Bioanalyzer Model 2100 (Agilent Technologies, Palo Alto, CA). mRNA was enriched by using oligo (dT) magnetic beads.
DGE library construction and sequencing were carried out at Huada Genomics Co., Ltd., (Shenzhen, China). Briefly, the mRNA was broken into short fragments (about 200 bp) by adding the fragmentation buffer, and then the cDNA was synthesized and single nucleotide A (adenine) was added, which is used for ligation of sequencing adaptors. Finally, the fragments were enriched by PCR amplification, and the enriched library products were used for sequencing analysis via Illumina HiSeq™ 2000.
DGE Tags Analysis and Gene Expression Annotation
DGE tag mapping followed previously-described protocols (Xue et al., 2010). The raw sequence files were filtered to clean tags, which were mapped to the gene tags (http://rice.plantbiology.msu.edu/). The number of explicit clean tags for each gene was computed and then normalized to TPM (number of transcripts per million clean tags, ‘t Hoen et al., 2008; Morrissy et al., 2009).
Screening of Differentially Expressed Genes (DEGs)
A novel approach employing Noiseq was used to characterize DEGs between WT and MT (Audic and Claverie, 1997; Tarazona et al., 2012). P-value corresponds to the test of differential gene expression. Here two biological replicates were performed; thus false discovery rate (FDR) was substituted with the Q-value to determine the threshold of P-value in multiple tests and analysis (Tarazona et al., 2012). We use both the Q-value ≥ 0.8 and absolute value of log2ratio ≥ 1 as the threshold to judge the significance of gene expression difference at P < 0.05 (Benjamini and Yekutieli, 2001).
Quantitative Real-Time PCR (qPCR) Validation
Quantitative real-time PCR (qPCR) analysis was employed to verify the DGE results using the thermocycler CFX1000 (Bio-Rad, CA) with SYBR Premix Ex Taq TMII (Perfect Real Time) kit (Takara). Primers for specific genes were designed using Primer Premier 5.0. qPCR assays were performed in triplicate (technical repeats) with two independent biological replicates, with β-actin as the internal control. The quantitative verification was performed by a relative quantitative method (2−ΔΔCT) (Pfaffl, 2001).
Results
Protein Identification and Quantification Using iTRAQ
To investigate the proteome expression differences between WT and MT, proteins from two biological replicates per phenotype were analyzed with iTRAQ technology. Protein identities were acquired by searching the database containing rice protein sequences (http://www.ricedata.cn/gene/). Results were tested for the significance of protein identification and protein abundance variation using the Mascot search engine (Matrix Science, UK; version 2.3.02). A total of 8835 unique peptides and 3172 proteins from the two experiments were characterized with higher than 99% confidence as shown in supplementary data (Table S1) using the criteria described in the experimental procedures.
DEPs Revealed by iTRAQ in dl2 Mutant
In an attempt to determine DEPs between WT and MT leaf samples, the repeatability of two biological replicates of WT (tags 116 and 117) and MT (tags 121 and 119) was evaluated first (Figure 1). The percentage of the total proteins between the two biological replicates in the two experiments was approximately 0.8 or more, thereby indicating the biological reproducibility of protein expression. Further, the biological variations between two replicates were estimated to set an optimal cut-off value of the fold change for determining significantly altered differential protein expression levels. Fold changes were generated between two biological replicates of control samples and MT samples, respectively. The variations within two biological replicates are presented in Table 1. Around 95% of proteins had fold changes less than 1.6 within biological replicates. Therefore, a 1.6-fold change was used as the optimal threshold to achieve 95% confidence (P < 0.05) for measuring DEPs between MT and WT samples. In addition, only proteins which were identified by two or more peptides and had ≥1.6-fold change of the ratios (tags 117/116 and 121/119) were considered to be DEPs.
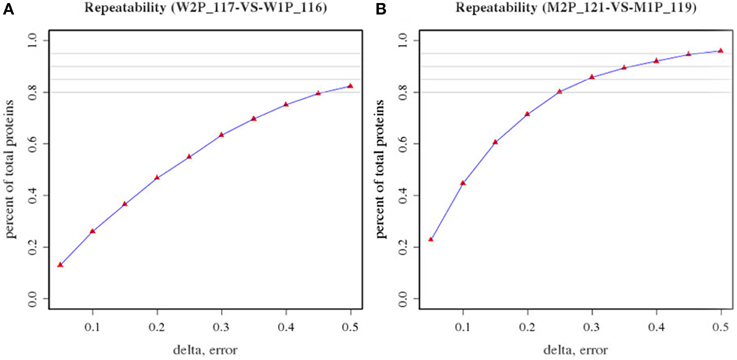
Figure 1. Repeatability of two biological replicates of wild-type samples (tags 116 and 117) and dl2 mutant samples (tags 121 and 119). (A) Repeatability of two biological replicates of wild-type samples (W2P117 and W1P116); (B) Repeatability of two biological replicates of dl2 mutant samples (M2P 121 and M1P119).
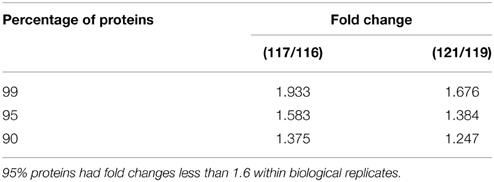
Table 1. Evaluation of biological variance of proteome data.
A total of 141 proteins showed a significant difference (P < 0.05) after the comparison (Table S2), of which 94 and 47 showed increased or decreased accumulation levels in MT compared to WT samples, respectively. DEPs were categorized according to their biological process, molecular function and cellular component using blast2GO program (http://www.blast2go.org/), respectively. A protein might be associated with or located in one or more cellular components, suggesting that it performs functions in one or more biological process. Among these, following the functional classification with the three unrelated GO ontologies, 82 (58%) are involved in biological processes, 82 (58%) have molecular functions, and 106 (75%) are cellular components (Figure 2). For each of these ontologies, annotated sequences are primarily distributed among two or more of the general term categories. Within the 82 differentially expressed proteins involved in biological processes, the main categories represented were cellular process (24.7%), metabolic process (20.8%), regulation of biological process (11.9%) and stress response (10.5%), respectively (Figure 2A). Similarly, in the molecular functions sub-ontology, 43.2% and 41.8% of the DEPs have catalytic activity and binding, respectively (Figure 2B). Finally, in the 106 unique proteins predicted to be cellular components, 46.2, 30.6, and 13.2% are related to cell, organelle and membrane components, respectively (Figure 2C). In the binding section of the category of molecular function, sequence distributions between specialized terms showed that the greatest numbers fell under ion-binding (44.4%) and cyclic compound binding (23.6%), with the third largest group from nucleic acid binding (18.5%) (Figure 2D). This result indicated that many of the DEPs are cellular components and involved in a wide variety of biological processes including development, metabolism and signal transduction. Of specific interest were proteins from the GO category of biological processes related to leaf vascular pattern formation and shoot system developmental processes.
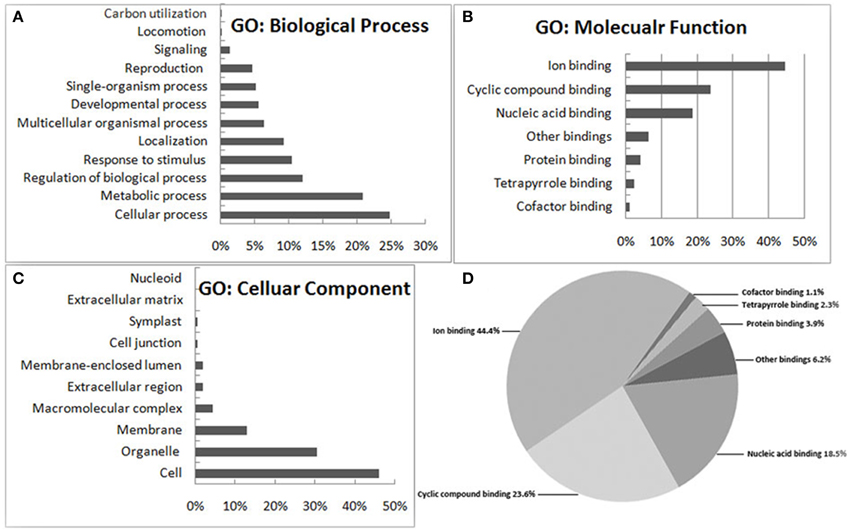
Figure 2. Functional categorization of the differentially expressed proteins between wild type and dl2 mutant samples. The genes were categorized based on Gene Ontology (GO) annotation and the proportion of each category is displayed based on (A) biological process, (B) molecular function, or (C) cellular component. Specialized terms of the binding category (D) shows 141 sequences implicated in binding.
DEPs Related to Drooping Leaf Mutation Revealed by iTRAQ Analysis in dl2 Mutant
In order to analyze the DEPs related to the drooping leaf mutation in the dl2 mutant, we listed the DEPs with change ratios ≥1.6-fold, which might be involved in biological processes related to leaf vascular formation and patterning (Table 2). These DEPs showed increased accumulation levels, such as SART-1 (LOC_Os02g30730.1) and RNA-binding protein (LOC_Os08g02390.1), or decreased accumulation levels, like lycerophosphoryl diester phosphodiesterase and peroxidases (LOC_Os04g39610.1). The SART-1 protein (LOC_Os02g30730.1) levels were increased significantly (ratio = 1.733) in the dl2 mutant (Table 2). In Arabidopsis, leucine zipper protein SART-1 (human squamous cell carcinoma-associated reactive antigen for cytotoxic T-cells) encoded by DOT2 is listed as a component of the spliceosome (Arabidopsis nucleolar protein database; http://bioinf.scri.sari.ac.uk/cgi-bin/atnopdb/home) and involved in cell cycle inhibition, apoptosis as a transcription factor (Gupta et al., 2000; Hosokawa et al., 2005; Petricka et al., 2008). The spurred-leaf class-dot2 mutant from Arabidopsis is dwarfed, and the cotyledon number and vascular pattern are disturbed (Petricka et al., 2008). It has been reported that the RNA-binding protein U2AF (U2 small nuclear ribonucleoprotein auxiliary factor) is an essential splicing factor with critical roles in recognition of the splice site (Jenkins et al., 2013; Paulo Tavanez et al., 2013). Therefore, the RNA-binding protein (LOC_Os08g02390.1), acting as a component of splicesome, might play key roles in rice leaf vascular formation. It is known a variety of studies showed that the plant peroxidase is responsible for lignin biosynthesis during plant vascular development (Bargaz et al., 2013; Zhao et al., 2013; Shigeto et al., 2014). In summary, the results demonstrate that these DEPs might be involved in the physiological process of leaf vascular differentiation, but are not necessarily specific to this process.
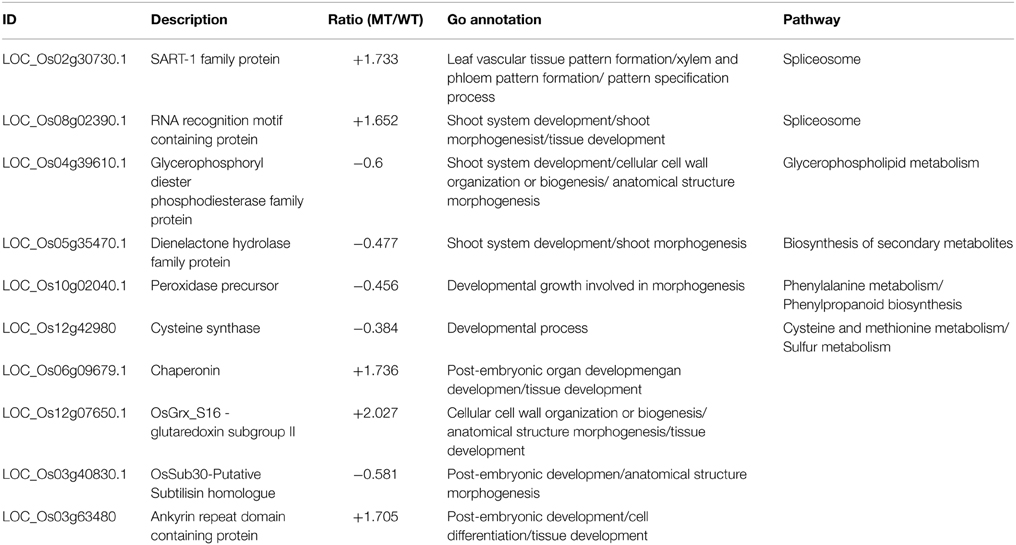
Table 2. A selection of proteins found to be related to dl2 mutation.
Analysis of DGE Libraries
To compare the abundance changes between the proteome and transcriptome, we performed DGE experiments with mRNA samples from MT and WT samples. The correlation coefficient between two biological replicates in each experiment was evaluated first. As shown in Figure 3, both the correlation coefficients between the two biological replicates in the two experiments were approximately 0.9, and a much high overlap of the detected transcripts was exhibited in two biological replicates. This result demonstrated that the DGE libraries are applicable for further analysis. Approximately 3.4 million reads per sample were acquired on the Illumina GAIIx platform and above 96% of total reads were identified as clean reads, which were mapped to genes. Among the clean tags, 70–79% were mapped to the genes perfectly, and 12–17% were mapped to the genome (Table 3). To evaluate whether the sequencing depth was enough for transcriptome coverage, the sequencing saturation was examined in each example (Figure S1). The number of detected genes increased with the number of reads. However, when the number of reads reached more than 3 million, the rate of detected genes flattened, which indicated that the number of detected genes was saturated.
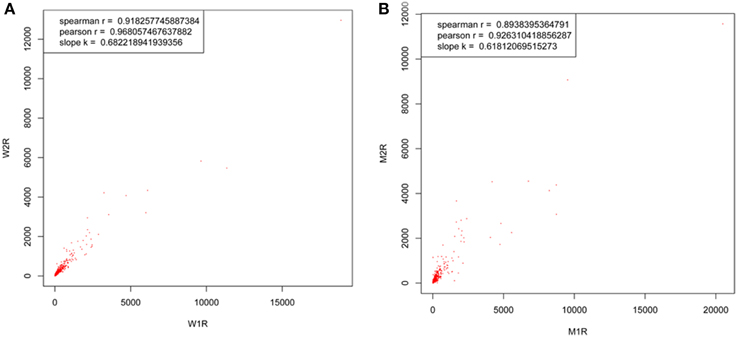
Figure 3. Transcript correlation coefficients between two biological replicates of both wild-type samples (tags 116 and 117) and dl2 mutant samples (tags 121 and 119). The ratios of quantified transcripts were plotted between two biological replicates of (A) wild type samples (W2R and W1R) and (B) mutant samples (M2R and M1R).
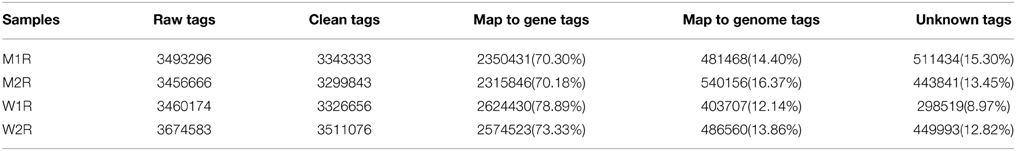
Table 3. Summary of transcriptome of rice wild-type and dl2 mutant.
Verification of DEGs
A total of 98 differentially expressed mRNAs (DEGs) showed a significant difference (P < 0.05) in the comparison, according to the more stringent criteria (ratio ≥ 2, Q-value ≥ 0.8) (Table S3). To validate the expression profiles obtained by RNA-Seq, qPCR was performed on 20 DEGs selected for increased or decreased expression levels (including transcription factors, protein-coding genes and unknown proteins) (Table S4). The absence of non-specific PCR products and primer dimers was confirmed by melting curve analysis and electrophoresis (data not shown). These selected genes encode proteins known to be related to, or involved in, plant tissue developmental processes in other species (Kleffmann et al., 2007; Cai et al., 2008; Vallabhaneni et al., 2010; Majeran et al., 2012). The transcript abundance patterns of MT and WT by qPCR analysis were compared with RNA-Seq data. The results showed that for 18 of the 20 genes, qPCR results displayed similar patterns as the RNA-Seq data, despite some quantitative differences in expression level (Figure 4). The remaining two genes showed different expression patterns by qPCR when compared to RNA-Seq. It is possible that the primers of these genes annealed within a non-specific or poorly annotated region.
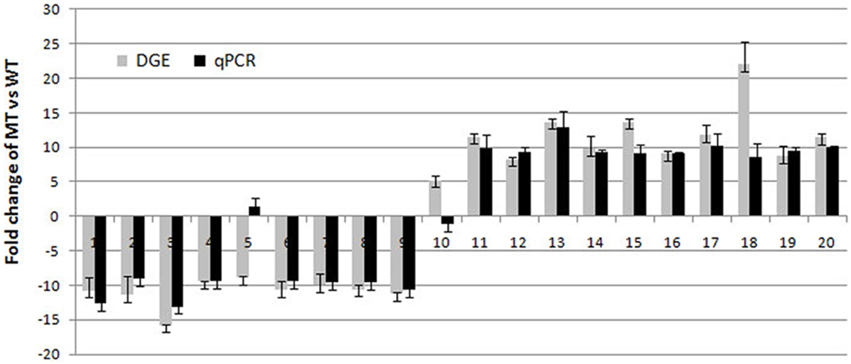
Figure 4. Real-time quantitative PCR analyses of 20 genes selected randomly from the differentially expressed genes. 1, LOC_Os01g10400.1; 2, LOC_Os02g18115.1; 3, LOC_Os12g24800.1; 4, LOC_Os05g33520.1; 5, LOC_Os10g10149.1; 6, LOC_Os03g25960.1; 7, LOC_Os11g35710.; 8, LOC_Os11g45750.1; 9, LOC_Os11g40140.1; 10, LOC_Os10g15164.1; 11, LOC_Os01g26039.1; 12, LOC_Os05g04520.1; 13, LOC_Os08g26840.1; 14, LOC_Os11g02670.1; 15, LOC_Os02g05000.1; 16, LOC_Os10g41650.1; 17, LOC_Os11g01074.2; 18, LOC_Os01g57260.1; 19, LOC_Os01g54400.1; 20, LOC_Os05g04530.1.
Comparison of Cognate Gene and Protein Expression
Integrative analysis of the proteome combined with a comprehensive transcriptome provides an important verification tool for the expression of key genes. To compare the proteome with the transcriptome, we compared the 141 DEPs with 98 differentially expressed mRNAs (DEGs). Surprisingly, only two genes overlapped according to the more stringent criteria (Figure 5A, Table S5). We then generated a second list correlating the 141 DEPs with the cognate mRNAs according to a less stringent criteria (ratio ≥ 2, no Q-value) (Table S6) and a positive correlation of r = 0.35 was obtained when all significantly changed proteins with a cognate mRNA were considered, despite differences in directions of regulation (Figure 5B). When DEPs were compared to all expressed mRNAs (Figure 5C and Table S7) a correlation of r = 0.088 was obtained. Finally, a correlation of r = 0.081 (Figure 5D) was obtained when all expressed protein was compared to all expressed mRNAs (Table S8). To reveal the correlation between DEPs and DEGs precisely, we calculated the correlation between the proteins with increased accumulation (Table S2) and mRNAs with increased accumulation (ratio ≥ 2, no Q-value) (Table S6), and a correlation of r = 0.3 is obtained (Figure S2A). Similarly, the correlation between proteins with decreased accumulation and mRNAs with decreased accumulation is r = 0.4 (Figure S2B). Generally, the relationship between mRNA and protein levels was modest between our analysis of the proteome and transcriptome.
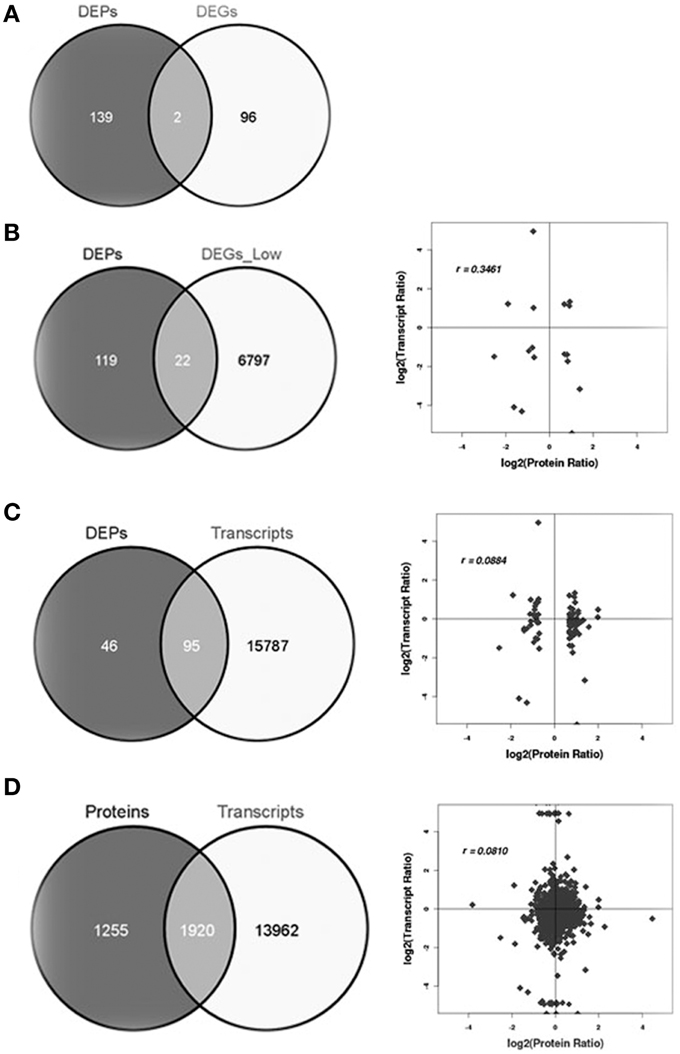
Figure 5. Correlations between protein and transcript levels. (A) Differentially expressed proteins and differentially expressed transcripts using stringent criteria, (B) differentially expressed proteins and differentially expressed transcripts with less stringent criteria, (C) differentially expressed proteins and all expressed transcripts, and (D) all expressed proteins and all expressed mRNA.
Overall, proteins that exhibited notable changes in their expression levels did not have a corresponding alteration in transcript levels (Figure 5), indicating that post-transcription and post-translation may play important roles in regulating leaf vascular development. The correlation coefficient of the overall proteome and transcriptome data was very low (r = 0.081). This is expected because mRNA levels are not always consistent with protein levels due to post-transcriptional, translational and/or post-translational regulation (Gygi et al., 1999; Washburn et al., 2003). In our study, the average correlation between DEPs and DEGs is somewhat higher than that reported in other organisms, perhaps due to improvements in the LC-MS technology and/or statistical power.
Discussion
DEPs Might Be Involved in Leaf Vascular Development in Rice
In this study, a modest correlation between the DEPs and DEGs was found. The up- or down-regulation of some key DEPs confirmed that the physiological process of vascular differentiation is complicated. The modest correlation between the DEPs and DEGs was most probably due to modulation of mRNA processing, selective mRNA translation, mRNA decay and/or protein synthesis and turnover (Galland et al., 2014). This behavior points out the importance of post-transcriptional regulatory mechanisms to account for the phenotype of the dl2 rice mutant. We note in this context that proteins involved in spliceosome functioning were revealed in our study (Table 2, Table S2). mRNA processing, known as pre-mRNA splicing, is performed precisely and efficiently by the spliceosome. The spliceosome assembly and pre-mRNA splicing process requires a large set of proteins and the formation of protein–protein, protein–RNA, and RNA–RNA complexes (Jung and Kang, 2014). Post-transcriptional regulation, including mRNA processing, is emerging as a critical step in plant development. Therefore, alterations in spliceosome functioning could occur in dl2 rice mutants compared to WT rice. To our knowledge, few mutations occurring in spliceosome proteins have been identified, essentially the sad, sta1-1, Atsmu-1, Atsmu-2, smd3-a, and smd3-b mutants of Arabidopsis (Xiong et al., 2001; Lee et al., 2006; Chung et al., 2009; Swaraz et al., 2011). As a component of the spliceosome, SART-1 protein accumulated in dl2 mutants, compared to WT (Table 2). Consensus components for spliceosome structure suggest that the pre-mRNA splicing mechanism in plants could be similar to that in animals (Brown and Simpson, 1998; Lorkovic et al., 2000; Reddy, 2001; Swaraz et al., 2011), which could serve as a guide for directing genetic and functional analyses of spliceosome structure in plant.
It is noteworthy to mention that the protein methionine sulfoxide reductase MsrB (LOC_Os05g33510.1) showed an 8-fold increase in accumulation levels (Table S2), and its corresponding mRNA levels were also increased more than 8-fold in the dl2 mutants compared to WT (Table S5). The Arabidopsis plastidic protein, MsrB, was shown to accumulate in response to a photooxidative treatment, which suggested a possible role of MsrB in tolerance to oxidative damage (Dos Santos et al., 2005). We also noted that both thioredoxin and glutaredoxin levels were increased significantly (Table S2). Thioredoxins and glutaredoxins constitute families of thiol oxidoreductases (Meyer et al., 2012), and it has been reported that the two oxidoreductases play a key role in protection against photooxidative stress in plants (Laporte et al., 2012; Wu et al., 2012; Rey et al., 2013). In our study, the result that the plastidic protein MsrB (LOC_Os05g33510.1), as well as thioredoxins (LOC_Os01g68480.1) and glutaredoxin (LOC_Os12g07650.1) were over-accumulated, suggests the occurrence of an oxidative stress in the dl2 mutant, and the levels of these related enzymes were increased to repair defects in protein functions due to oxidation. Our previous results demonstrated that the dl2 drooping leaf phenotype is coupled with a defective response to auxin (Huang et al., 2011). Interestingly, the level of auxin-repressed protein (LOC_Os11g44810.1) was increased significantly (Table S2), which is consistent with the defective response to auxin in the dl2 mutant. Recent research suggests that the plant growth regulator auxin may be the connecting link regulating the level of ROS and directing its role in oxidative damage or signaling in plants under stress (Bashandy et al., 2010; Krishnamurthy and Rathinasabapathi, 2013). Therefore, a likely hypothesis could be that this mutation entails an oxidative stress in rice dl2 mutants. In the future, it will be interesting to investigate the participation of MsrB and related oxidoreductases during stress treatments by using knockout and overexpression mutants.
Modest Concordance between Transcript and Protein Levels
To date, differential transcriptomic and proteomic experiments have provided an overview of the accumulation patterns of mRNAs and proteins (Chen et al., 2002; Fathi et al., 2009; Ghazalpour et al., 2011; Lan et al., 2011). However, the discordance between mRNA and protein abundance is present during the flow of genetic information from DNA to phenotype. In fact, protein levels are greatly influenced by translational and post-translational processing, and it was assumed that the selective mRNA translation and protein turnover contribute to the dynamic proteome (Galland et al., 2014). However, the extent to which this occurs is still poorly understood, and comprehending the correlation between the proteome and transcriptome has both practical and basic implications. As we have known, genetic studies regard transcription alterations as a function of genetic variation and employ the data to make models, such as interaction networks, to explain complex phenotypes (Brem et al., 2002; Schadt et al., 2003; Keurentjes et al., 2007). Systems based on these methods, in particular, have relied heavily on transcriptome data. However, there are widely reported deviations between the proteome and transcriptome (Ghazalpour et al., 2011; Galland et al., 2014), which has been further highlighted by our study.
We have previously reported on the dl2 mutantin rice with midribless leaf and altered plant shape (Huang et al., 2011). Here, a comparative analysis of the genetic regulation of transcriptome and proteome in dl2 mutants was performed. By checking the effects of thousands of genetic disturbance simultaneously at the transcript and protein level, we were able to evaluate the global nature of relationships between the two levels objectively. This analysis showed that the relationship between the protein and transcript expression was modest. We predicted that the heredity variation is a predictor of concordance between protein and transcript levels. Our results complement the data previously reported for yeast and plant, indicating similar modest protein-transcript correlation. Compared to yeast (Foss et al., 2007), our results showed a much lower estimate of protein-transcript concordance (0.081 vs. 0.18 correlation) when considering all the protein measurements, and a significantly higher estimate (0.34 vs. 0.18 correlation) when considering DEPs. The slightly higher correlation between the proteome and transcriptome in our study is probably due to advancements in the LC-MS technology and/or analysis tools. The strategy of iTRAQ, which provides the advantage of overcoming peptide level alterations due to platform improvements, is known to be more precise in quantifying peptides when compared to label free methods (Ghazalpour et al., 2011). Overall, we found that the relationship between differentially expressed protein and differentially expressed mRNA was modest (under r = 0.34), and the DEPs may be considered as candidates involved in the physiological process of leaf vascular pattern, but it requires further study.
Conflict of Interest Statement
The authors declare that the research was conducted in the absence of any commercial or financial relationships that could be construed as a potential conflict of interest.
Acknowledgments
This work was supported by the National Natural Science Foundation of China (grant no. 31271685) and Chongqing Municipal Science and Technology Commission projects (CSCT 2014jcyjA80017, 2014jcyjA0990). The authors thank Huada Genomics Co., Ltd. (Shenzhen, China) for their excellent technical help.
Supplementary Material
The Supplementary Material for this article can be found online at: http://journal.frontiersin.org/article/10.3389/fpls.2015.00351/abstract
Figure S1. Analysis of sequence saturation for four samples from wild type (WT) and mutant MT. Samples W1R and W2R were from WT and M1R and M2R were from MT.
Figure S2. Correlations between protein and transcript levels. (A) Correlation between differentially expressed proteins (DEPs) with increased accumulation and differentially expressed genes (DEGs) with increased accumulation, (B) Correlation between DEPs with decreased accumulation and DEGs with decreased accumulation.
Table S1. A total of 3172 proteins in two experiments were identified with higher significance (P < 0.05).
Table S2. 141 DEPs (differentially expressed proteins) (P < 0.05, and the fold change ≥1.6).
Table S3. A total of 98 DEGs (differentially expressed genes) (p-values < 0.05, and the fold change ≥ 2.0, Q ≥ 0.8).
Table S4. Primers for real-time quantitative PCR analysis.
Table S5. Correlation analysis between differentially expressed proteins (DEPs) and differentially expressed genes (DEGs) with more stringent criteria (Ratio ≥ 2, Q-value ≥ 0.8).
Table S6. Correlation analysis between differentially expressed proteins (DEPs) and differentially expressed genes (DEGs) with less stringent criteria (Ratio ≥ 2, no Q-value).
Table S7. Correlation analysis between differentially expressed proteins (DEPs) and all expressed genes (DEGs).
Table S8. Correlation analysis between all expressed proteins (DEPs) and all expressed genes (DEGs).
Abbreviations
iTRAQ, isobaric tag for relative and absolute quantification; DGE, digital gene expression; DEGs, differentially expressed genes; DEPs, differentially expressed proteins; MT, mutant; WT, wild type.
References
Audic, S., and Claverie, J. M. (1997). The significance of digital gene expression profiles. Genome Res. 7, 986–995.
Bargaz, A., Lazali, M., Amenc, L., Abadie, J., Ghoulam, C., Farissi, M., et al. (2013). Differential expression of trehalose 6-P phosphatase and ascorbate peroxidase transcripts in nodule cortex of Phaseolus vulgaris and regulation of nodule O-2 permeability. Planta 238, 107–119. doi: 10.1007/s00425-013-1877-1
Bashandy, T., Guilleminot, J., Vernoux, T., Caparros-Ruiz, D., Ljung, K., Meyer, Y., et al. (2010). Interplay between the NADP-linked thioredoxin and glutathione systems in arabidopsis auxin signaling. Plant Cell 22, 376–391. doi: 10.1105/tpc.109.071225
Benjamini, Y., and Yekutieli, D. (2001). The control of the false discovery rate in multiple testing under dependency. Ann. Stat. 29, 1165–1188. doi: 10.1007/s11749-008-0131-9
Bentley, D. R. (2006). Whole-genome re-sequencing. Curr. Opin. Genet. Dev. 16, 545–552. doi: 10.1016/j.gde.2006.10.009
Brem, R. B., Yvert, G., Clinton, R., and Kruglyak, L. (2002). Genetic dissection of transcriptional regulation in budding yeast. Science 296, 752–755. doi: 10.1126/science.1069516
Brown, J. W. S., and Simpson, C. G. (1998). Splice site selection in plant pre-mRNA splicing. Annu. Rev. Plant Physiol. Plant Mol. Biol. 49, 77–95. doi: 10.1146/annurev.arplant.49.1.77
Cai, M., Yuan, T., Duan, L., Li, X., and Wang, S. (2008). Identification of potential protein regulators bound to the tissue-specific positive and negative cis-acting elements of a green tissue-specific promoter in rice. Plant Biol. 10, 771–777. doi: 10.1111/j.1438-8677.2008.00084.x
Campitelli, B. E., and Stinchcombe, J. R. (2013). Testing potential selective agents acting on leaf shape in Ipomoea hederacea: predictions based on an adaptive leaf shape cline. Ecol. Evol. 3, 2409–2423. doi: 10.1002/ece3.641
Chen, G. A., Gharib, T. G., Huang, C. C., Taylor, J. M. G., Misek, D. E., Kardia, S. L. R., et al. (2002). Discordant protein and mRNA expression in lung adenocarcinomas. Mol. Cell. Proteomics 1, 304–313. doi: 10.1074/mcp.M200008-MCP200
Chung, T., Wang, D., Kim, C.-S., Yadegari, R., and Larkins, B. A. (2009). Plant SMU-1 and SMU-2 homologues regulate pre-mRNA splicing and multiple aspects of development. Plant Physiol. 151, 1498–1512. doi: 10.1104/pp.109.141705
Dettmer, J., Elo, A., and Helariutta, Y. (2009). Hormone interactions during vascular development. Plant Mol. Biol. 69, 347–360. doi: 10.1007/s11103-008-9374-9
Dos Santos, C. V., Cuine, S., Rouhier, N., and Rey, P. (2005). The Arabidopsis plastidic methionine sulfoxide reductase B proteins. Sequence and activity characteristics, comparison of the expression with plastidic methionine sulfoxide reductase A, and induction by photooxidative stress. Plant Physiol. 138, 909–922. doi: 10.1104/pp.105.062430
Fan, J., Chen, C., Yu, Q., Brlansky, R. H., Li, Z.-G., and Gmitter, F. G. Jr. (2011). Comparative iTRAQ proteome and transcriptome analyses of sweet orange infected by “Candidatus Liberibacter asiaticus.” Physiol. Plant. 143, 235–245. doi: 10.1111/j.1399-3054.2011.01502.x
Fathi, A., Pakzad, M., Taei, A., Brink, T. C., Pirhaji, L., Ruiz, G., et al. (2009). Comparative proteome and transcriptome analyses of embryonic stem cells during embryoid body-based differentiation. Proteomics 9, 4859–4870. doi: 10.1002/pmic.200900003
Foss, E. J., Radulovic, D., Shaffer, S. A., Ruderfer, D. M., Bedalov, A., Goodlett, D. R., et al. (2007). Genetic basis of proteome variation in yeast. Nat. Genet. 39, 1369–1375. doi: 10.1038/ng.2007.22
Galland, M., Huguet, R., Arc, E., Cueff, G., Job, D., and Rajjou, L. (2014). Dynamic proteomics emphasizes the importance of selective mRNA translation and protein turnover during arabidopsis seed germination. Mol. Cell. Proteomics 13, 252–268. doi: 10.1074/mcp.M113.032227
Ghazalpour, A., Bennett, B., Petyuk, V. A., Orozco, L., Hagopian, R., Mungrue, I. N., et al. (2011). Comparative analysis of proteome and transcriptome variation in mouse. PLoS Genet. 7:e1001393. doi: 10.1371/journal.pgen.1001393
Guo, H., Chen, C., Lee, D.-J., Wang, A., Gao, D., and Ren, N. (2014). Coupled carbon, sulfur and nitrogen cycles of mixotrophic growth of Pseudomonas sp C27 under denitrifying sulfide removal conditions. Bioresour. Technol. 171, 120–126. doi: 10.1016/j.biortech.2014.08.035
Guo, T., Gan, C. S., Zhang, H., Zhu, Y., Kon, O. L., and Sze, S. K. (2008). Hybridization of pulsed-Q dissociation and collision-activated dissociation in linear ion trap mass spectrometer for iTRAQ quantitation. J. Proteome Res. 7, 4831–4840. doi: 10.1021/pr800403z
Gupta, M., Mungai, P. T., and Goldwasser, E. (2000). A new transacting factor that modulates hypoxia-induced expression of the erythropoietin gene. Blood 96, 491–497.
Gygi, S. P., Rochon, Y., Franza, B. R., and Aebersold, R. (1999). Correlation between protein and mRNA abundance in yeast. Mol. Cell. Biol. 19, 1720–1730.
Hosokawa, M., Kadota, R., Shichijo, S., Itoh, K., Dmitriev, I., Krasnykh, V., et al. (2005). Cell cycle arrest and apoptosis induced by SART-1 gene transduction. Anticancer Res. 25, 1983–1990.
Huang, J., Che, S., Jin, L., Qin, F., Wang, G., and Ma, N. (2011). The physiological mechanism of a drooping leaf2 mutation in rice. Plant Sci. 180, 757–765. doi: 10.1016/j.plantsci.2011.03.001
Ideker, T., Thorsson, V., Ranish, J. A., Christmas, R., Buhler, J., Eng, J. K., et al. (2001). Integrated genomic and proteomic analyses of a systematically perturbed metabolic network. Science 292, 929–934. doi: 10.1126/science.292.5518.929
Jenkins, J. L., Agrawal, A. A., Gupta, A., Green, M. R., and Kielkopf, C. L. (2013). U2AF(65) adapts to diverse pre-mRNA splice sites through conformational selection of specific and promiscuous RNA recognition motifs. Nucleic Acids Res. 41, 3859–3873. doi: 10.1093/nar/gkt046
Jung, H. J., and Kang, H. (2014). The Arabidopsis U11/U12-65K is an indispensible component of minor spliceosome and plays a crucial role in U12 intron splicing and plant development. Plant J. 78, 799–810. doi: 10.1111/tpj.12498
Keurentjes, J. J. B., Fu, J., Terpstra, I. R., Garcia, J. M., Van Den Ackerveken, G., Snoek, L. B., et al. (2007). Regulatory network construction in Arabidopsis by using genome-wide gene expression quantitative trait loci. Proc. Natl. Acad. Sci. U.S.A. 104, 1708–1713. doi: 10.1073/pnas.0610429104
Kleffmann, T., Von Zychlinski, A., Russenberger, D., Hirsch-Hoffmann, M., Gehrig, P., Gruissem, W., et al. (2007). Proteome dynamics during plastid differentiation in rice. Plant Physiol. 143, 912–923. doi: 10.1104/pp.106.090738
Krishnamurthy, A., and Rathinasabapathi, B. (2013). Oxidative stress tolerance in plants: novel interplay between auxin and reactive oxygen species signaling. Plant Signal. Behav. 8:e25761. doi: 10.4161/psb.25761
Kuss, C., Gan, C. S., Gunalan, K., Bozdech, Z., Sze, S. K., and Preiser, P. R. (2011). Quantitative proteomics reveals new insights into erythrocyte invasion by Plasmodium falciparum. Mol. Cell. Proteomics 11, M111. doi: 10.1074/mcp.M111.010645
Lan, P., Li, W., Wen, T.-N., Shiau, J.-Y., Wu, Y.-C., Lin, W., et al. (2011). iTRAQ protein profile analysis of Arabidopsis roots reveals new aspects critical for iron homeostasis. Plant Physiol. 155, 821–834. doi: 10.1104/pp.110.169508
Laporte, D., Olate, E., Salinas, P., Salazar, M., Jordana, X., and Holuigue, L. (2012). Glutaredoxin GRXS13 plays a key role in protection against photooxidative stress in Arabidopsis. J. Exp. Bot. 63, 503–515. doi: 10.1093/jxb/err301
Lee, B.-H., Kapoor, A., Zhu, J., and Zhu, J.-K. (2006). STABILIZED1, a stress-upregulated nuclear protein, is required for pre-mRNA splicing, mRNA turnover, and stress tolerance in Arabidopsis. Plant Cell 18, 1736–1749. doi: 10.1105/tpc.106.042184
Lorkovic, Z. J., Kirk, D. A. W., Lambermon, M. H. L., and Filipowicz, W. (2000). Pre-mRNA splicing in higher plants. Trends Plant Sci. 5, 160–167. doi: 10.1016/S1360-1385(00)01595-8
Lucas, W. J., Groover, A., Lichtenberger, R., Furuta, K., Yadav, S.-R., Helariutta, Y., et al. (2013). The plant vascular system: evolution, development and functions. J. Integr. Plant Biol. 55, 294–388. doi: 10.1111/jipb.12041
Mahonen, A. P., Bonke, M., Kauppinen, L., Riikonen, M., Benfey, P. N., and Helariutta, Y. (2000). A novel two-component hybrid molecule regulates vascular morphogenesis of the Arabidopsis root. Genes Dev. 14, 2938–2943. doi: 10.1101/gad.189200
Majeran, W., Friso, G., Asakura, Y., Qu, X., Huang, M., Ponnala, L., et al. (2012). Nucleoid-enriched proteomes in developing plastids and chloroplasts from maize leaves: a new conceptual framework for nucleoid functions. Plant Physiol. 158, 156–189. doi: 10.1104/pp.111.188474
Meyer, Y., Belin, C., Delorme-Hinoux, V., Reichheld, J.-P., and Riondet, C. (2012). Thioredoxin and glutaredoxin systems in plants: molecular mechanisms, crosstalks, and functional significance. Antioxid. Redox Signal. 17, 1124–1160. doi: 10.1089/ars.2011.4327
Moczulska, K. E., Pichler, P., Schutzbier, M., Schleiffer, A., Rumpel, S., and Mechtler, K. (2014). Deep and precise quantification of the mouse synaptosomal proteome reveals substantial remodeling during postnatal maturation. J. Proteome Res. 13, 4310–4324. doi: 10.1021/pr500456t
Morrissy, A. S., Morin, R. D., Delaney, A., Zeng, T., Mcdonald, H., Jones, S., et al. (2009). Next-generation tag sequencing for cancer gene expression profiling. Genome Res. 19, 1825–1835. doi: 10.1101/gr.094482.109
Ohashi-Ito, K., and Fukuda, H. (2010). Transcriptional regulation of vascular cell fates. Curr. Opin. Plant Biol. 13, 670–676. doi: 10.1016/j.pbi.2010.08.011
Palmieri, M. C., Perazzolli, M., Matafora, V., Moretto, M., Bachi, A., and Pertot, I. (2012). Proteomic analysis of grapevine resistance induced by Trichoderma harzianum T39 reveals specific defence pathways activated against downy mildew. J. Exp. Bot. 63, 6237–6251. doi: 10.1093/jxb/ers279
Paulo Tavanez, J., Madl, T., Kooshapur, H., Sattler, M., and Valcarcel, J. (2013). hnRNP A1 proofreads 3′ splice site recognition by U2AF. Mol. Cell 45, 314–329. doi: 10.1016/j.molcel.2011.11.033
Petricka, J. J., Clay, N. K., and Nelson, T. M. (2008). Vein patterning screens and the defectively organized tributaries mutants in Arabidopsis thaliana. Plant J. 56, 251–263. doi: 10.1111/j.1365-313X.2008.03595.x
Pfaffl, M. W. (2001). A new mathematical model for relative quantification in real-time RT-PCR. Nucleic Acids Res. 29:e45. doi: 10.1093/nar/29.9.e45
Reddy, A. S. N. (2001). Nuclear pre-mRNA splicing in plants. CRC. Crit. Rev. Plant Sci. 20, 523–571. doi: 10.1016/S0735-2689(01)80004-6
Rey, P., Sanz-Barrio, R., Innocenti, G., Ksas, B., Courteille, A., Rumeau, D., et al. (2013). Overexpression of plastidial thioredoxins f and m differentially alters photosynthetic activity and response to oxidative stress in tobacco plants. Front. Plant Sci. 4:390. doi: 10.3389/fpls.2013.00390
Rogers, S., Girolami, M., Kolch, W., Waters, K. M., Liu, T., Thrall, B., et al. (2008). Investigating the correspondence between transcriptomic and proteomic expression profiles using coupled cluster models. Bioinformatics 24, 2894–2900. doi: 10.1093/bioinformatics/btn553
Ross, P. L., Huang, Y. L. N., Marchese, J. N., Williamson, B., Parker, K., Hattan, S., et al. (2004). Multiplexed protein quantitation in Saccharomyces cerevisiae using amine-reactive isobaric tagging reagents. Mol. Cell. Proteomics 3, 1154–1169. doi: 10.1074/mcp.M400129-MCP200
Schadt, E. E., Monks, S. A., Drake, T. A., Lusis, A. J., Che, N., Colinayo, V., et al. (2003). Genetics of gene expression surveyed in maize, mouse and man. Nature 422, 297–302. doi: 10.1038/nature01434
Schwanhaeusser, B., Busse, D., Li, N., Dittmar, G., Schuchhardt, J., Wolf, J., et al. (2011). Global quantification of mammalian gene expression control. Nature 473, 337–342. doi: 10.1038/nature10098
Shigeto, J., Nagano, M., Fujita, K., and Tsutsumi, Y. (2014). Catalytic profile of Arabidopsis peroxidases, AtPrx-2, 25 and 71, contributing to stem lignification. PLoS ONE 9:e105332. doi: 10.1371/journal.pone.0105332
Swaraz, A. M., Park, Y.-D., and Hur, Y. (2011). Knock-out mutations of Arabidopsis SmD3-b induce pleotropic phenotypes through altered transcript splicing. Plant Sci. 180, 661–671. doi: 10.1016/j.plantsci.2011.01.011
Tarazona, S., Garcia-Alcalde, F., Dopazo, J., Ferrer, A., and Conesa, A. (2012). Differential expression in RNA-seq: a matter of depth. Genome Res. 21, 2213–2223. doi: 10.1101/gr.124321.111
‘t Hoen, P. A. C., Ariyurek, Y., Thygesen, H. H., Vreugdenhil, E., Vossen, R. H. A. M., et al. (2008). Deep sequencing-based expression analysis shows major advances in robustness, resolution and inter-lab portability over five microarray platforms. Nucleic Acids Res. 36, e141. doi: 10.1093/nar/gkn705
Vallabhaneni, R., Bradbury, L. M. T., and Wurtzel, E. T. (2010). The carotenoid dioxygenase gene family in maize, sorghum, and rice. Arch. Biochem. Biophys. 504, 104–111. doi: 10.1016/j.abb.2010.07.019
Wang, J., Mei, H., Zheng, C., Qian, H., Cui, C., Fu, Y., et al. (2013). The metabolic regulation of sporulation and parasporal crystal formation in Bacillus thuringiensis revealed by transcriptomics and proteomics. Mol. Cell. Proteomics 12, 1363–1376. doi: 10.1074/mcp.M112.023986
Washburn, M. P., Koller, A., Oshiro, G., Ulaszek, R. R., Plouffe, D., Deciu, C., et al. (2003). Protein pathway and complex clustering of correlated mRNA and protein expression analyses in Saccharomyces cerevisiae. Proc. Natl. Acad. Sci. U.S.A. 100, 3107–3112. doi: 10.1073/pnas.0634629100
Wu, Q., Lin, J., Liu, J.-Z., Wang, X., Lim, W., Oh, M., et al. (2012). Ectopic expression of Arabidopsis glutaredoxin AtGRXS17 enhances thermotolerance in tomato. Plant Biotechnol. J. 10, 945–955. doi: 10.1111/j.1467-7652.2012.00723.x
Xiong, L. M., Gong, Z. Z., Rock, C. D., Subramanian, S., Guo, Y., Xu, W. Y., et al. (2001). Modulation of abscisic acid signal transduction and biosynthesis by an Sm-like protein in Arabidopsis. Dev. Cell 1, 771–781. doi: 10.1016/S1534-5807(01)00087-9
Xue, J. A., Bao, Y. Y., Li, B. L., Cheng, Y. B., Peng, Z. Y., Liu, H., et al. (2010). Transcriptome analysis of the brown planthopper Nilaparvata lugens. PLoS ONE 5:e14233. doi: 10.1371/journal.pone.0014233
Yang, Q.-S., Wu, J.-H., Li, C.-Y., Wei, Y.-R., Sheng, O., Hu, C.-H., et al. (2012). Quantitative proteomic analysis reveals that antioxidation mechanisms contribute to cold tolerance in plantain (Musa paradisiaca L.; ABB Group) Seedlings. Mol. Cell. Proteomics 11, 1853–1869. doi: 10.1074/mcp.M112.022079
Keywords: rice (Oryza sativa), drooping leaf, midrib, proteome, transcriptome, correlation
Citation: Peng X, Qin Z, Zhang G, Guo Y and Huang J (2015) Integration of the proteome and transcriptome reveals multiple levels of gene regulation in the rice dl2 mutant. Front. Plant Sci. 6:351. doi: 10.3389/fpls.2015.00351
Received: 15 March 2015; Accepted: 03 May 2015;
Published: 17 June 2015.
Edited by:
Dominique Job, Centre National de la Recherche Scientifique, FranceReviewed by:
Letizia Bernardo, University of Calabria, ItalyRamesh Katam, Florida Agricultural & Mechanical University, USA
Copyright © 2015 Peng, Qin, Zhang, Guo and Huang. This is an open-access article distributed under the terms of the Creative Commons Attribution License (CC BY). The use, distribution or reproduction in other forums is permitted, provided the original author(s) or licensor are credited and that the original publication in this journal is cited, in accordance with accepted academic practice. No use, distribution or reproduction is permitted which does not comply with these terms.
*Correspondence: Junli Huang, Key Laboratory of Biorheological Science and Technology, Ministry of Education, Bioengineering College, Chongqing University, Shazheng Street, Chongqing 400030, China,aHVhbmdqdW5saUBjcXUuZWR1LmNu;aHVhbmdfanVubGlAMTI2LmNvbQ==