 Jing Wang
 Juan Liu
 Ming Kang
- Key Laboratory of Plant Resources Conservation and Sustainable Utilization, South China Botanical Garden, Chinese Academy of Sciences, Guangzhou, China
Flow cytometry (FCM) is a commonly used method for estimating genome size in many organisms. The use of FCM in plants is influenced by endogenous fluorescence inhibitors and may cause an inaccurate estimation of genome size; thus, falsifying the relationship between genome size and phenotypic traits/ecological performance. Quantitative optimization of FCM methodology minimizes such errors, yet there are few studies detailing this methodology. We selected the genus Primulina, one of the most representative and diverse genera of the Old World Gesneriaceae, to evaluate the methodology effect on determining genome size. Our results showed that buffer choice significantly affected genome size estimation in six out of the eight species examined and altered the 2C-value (DNA content) by as much as 21.4%. The staining duration and propidium iodide (PI) concentration slightly affected the 2C-value. Our experiments showed better histogram quality when the samples were stained for 40 min at a PI concentration of 100 μg ml−1. The quality of the estimates was not improved by 1-day incubation in the dark at 4°C or by centrifugation. Thus, our study determined an optimum protocol for genome size measurement in Primulina: LB01 buffer supplemented with 100 μg ml−1 PI and stained for 40 min. This protocol also demonstrated a high universality in other Gesneriaceae genera. We report the genome size of nine Gesneriaceae species for the first time. The results showed substantial genome size variation both within and among the species, with the 2C-value ranging between 1.62 and 2.71 pg. Our study highlights the necessity of optimizing the FCM methodology prior to obtaining reliable genome size estimates in a given taxon.
Introduction
Genome size (C-value or the haploid nuclear DNA content) is significantly correlated with cell/nucleus sizes, cellular processes (e.g., the DNA synthesis rate), and a range of ecological characteristics (Beaulieu et al., 2008; Greilhuber and Leitch, 2013). Genome size has fundamental biological importance with considerable applications in a wide range of fields, including ecology, cell and molecular biology, systematics, and evolution (Bennett and Leitch, 2005, 2011; Veselý et al., 2012). Genome size varies a remarkable 2400-fold across the angiosperm flora (Pellicer et al., 2010) and even exhibits substantial variation among closely related species (Duchoslav et al., 2013; Fleischmann et al., 2014). It is an important biological parameter that has been increasingly used to clarify evolutionary patterns and adaptation mechanisms of plants (e.g., Huang et al., 2013; Kang et al., 2014; Jordan et al., 2015). Rapid advancements in whole-genome sequencing of non-model plants further highlight the importance of accurately estimating genome size.
Flow cytometry (FCM) has been considered a fast, sensitive technique for determining the genome size of plants since Galbraith et al. (1983) developed a rapid and simple method for isolation of nuclei by chopping leaf tissues in a lysis buffer. However, the accuracy of FCM results in plants has been reportedly influenced by secondary metabolites, such as tannic acid (Loureiro et al., 2006), anthocyanins (Bennett et al., 2008), and extremely mucilaginous compounds (Cires et al., 2011). The detrimental impact of endogenous fluorescence inhibitors on genome size estimation has led researchers to see k effective methods to prevent or minimize such effects (e.g., Loureiro et al., 2006, 2007a; Bennett et al., 2008). It was reported that simultaneous processing of both target and standard samples followed by a comparison of the data based on internal and external standards can effectively ameliorate the secondary metabolites' influence on genome size estimations (Price et al., 2000; Noirot et al., 2005). Other methods include selecting suitable nuclei isolation buffers, using antioxidant compounds (Doležel and Bartoš, 2005; Loureiro et al., 2006), determining the optimum stain concentration and staining duration (Loureiro et al., 2006; Doležel et al., 2007), and centrifuging nuclear suspensions and discarding the supernatant (Doležel and Bartoš, 2005). To reduce experimental errors, all of the samples, including both target and standard plants, should be maintained under the same environmental conditions (Noirot et al., 2005) and distinct replicates should be performed (Doležel and Bartoš, 2005; Bennett et al., 2008). On the other hand, recent advances in FCM methods have enabled rigorous documentation of inter- and intra-specific genome size variation (Bainard et al., 2010; Cires et al., 2011). However, only a few studies have evaluated the effect of methodology on genome size estimations in a given taxon (Bainard et al., 2010; Cires et al., 2011).
Genome sizes have been estimated for more than 7500 angiosperm species, belonging to more than 50% of the angiosperm families and representing approximately 2% of flowering plant species (APG III, 2009; Bennett and Leitch, 2012). However, these studies are confined to particular regions (e.g., Europe and North America), whereas plant genome size in other areas with higher species richness and endemism remains poorly understood (Bennett and Leitch, 2011). The Southern and Southwestern parts of China boast of 20,000 plant species and are considered the most endemic-rich subtropical flora areas of the world. We have initiated a large-scale project to examine the genome size in the flora of Southern China. The largest genus of the old world Gesneriaceae, Primulina (Wang et al., 2011; Weber et al., 2011), is a monophyletic group with more than 150 perennial species that is widely distributed throughout the karst regions of China and adjacent countries in Southeast Asia. Approximately 120 Primulina species (85%) are endemic to Southern and Southwestern China. The high microhabitat specialization and species richness of the genus makes Primulina an ideal non-model system for studying speciation and adaptation. Moreover, an accurate estimation of genome size in Primulina is important to understand the pattern of genome size variation and its role in evolutionary adaptation and speciation mechanism.
The abundant and diverse secondary metabolites detected in Gesneriaceae (Verdan and Stefanello, 2012) make it critical to evaluate the effect of methodologies and determine the optimal FCM protocol prior to estimating genome size of Primulina species. The present study was conducted to quantify the impact of different FCM methodologies on genome size measurement in Primulina. These include evaluating the performance of different nuclei extraction buffers, staining regimens, dark and cold conditions, and centrifugation during sample preparation. We quantitatively optimized a FCM methodology suitable for Primulina and validated the protocol's universality in several other genera of Gesneriaceae. Additionally, in the present study, we report the genome size of nine species of the Gesneriaceae family in China.
Materials and Methods
Plant Material
Eight Primulina species (P. linearifolia, P. huaijiensis, P. heterotricha, P. liguliformis, P. roseoalba, P. lunglinensis, P. hedyotidea, and P. subrhomboidea) with different phenotypic and ecological traits were selected to test the effects of FCM methodology. Because our preliminary survey revealed the 2C-value of the eight species ranged between 1.0 and 2.1 pg, Solanum lycopersicum cv. “Stupické polni rané” (2C = 1.96 pg, Doležel et al., 1992) was selected as an appropriate primary reference standard. Oryza sativa ssp. japonica (2C = 0.86–0.90 pg, Arumuganathan and Earle, 1991), whose 2C-value was further calibrated against S. lycopersicum (10 replicates on different days), was chosen as a secondary reference standard. The seeds of O. sativa ssp. japonica and S. lycopersicum were obtained from the South China Botanical Garden, the Chinese Academy of Sciences, and the Laboratory of Molecular Cytogenetics and Cytometry (Olomouc, Czech Republic), respectively. Seedlings of the references were grown and kept in greenhouses at the South China Botanical Garden.
Sample Preparation
We conducted preliminary analyses to determine the appropriate amount of sample required to produce sufficient nuclei counts and good-quality histograms. Approximately 20 mg of fresh tissue from the young leaves of samples and standards were used, respectively. Briefly, the sample and standard tissues were co-chopped in 1 ml of cold buffer on ice. A razor blade with a single edge was used for chopping each sample in a Petri dish as described by Galbraith et al. (1983). Samples were chopped quickly (approximately 45 s) but not intensely to minimize the release of cytosolic compounds. A 50-μm mesh filter was used to filter the resulting homogenate. RNase A (Sigma, Cream Ridge, USA) was added at a final concentration of 50 μg ml−1, PI (Sigma) was used according to the methodology outlined below, and samples were incubated in the dark and on ice.
Experimental Design
Testing the Presence of Endogenous Inhibitors
The Partec CyStain PI Absolute P kit (Partec GmbH, Münster, Germany) was used to test for a reduction in PI fluorescence of the reference standard by secondary metabolites in Primulina, given that it has been used in Gesneriaceae (Zaitlin and Pierce, 2010). Leaves of standard (S. lycopersicum or O. sativa ssp. japonica) were independently chopped and simultaneously processed (co-chopped) with leaves of Primulina. After staining, mean PI fluorescence was measured for standards independently and simultaneously processed, respectively. Three replicates were completed.
Buffer Screening
The effect of nuclei isolation buffer on genome size determination was tested for eight buffers across all eight species. In addition to the Partec CyStain PI Absolute P kit, seven buffers were selected from the 10 most-commonly used non-commercial FCM buffers Loureiro et al., 2007a,b. These buffers were de Laat's (de Laat and Blaas, 1984; modified as in Kron and Husband, 2009), Galbraith's (Galbraith et al., 1983), General Purpose (Loureiro et al., 2007a), LB01 (Doležel et al., 1989), MgSO4 (Arumuganathan and Earle, 1991), Tris-MgCl2 (Pfosser et al., 1995), and Woody Plant (Loureiro et al., 2007a). Four replicates of each species were analyzed with each buffer. PI was used at a concentration of 50 μg ml−1 for 20 min, according to protocol described by Price et al. (2000).
Determination of Staining Duration
Samples of P. linearifolia, P. huaijiensis, P. heterotricha, and P. liguliformis were randomly selected from the eight species to investigate the effect of staining duration. Buffer LB01 was chosen due to its relatively high-resolution performance during the buffer test. Each sample was examined using the following time course: 5, 10, 15, 20, 40, 60, and 120 min. Because each sample was analyzed seven times, we increased the tissue amount to 40 mg for samples and standards and the volume of isolation buffer to 2 ml. PI was used at 50 μg ml−1 and samples were incubated on ice between runs. The experiment was repeated three times for each species.
Determination of Stain Concentration
According to the results from the tests described above, the optimal conditions included LB01 buffer and staining duration of 40 min were then tested for any effect of stain concentration. The same four species as previously described were used. The PI concentrations examined included: 10, 25, 50, 100, 150, and 200 μg ml−1. Similarly, a larger volume of homogenate (2 ml) was needed to perform each analysis at the six different PI concentrations. Four replicates were analyzed for each species at each stain concentration.
Effect of Darkness and Centrifugation
The samples of the same four species were analyzed after incubation in the dark at 4°C for 24 h to check the possible effect of darkness on the quality of histograms. Alternatively, the homogenates were centrifuged at 500 × g for 10 min at 4°C to test the effect of centrifugation, according to the procedure used in Sinningia (Gesneriaceae) (Zaitlin and Pierce, 2010). After centrifugation, the supernatant was carefully decanted, and the pellet was gently re-suspended in 850 μl of new extraction buffer. Three replicates were tested for each species.
Flow Cytometric Analyses
Analysis of stained samples was performed on a Partec CyFlow Space (Partec, Münster, Germany) equipped with a 20-mW sapphire laser, a 25-mW solid-state laser, and a 50-mW UV-LED operating at 488, 638, and 365 nm, respectively, and the fluorescence intensity of 10,000 particles was recorded. Before each use, we calibrated the instrument using 3-μm calibration beads (Partec, Münster, Germany). The forward scatter (FSC), side scatter (SSC) and orange fluorescence (FL2: 590 nm ± 25) were measured for each sample. These parameters were visualized alone and in combined histograms as follows: FL2 vs. FSC, FL2 vs. SSC, and FSC vs. SSC.
The nuclei number and coefficient of variation (CV) were obtained for each peak of interest (sample and standard) using the gating function in the FloMax Software by Partec (Version 2.80, 2012). Polygon gates were drawn manually around regions of interest on the scattergram of PI fluorescence vs. side scatter to remove the interference of debris particles (Figure 1). To determine the fluorescence and CV of each peak, regions were developed around the histograms of interest (Figure 1). Although most of the genome size literatures recommend CV be set below 5% over 5000 or 10,000 nuclei analyzed, it was expected that some of the methodology used here would not produce optimal results. For each histogram, the nuclei count and CV for each peak of interest were used to calculate relative standard error (RSE) using the formula RSE = SE/mean, which can be calculated as peak CV%/ v(peak nuclei count), as described by Bainard et al. (2010). The ability to consider both the number of nuclei measured as well as the CV is especially helpful when data might otherwise be ignored due to low nuclei counts or high CV-values.
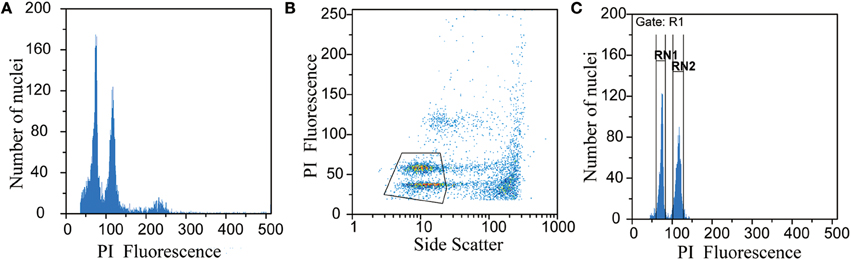
Figure 1. An example of the gating procedure using data from Primulina linearifolia. Ungated histogram (A), scatterplot with manually drawn polygon gate (B), histogram with polygon gate applied to remove debris and regions drawn to determine peak location and CV (C), gating procedure completed with FloMax Software (Partec Version 2.80, 2012).
The nuclear DNA content of Primulina was determined according to the following formula: Standard 2C-value (pg) = (Sample peak mean/Standard peak mean) * nuclear DNA content of the reference Standard (pg).
Statistical Analyses
Analysis of the buffer effect data was performed using a mixed model analysis of variance (ANOVA) with the buffer as the fixed variable and the data as the random variable. A mixed model ANOVA was used to identify the effect of the staining period, with time as fixed repeated variable. To analyze the stain concentration data, a general linear model was used with concentration as the fixed variable. Tukey's HSD post hoc test (P = 0.05) was added to evaluate the significance of the differences in means within each test and for each species. Model residuals were used to determine whether the underlying assumptions of homogeneity of variance and normality were met. Data analysis was performed using SPSS Version 3.1 (SPSS Inc., Chicago, IL, USA).
Testing the Optimized Methodology in Other Genera
After optimizing, we further tested the optimized methodology's universality in Gesneriaceae in South China Karst. We examined 32 populations from nine species that belong to four other genera, including Hemiboea, Lysionotus, Briggsia, and Aeschynanthus. Herbarium vouchers for these species have been deposited in the IBSC (South China Botanical Garden, CAS).
Results
Compounds in Primulina Leaves Inhibit PI-fluorescence
The inhibition tests indicated the ratio of the mean fluorescence of nuclei (Standard 1) from simultaneously processed standard (S. lycopersicum or O. sativa ssp. japonica) with Primulina leaves to the mean fluorescence of nuclei (Standard 2) from independently processed standards. These ratios ranged between 0.73 and 1.00 (Table S1, Figure 2). The reduced fluorescence of nuclei from simultaneously processed standards compared to the nuclei from independently processed standard leaves suggests the presence of endogenous inhibitors in Primulina. The fluorescence reduction occurred in seven out of eight Primulina species, with the exception being P. subrhomboidea. Moreover, the effects of inhibition differ among species, which is more apparent in P. liguliformis, P. huaijiensis, P. linearifolia, and P. heterotricha.
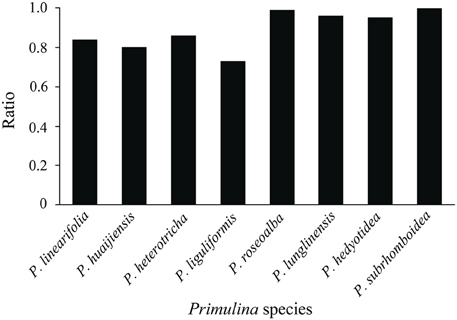
Figure 2. The ratio of the mean fluorescence of nuclei (Standard 1) from simultaneously processed standard (Solanum lycopersicum or Oryza sativa ssp. japonica) with Primulina leaves to the mean fluorescence of nuclei (Standard 2) from an independently processed standard using the Partec CyStain PI Absolute P kit.
Effect of Various Buffers on Genome Size Estimation
The buffers tested had a significant effect on the 2C-value in six out of the eight species analyzed (P < 0.05), with the exceptions being P. hedyotidea and P. subrhomboidea (Table 1). Although the absolute differences in DNA content were small (0.120–0.302 pg/2C), the largest percent differences ([maximum estimate - minimum estimate]/mean) were substantial. The values varied by 14.6% for P. linearifolia (MgSO4 and Galbraith's), 21.4% for P. huaijiensis (de Laat's and Partec), 15.9% for P. heterotricha (General purpose and de Laat's), 19.8% for P. liguliformis (Woody plant and General purpose), 14.9% for P. roseoalba (Woody plant and Tris-MgCl2), 9.2% for P. lunglinensis (Tris-MgCl2 and Galbraith's), 7.7% for P. hedyotidea (Galbraith's and MgSO4), and 6.83% for P. subrhomboidea (Woody plant buffer and MgSO4). The estimate patterns generated by various buffers was different across species, although both Partec and Woody plant buffer usually obtained estimates above the mean and MgSO4 and Galbraith's buffer tended to produce estimates below the mean. Buffers de Laat's, LB01, Tris-MgCl2 and General purpose produced estimates relatively close to the mean values across the analyzed species.
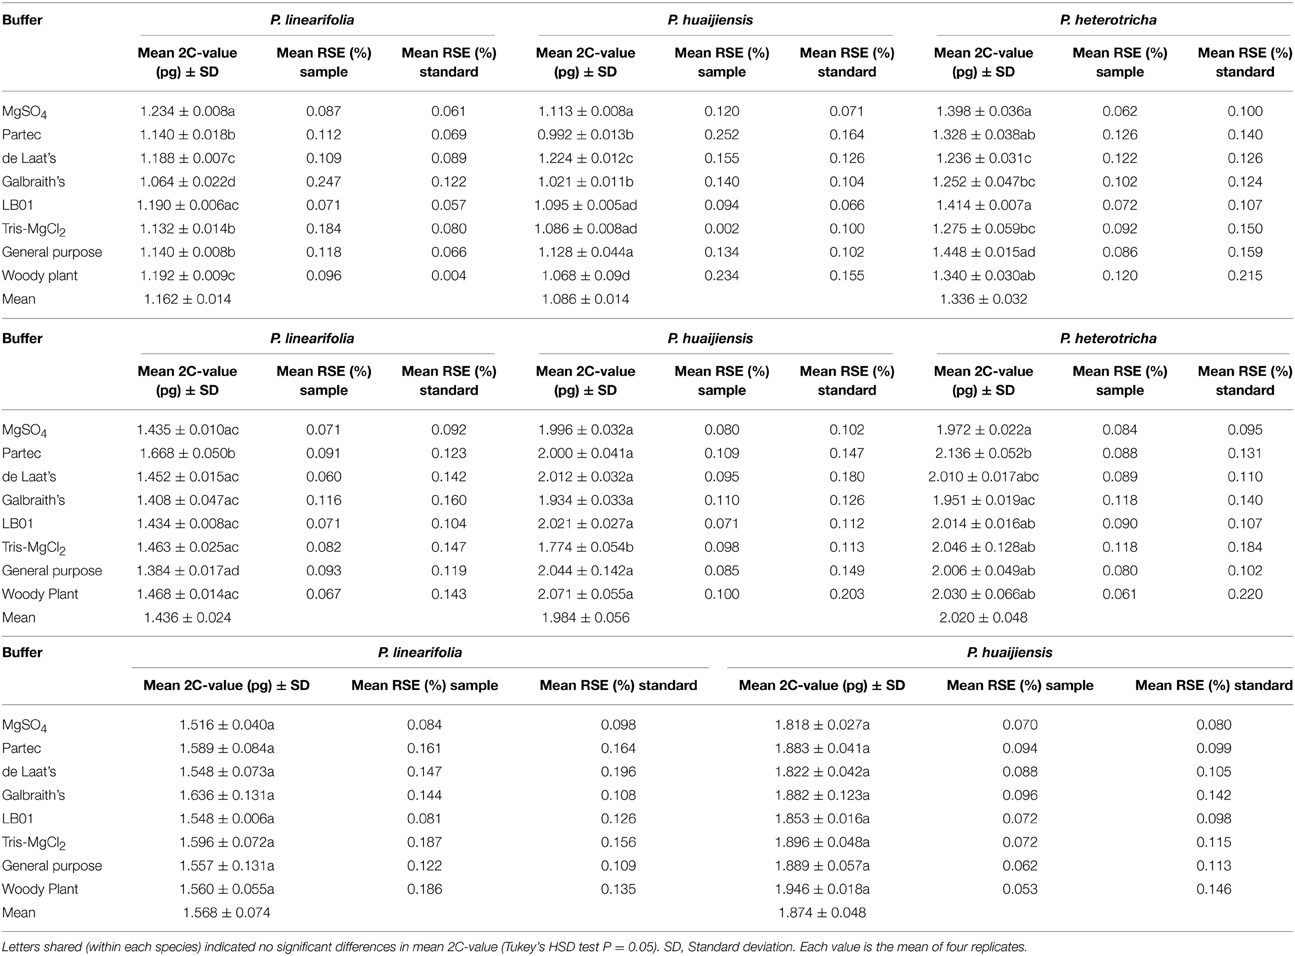
Table 1. Effect of various buffers on the 2C-value estimates of eight Primulina species.
The buffers used also produced variation in resolution for each of the eight species (Table 1, Figure 3). We used the SE of the mean 2C-value and RSE to measure quality. A small mean SE-value indicated high consistency within the 2C-value estimated over replicates, whereas the mean RSE reflected the quality of histograms (combining the CV-value and nuclei count obtained for each peak). MgSO4, de Laat's and LB01 buffers produced low mean SE estimates across species. Low CV and RSEs were consistently produced from MgSO4 and LB01 buffer (with sample RSE varying between 0.062 and 0.120% across species) (Table 1, Table S2). Woody plant buffer showed low RSE-values for most species, with the exception for P. hedyotidea (0.186%) and P. huaijiensis (0.234%). Partec, de Laat's, Galbraith's, and Tris-MgCl2 buffer produced relatively high RSE-values for the eight species (sample RSE ranging from 0.002 to 0.247%). Such effects on resolution of different buffers were also demonstrated by the scatterplots of SSC vs. PI fluorescence and FSC vs. PI fluorescence. Significantly larger amounts of debris were usually obtained from the buffers that produced poor-quality histograms. Histograms with less compact clusters of nuclei tended to appear with buffers that generated high RSEs, indicating that the buffer used affected the nuclei characteristics, such as relative size (FSC), relative surface complexity estimate (SSC), and the fluorescence (Figure S1).
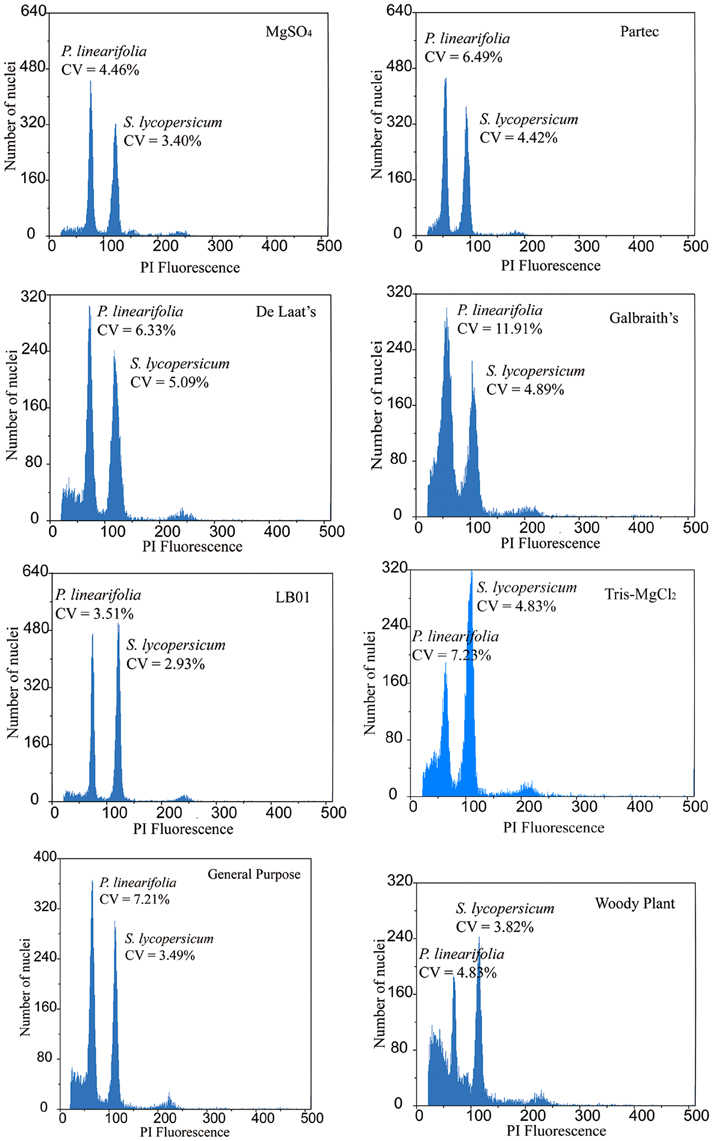
Figure 3. Ungated histograms showing the range of quality of Primulina linearifolia obtained with eight different buffers.
Effect of Staining Regimen on Genome Size Estimation
Our results showed that staining duration affected the relative fluorescence of both the sample and the standard but had a negligible effect on the 2C-value estimates. The 2C-value estimates of the analyzed taxa showed a maximum change of only 0.096 pg over 120 min, and the differences between estimates were not significant (Table 2). Histogram quality was better (lower RSE) at the 30 and 40 min staining periods than other periods, for all species. Stain concentration significantly affected the genome size estimate for P. linearifolia (P < 0.05) but not for P. huaijiensis, P. heterotricha or P. liguliformis (Table 3). The genome size estimates were generally low across species at PI concentrations of 10 and 25 μg ml−1. The largest difference in the 2C-value estimates for each species was 6.7% for P. linearifolia, 1.0% for P. huaijiensis, 4.5% for P. heterotricha, and 5.9% for P. liguliformis. The histogram quality varied with different staining concentrations. Generally, the moderate concentration of PI (100 μg ml−1) generated the best quality histograms (lowest RSE).
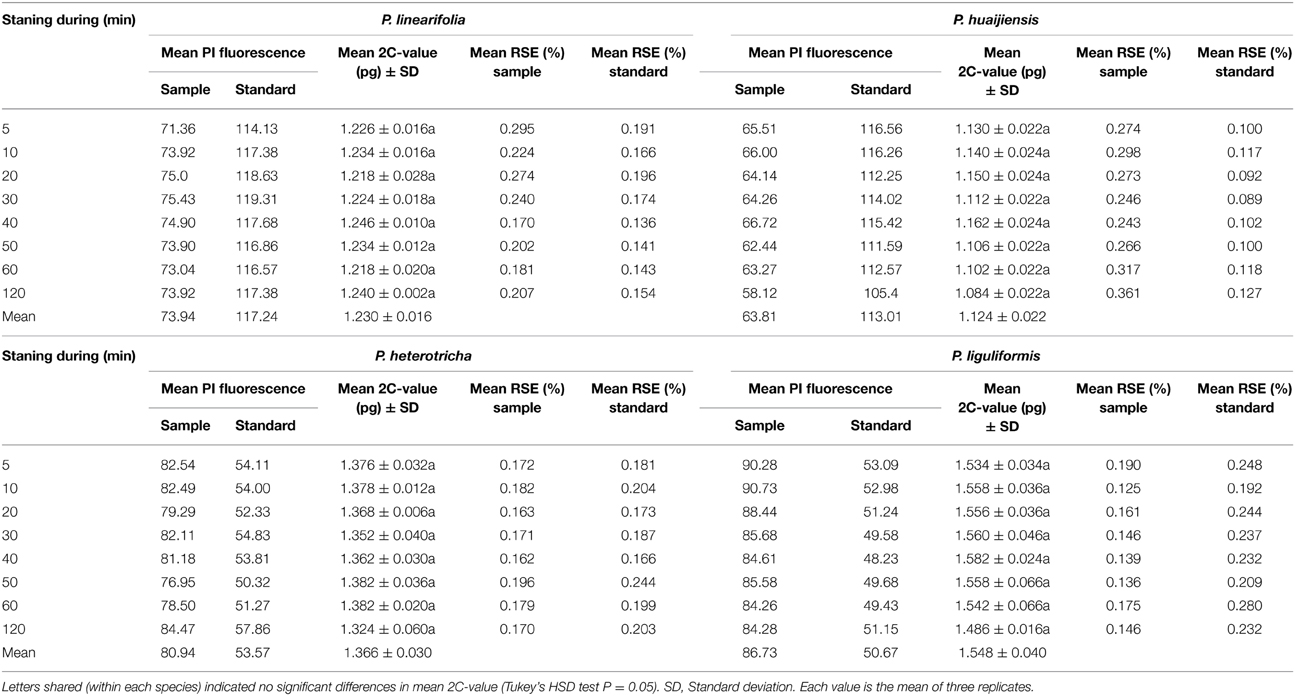
Table 2. The effect of propidium iodide (PI) staining duration on the 2C-value estimates of four Primulina species.
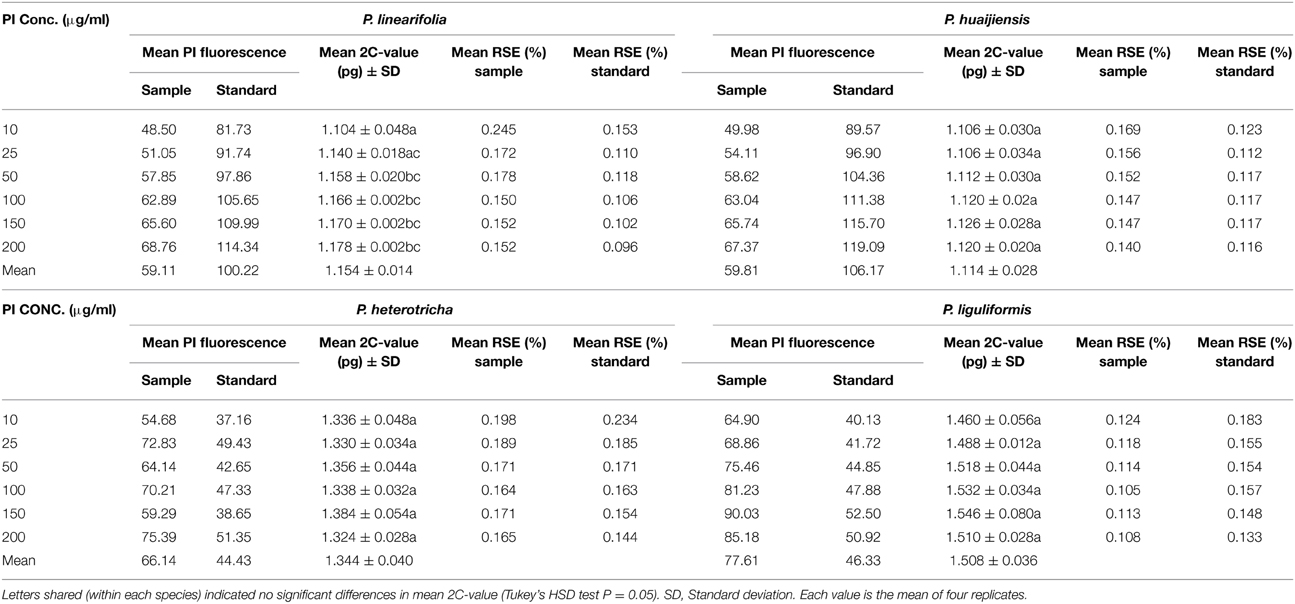
Table 3. The effect of propidium iodide (PI) concentration on the 2C-value estimates of four Primulina species.
Effect of Darkness and Centrifugation
Our results demonstrate that incubation in absolute dark at 4°C did not improve the quality of the histograms (Figure S2). Moreover, poor-quality histograms were obtained after centrifugation (data not shown).
Universality of the Optimized Methodology and New Genome Size Estimates
Our comparative tests showed that FCM methodology using LB01 buffer supplemented with 100 μg ml−1 PI and staining for 40 min yielded the best results for genome size measurement in Primulina. We further tested performance of this optimal FCM protocol in other genera of Gesneriaceae, and found that it was suitable for Hemiboea, Lysionotus, Briggsia, and Aeschynanthus, with the values of CV falling below 5% (Table 4). The results revealed up to a 1.67-fold 2C DNA amount difference between the smallest (H. gracilis; 1.62 pg) and the largest (L. pauciflorus; 2.71 pg) genomes, indicating substantial interspecific genome size variation in Gesneriaceae (Table 4, Figure S3). Specifically, the genome size of H. henryi was determined based on analysis of 39 individuals from 17 populations across the entire geographical distribution, thereby representing the extent and pattern of intraspecific nuclear DNA content variation in this species. Significant differences in the DNA amount were detected among populations (F = 4.5, P = 0.001), where the mean 2C-value varied between 1.63 and 2.48 pg (Table 4, Figure S3). Intraspecific genome size variation was also apparent in H. gracilis and L. pauciflorus, the genome size of which differed by 5.10 and 11.0%, respectively.
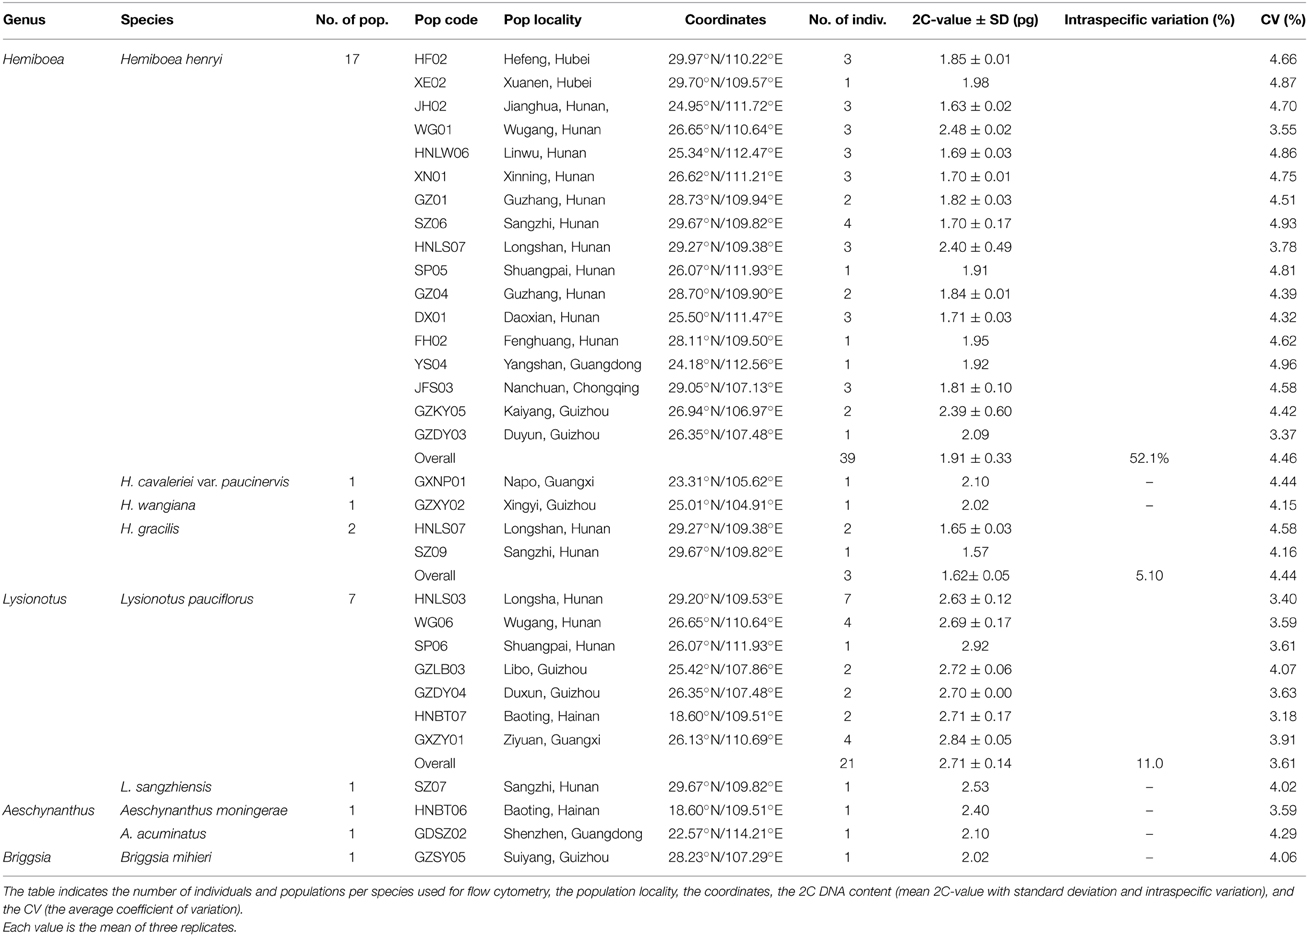
Table 4. Summary information of the nine species of Gesneriaceae included in this study.
Discussion
The Presence of PI Intercalation Inhibitors in Primulina
Phytochemical compounds are reported to decrease the fluorescence intensity of PI-stained nuclei and consequently lead to inaccurate results (Greilhuber et al., 2007; Bennett et al., 2008). Our results confirmed that the existence of secondary metabolites influence the FCM estimations in most Primulina species except P. subrhomboidea (Table S1, Figure 2). The difference in the effects of inhibitors in various species can be attributed to their distinct composition and proportion of phytochemical compounds. For example, the level and activity of DNA PI staining inhibitors in P. roseoalba, P. lunglinensi, and P. hedyotidea were significantly lower than those in P. liguliformis, P. huaijiensis, P. linearifolia, and P. heterotricha. The karst environment, characterized by low soil-water content, periodic water deficiency and poor nutrients, might have exerted strongly selective stress on plant species. Previous studies documented that increased biosynthesis of secondary metabolites can be induced by nutritional deficiency and abiotic stress, such as drought, high light, and low temperature (Steyn et al., 2002). Thus, karst environment might trigger the biosynthesis of secondary metabolites in most Primulina species. It should be noted that approximately 300 chemical compounds have been reported in Primulina or other Gesneriaceae species, including flavonoids, terpenes, and steroids, phenolic glucosides, simple phenolics (Verdan and Stefanello, 2012). However, the chemical nature of the compounds that inhibit DNA staining in the analyzed Primulina species is yet to be determined.
Significant Effect of Methodology on Genome Size Estimations in Primulina
The present study confirmed that cytosolic compounds can affect genome size estimations in Primulina, highlighting the need for optimizing FCM methodology in the genus and other plants. Although the staining regimen showed a negligible effect on the value of genome size estimates in Primulina, both PI concentration and staining duration influenced the quality of the histograms. Incubation in absolute dark at 4°C and centrifugation did not improve the quality of the histograms. However, our results showed that the combined processing of target and standard species reduces potential variability and improves accuracy in determining genome size. Nevertheless, combined processing did not eliminate the effect of inhibitors on DNA content estimation, as evidenced by the variation produced by different buffers.
Buffer choice accounted for up to 6.83–21.4% of the estimated genome size differences in Primulina and also affected the quality and consistency of data. Buffer choice also seriously impacted FSC and SSC profiles (reflecting the size and granularity of nuclei, respectively), indicating a significant influence of buffers on the consistency of the examined nuclei structural properties. The significant influence of buffer choice can be explained by the ability of different buffers to counteract the detrimental effect of endogenous fluorescence inhibitors (Loureiro et al., 2006, 2007a,b). Consistent with the results in Sinningia (Gesneriaceae) (Zaitlin and Pierce, 2010), the CV-values obtained with the Partec CyStain PI Absolute P kit varied from 4.4 to 15.67% across species (data not shown). Only two (P. lunglinensis and P. hedyotidea) of the eight species exhibited CV-values below 5%, suggesting that the Partec CyStain PI Absolute P kit was not a good choice for genome size studies in most Gesneriaceae species. On the contrary, the Partec, Laat's, Galbraith's, and Tris-MgCl2 buffers, generally produced histograms with the poorest quality and genome size estimates with the highest variability in most species. Woody plant buffer produced good-quality histograms but the obtained genome size appeared to be very different from the mean value and had a higher SE. Our results showed that LB01 was the best buffer for genome size estimation in Primulina, producing the best-quality histograms and consistent genome size estimates. LB01 contains β-mercaptoethanol, an antioxidant that could bind free radicals. Similarly, buffer MgSO4 generated high-quality histograms, which may be due to the presence of dithiothreitol (DTT), a typical reducing agent. The reducing function of these compounds probably counteracts the effect of endogenous fluorescence inhibitors, such as tannins or other phenolic compounds detected in Primulina (Verdan and Stefanello, 2012).
High Methodology Universality and Genome Size Variation Reports for Gesneriaceae
The low CV-values (< 5%) commonly detected in the four other genera of Gesneriaceae indicate the optimized methodology is highly universal for Primulina. These results will be helpful for genome size studies in this family. In fact, the optimized methodology has been used to obtain genome size of 101 Primulina species (Kang et al., 2014). We also report the genome size for nine species from the genera Hemiboea, Lysionotus, Briggsia, and Aeschynanthus, for the first time. The number of species and individuals analyzed for each genus depended on the sample availability. Similar to our findings in Primulina (2C = 1.12–2.54 pg), the genome sizes detected in these genera (2C = 1.62–2.71 pg) also fall into the very small category (1C = 1.4 pg), as defined by Soltis et al. (2003) and Leitch et al. (2005). Our results also indicate a substantial genome size variation both within and among species. Specifically, we found high intraspecific genome size variation (52.1%) in H. henryi. Given the extensive sampling across the species distribution range and the low CV-values obtained in our study, our estimates probably reflect real genome size variation among populations of H. henryi. Although genome size is considered more likely to be constant at the species level, intraspecific variation is increasingly detected in plant species (e.g., Duchoslav et al., 2013; Huang et al., 2013). Similarly, our studies in Primulina revealed as much as 41.23% intraspecific variation in P. linearifolia (Kang et al., 2014). Significant variations in genome size can be attributed to several sources, including variation in chromosome number or ploidy level or the amount of repetitive and non-coding DNA, which is considered the major mechanism responsible for changes in genome size (Bennetzen et al., 2005). Moreover, genome size variation could be a result of local adaptation along ecogeographic gradients (Kang et al., 2014; Jordan et al., 2015). H. henryi is one of the most widely distributed species of Gesneriaceae in China, which occurs in diverse habitats, including limestone karst and acidic soils. The complexity of selection patterns and variation in adaptation to environments among lineages may generate population-specific relationships; thus, the present study highlights the necessity for further research into detailed ecological or geographical factors to elucidate the evolutionary patterns of genome size in H. henryi. Nevertheless, considering the high intraspecific genome size variation observed in H. henryi, we suggest further taxonomic treatment for this species based on both molecular and morphological data in the future.
Conclusions
This study quantitatively evaluated FCM methodology effects on genome size estimation in the genus Primulina. Our results confirmed that the existence of secondary metabolites can affect genome size determination and highlighted the necessity of optimizing the FCM methodology prior to obtaining a reliable genome size for a given taxon.
Author Contributions
This study was conceived by MK and JW. Collection and identification of field material was performed by MK. Sample preparation, nuclei isolation, and flow cytometry analyses were performed by JW and JL. Data analysis was conducted by JW. JW and MK wrote the paper. All authors read and approved the final manuscript.
Conflict of Interest Statement
The authors declare that the research was conducted in the absence of any commercial or financial relationships that could be construed as a potential conflict of interest.
Acknowledgments
This research was supported by National Natural Sciences Foundation of China (31370366). The authors gratefully thank Dr. Jianjun Chen for contacting the Laboratory of Molecular Cytogenetics and Cytometry (Olomouc, Czech Republic) for Solanum lycopersicum seeds, Wei Liu and Junlin Chen for providing seeds of Oryza sativa ssp. Japonica, Guofeng Li for help with sample collection, Junjie Tao and Qingwen Qi for help with experiments.
Supplementary Material
The Supplementary Material for this article can be found online at: http://journal.frontiersin.org/article/10.3389/fpls.2015.00354/abstract
Abbreviations
CV, coefficient of variation; FCM, flow cytometry; PI, propidium iodide.
References
APG III. (2009). An update of the angiosperm phylogeny group classification for the orders and families of flowering plants: APG III. Bot. J. Linn. Soc. 161, 105–121. doi: 10.1111/j.1095-8339.2009.00996.x
Arumuganathan, K., and Earle, E. D. (1991). Estimation of nuclear DNA content of plants by flow cytometry. Plant Mol. Biol. Rep. 9, 229–233. doi: 10.1007/BF02672073
Bainard, J. D., Fazekas, A. J., and Newmaster, S. G. (2010). Methodology significantly affects genome size estimates: quantitative evidence using bryophytes. Cytometry A 77A, 725–732. doi: 10.1002/cyto.a.20902
Beaulieu, J. M., Leitch, I. J., Patel, S., Pendharkar, A., and Knight, C. A. (2008). Genome size is a strong predictor of cell size and stomatal density in gangiosperms. New Phytol. 179, 975–986. doi: 10.1111/j.1469-8137.2008.02528.x
Bennett, M. D., and Leitch, I. J. (2005). Plant genome size research: a field in focus. Ann. Bot. 95, 1–6. doi: 10.1093/aob/mci001
Bennett, M. D., and Leitch, I. J. (2011). Nuclear DNA amounts in angiosperms: targets, trends and tomorrow. Ann. Bot. 107, 467–590. doi: 10.1093/aob/mcq258
Bennett, M. D., and Leitch, I. J. (2012). Plant DNA C-Values Database (Release 8.0). Available online at: http://www.kew.org/cvalues/
Bennett, M. D., Price, H. J., and Johnston, J. S. (2008). Anthocyanin inhibits propidium iodide DNA fluorescence in Euphorbia pulcherrima: implications for genome size variation and flow cytometry. Ann. Bot. 101, 777–790. doi: 10.1093/aob/mcm303
Bennetzen, J. L., Ma, J., and Devos, K. M. (2005). Mechanisms of recent genome size variation in flowering plants. Ann. Bot. 95, 127–132. doi: 10.1093/aob/mci008
Cires, E., Cuesta, C., Casado, M.Á. F., Nava, H. S., Vázquez, V. M., and Prieto, J. A. F. (2011). Isolation of plant nuclei suitable for flow cytometry from species with extremely mucilaginous compounds: an example in the genus Viola L. (Violaceae). An. Jar. Bot. Madr. 68, 139–154. doi: 10.3989/ajbm.2273
de Laat, A. M. M., and Blaas, J. (1984). Flow-cytometric characterization and sorting of plant chromosomes. Theor. Appl. Genet. 67, 463–467. doi: 10.1007/BF00263414
Doležel, J., and Bartoš, J. (2005). Plant DNA flow cytometry and estimation of nuclear genome size. Ann. Bot. 95, 99–110. doi: 10.1093/aob/mci005
Doležel, J., Binarová, P., and Lucretti, S. (1989). Analysis of nuclear DNA content in plant cells by flow cytometry. Biol. Plant. 31, 113–120. doi: 10.1007/BF02907241
Doležel, J., Greilhuber, J., and Suda, J. (2007). Estimation of nuclear DNA content in plants using flow cytometry. Nat. Protoc. 2, 2233–2244. doi: 10.1038/nprot.2007.310
Doležel, J., Sgorbati, S., and Lucretti, S. (1992). Comparison of three DNA fluorochromes for flow cytometric estimation of nuclear DNA content in plants. Physiol. Plantarum 85, 625–631. doi: 10.1111/j.1399-3054.1992.tb04764.x
Duchoslav, M., Šafáová, L., and Jandová, M. (2013). Role of adaptive and non-adaptive mechanisms forming complex patterns of genome size variation in six cytotypes of polyploid Allium oleraceum (Amaryllidaceae) on a continental scale. Ann. Bot. 111, 419–431. doi: 10.1093/aob/mcs297
Fleischmann, A., Michael, T. P., Rivadavia, F., Sousa, A., Wang, W., Temsch, E. M., et al. (2014). Evolution of genome size and chromosome number in the carnivorous plant genus Genlisea (Lentibulariaceae), with a new estimate of the minimum genome size in angiosperms. Ann. Bot. 114, 1651–1663. doi: 10.1093/aob/mcu189
Galbraith, D. W., Harkings, K. R., Maddox, J. M., Ayres, N. M., Sharma, D. P., and Firoozabady, E. (1983). Rapid flow cytometric analysis of the cell cycle in intact plant tissues. Science 220, 1049–1051. doi: 10.1126/science.220.4601.1049
Greilhuber, J., and Leitch, I. J. (2013). “Genome size and the phenotype,” in Plant Genome Diversity, Vol 2. Physical Structure, Behaviour and Evolution of Plant Genomes, eds I. J. Leitch, J. Greilhuber, J. Doležel, and J. F. Wendel (Vienna: Springer Verlag), 323–344.
Greilhuber, J., Temsch, E., and Loureiro, J. (2007). “Nuclear DNA content measurement,” in Flow Cytometry with Plant Cells, eds J. Doležel, J. Greilhuber, and J. Suda (Weinheim: WILEYVCH Verlag), 67–101.
Huang, H., Tong, Y., Zhang, Q. J., and Gao, L. Z. (2013). Genome size variation among and within Camellia species by using flow cytometric analysis. PloS ONE 8:e64981. doi: 10.1371/journal.pone.0064981
Jordan, G. J., Carpenter, R. J., Koutoulis, A., Price, A., and Brodribb, T. J. (2015). Environmental adaptation in stomatal size independent of the effects of genome size. New Phytol. 205, 608–617. doi: 10.1111/nph.13076
Kang, M., Tao, J. J., Wang, J., Ren, C., Qi, Q. W., Xiang, Q. Y., et al. (2014). Adaptive and nonadaptive genome size evolution in Karst endemic flora of China. New Phytol. 202, 1371–1381. doi: 10.1111/nph.12726
Kron, P., and Husband, B. C. (2009). Hybridization and the reproductive pathways mediating gene flow between native Malus coronaria and domestic apple, M. domestica. Botany 87, 864–874. doi: 10.1139/B09-045
Leitch, I. J., Soltis, D. E., Soltis, P. S., and Bennett, M. D. (2005). Evolution of DNA amounts across land plant (Embryophyta). Ann. Bot. 95, 207–217. doi: 10.1093/aob/mci014
Loureiro, J., Rodriguez, E., Doležel, J., and Santos, C. (2006). Comparison of four nuclear isolation buffers for plant DNA flow cytometry. Ann. Bot. 98, 679–689. doi: 10.1093/aob/mcl141
Loureiro, J., Rodriguez, E., Doležel, J., and Santos, C. (2007a). Two new nuclear isolation buffers for plant DNA flow cytometry – a test with 37 species. Ann. Bot. 100, 875–888. doi: 10.1093/aob/mcm152
Loureiro, J., Suda, J., Doležel, J., and Santos, C. (2007b). “Flower: a plant DNA flow cytometry database,” in Flow Cytometry with Plant Cells, eds J. Doležel, J. Greilhuber, and J. Suda (Weinheim: WILEY-VCH Verlag), 423–438.
Noirot, M., Barre, P., Duperrey, C., Hamon, S., and de Kochko, A. (2005). Investigating the causes of stoichiometric error in genome size estimation using heat experiments: consequences on data interpretation. Ann. Bot. 95, 111–118. doi: 10.1093/aob/mci006
Pellicer, J., Fay, M. F., and Leitch, I. J. (2010). The largest eukaryotic genome of them all? Bot. J. Linn. Soc. 164, 10–15. doi: 10.1111/j.1095-8339.2010.01072.x
Pfosser, M., Amon, A., Lelley, T., and Heberle-Bors, E. (1995). Evaluation of sensitivity of flow cytometry in detecting aneuploidy in wheat using disomic and ditelosomic wheat-rye addition lines. Cytometry 21, 387–393. doi: 10.1002/cyto.990210412
Price, H. J., Hodnett, G., and Johnston, J. S. (2000). Sunflower (Helianthus annuus) leaves contain compounds that reduce nuclear propidium iodide fluorescence. Ann. Bot. 86, 929–934. doi: 10.1006/anbo.2000.1255
Soltis, D. E., Soltis, P. S., Bennett, M. D., and Leitch, I. J. (2003). Evolution of genome size in the angiosperms. Am. J. Bot. 90, 1596–1603. doi: 10.3732/ajb.90.11.1596
Steyn, W. J., Wand, S. J. E., Holcroft, D. M., and Jacobs, G. (2002). Anthocyanins in vegetal tissues: a proposed unified function in photoprotection. New Phytol. 155, 349–361. doi: 10.1046/j.1469-8137.2002.00482.x
Verdan, M. H., and Stefanello, M. E. A. (2012). Secondary metabolites and biological properties of Gesneriaceae species. Chem. Biodivers. 9, 2701–2731. doi: 10.1002/cbdv.201100246
Veselý, P., Bureš, P., Šmarda, P., and Pavlíèek, T. (2012). Genome size and DNA base composition of geophytes: the mirror of phenology and ecology? Ann. Bot. 109, 65–75. doi: 10.1093/aob/mcr267
Wang, Y. Z., Mao, R. B., Liu, Y., Li, J. M., Dong, Y., Li, Z. Y., et al. (2011). Phylogenetic reconstruction of Chirita and allies (Gesneriaceae) with taxonomic treatments. J. Syst. Evol. 49, 50–64. doi: 10.1111/j.1759-6831.2010.00113.x
Weber, A., Middleton, D. J., Forrest, A., Kiew, R., Lim, C., Rafidah, A. R., et al. (2011). Molecular systematics and remodelling of Chirita and associated genera (Gesneriaceae). Taxon 60, 767–790.
Keywords: flow cytometry, genome size, Gesneriaceae, methodology, Primulina
Citation: Wang J, Liu J and Kang M (2015) Quantitative testing of the methodology for genome size estimation in plants using flow cytometry: a case study of the Primulina genus. Front. Plant Sci. 6:354. doi: 10.3389/fpls.2015.00354
Received: 11 February 2015; Accepted: 04 May 2015;
Published: 19 May 2015.
Edited by:
Tiegang Lu, Chinese Academy of Agricultural Sciences, ChinaReviewed by:
Jaroslav Doležel, Institute of Experimental Botany, Czech RepublicXun Xu, Beijing Genomics Institute - Shenzhen, China
Copyright © 2015 Wang, Liu and Kang. This is an open-access article distributed under the terms of the Creative Commons Attribution License (CC BY). The use, distribution or reproduction in other forums is permitted, provided the original author(s) or licensor are credited and that the original publication in this journal is cited, in accordance with accepted academic practice. No use, distribution or reproduction is permitted which does not comply with these terms.
*Correspondence: Ming Kang, Key Laboratory of Plant Resources Conservation and Sustainable Utilization, South China Botanical Garden, Chinese Academy of Sciences, Xingke Rd. 723, Guangzhou, Guangdong 510650, China,bWluZ2thbmdAc2NiZy5hYy5jbg==