 Meizhen Wang
 Shanfa Lu
- Medicinal Plant Cultivation Research Center, Institute of Medicinal Plant Development, Beijing, China
Reverse transcription-qPCR (RT-qPCR) has become a popular method for gene expression studies. Its results require data normalization by housekeeping genes. No single gene is proved to be stably expressed under all experimental conditions. Therefore, systematic evaluation of reference genes is necessary. With the aim to identify optimum reference genes for RT-qPCR analysis of gene expression in different tissues of Panax ginseng and the seedlings grown under heat stress, we investigated the expression stability of eight candidate reference genes, including elongation factor 1-beta (EF1-β), elongation factor 1-gamma (EF1-γ), eukaryotic translation initiation factor 3G1 (IF3G1), eukaryotic translation initiation factor 3B (IF3B), actin (ACT), actin11 (ACT11), glyceraldehyde-3-phosphate dehydrogenase (GAPDH), and cyclophilin ABH-like protein (CYC), using four widely used computational programs: geNorm, Normfinder, BestKeeper, and the comparative ΔCt method. The results were then integrated using the web-based tool RefFinder. As a result, EF1-γ, IF3G1, and EF1-β were the three most stable genes in different tissues of P. ginseng, while IF3G1, ACT11, and GAPDH were the top three-ranked genes in seedlings treated with heat. Using three better reference genes alone or in combination as internal control, we examined the expression profiles of MAR, a multiple function-associated mRNA-like non-coding RNA (mlncRNA) in P. ginseng. Taken together, we recommended EF1-γ/IF3G1 and IF3G1/ACT11 as the suitable pair of reference genes for RT-qPCR analysis of gene expression in different tissues of P. ginseng and the seedlings grown under heat stress, respectively. The results serve as a foundation for future studies on P. ginseng functional genomics.
Introduction
Real-time quantitative reverse-transcriptase polymerase chain reaction (RT-qPCR) has been widely used as a powerful technique to determine gene expression levels, due to its high sensitivity, specificity and reproducibility (Bustin, 2002; Derveaux et al., 2010). It must be noted that the accuracy of RT-qPCR results strongly depends on the stability of reference gene(s) used for data normalization. In plants, several reference genes, such as those encoding actins, ubiquitins, and rRNAs, are commonly used to standardize the semi-quantitative RT-PCR or RT-qPCR data (Guénin et al., 2009). In many cases, unfortunately, these reference genes were merely putatively housekeeping. They may be stable under some experimental conditions, but show a significant variance in other cases (Guénin et al., 2009). For example, 18S rRNA showed the most stable expression in rice under various abiotic stresses, but not in different rice tissues tested (Jain et al., 2006). Therefore, it is requisite to determine suitable reference genes under specific experimental conditions before gene expression studies (Gutierrez et al., 2008; Guénin et al., 2009).
Panax ginseng C.A. Meyer is a perennial medicinal plant native to Asian. It is a member of the Araliaceae family and has been served as one of the most well-known herbs worldwide for human health improvement (Shibata, 2001). Triterpene saponins, named ginsenosides, are the main bioactive components in P. ginseng. It accounts for >4% of ginseng root dry weight (Shibata, 2001). Cultivation of ginseng is difficult due to long growth period (4–6 years), diseases, and special growth condition requirements, which makes P. ginseng mainly distributed in the northeast region of China. Large-scale cultivation of ginseng in Beijing is not successful yet. Ginseng growth has a strong correlation with the temperature. The growth rate of ginseng reaches a peak at 18°C and then declines with the temperature increases (Bi, 1985). Additionally, the highest ginseng yield occurs when the average temperature is 21°C in July, the hottest month in Liaoning province, China (Bi, 1985). Therefore, elucidation of the molecular mechanism of P. ginseng response to high temperature is of great importance and will foster the molecular breeding of heat resistant ginseng.
Next generation sequencing (NGS) technology has triggered P. ginseng molecular research, although it is still lagged far behind that of other crops, such as rice. Because of its complexity, the whole genome of P. ginseng has not been decoded. The chloroplast genomes of one Korean (Panax schinseng Nees) and four Chinese (Damaya, Ermaya, Gaolishen, and Yeshanshen) ginseng cultivars have been sequenced and comparatively analyzed (Kim and Lee, 2004; Zhao et al., 2015). To date, 17,773 P. ginseng expressed sequence tags (ESTs) have been deposited in the EST database at the National Center for Biotechnology Information (NCBI; February13, 2015). Several ginsenoside biosynthesis-related genes have been characterized. It includes squalene synthase gene PgSS1 (Lee et al., 2004), squalene epoxidase gene PgSQE1 (Han et al., 2010), dammarenediol synthase gene DDS (Han et al., 2006), dammarenediol 12-hydroxylase gene CYP716A47 (Han et al., 2011), and protopanaxadiol 6-hydroxylase gene CYP716A53v2 (Han et al., 2012). Many other candidate genes involved in ginsenoside biosynthesis were also identified by RNA-seq analysis of adventitious roots in two P. ginseng cultivars, Chunpoong and Cheongsun (Jayakodi et al., 2014). Additionally, a systematic identification of mRNA-like non-coding RNAs (mlncRNAs) in P. ginseng was performed, and a mlncRNA MAR probably involved in multiple metabolic pathways was characterized (Wang et al., 2015). These results provide the basis for a deeper insight into P. ginseng metabolic pathways. However, studies on the mechanism of P. ginseng response to heat stress have not been reported, with the exception of several heat-responsive miRNAs were identified (Wu et al., 2012).
MAR is accumulated to a much higher level in 4-year-old P. ginseng roots than that in 1-year-old roots. Hence, it is assumed to be associated with ginsenoside biosynthesis (Luo et al., 2003). Our recent study indicates that MAR is a long non-coding RNA, and it might be involved in multiple metabolic pathways through siRNA-dependent mechanisms (Wang et al., 2015). Tissue specific expression of MAR had been analyzed using the traditional reference gene GAPDH as internal control. It shows the highest expression in flower, followed by leaves, stems, roots, calli, and the least in adventitious roots. It is also induced by methyl jasmonate (MeJA; Wang et al., 2015).
Here, we evaluated the stability of eight candidate reference genes to identify the most suitable reference genes for RT-qPCR data normalization in two sets of P. ginseng samples, including different tissues and seedlings subjected to heat stress. Further, the expression patterns of our previously characterized MAR gene (Wang et al., 2015) in these samples were compared using three better reference genes alone or in combination as internal control. The optimum pairs of internal control genes were identified. It provides important basis for further studies on gene functions of P. ginseng in response to heat stress.
Materials and Methods
Plant Materials
P. ginseng C.A. Meyer cv. Shizhu, grown in a field nursery at Kuandian, Liaoning province, China, was used in this study.
The expression stability of putative reference genes was analyzed in two conditions: (1) among samples from different tissues (DT); (2) among samples from seedlings with or without heat treatment (SH). Group DT contains leaves, stems, flowers, roots collected from 5-year-old ginseng plants and embryogenic calli. Embryogenic calli were induced as described (Wu et al., 2012). Firstly, P. ginseng seeds were stratified in humidified sand for about 6 months at 10°C. After removing the pericarp, seeds were immersed in 70% ethanol for 30 s, and then transferred to 2% sodium hypochlorite for 30 min. Decontaminated seeds were rinsed three times in sterile distilled water. After that, cotyledon explants were dissected out and cultured on MS media supplemented with 1.0 mg/L 2,4-D for one month in the dark at 25–26°C. Embryogenic calli were then subcultured by regular 3-week intervals and cultured at 25–26°C under a 16/8-h (light/dark) photoperiod (24 mmol.m−2.s−1). All the tissues were frozen immediately in liquid nitrogen for total RNA extraction after collection.
Group SH contains ginseng seedlings with or without heat stress treatment. Seeds were sterilized as mentioned above and sowed in plastic pots containing nutrient soil and vermiculite mixed at 1:1 (v/v). After germination, the seedlings were grown in a climate controlled chamber with temperature at 25–26°C, humidity at 60–70%, and 16-h light/8-h darkness. For heat treatment, 1-month-old seedlings grown in 12 pots, with 30 ones per pot, were used. One half was grown under the same conditions with the exception of at 25–26°C for 6 (S6) or 12 h (S12). The other half was incubated at 37°C, at which the ginseng growth is inhibited but not lethal, for 6 (SH6) or 12 h (SH12). After treatment, the seedlings were collected and immediately stored in liquid nitrogen until use.
No specific permissions were required for the location of the field nursery. No endangered or protected species were involved in described field studies.
Total RNA Isolation, Quality Control, and First cDNA Synthesis
Total RNA was extracted using Trizol reagent (Invitrogen, Carlsbad, USA) following the manufacturer's protocol, and then treated with RNase-free DNase I (TaKaRa, Shiga, Japan) for genomic DNA contamination removal.
RNA samples isolated were analyzed by 0.8% agarose gel electrophoresis, showing only the two rRNA subunits (28S and 18S) with no indication of RNA degradation (Figure S1A). Then, they were evaluated with a NanoDrop-2000C spectrophotometer (Thermo Scientific, Wilmington, DE) for concentration, quantity, and purity. All samples showed an absorbance ratio at 260/280 nm ranged from 2.02 to 2.10, reflecting pure and protein-free isolated RNA (Figure S1B). The four RNA samples from control and heat stressed seedlings (S6, S12, SH6, and SH12) were further examined using the Agilent 2100 Bioanalyzer (Agilent Technologies, Palo Alto, CA) with RIN values of above 8.0 (Figure S1C).
About 5 μg high-quality total RNA was reverse-transcribed into single-strand cDNA in a 20 μL reaction mix with SuperScript III Reverse Transcriptase (Invitrogen, Carlsbad, USA) and 50 ng random hexamers, and immediately stored at −20°C until use.
Candidate Reference Gene Selection, Primer Design, and RT-qPCR
To identify potential ginseng homologs of Arabidopsis genes commonly used as internal controls for gene expression, we searched ginseng assembled transcriptome database using Blastx with an E = 10−5. Eight candidates with near or longer than 500 bp in length were selected for further analysis. Sequence alignment was performed by T-coffee (Notredame et al., 2000). Specific primers pairs were designed for each candidate reference gene with Primer 3.0 software (version 0.4.0; http://bioinfo.ut.ee/primer3-0.4.0/). Primer pairs were designed as follows: primer length of 25 bp, product length of 150–250 bp, optimal Tm at 60°C, GC% between 40 and 60%. For the PCR efficiency analysis, equal amount of each cDNA sample was pooled. Then, standard curves were determined by using five-fold dilution series of pooled cDNA as a template using the linear regression model (Pfaffl et al., 2004). The efficiency was calculated by CFX Manager™ software in a Bio-Rad CFX96 Real-Time PCR System C1000 Thermal Cycler (Bio-Rad, Hercules, CA).
RT-qPCR amplification was carried out on the Bio-Rad CFX96 Real-Time PCR System C1000 Thermal Cycler (Bio-Rad, Hercules, CA) in triplicates. Reaction mixture (20 μL) contains 100 ng cDNA as a template, 10 μL 2X SYBR Premix Ex Taq II (TaKaRa, Shiga, Japan), 0.5 μM each specific forward and reverse primer (Table 1). The reaction condition was as follows: 95°C for 30 s, 35 cycles of 95°C for 10 s, 60°C for 10 s, and 72°C for 10 s.
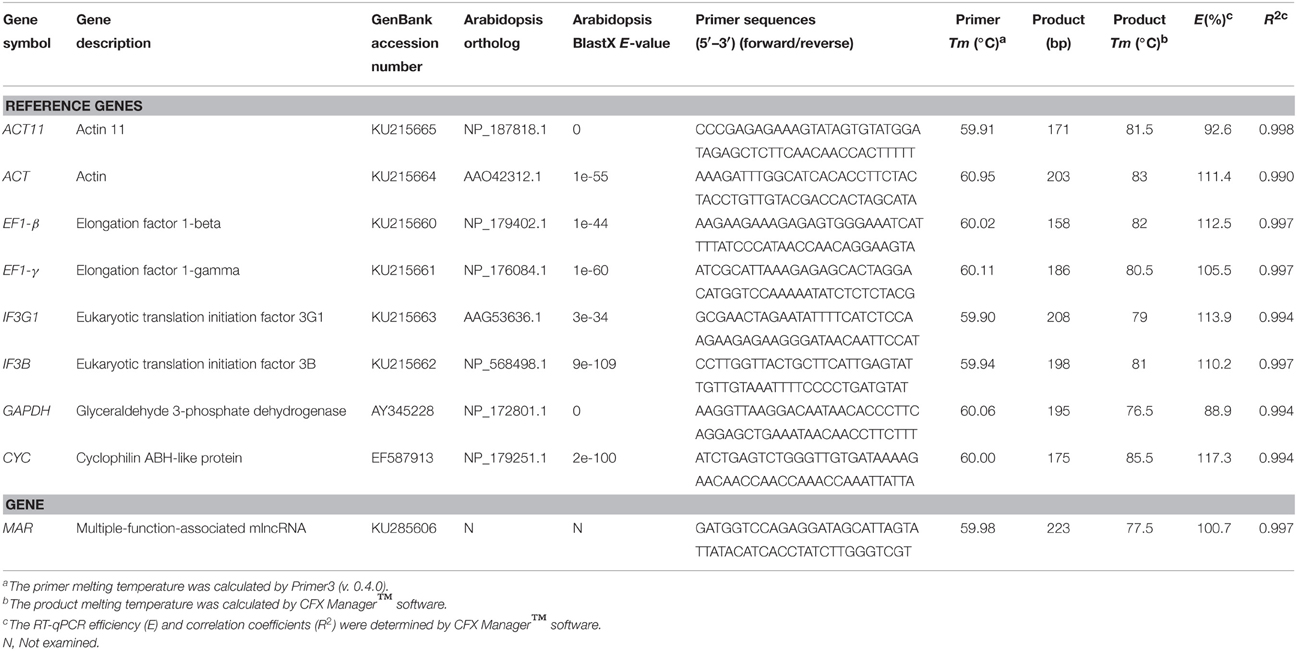
Table 1. Description of candidate reference genes and MAR in P. ginseng.
Analysis of Stability of Candidate Reference Genes
The Ct-values generated by the CFX Manager™ software were used to analyze the gene expression levels. Four algorithms were used to evaluate the stability of the eight candidate reference genes: geNorm (Vandesompele et al., 2002), NormFinder (Andersen et al., 2004), BestKeeper (Pfaffl et al., 2004), and the comparative ΔCt method (Silver et al., 2006). RefFinder (http://www.leonxie.com/referencegene.php?type=reference) was used to compare and integrate the ranking the tested candidate reference genes.
Validation of Reference Genes
To validate the reliability of the reference genes, the expression levels of a mlncRNA gene MAR (Wang et al., 2015) was analyzed using the top three ranking reference genes, as recommended by RefFinder, alone or with a combination for data normalization. By comparison, the least stable reference genes were also used. The relative expression of MAR was calculated using the 2−ΔΔCq method (Livak and Schmittgen, 2001).
Results
Selection of Candidate Reference Genes in P. ginseng
A total of nine RNA samples, which were divided into two groups (DT and SH), were used to evaluate the stability of reference gene expression. Group DT contains four samples extracted from roots, stems, leaves and flowers of 5-year-old P. ginseng plants, and one from embryogenic calli of P. ginseng. Group SH includes four samples from one-month-old P. ginseng seedlings treated with (SH6 and SH12) or without (S6 and S12) high temperature stress for 6 and 12 h. Based on Blastx alignment of P. ginseng ESTs (Wu et al., 2012) against Arabidopsis genes, eight candidate reference genes of P. ginseng were evaluated (Table 1). It includes genes encoding elongation factor 1-beta (EF1-β), elongation factor 1-gamma (EF1-γ), eukaryotic translation initiation factor 3G1 (IF3G1), eukaryotic translation initiation factor 3B (IF3B) (Figure S2), actin (ACT), actin11 (ACT11) (Figure S3), glyceraldehyde-3-phosphate dehydrogenase (GAPDH), and cyclophilin ABH-like protein (CYC). Among them, ACT and ACT11 share 46.74% nucleotide sequence identity (Figure S3). RT-qPCR primers were designed in low sequence identity regions. The sizes of all PCR products were from 158 to 223 bp (Table 1).
Amplification Efficiency and Specificity
High RT-qPCR amplification efficiency is usually correlated with the robust and precise results of gene expression assays (Bustin et al., 2009). The Tm for all PCR products ranged from 76.5°C (GAPDH) to 85.5°C (CYC), which was in the range expected based on their length and the CG composition. The efficiency (E) for the eight candidate reference genes varied from 88.9% (GAPDH) to 117.3% (CYC) (Table 1). The amplification specificity of each candidate reference gene was verified by agarose gel electrophoresis of the products of PCR using pooled cDNA as a template. The results showed only one single band with expected size (Figure 1A). Gene-specific amplification of each gene was also confirmed by single peak in the melting curve generated during RT-qPCR (Figure 1B). No signal was detected in the reverse transcription negative control and the non-template control. Considering the high sequence similarity of ACT and ACT11 (Figure S3), the PCR products using each primer pair were cloned and sequenced, respectively. As a result, all the 48 randomly picked amplicons of each gene are specific even though there are only four mismatches in the primers, confirming the high specificity. These results suggest that the designed primers are suitable for RT-qPCR analysis of gene expression.
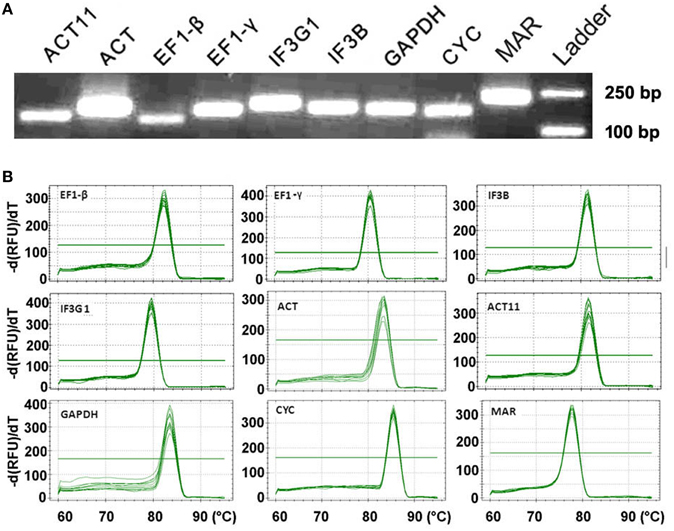
Figure 1. RT-qPCR amplification specificity. (A) Amplified fragments of eight candidate genes and target gene MAR. Agarose gel (3%) electrophoresis shows the specific PCR product with expected size for each gene. Equivalent cDNA of all nine samples was pooled and used as a template. The 250 and 100 bp DNA ladders were shown. (B) Melting curves for eight candidate reference genes and MAR with single peak. Equivalent cDNA of all nine samples was pooled and used as a template. Temperature is displayed in the x axis, and the derivative reporter signal is displayed in the y axis.
Expression Profiling of Candidate Reference Genes
The expression levels of eight tested candidate reference genes were determined using the threshold cycle (Ct)-values. The results showed that ACT11 and IF3G1 were the lowest expressed genes, with the highest mean Ct-values of 32.35 and 28.50 in DT and SH samples of P. ginseng, respectively. GAPDH, showing the lowest Ct-values of 23.30 in DT and 22.41 in SH, was the highest expressed gene in all tissues tested (Figure 2). Although each candidate reference gene showed expression variation in DT, ACT11 displayed unacceptably high expression variation as shown in box-plots, where the boxes and whiskers of ACT11 were the biggest among all tested candidate reference genes (Figure 2A). It suggests that ACT11, a most commonly used traditional housekeeping gene, is not suitable to be used as an internal control in RT-qPCR analysis of gene expression in given different tissues of P. ginseng. Similar results were also observed in rice (Jain et al., 2006). For SH samples, both ACT and EF1-β exhibited larger fluctuation than the other tested reference genes (Figure 2B), suggesting their instability in the samples tested.
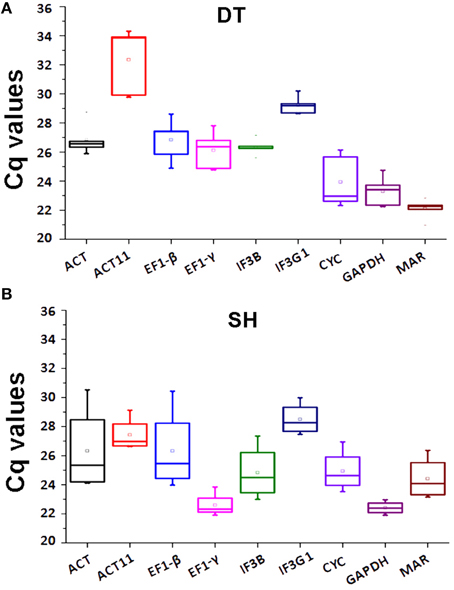
Figure 2. Expression levels of eight candidate reference genes and MAR in DT or SH. Box-plot graphs of Ct-values for each gene in DT (A) or SH (B) are shown. The plots highlight the mean (hollow square), median (center line), maximum and minimum (whiskers, the vertical lines), and 25 and 75% percentiles (boxes) of the data. The outliers are marked with dots. DT, different tissue sample group; SH, heat-treated seedling sample group.
Expression Stability Analysis of Reference Genes in P. ginseng
In this study, we used four major computational algorithms (the comparative ΔCt method, BestKeeper, Normfinder, and geNorm) to screen suitable reference genes. The methods can evaluate the expression stability of reference genes from different aspects. The comparative ΔCt method is a simple method by comparing relative expression of “pairs of genes” within each sample to confidently select useful housekeeping genes (Silver et al., 2006). According to this method, EF1-γ is the most stable reference gene showing the lowest standard deviation (STDEV) for the DT samples of P. ginseng, while GAPDH is the least stable one with the highest STDEV value (Figure 3A). For the SH samples, IF3G1 showed the highest expression stability, while ACT was the lowest (Figure 4A).
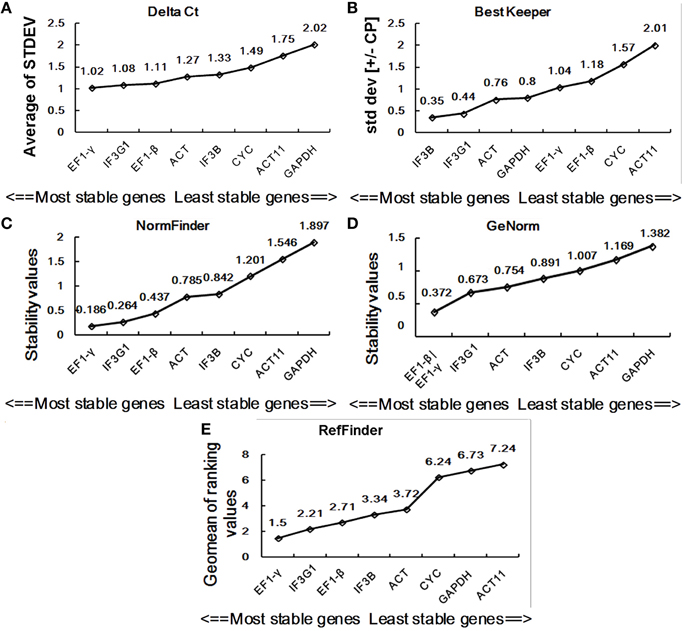
Figure 3. Expression stability of eight candidate reference genes in DT. Ranking was given by the comparative ΔCt method (A), BestKeeper (B), NormFinder (C), geNorm (D), and RefFinder (E). DT, different tissue sample group.
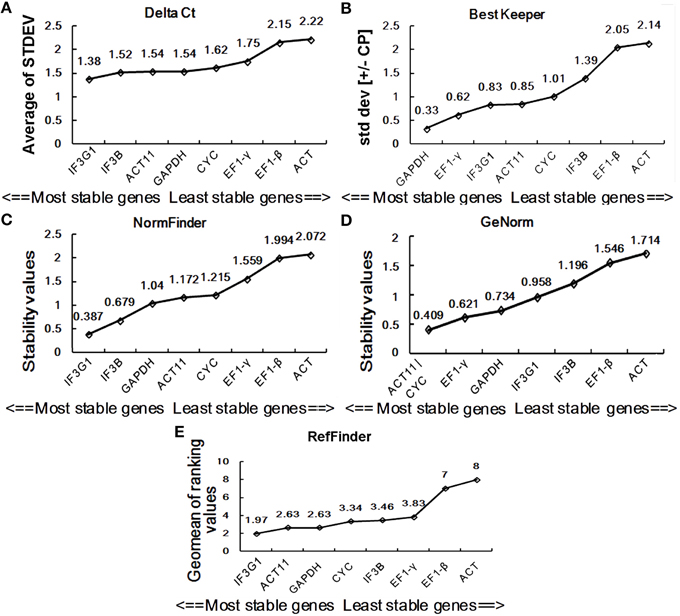
Figure 4. Expression stability of eight candidate reference genes in SH. Ranking was determined by the comparative ΔCt method (A), BestKeeper (B), NormFinder (C), geNorm (D), and RefFinder (E). SH, heat-treated seedling sample group.
BestKeeper is an Excel-based tool that estimates gene expression stability using the standard deviation (SD) and the coefficient of variation (CV) of each gene in different samples. Reference genes with SD >1 are considered unstable and should be avoided (Pfaffl et al., 2004). By BestKeeper, IF3B, IF3G1, ACT, and GAPDH presented stable expression with SD-values of 0.35, 0.44, 0.76, and 0.8, respectively, for DT samples (Figure 3B). For SH samples, GAPDH, EF1-γ, IF3G1, and ACT11 are four stable reference genes with SD-values < 1 (Figure 4B). Since the best reference genes are those with the lowest CV and SD, IF3B, and GAPDH are the best reference genes for DT and SH by BestKeeper, respectively.
Normfinder can estimate not only the overall variation of the candidate reference genes but also the variation between subgroups of the total sample set (Andersen et al., 2004). A lower stability value indicates higher expression stability. For DT samples, Normfinder analysis showed a completely same pattern of stability with the comparative ΔCt method, recommending EF1-γ as the most reliable reference gene for RT-qPCR data normalization and GAPDH as the least one (Figure 3C). For SH samples, NormFinder also ranked IF3G1 to be the best reference gene as the comparative ΔCt method. ACT showed unstable expression with a stability value of 2.072 (Figure 4C).
GeNorm has been widely used to determine the most stable reference genes from a set of tested genes by calculating a gene expression stability measure (M), the mean pairwise variation for a gene compared with all other tested genes (Vandesompele et al., 2002). Lower M-value is indicative of greater stability in expression. Ranking of the tested genes were given via a stepwise exclusion process. GeNorm analysis gives two most stable reference genes, since the analysis relies on the principle that expression ratio of two ideal reference genes must always remain constant across all samples. GeNorm analysis of candidate reference gene expression in DT samples showed that EF1-γ and EF1-β had the lowest M -value of 0.372, suggesting them to be the two most stable genes (Figure 3D). In SH samples, ACT11, and CYC had an M-value of 0.409, displaying the most stable expression (Figure 4D).
The geNorm program can also determine optimal number of reference genes for RT-qPCR normalization. It calculates pairwise variation of two sequential normalization factors NFn and NFn+1 with a cut-off value of 0.15, below which the inclusion of an additional reference gene is not necessary. For P. ginseng tissues tested, normalization requires the use of four reference genes since only the V4/5-value (0.09) is inferior to the 0.15 cut-off level (Figure 5A). For heat treated seedlings, six reference genes were needed for accurate RT-qPCR data normalization since the V6/7-value (0.05) is < 0.15 (Figure 5B).
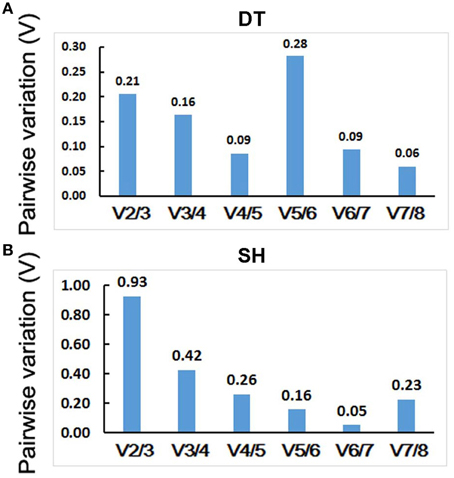
Figure 5. Determination of the optimal number of internal control genes in DT (A) and SH (B). Pairwise variation (V) values were calculated by geNorm. No additional genes are required for the normalization when values below 0.15. DT, different tissue sample group; SH, heat-treated seedling sample group.
Comprehensive Ranking of the Reference Genes by RefFinder
Stability analysis of candidate reference gene expression using the comparative ΔCt method, BestKeeper, Normfinder, and geNorm showed different stability ranking list of genes (Figures 3, 4). For DT samples, GeNorm analysis showed EF1-γ and EF1-β to be two most stable genes; the comparative ΔCt method and NormFinder analysis suggested EF1-γ being the most ideal reference gene; while BestKeeper analysis ranked IF3B at the first position. For SH samples, GeNorm analysis showed ACT11 and CYC to be top two ideal reference genes; the comparative ΔCt method and NormFinder analysis suggested IF3G1 being the most stable gene; while BestKeeper analysis ranked GAPDH at the first position. Thus, a comprehensive evaluation of candidate reference genes were carried out using the web-based comprehensive tool RefFinder, which integrates geNorm, Normfinder, BestKeeper, and the comparative ΔCt method. As shown in Figure 3E, RefFinder analysis suggest that the ranking of expression stability is EF1-γ > IF3G1 > EF1-β > IF3B > ACT > CYC > GAPDH > ACT11 in the set of different P. ginseng tissues and IF3G1 > ACT11 > GAPDH > CYC > IF3B > EF1-γ > EF1-β > ACT in the heat-treated P. ginseng seedling set (Figure 4E).
Expression Analysis of MAR for Reference Gene Validation
Previously, we analyzed the expression of a mlncRNA gene MAR using GAPDH for data normalization (Wang et al., 2015). However, GAPDH appears to be not most stably expressed in different tissues of P. ginseng in this study (Figure 3). Therefore, we used the three most stable genes, EF1-γ, IF3G1, and EF1-β shown by RefFinder analysis, as internal controls to re-analyze the expression pattern of MAR in P. ginseng. Although the overall expression profiles of MAR were similar, slight differences were observed when normalized using the three reference genes alone. For example, MAR transcripts accumulated at a higher level in flowers than leaves when the expression data was normalized using EF1-γ (Figure 6A). A lower or similar level of MAR was shown in flowers compared with leaves when IF3G1 and EF1-β were used as the internal control, respectively, (Figures 6B,C). Using the combination of two (EF1-γ and IF3G1) or three (EF1-γ, IF3G1, and EF1-β) reference genes to normalize RT-qPCR data showed the same expression patterns of MAR (Figures 6D,E). Using the least stable gene ACT11 as internal control, the expression of MAR pattern was not influenced (Figure 6F). But, the accumulation of MAR transcripts was under-estimated in roots when the data was normalized using GAPDH as internal control (Wang et al., 2015). It suggests that gene expression levels were obviously affected when unstable reference genes were used for normalization. Considering the cost and operation process, we recommend using the combination of EF1-γ and IF3G1 to normalize RT-qPCR data of gene expression in different P. ginseng tissues.
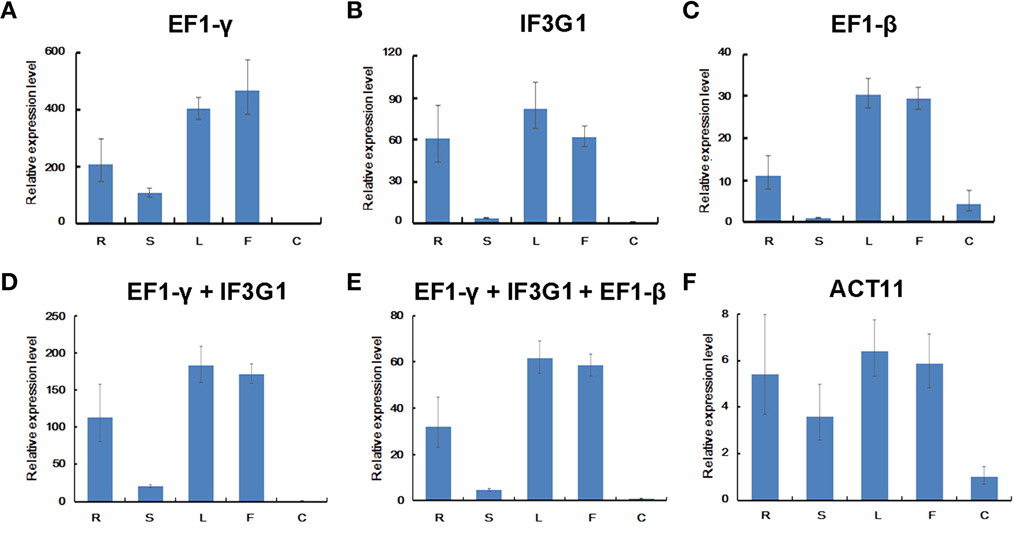
Figure 6. Relative expression levels of MAR in P. ginseng tissues. Different normalization factors were used: one of the three top ranked genes defined by RefFinder (A–C), the combination of the two (D) or three (E) top ranked genes, and the worst stable gene (F). All values are means ± SD (n = 3). R, root; S, stem; F, flower; L, leaf; C, embryogenic calli.
Furthermore, we examined the expression of MAR in P. ginseng seedlings treated with heat stress. RT-qPCR data was normalized using the three most stable genes, including IF3G1, ACT11, and GAPDH, which were identified through RefFinder analysis. No matter normalized by IF3G1, ACT11, and GAPDH alone or a combination, nearly same expression profiles were obtained (Figures 7A–E). Compared with the level of MAR in seedlings without treatment, MAR expression was slightly down-regulated at the time-point of 6-h heat treatment, and then elevated at the time-point of 12-h treatment. On the contrary, down-regulation of MAR was shown when the data was normalized with ACT, the most unstable reference gene (Figure 7F). Taken together, we recommend using the combination of IF3G1 and ACT11 to normalize RT-qPCR data of gene expression in P. ginseng seedlings under heat treatment.
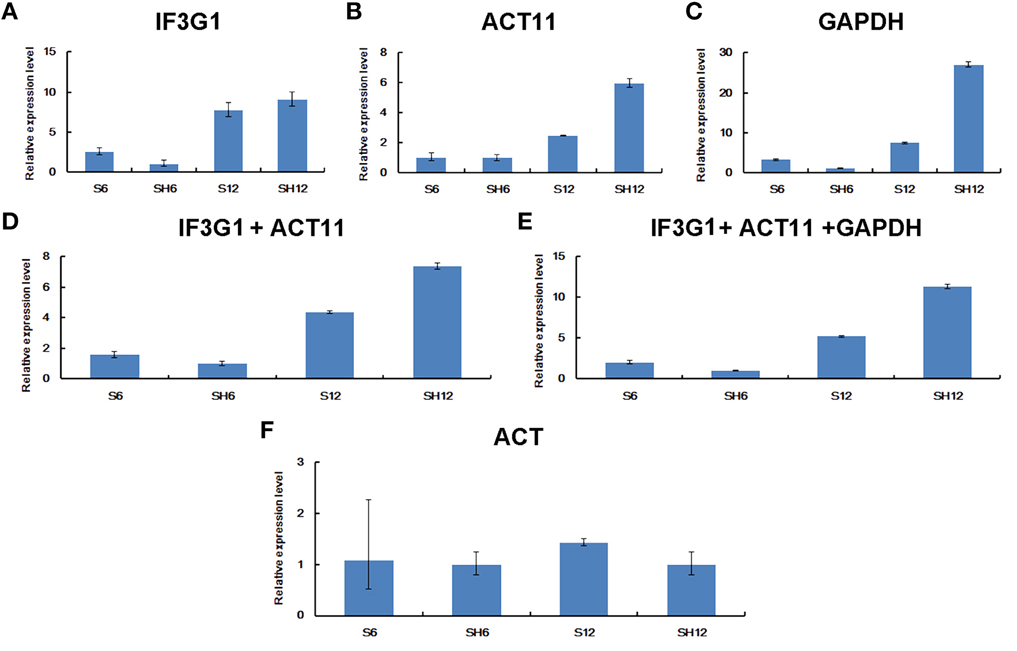
Figure 7. Relative expression levels of MAR in P. ginseng seedlings under heat stress. Different normalization factors were used: one of the three top ranked genes defined by RefFinder (A–C), the combination of the two (D) or three (E) top ranked genes, and the worst ranked gene (F). All values are means ± SD (n = 3). S6, seedlings grown at 25°C for 6 h; S12, seedlings grown at 25°C for 12 h; SH6, seedlings grown at 37°C for 6 h; SH12, seedlings grown at 37°C for 12 h.
Discussion
It is a crucial pre-requisite to validate appropriate reference genes for a successful gene expression measurement using RT-qPCR. An increasing number of studies on reference gene selection have been carried out in various plant species (Jain et al., 2006; Hong et al., 2008; Huang et al., 2014; Galli et al., 2015; Niu et al., 2015). As for P. ginseng, actin was frequently used as the internal control in RT-PCR (Lee et al., 2004; Han et al., 2006, 2010, 2011, 2012; Kim et al., 2011) or RT-qPCR (Kim et al., 2014) without any form of expression stability examination. Recently, Liu et al. (2014) carried out a systematic reference gene screening in different organs or at different developmental stages of P. ginseng. However, emerging evidence shows that the expression stability of reference genes may be altered across cultivars or under widely varying experimental conditions. For example, the traditionally used internal control genes GAPDH and 18S rRNA were found to be the most unstable reference genes in given samples of strawberry cultivars or certain cultivars under various stress treatments (Galli et al., 2015). Thus, it is necessary to investigate the expression stability of candidate reference genes under specific experimental conditions prior to using them for RT-qPCR data normalization.
Selection of candidate reference genes for evaluation is the first step. It should cover a range of biological functions. We searched the ginseng transcriptome database using more than eight Arabidopsis commonly used reference genes by Blastx in order to select more candidates in the beginning. Unforturnately, most of them are short and is not suitable for primer design. In addition, there might be a big family for some candidate reference genes and they may share high sequence similarity. Therefore, genome-wide identification of all the members in each candidate reference gene family will be important for specific primer design of each gene. It is believed that the decoding of ginseng genome and the increasing transcriptome sequencing data will facilitate it.
Amplification efficiency is an important factor that should be considered when using a relative quantification approach for gene expression study. So far, two basic methods have been used for evaluation of amplification efficiencies. One uses a serial dilution of the cDNA samples and the Ct values were plotted against cDNA input. Then, the efficiency was calculated from the slope of the regression line based on the equation E = 10(−1∕slope) (Pfaffl, 2001; Rasmussen, 2001). For the other one, amplification efficiency is computed for each gene from each individual reaction (Liu and Saint, 2002; Ruijter et al., 2009). It has been shown that amplification efficiency can vary largely depending on the approach used (Regier and Frey, 2010). We used the dilution series of pooled cDNA samples for efficiency calculation and not all of them were near 100% (Table 1). It is probably due to that the amplification efficiency is not constant for all dilutions. There may be chemicals in cDNA samples inhibiting the reaction. When a cDNA sample is diluted, these “poisons” are also be diluted and therefore, increases the amplification efficiencies in the diluted samples (Ramakers et al., 2003).
A good reference gene, which can be used as an internal control, is characterized by expression stability. The stability of expression is ideally not affected by tissue types, developmental stages, physiological situations, and experimental conditions. According to Liu et al. (2014), CYP (called CYC in our study) and EF-1a are the two most stable reference genes in different organs and developmental stages. However, we found that CYC was not the most stable in different tissues (Figure 3). This inconsistency is might be due to the quite different ginseng cultivars used. Similar results are obtained in strawberry and 18S shows the most variation among different cultivars (Galli et al., 2015). It suggests that it is necessary to select suitable reference genes even among different cultivar. Interestingly, EF1-γ and EF1-β was found to be stable among different tissues by all the analysis methods except BestKeeper in our study (Figure 3). It is inferred that elongation factor genes might be stable among these two ginseng cultivars, even though further certification is needed.
Usually, only one reference gene was used for RT-qPCR data normalization in most reported gene expression studies (Suzuki et al., 2000). However, single reference gene is insufficient sometimes (Veazey and Golding, 2011). GeNorm recommended four and six reference genes for different tissues and heat treated seedling samples, respectively (Figure 5). Considering cost and operation, we analyzed the expression levels of MAR in different tissues of P. ginseng or seedlings treated with heat stress using the three most stable genes alone or a combination as internal controls. As a result, EF1-γ/IF3G1 and IF3G1/ACT11 were selected as the optimum pairs of reference genes for normalization of RT-qPCR data obtained from different tissues of P. ginseng and heat treated seedlings, respectively. The two gene pairs can serve as internal controls for not only mlncRNAs but also protein-coding genes gene expression studies.
In conclusion, this study evaluated the expression stability of eight candidate housekeeping genes in two set of tissues, including roots, stems, leaves, and flowers of 5-year-old P. ginseng plants and embryogenic calli of P. ginseng (DT) 1-month-old P. ginseng seedlings treated with or without high temperature for 6 and 12 h (SH). RT-qPCR data was analyzed using the comparative ΔCt method, geNorm, Normfinder, BestKeeper, and RefFinder. EF1-γ/IF3G1 and IF3G1/ACT11 were identified as the optimum pairs of internal control genes in different tissues of P. ginseng or seedlings under heat treatment, respectively. The results provide useful information for reliable RT-qPCR data normalization in P. ginseng gene expression studies.
Author Contributions
Conceived and designed the experiments: SL. Performed the experiments: MW. Wrote the paper: MW and SL.
Conflict of Interest Statement
The authors declare that the research was conducted in the absence of any commercial or financial relationships that could be construed as a potential conflict of interest.
Acknowledgments
This work was supported by the Natural Science Foundation of China (31200197, 81072993); the Major Scientific and Technological Special Project for Significant New Drugs Creation (2012ZX09301002-001-031).
Supplementary Material
The Supplementary Material for this article can be found online at: http://journal.frontiersin.org/article/10.3389/fpls.2015.01259
References
Andersen, C. L., Jensen, J. L., and Orntoft, T. F. (2004). Normalization of real-time quantitative reverse transcription-PCR data: a model-based variance estimation approach to identify genes suited for normalization, applied to bladder and colon cancer data sets. Cancer Res. 64, 5245–5250. doi: 10.1158/0008-5472.CAN-04-0496
Bi, B. J. (1985). A study of the climatical ecology and the selection of the suitable land for the cultivation of Panax ginseng. Acta Phytoecol. Geobot. Sin. 9, 92–100.
Bustin, S. A. (2002). Quantification of mRNA using real-time reverse transcription PCR (RTPCR): trends and problems. J. Mol. Endocrinol. 29, 23–39. doi: 10.1677/jme.0.0290023
Bustin, S. A., Benes, V., Garson, J. A., Hellemans, J., Huggett, J., Kubista, M., et al. (2009). The MIQE guidelines: minimum information for publication of quantitative real-time PCR experiments. Clin. Chem. 55, 611–622. doi: 10.1373/clinchem.2008.112797
Derveaux, S., Vandesompele, J., and Hellemens, J. (2010). How to do successful gene expression analysis using real-time PCR. Methods 50, 227–230. doi: 10.1016/j.ymeth.2009.11.001
Galli, V., Borowski, J. M., Perin, E. C., da Silva Messias, R., Labonde, J., dos Santos Pereira, I., et al. (2015). Validation of reference genes for accurate normalization of gene expression for real time-quantitative PCR in strawberry fruits using different cultivars and osmotic stresses. Gene 554, 205–214. doi: 10.1016/j.gene.2014.10.049
Guénin, S., Mauriat, M., Pelloux, J., van Wuytswinkel, O., Bellini, C., and Gutierrez, L. (2009). Normalization of RT-qPCR data: the necessity of adopting a systematic, experimental conditions-specific, validation of references. J. Exp. Bot. 60, 487–493. doi: 10.1093/jxb/ern305
Gutierrez, L., Mauriat, M., Guénin, S., Pelloux, J., Lefebvre, J.-F., Louvet, R., et al. (2008). The lack of a systematic validation of reference genes: a serious pitfall undervalued in reverse transcription-polymerase chain reaction (RT-PCR) analysis in plants. Plant Biotechnol. J. 6, 609–618. doi: 10.1111/j.1467-7652.2008.00346.x
Han, J. Y., Hwang, H. S., Choi, S. W., Kim, H. J., and Choi, Y. E. (2012). Cytochrome P450 CYP716A53v2 catalyzes the formation of protopanaxatriol from protopanaxadiol during ginsenoside biosynthesis in Panax ginseng. Plant Cell Physiol. 53, 1535–1545. doi: 10.1093/pcp/pcs106
Han, J. Y., In, J. G., Kwon, Y. S., and Choi, Y. E. (2010). Regulation of ginsenoside and phytosterol biosynthesis by RNA interferences of squalene epoxidase gene in Panax ginseng. Phytochemistry 71, 36–46. doi: 10.1016/j.phytochem.2009.09.031
Han, J. Y., Kim, H. J., Kwon, Y. S., and Choi, Y. E. (2011). The Cyt P450 Enzyme CYP716A47 catalyzes the formation of protopanaxadiol from dammarenediol-II during ginsenoside biosynthesis in Panax ginseng. Plant Cell Physiol. 52, 2062–2073. doi: 10.1093/pcp/pcr150
Han, J. Y., Kwon, Y. S., Yang, D. C., Jung, Y. R., and Choi, Y. E. (2006). Expression and RNA interference-induced silencing of the dammarenediol synthase gene in Panax ginseng. Plant Cell Physiol. 47, 1653–1662. doi: 10.1093/pcp/pcl032
Hong, S. Y., Seo, P. J., Yang, M. S., Xiang, F., and Park, C. (2008). Exploring valid reference genes for gene expression studies in Brachypodium distachyon by real-time PCR. BMC Plant Biol. 8:112. doi: 10.1186/1471-2229-8-112
Huang, L., Yan, H., Jiang, X., Zhang, Y., Zhang, X., Ji, Y., et al. (2014). Reference gene selection for quantitative real-time reverse-transcriptase PCR in orchardgrass subjected to various abiotic stresses. Gene 553, 158–165. doi: 10.1016/j.gene.2014.10.017
Jain, M., Nijhawan, A., Tyagi, A. K., and Khurana, J. P. (2006). Validation of housekeeping genes as internal control for studying gene expression in rice by quantitative real-time PCR. Biochem. Biophys. Res. Commun. 345, 646–651. doi: 10.1016/j.bbrc.2006.04.140
Jayakodi, M., Lee, S. C., Park, H. S., Jang, W., Lee, Y. S., Choi, B. S., et al. (2014). Transcriptome profiling and comparative analysis of Panax ginseng adventitious roots. J. Ginseng Res. 38, 278–288. doi: 10.1016/j.jgr.2014.05.008
Kim, K. J., and Lee, H. L. (2004). Complete chloroplast genome sequences from Korean ginseng (Panax schinseng Nees) and comparative analysis of sequence evolution among 17 vascular plants. DNA Res. 11, 247–261. doi: 10.1093/dnares/11.4.247
Kim, T. D., Han, J. Y., Huh, G. H., and Choi, Y. E. (2011). Expression and functional characterization of three squalene synthase genes associated with saponin biosynthesis in Panax ginseng. Plant Cell Physiol. 52, 125–137. doi: 10.1093/pcp/pcq179
Kim, Y. J., Jeon, J. N., Jang, M. G., Oh, J. Y., Kwon, W. S., Jung, S. K., et al. (2014). Ginsenoside profiles and related gene expression during foliation in Panax ginseng Meyer. J. Ginseng Res. 38, 66–72. doi: 10.1016/j.jgr.2013.11.001
Lee, M. H., Jeong, J. H., Seo, J. W., Shin, C. G., Kim, Y. S., In, J. G., et al. (2004). Enhanced triterpene and phytosterol biosynthesis in Panax ginseng overexpressing squalene synthase gene. Plant Cell Physiol. 45, 976–984. doi: 10.1093/pcp/pch126
Liu, J., Wang, Q., Sun, M., Zhu, L., Yang, M., and Zhao, Y. (2014). Selection of reference genes for quantitative Real-Time PCR normalization in Panax ginseng at different stages of growth and in different organs. PLoS ONE 9:e112177. doi: 10.1371/journal.pone.0112177
Liu, W., and Saint, D. A. (2002). A new quantitative method of real time reverse transcription polymerase chain reaction assay based on simulation of polymerase chain reaction kinetics. Anal. Biochem. 302, 52–59. doi: 10.1006/abio.2001.5530
Livak, K. J., and Schmittgen, T. D. (2001). Analysis of relative gene expression data using real-time quantitative PCR and the 2-ΔΔCT method. Methods 25, 402–408. doi: 10.1006/meth.2001.1262
Luo, Z., Liu, S., Lu, Q., Chen, X., Wen, B., Luo, J., et al. (2003). Construction of subtractive cDNA library and mRNA differential expression analysis involved in ginsenoside biosynthesis from Panax ginseng root. Life Sci. Res. 7, 324–328.
Niu, L., Tao, Y., Chen, M., Fu, Q., Li, C., Dong, Y., et al. (2015). Selection of reliable reference genes for gene expression studies of a promising oilseed crop, Plukenetia volubilis, by real-time quantitative PCR. Int. J. Mol. Sci. 16, 12513–12530. doi: 10.3390/ijms160612513
Notredame, C., Higgins, D. G., and Heringa, J. (2000). T-Coffee: a novel method for fast and accurate multiple sequence alignment. J. Mol. Biol. 302, 205–217. doi: 10.1006/jmbi.2000.4042
Pfaffl, M. W. (2001). A new mathematical model for relative quantification in real-time RT–PCR. Nucleic Acids Res. 29:e45. doi: 10.1093/nar/29.9.e45
Pfaffl, M. W., Tichopad, A., Prgomet, C., and Neuvians, T. P. (2004). Determination of stable housekeeping genes, differentially regulated target genes and sample integrity: Bestkeeper–Excel-based tool using pair-wise correlations. Biotechnol. Lett. 26, 509–515. doi: 10.1023/B:BILE.0000019559.84305.47
Ramakers, C., Ruijter, J. M., Deprez, R. H. L., and Moorman, A. F. (2003). Assumption-free analysis of quantitative real-time polymerase chain reaction (PCR) data. Neurosci. Lett. 339, 62–66. doi: 10.1016/S0304-3940(02)01423-4
Rasmussen, R. (2001). “Quantification on the LightCycler” in Rapid Cycle Real-time PCR, Methods and Applications, eds S. Meuer, C. Wittwer, and K. Nakagawara (Heidelberg: Springer Press), 21–34.
Regier, N., and Frey, B. (2010). Experimental comparison of relative RT-qPCR quantification approaches for gene expression studies in poplar. BMC Mol. Biol. 11:57. doi: 10.1186/1471-2199-11-57
Ruijter, J. M., Ramakers, C., Hoogaars, W. M. H., Karlen, Y., Bakker, O., van den Hoff, M. J. B., et al. (2009). Amplification efficiency: linking baseline and bias in the analysis of quantitative PCR data. Nucleic. Acids Res. 37:e45. doi: 10.1093/nar/gkp045
Shibata, S. (2001). Chemistry and cancer preventing activities of ginseng saponins and some related triterpenoid compounds. J. Korean Med. Sci. 16:S28. doi: 10.3346/jkms.2001.16.S.S28
Silver, N., Best, S., Jiang, J., and Thein, S. L. (2006). Selection of housekeeping genes for gene expression studies in human reticulocytes using real-time PCR. BMC Mol Biol. 7:33. doi: 10.1186/1471-2199-7-33
Suzuki, T., Higgins, P. J., and Crawford, D. R. (2000). Control selection for RNA quantitation. Biotechniques 29, 332–337.
Vandesompele, J., De Preter, K., Pattyn, F., Poppe, B., Van Roy, N., De Paepe, A., et al. (2002). Accurate normalization of real-time quantitative RT-PCR data by geometric averaging of multiple internal control genes. Genome Biol. 3:RESEARCH0034. doi: 10.1186/gb-2002-3-7-research0034
Veazey, K. J., and Golding, M. C. (2011). Selection of stable reference genes for quantitative RT-PCR comparisons of mouse embryonic and extra-embryonic stem cells. PLoS ONE 6:27592. doi: 10.1371/journal.pone.0027592
Wang, M., Wu, B., Chen, C., and Lu, S. (2015). Identification of Panax ginseng mRNA-like non-coding RNAs and validation of a mighty one regulating multiple metabolic pathways. J. Integr. Plant Biol. 57, 254–268. doi: 10.1111/jipb.12239
Wu, B., Wang, M., Ma, Y., Yuan, L., and Lu, S. (2012). High-throughput sequencing and characterization of the small RNA transcriptome reveal features of novel and conserved microRNAs in Panax ginseng. PLoS ONE 7:e44385. doi: 10.1371/journal.pone.0044385
Keywords: Panax ginseng, RT-qPCR, reference gene, mlncRNA, normalization, validation, heat stress
Citation: Wang M and Lu S (2016) Validation of Suitable Reference Genes for Quantitative Gene Expression Analysis in Panax ginseng. Front. Plant Sci. 6:1259. doi: 10.3389/fpls.2015.01259
Received: 11 August 2015; Accepted: 24 December 2015;
Published: 12 January 2016.
Edited by:
Keqiang Wu, National Taiwan University, TaiwanReviewed by:
Daoyuan Zhang, Chinese Academy of Sciences, ChinaYahui Wei, Northwest University, China
Tsuyoshi Imai, NARO Institute of Fruit Tree Science, Japan
Copyright © 2016 Wang and Lu. This is an open-access article distributed under the terms of the Creative Commons Attribution License (CC BY). The use, distribution or reproduction in other forums is permitted, provided the original author(s) or licensor are credited and that the original publication in this journal is cited, in accordance with accepted academic practice. No use, distribution or reproduction is permitted which does not comply with these terms.
*Correspondence: Shanfa Lu, c2ZsdUBpbXBsYWQuYWMuY24=