 Haibin Wu1,2Xiaoli He1Hao Gong1Shaobo Luo1,2Mingzhu Li1Junqiu Chen1Changyuan Zhang1Ting Yu3Wangping Huang1
 Jianning Luo1*
- 1Vegetable Research Institute, Guangdong Academy of Agricultural Science, Guangzhou, China
- 2Guangdong Provincial Key Lab for New Technology Research on Vegetables, Guangzhou, China
- 3Agro-biological Gene Research Center, Guangdong Academy of Agricultural Sciences, Guangzhou, China
The hybrids between Luffa acutangula (L.) Roxb. and L.cylindrica (L.) Roem. have strong heterosis effects. However, some reproductive isolation traits hindered their normal hybridization and fructification, which was mainly caused by the flowering time and hybrid pollen sterility. In order to study the genetic basis of two interspecific reproductive isolation traits, we constructed a genetic linkage map using an F2 population derived from a cross between S1174 [L. acutangula (L.) Roxb.] and 93075 [L. cylindrica (L.) Roem.]. The map spans 1436.12 CentiMorgans (cM), with an average of 8.11 cM among markers, and consists of 177 EST-SSR markers distributed in 14 linkage groups (LG) with an average of 102.58 cM per LG. Meanwhile, we conducted colinearity analysis between the sequences of EST-SSR markers and the genomic sequences of cucumber, melon and watermelon. On the basis of genetic linkage map, we conducted QTL mapping of two reproductive isolation traits in sponge gourd, which were the flowering time and hybrid male sterility. Two putative QTLs associated with flowering time (FT) were both detected on LG 1. The accumulated contribution of these two QTLs explained 38.07% of the total phenotypic variance (PV), and each QTL explained 15.36 and 22.71% of the PV respectively. Four QTLs for pollen fertility (PF) were identified on LG 1 (qPF1.1 and qPF1.2), LG 3 (qPF3) and LG 7 (qPF7), respectively. The percentage of PF explained by these QTLs varied from 2.91 to 16.79%, and all together the four QTLs accounted for 39.98% of the total PV. Our newly developed EST-SSR markers and linkage map are very useful for gene mapping, comparative genomics and molecular marker-assisted breeding. These QTLs for interspecific reproductive isolation will also contribute to the cloning of genes relating to interspecific reproductive isolation and the utilization of interspecific heterosis in sponge gourd in further studies.
Introduction
Sponge gourd (2n = 26), also called luffa, is a cross-pollinated diploid species from the cucurbitaceous family, which is mainly cultivated in tropical and subtropical regions, such as China, Malaysia, India, Thailand, Central America, and Africa (Oboh and Aluyor, 2009; Rabei et al., 2013; Wu et al., 2014). Nine varied species of sponge gourd are distributed around the world, of which only Luffa acutangula (L.) Roxb. and L.cylindrica (L.) Roem. are cultivated (Prakash et al., 2013; Rabei et al., 2013; Wu et al., 2014). They obviously differ from each other in that L. acutangula fruit possesses deep grooves and thus is also called ridged luffa, while the surface of L. cylindrica is smooth, due to which it is also called smooth luffa.
The fruit of sponge gourd is rich in nutrition. The immature fruit can be enjoyed as a vegetable, and the fully-grown sponge gourd can be used as household cleaning products and industrial raw materials. In particular, sponge gourd contains multiple bioactivators, such as alkaloids, flavonoids, sterols, glycosides and glycoprotein, and possesses anti-inflammation, anti-fungal, anti-bacterial, anti-myocardial ischemia, sedative and analgesic activities (Ng et al., 1992a,b; Partap et al., 2012; Wu et al., 2014). Meanwhile, ribosome-inactivating protein in the seeds of sponge gourd contains anti-HIV activity (Ng et al., 1992b, 2011).
A genetic linkage map is vital for mapping genes/QTLs controlling desirable agronomic traits, comparative genomic research, and marker assisted selection. The saturated genetic linkage maps (< 1 cM between markers) have been constructed in cucumber, melon and watermelon, while similar study of sponge gourd is rarely found (Ren et al., 2009, 2012; Diaz et al., 2011). By making use of sequence related amplified polymorphism (SRAP) markers, Cui et al. (2015) constructed a genetic map consisting of 258 loci on 24 linkage groups, of which the overall length was 822.86 cM and the mean interval between markers was 3.49 cM, becoming the first genetic linkage map of sponge gourd in the world. However, due to the fact that the SRAP is a kind of random primer amplified marker, its accuracy and maneuverability are not quite satisfying. The SSR markers show huge advantage in the construction of molecular genetic maps since they are more accurate, operative and plentiful. Previously, we identified 8523 pairs of EST-SSR markers in sponge gourd through transcriptome sequencing for the first time, of which 641 pairs of markers were verified, and then employed 50 pairs of them to study the diversity of 60 sponge gourd accessions (Wu et al., 2014), which can contribute to the construction of sponge gourd genetic linkage map.
Heterosis or hybrid vigor is a common natural phenomenon in the biological world, and reproductive isolation happens when two parents are distantly related in genetic relationship. Reproductive isolation serves as the indicator of speciation, and is also a mechanism to maintain the purity of species (Orr and Presgraves, 2000; Long et al., 2008; Hinchliffe et al., 2011). Dobzhansky-Muller model argued that hybrid incompatibility was caused by the accumulative negative interaction of two or more loci. As for animals, several genes resulting in hybrid incompatibility have been identified in Drosophila and mice (Morán and Fontdevila, 2014; Civetta and Gaudreau, 2015; Davies et al., 2016). As for plants, correlated studies in rice have been conducted in depth and a few genes causing hybrid sterility have been cloned (Long et al., 2008; Yang et al., 2012; Chen and Liu, 2014). In the case of Sponge gourd, the hybrids with crossed between L. acutangula and L. cylindrica have strong heterosis effects. However, some reproductive isolation traits hindered their normal hybridization and fructification. At present the research about reproductive isolation in sponge gourd can be scarcely found, and our studies showed that the reproductive isolation between L. acutangula and L. cylindrica mainly consisted of two aspects. Firstly, there was almost a 12-h gap in their flowering time. During the day, the former was usually from 5 to 7 p.m., while the latter often blossomed from 4 am to 6 am, leading to the difficulty of natural hybridization between them. Secondly, they showed hybrid male sterility. After the artificial hybridization between them, hybrid F1 was in half sterile condition.
On the basis of EST-SSR markers previously developed by transcriptome sequencing, this research continued to develop 405 pairs of EST-SSR markers, eventually obtaining 1046 pairs of EST-SSR markers in sponge gourd. Furthermore, we constructed a genetic linkage map using an F2 population derived from a cross between S1174 (L. acutangula) and 93075 (L. cylindrica). Then we also conducted QTL mapping of two traits of reproductive isolation in sponge gourd, which were the flowering time and hybrid male sterility. Our studies are supposed to contribute to the following cloning of genes relating to interspecific reproductive isolation, the utilization of the heterosis of interspecific, and the development of molecular marker assisted breeding in sponge gourd.
Materials and Methods
Plant Materials
There are two advanced inbred lines, S1174 and P93075, which belonged to L. acutangula (L.) Roxb. and L. cylindrical (L.) Roem. respectively and used as experimental materials. The mapping population consisting of 186 F2 individuals was generated by cross of S1174 × P93075.
Trait Measurements and Statistical Analysis
Two traits of reproductive isolation relating to flowering time and hybrid pollen fertilities were investigated. During the bloom stages of the mapping population, the flowering time of each plant was investigated from 4:00 p.m. to 7:00 a.m. for three successive days, and took the average value as the flowering time of every plant. Considering the convenience of statistical analysis, we need to transform the recorded time data to decimal time measured in hour, and assigned 0 to the plants with flowering time at 0:00, negative value to those with flowering time before 0:00, and positive value to those after 0:00. For example, if the flowering time was at 1:30 a.m., it was transformed to 1.5.
During the full-bloom stages of the mapping population, three male flowers were fetched from each plant, immersed in FAA fixative (3.7% v/v formaldehyde, 50% ethanol, 5% acetic acid) and brought back to the lab. By observing the pollen fertility through a microscope, we chose one field of vision with pollens distributed evenly for each male flower, and counted the number of fertile pollens and sterile pollens in each field of vision. Three male flowers with three fields of vision were analyzed and the fertile pollen rate in each field was calculated, taking their average value as the fertile pollen rate of single plant.
Statistical analysis on the phonotypic traits of parental groups and mapping population were carried out by adopting SPSS software. After computing the frequency distribution parameters and normal distribution parameters, their diagrams were drawn with SIGEMA-PLOT.
DNA Extraction and Molecular Marker Analysis
Genomic DNA was isolated from sponge gourd young leaves using the cetyltrimethylammonium bromide (CTAB) method (Saghai-Maroof et al., 1984). PCR amplifications were performed in a 20 μL reaction volume containing 100 ng genomic DNA, 1 × PCR buffer, 2 mM MgCl2, 2.5 mM dNTPs, 4 μM of each primer, and 1 U Taq polymerase.
Amplification was performed on an Applied Biosystems 9700 thermocycler following the touchdown protocol: using 94°C for 5 min; followed by 11 cycles of 94°C for 30 s, 65–55°C for 30 s decreasing 1°C per cycle, and 72°C for 1 min; followed by 30 cycles of 94°C for 40 s, 55°C for 30 s, 72°C for 1 min; and a final extension at 72°C for 10 min. PCR products were performed on an 8% polyacrylamide gel. Gels were stained with silver nitrate as previously described (Bassam et al., 1991).
Linkage Map Construction and QTL Analyses
JoinMap version 4.0 software (Van Ooijen, 2006) was used to construct the linkage maps at LOD scores ≥4.0. The Kosambi mapping function was used to calculate the genetic distance between markers. The genetic map was drawn with MapDraw (Liu and Meng, 2003).
Candidate QTL regions were identified by using Windows QTL Cartographer ver. 2.5 (Wang et al., 2007). Composite interval mapping (CIM) procedure was performed using the Model 6, with the window size set at 10 cM and a walking speed of 1 cM. The genome-wide LOD score threshold (a = 0.05) for declaring the presence of QTLs was determined using the permutation test (1000 replications). Based on the permutation results, the LOD score threshold was set at 3.0 for the trait to declare the presence of a significant QTL. The additive effect and percentage of phenotypic variance explained by each QTL were estimated at the peak LOD score.
Genome Comparative Mapping
To detect cross-species synteny, each amplicon or unigene of sponge gourd was BLASTN searched against the genome sequences of cucumber (Huang et al., 2009), melon (Garcia-Mas et al., 2012), and watermelon (Guo et al., 2013) and the sequences were considered orthologous if sharing ≥80% sequence identity with an e ≤ 1e-5. In cases where multiple hits occurred, only the best hits were used. The software Circos (Krzywinski et al., 2009) was employed to visualize the genome syntenic relationships.
Results
Mark Development
By means of transcriptome sequencing of sponge gourd in the previous experiment, we developed 8523 high-quality SSR primer pairs, and 641 primer pairs were synthesized and verified (Wu et al., 2014). In current experiment 405 markers were synthesized, and the polymorphisms and successful amplification of them were verified in S1174, 93075 and their hybrid F1 (Supplementary Material 1). Of these primers, 80, 81, 60, 62, 62, and 60 were for di-, tri-, tetra-, pena-, hexa-nucleotide repeats, and compound formation repeats, respectively (Table 1). A total of 325 (80.25%) exhibited successful amplification, of which 216 (66.46%) revealed polymorphism between S1174 and 93075. Polymorphisms could be observed for 41 di-, 33 tri-, 28 tetra-, 39 penta-, 42 hexa-nucleotide repeats and 33 compound formation repeats. Among the 216 polymorphic primer pairs, 101 (46.76%) were co-dominant and 115 (53.24%) were dominant.
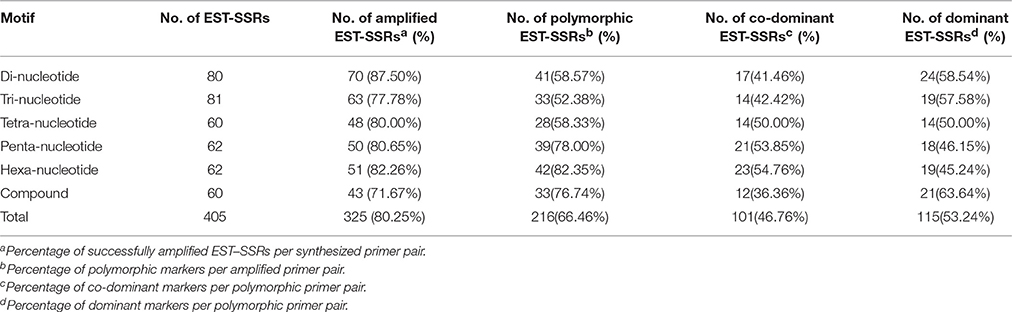
Table 1. Characteristics of synthesized EST–SSRs and efficiency of marker development.
A total of 1046 EST-SSR markers from this experiment and the previous experiment (Wu et al., 2014) were used to screen the parental lines S1174 and 93075 for polymorphic markers. Of the 1046 EST-SSR primers, 417 (39.87%) generated clear and scorable polymorphic bands between the parental lines. Among the 417 polymorphic primer pairs, 227 (62.69%) were co-dominant and 190 (37.31%) were dominant. The 417 EST-SSR polymorphic markers were used to construct the linkage map with the F2 population of S1174 × P93075, in which only 177 markers were left after deleting those with blurry bands or hard to be linked to map.
Genetic Linkage Map Construction
The 177 polymorphic EST-SSR markers between S1174 and P93075 were mapped on 14 linkage groups, of which 164 were codominant and 13 dominant, and covered a genetic length of 1436.12 CentiMorgans (cM) (Table 2, Figure 1). Because of the inter-specific hybridization, there are 48 pairs of EST-SSR markers deviating 1:2:1 (codominant markers) or 3:1 (dominant markers) (α = 0.05) in the 177 markers. The map length of the 14 linkage groups ranged from 0.62 cM (LG) to 237.61 cM (LG) with an average of 102.58 cM per LG. The density of markers ranged from 0.62 cM (LG) to 14.01 cM (LG), with an average of 8.11 cM per LG.
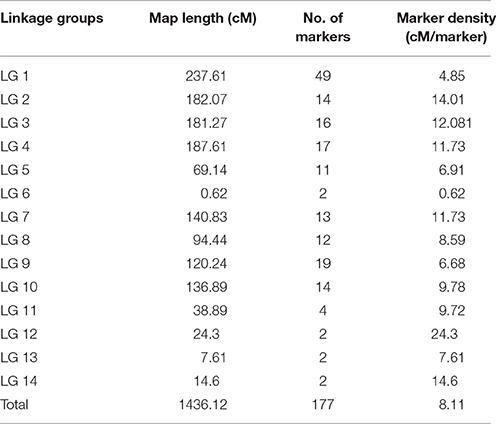
Table 2. Distribution of molecular markers among 14 linkage group (LGs) established on a genetic map using an F2 population derived from the cross S1174 × P93075.
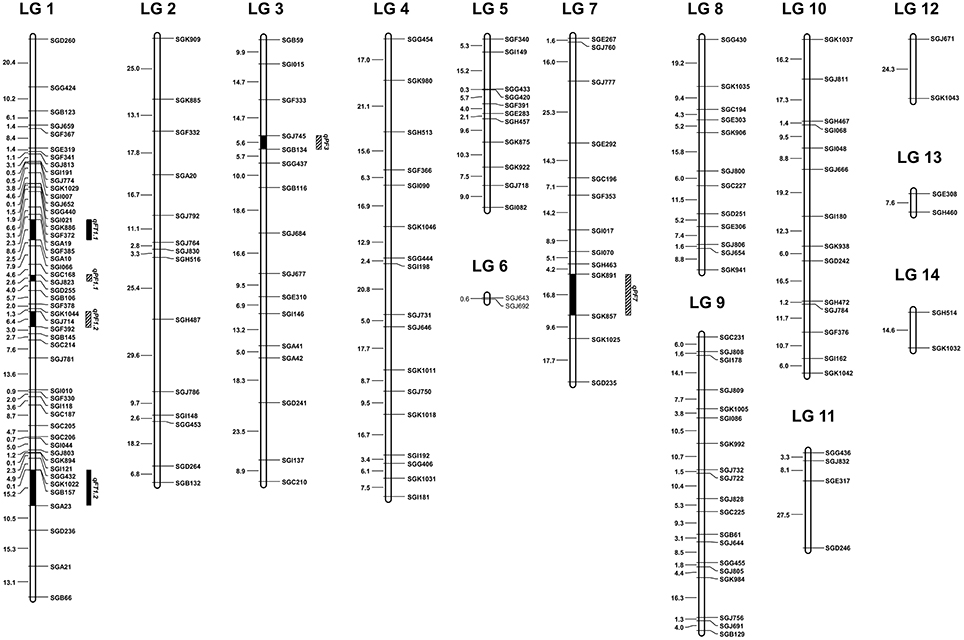
Figure 1. The 14 linkage groups (LG 1-LG 14) of sponge gourd base on the F2 population derived from the cross S1174 × P93075. The EST-SSR markers were shown on the right of the LG, and distances among markers were indicated in cM on the left. The QTLs for flowering time (qFT) were mapped to LG 1. The QTLs for pollen fertility (qPF) were mapped to LG 1, LG 3 and LG 7.
Cross-Species Synteny
Of 177 pairs of EST-SSR molecular markers in genetic linkage map, the PCR-amplified target fragments and Unigenes where markers located were used to conduct syntenic analysis with the genomic sequences of cucumber, melon and watermelon, respectively. Among the amplified target fragments of 177 pairs of markers, 119, 111, and 135 have orthoglogs in genomes of cucumber, melon and watermelon, respectively (Figure 2). Among the Unigenes where 177 pairs of markers located, 169,167 and 172 have orthoglogs in genomes of cucumber, melon and watermelon, respectively (Figure 2). Each sponge gourd LG matched one to eight chromosomes of cucumber and melon, and up to nine chromosomes of watermelon (Supplementary Materials 2–4).
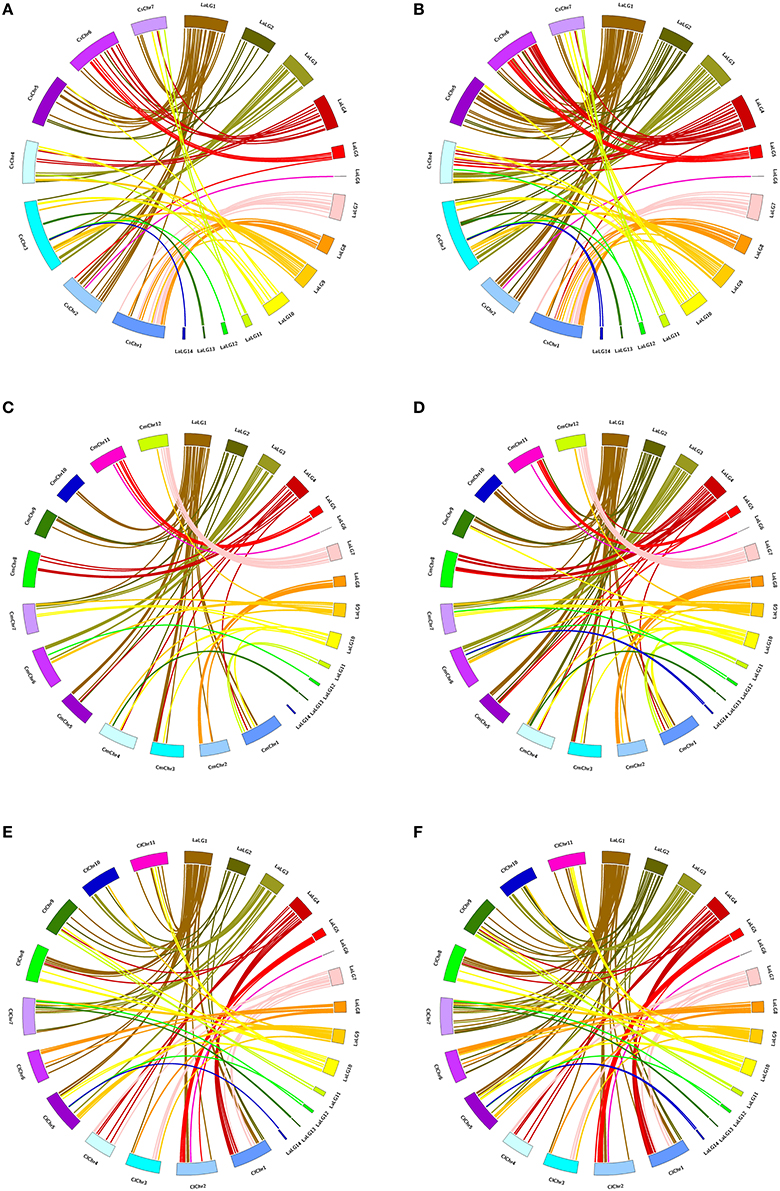
Figure 2. Circos illustration of the colinearity analysis between the sequences of sponge gourd EST-SSR markers and the genomic sequences of cucumber, melon and watermelon. (A) The PCR-amplified target fragments of sponge gourd EST-SSR markers–cucumber genome. (B) The Unigenes where sponge gourd EST-SSR markers located—cucumber genome. (C) The PCR-amplified target fragments of sponge gourd EST-SSR markers—melon genome. (D) The Unigenes where sponge gourd EST-SSR markers located—melon genome. (E) The PCR-amplified target fragments of sponge gourd EST-SSR markers—watermelon genome. (F) The Unigenes where sponge gourd EST-SSR markers located—watermelon genome. The sponge gourd linkage groups are denoted as LaLGs and the pseudomolecules of cucumber, watermelon and melon are represented as CsChrs, ClChrs, and CmChrs, respectively.
Phenotypic Data
During the blossoming period of sponge gourd, the flowering time of L. acutangula was usually from 5:00 to 7:00 p.m., while L. cylindrica normally opened flowers from 4:00 to 6:00 a.m., and there were about 12-h difference in their flowering times. The statistic data provided in this research was gained during April 21–23 in 2012 in Guangzhou: S1174 (L. acutangula) bloomed at 5:32 p.m. (the number became -6.47), P93075 (L. cylindrica) bloomed at 4:57 (the number became 4.95) and F1 bloomed at 10:30 p.m. (the number became -1.5), which was between the flowering time of male parent and female parent and closer to the latter. As for F2 population, its flowering time ranged from 5:57 p.m. to 5:05 a.m. (number became -6.05–5.08), and the average time would be 10:43:48 p.m. (number became -1.27; Table 3, Figure 3).
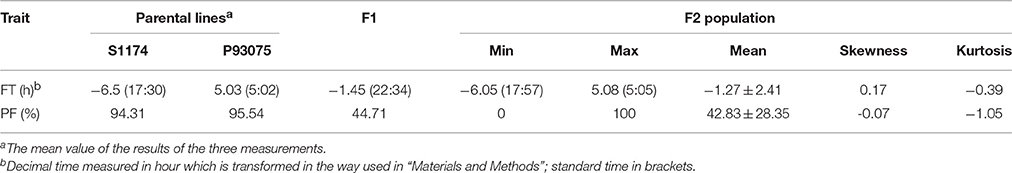
Table 3. Flowering time (FT) and pollen fertility (PF) of parental lines S1174, P93075, F1 hybrids, and F2 population derived from the cross S1174 × P93075.
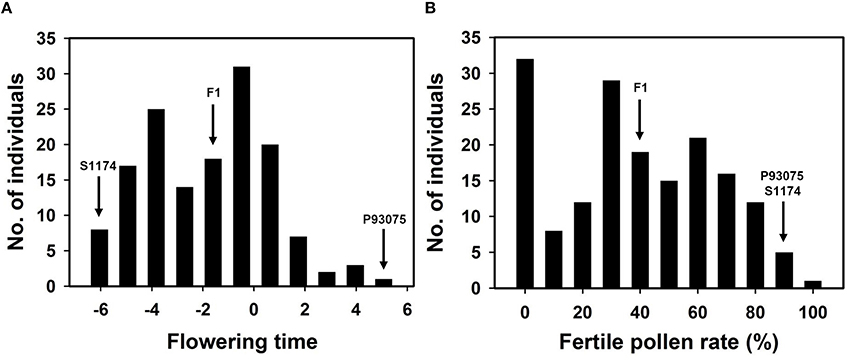
Figure 3. Distribution of flowering time (A) and pollen fertility (B) in F2 population derived from the cross S1174 × P93075.
Under normal cultivation conditions (exclude all kinds of harsh environments, such as drought, flood, extreme high or low temperature), the pollen of the parent of S1174 and the parent of P93075 was complete fertile (the fertility rate was above 94%). The pollen of F1 plants was semi-sterile (44.71%), while the pollen of F2 individuals present continuous variation with pollen fertility ranging from complete fertile (100%) to complete sterile (pollen free), and the average pollen fertility rate was 43% (Table 3, Figure 4).
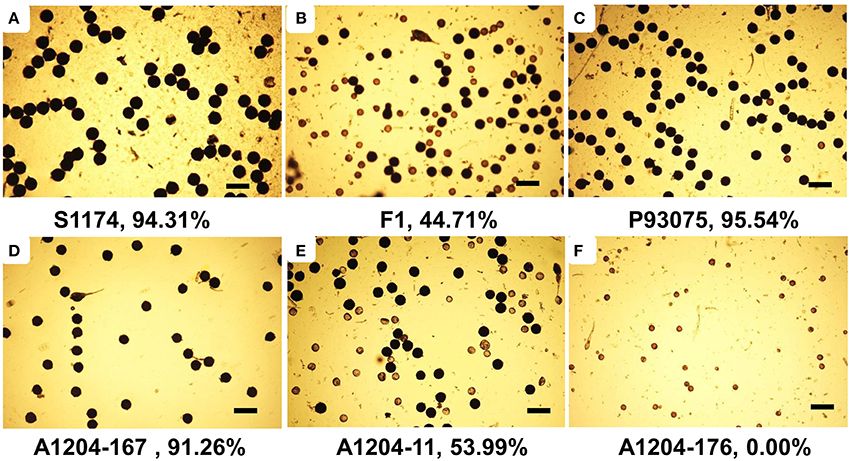
Figure 4. Pollen phenotypes of S1174 (A), P93075 (C), F1 (B), and F2 plants (D–F). Three male flowers with three fields of vision were analyzed and the fertile pollen rate in each field was calculated, taking their average value as the fertile pollen rate of single plant. Bars = 200 μm.
QTL Analysis
The QTLs for flowering time and pollen fertility of sponge gourd are summarized in Table 4. Two putative QTLs associated with flowering time (FT) were both detected on LG 1. The accumulated contribution of these QTLs explained 38.07% of the total phenotypic variance (PV), and individual QTL explained 15.36 and 22.71% of the PV. The QTLs qFT1.1 showed additive and the QTL qFT1.2 showed overdominance. Moreover, these QTLs increased FT by the presence of P93075 alleles. A major QTL qFT1.1 was mapped on LG 1 flanked by SGF385 and SGA10, which accounted for 22.71% of the PV (Table 4, Figure 1). The marker SGF385 distributed at one side of qFT1.1 with a distance of 3.02 cM. On the other side of qFT1.1, the marker SGA10 was located at a distance of 5.54 cM. The other major QTLs qFT1.2 was also mapped on LG 1, which accounted for 15.36% of the PV (Table 4, Figure 1).The marker SGB157 was distributed at a distance of 8.00 cM to qFT1.3 and the marker SGA23 on the other side of qFT1.3 was located with a distance of 7.19 cM.
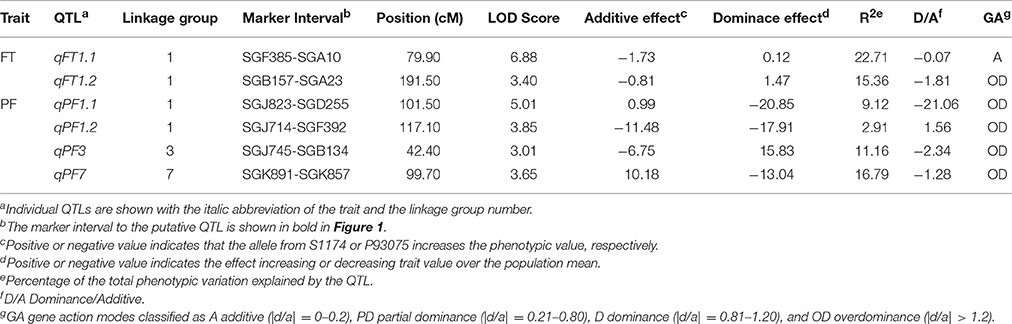
Table 4. Summary of QTLs for flowering time (FT) and pollen fertility (PF) using composite interval mapping in F2 population derived from the cross S1174 × P93075.
Four QTLs for pollen fertility (PF) were identified on LG 1 (qPF1.1 and qPF1.2), LG 3 (qPF3), and LG 7 (qPF7), respectively. The percentage of PF explained by these QTLs varied from 2.91 to 16.79%, and all together the four QTLs accounted for 39.98% of the total phenotypic variance. These QTLs all showed overdominance. The PF was increased by the presence of S1174 alleles at qPF1.1 and qPF7 and by the presence of P93075 alleles at qPF1.2 and qPF3, among which the interpretable phenotypic variance of two QTLs (qPF3 and qPF7) was greater than 10%. The qPF3 was mapped on LG 3 flanked by SGJ745 and SGB134 which explained 11.16% of the PV (Table 4, Figure 1). The marker SGJ745 was distributed at one side of qPF3 with a distance of 3.03 cM and the marker SGB134 on the other side of qPF3 was located at a distance of 2.56 cM. The qPF7 was identified on LG 7 flanked by SGK891 and SGK857 which explained 16.79% of the PV (Table 4, Figure 1). The marker SGK891 was located at a distance of 3.01 cM to qFT 7 and the marker SGK857 on the other side of qPF 7 was distributed with a distance of 13.83 cM.
Discussion
It's necessary for genetic linkage map construction and QTL mapping to keep sufficient molecular markers. EST-SSR markers are easy to use, stable to amplify, high in specificity, and regarded as functional markers since they are derived from transcripts. It will effectively eliminate the interference from invalid markers and improve the efficiency of gene mapping. Wu et al. (2014) synthesized and verified 641 EST-SSR markers in sponge gourd, and furthermore, 405 EST-SSR markers were synthesized and verified in this research, getting 1046 verified markers in sponge gourd, which can meet basically the requirement of molecular genetic study of sponge gourd. In addition, this research also witnessed high rate of successful amplification (80.25%) and high level of polymorphism between L. acutangula and L. cylindrica.
Accurate genetic linkage map serves as the basis for QTL analysis. However, the research work concerning genetic linkage map just got started in sponge gourd. Recently, Cui et al. (2015) reported a sponge gourd linkage map consisted of 258 SRAP loci covering 822.86 cM and distributed on 24 linkage groups with an average distance of 3.49 cM between makers. This map can be regarded as the first sponge gourd genetic linkage map in the world, which will contribute to the molecular genetic study of sponge gourd. But there are a few disadvantages in this map. First of all, SRAP (sequence related amplified polymorphism) markers selected in this map were a kind of non-specific amplification molecular marker. For the first five cycles, the annealing temperature of SRAPs was set at 35°C and introduced with plenty of non-specific amplification, resulting in lower accuracy and reproducibility. Therefore, if the entire genetic linkage map was constructed with SRAP markers, the low accuracy and generality of the map would make it difficult to make comparison between various results, affecting the following study of genes/QTLs mapping. Secondly, there are 13 pairs of chromosomes in sponge gourd, while this map possesses 24 linkage groups, indicating the poor linkage among markers, for which small linkage groups can hardly form bigger linkage groups. In this study, a comprehensive genetic linkage map was constructed by using 177 EST-SSR markers. The map had a total coverage of 1436.12 cM and distributed on 14 linkage groups. Because of the inter-specific hybridization, the segregation distortion of molecular markers of sponge gourd was quite serious, with 48 pairs of markers deviating 1:2:1 (codominant markers) or 3:1 (dominant markers) (α = 0.05). Since the segregation distortion of alleles was closely related to hybrids sterility, molecular markers with segregation distortion weren't discarded during the construction of linkage map. Compared with the study of Cui et al. (2015), this map only selected specific molecular markers, and the map was almost twice as long as that reported by Cui et al. (2015), with more concentrated markers, less linkage groups and closer chromosome number to sponge gourd (2n = 26). To our knowledge, this map is the first genetic linkage map comprising specific molecular markers all over the world.
This research constructed a genetic linkage map consists of 177 EST-SSR markers distributed unevenly on linkage groups. Each linkage group only get a dozen markers or even several markers except LG1 having 49 markers. The reason for causing this situation could be the uneven gene distribution on chromosome (Lou et al., 2013; Kodama et al., 2014). There are more molecular markers in areas with more gene expression, while the less markers in heterochromatin areas with less gene expression. For genetic map alone, it may be not quite complete if using EST-SSR markers, but it is very efficient for genes/QTLs mapping since all those markers are derived from expressed sequences. In the early stage of developing molecular markers, we conducted transcriptome sequencing of samples mixing roots, stems, leaves, flowers, and fruits of sponge gourd, covering maximally expressed genes in all sponge gourd tissues, effectively avoiding space-time specificity of gene expression and ensuring the comprehensiveness of EST-SSR markers (Wu et al., 2014). EST-SSRs usually located in non-coding regions of Unigene, where sequences showed relative poor conservatism. Thus, when the PCR-amplified target sequences of 177 pairs of EST-SSR molecular markers were used to build the syntenic relationships with the genomic sequences of cucumber, melon and watermelon, most orthoglogs were obtained. While when Unigene sequences where markers located were used to conduct this syntenic analysis, orthoglogs could be found in almost all sequences. The results of syntenic analysis were quite complicated, indicating that sponge gourd was genetically distinct from cucumber, melon and watermelon, and during the long evolutionary process, incidents such as complex rearrangement inner or out of chromosomes.
As to Luffa genus, the flowering time of L. acutangula differs by nearly 12 h from L. cylindrica, so when the former blooms, the latter has withered away. In addition, pollinators usually get busy at a set period of time. Some pollinators are active in the late afternoon, while some of them are active in the early morning. Therefore, it is hardly possible for pollinators working in the late afternoons to carry pollens from L. acutangula to the stigma of L. cylindrical blossoming in the early mornings. This could be another reason that their hybirds could not be generated naturally. This is the result of long-term evolutionary selection in nature, which not only is an interesting natural phenomenon, but also hinders the gene flow between them by means of physical isolation, ensuring species identity. At present, the mechanisms of gene control over the flowering time have been explored in depth in model plants; many flowering-control related genes such as FT, HD1, HD3a, EHd1 have been cloned (Yano et al., 2000; Kojima et al., 2002; Doi et al., 2004; Rubio and Deng, 2007). A circadian clock–controlled flowering pathway in Arabidopsis thaliana consists of the genes GIGANTEA (GI), CONSTANS (CO), and FLOWERING LOCUS T (FT). GI is a main mediator between the circadian clock and CO, which is the master regulator of photoperiodic flowering time control CO upregulates the expression of “florigen” FT, thereby accelerating time required to flower. (Mizoguchi et al., 2005; Harmer, 2009; Xu et al., 2016) However, the studies have mainly concentrated on the rhythm of plant flowering in one years (flowering date, days from sowing to flowing or the first flowering time of plant), and the rhythm of plant flowering in 1 days (daily flowering time) is rarely studied. As to Luffa genus, there is about 12-h difference between the flowering times of L. acutangula and L. cylindrica, from which we can infer that they may are different in genes controlling the connection between circadian rhythm and flowering time. This provides valuable experimental materials for research concerning the daily flowering rhythm of plant. Recently, Cui et al. (2015) have located 8 QTL related to the flowering time of sponge gourd, among which the interpretable phenotypic variance of QTL ft1.1 reached to 24.61%. In our research, 2 QTL controlling flowering time have been located, in which the qFT1.2 could explain 22.71% of the PV. Unfortunately, it is hard to make a comparison between the two results because of the SRAP random primer markers used by Cui et al. (2015).
Hybrid sterility was one of the most common form of mechanisms of poszygotic isolation between species or subspecies, which led to genetic differentiation and speciation, and also contributed to the maintenance of species identity (Orr and Presgraves, 2000; Long et al., 2008). The Dobzhansky-Muller model of hybrid incompatibility indicated that hybrid sterility and inviability were caused by negative genetic interactions existing between loci that accumulated substitutions in diverging lineages (Dobzhansky, 1936; Doi et al., 2004; Moyle and Nakazato, 2010). A few interactive genes caused segregation distortion and hybrid incompatibility based on researches in animal models such as mice and Drosophila (Civetta and Gaudreau, 2015; Davies et al., 2016). According to studies in plants, hybrid sterility is one of the major forms of postzygotic reproductive isolation, and there are a few genes which are consistent with Dobzhansk-Muller model relating to reproductive isolation (Bomblies and Weigel, 2007; Bikard et al., 2009). Correlational studies in Arabidopsis and rice were conducted in depth, while seldom found in sponge gourd now. Our research identified 4 QTL relating to hybrid male sterility, and the effective value of two of them were more than 10%, which established the foundation for cloning relative hybrid sterility genes and exploring the mechanisms of hybrid sterility of sponge gourd.
The different flowering times and hybrid male sterility form two obstacles to the interspecies cross of L. acutangula and L. cylindrica, and beyond that, there are maybe other barriers such as female sterility and non-budding of hybrid seeds, which needs our further study in order to reveal the mechanism of interspecific differentiation of sponge gourd, contributing to the change of reproductive isolation in breeding practices and use of heterosis possessed by interspecific hybrid.
Author Contributions
HW conceived, organized and planned the research, data analysis, and drafted the manuscript. HG, XH, and SL contributed to linkage map construction and QTL analyses. ML, JC conducted the EST-SSR polymorphism tests. CZ, WH grew the plant materials and conducted trait measurements. TY conducted colinearity analysis between the sequences of EST-SSR markers and cucumber, melon and watermelon genome, respectively. JL participated in designing the experiments, organized and reviewed the manuscript. All authors read and approved the final manuscript.
Conflict of Interest Statement
The authors declare that the research was conducted in the absence of any commercial or financial relationships that could be construed as a potential conflict of interest.
The reviewer ZB and handling Editor declared their shared affiliation, and the handling Editor states that the process nevertheless met the standards of a fair and objective review.
Acknowledgments
We appreciate invaluable comments from Dr. Xiaoming He. Our sincere gratitude also goes to Xi Chen for assistance with manuscript editing. This work was funded by the National Natural Science Foundation of China (31401865), the Science and Technology Program of Guangdong Province (2012A020100006, 2013A0614 02002, 2013B060400040, 2014B020202006, 2014B020202007, 2014A0202090 55, 2016B070701010), the Science and Technology Program of Guangzhou of China (Construction interspecific chromosome segment introgression lines and excellent gene cloning in sponge gourd; 201607010071), National Modern Agricultural Technology System Construction Project (CARS-25-G-36) and Guangdong Academy of Agricultural Sciences, Institute of Vegetables, Director of the Fund Project (SUO-201403).
Supplementary Material
The Supplementary Material for this article can be found online at: http://journal.frontiersin.org/article/10.3389/fpls.2016.00980
Supplementary Material 1. Characterization of 405 EST-SSR primers developed in sponge gourd.
Supplementary Material 2. The result of colinearity analysis between the sequences of EST-SSR markers and cucumber genome.
Supplementary Material 3. The result of colinearity analysis between the sequences of EST-SSR markers and melon genome.
Supplementary Material 4. The result of colinearity analysis between the sequences of EST-SSR markers and watermelon genome.
References
Bassam, B. J., Caetano-Anollés, G., and Gresshoff, P. M. (1991). Fast and sensitive silver staining of DNA in polyacrylamide gels. Anal. Biochem. 196, 80–83. doi: 10.1016/0003-2697(91)90120-I
Bikard, D., Patel, D., Le Mette, C., Giorgi, V., Camilleri, C., Bennett, M. J., et al. (2009). Divergent evolution of duplicate genes leads to genetic incompatibilities within A. thaliana. Science 323, 623–626. doi: 10.1126/science.1165917
Bomblies, K., and Weigel, D. (2007). Hybrid necrosis: autoimmunity as a potential gene-flow barrier in plant species. Nat. Rev. Genet. 8, 382–393. doi: 10.1038/nrg2082
Chen, L., and Liu, Y. G. (2014). Male sterility and fertility restoration in crops. Annu. Rev. Plant Biol. 65, 579–606. doi: 10.1146/annurev-arplant-050213-040119
Civetta, A., and Gaudreau, C. (2015). Hybrid male sterility between Drosophila willistoni species is caused by male failure to transfer sperm during copulation. BMC Evol. Biol. 15:75. doi: 10.1186/s12862-015-0355-8
Cui, J., Cheng, J., Wang, G., Tang, X., Wu, Z., Lin, M., et al. (2015). QTL analysis of three flower-related traits based on an interspecific genetic map of Luffa. Euphytica 202, 45–54. doi: 10.1007/s10681-014-1208-z
Davies, B., Hatton, E., Altemose, N., Hussin, J. G., Pratto, F., Zhang, G., et al. (2016). Re-engineering the zinc fingers of PRDM9 reverses hybrid sterility in mice. Nature 530, 171–176. doi: 10.1038/nature16931
Diaz, A., Fergany, M., Formisano, G., Ziarsolo, P., Blanca, J., Fei, Z., et al. (2011). A consensus linkage map for molecular markers and quantitative trait loci associated with economically important traits in melon (Cucumis melo L.). BMC Plant Biol. 11:111. doi: 10.1186/1471-2229-11-111
Dobzhansky, T. (1936). Studies on Hybrid Sterility. II. Localization of Sterility Factors in Drosophila Pseudoobscura Hybrids. Genetics 21, 113–135.
Doi, K., Izawa, T., Fuse, T., Yamanouchi, U., Kubo, T., Shimatani, Z., et al. (2004). Ehd1, a B-type response regulator in rice, confers short-day promotion of flowering and controls FT-like gene expression independently of Hd1. Genes Dev. 18, 926–936. doi: 10.1101/gad.1189604
Garcia-Mas, J., Benjak, A., Sanseverino, W., Bourgeois, M., Mir, G., González, V. M., et al. (2012). The genome of melon (Cucumis melo L.). Proc. Natl. Acad. Sci. U.S.A. 109, 11872–11877. doi: 10.1073/pnas.1205415109
Guo, S., Zhang, J., Sun, H., Salse, J., Lucas, W. J., Zhang, H., et al. (2013). The draft genome of watermelon (Citrullus lanatus) and resequencing of 20 diverse accessions. Nat. Genet. 45, 51–58. doi: 10.1038/ng.2470
Harmer, S. L. (2009). The circadian system in higher plants. Annu. Rev. Plant Biol. 60, 357–377. doi: 10.1146/annurev.arplant.043008.092054
Hinchliffe, D. J., Turley, R. B., Naoumkina, M., Kim, H. J., Tang, Y., Yeater, K. M., et al. (2011). A combined functional and structural genomics approach identified an EST-SSR marker with complete linkage to the Ligon lintless-2 genetic locus in cotton (Gossypium hirsutum L.). BMC Genomics 12:445. doi: 10.1186/1471-2164-12-445
Huang, S., Li, R., Zhang, Z., Li, L., Gu, X., Fan, W., et al. (2009). The genome of the cucumber, Cucumis sativus L. Nat. Genet. 41, 1275–1281. doi: 10.1038/ng.475
Kodama, M., Brieuc, M. S., Devlin, R. H., Hard, J. J., and Naish, K. A. (2014). Comparative mapping between Coho Salmon (Oncorhynchus kisutch) and three other salmonids suggests a role for chromosomal rearrangements in the retention of duplicated regions following a whole genome duplication event. G3 (Bethesda) 4, 1717–1730. doi: 10.1534/g3.114.012294
Kojima, S., Takahashi, Y., Kobayashi, Y., Monna, L., Sasaki, T., Araki, T., et al. (2002). Hd3a, a rice ortholog of the Arabidopsis FT gene, promotes transition to flowering downstream of Hd1 under short-day conditions. Plant Cell Physiol. 43, 1096–1105. doi: 10.1093/pcp/pcf156
Krzywinski, M., Schein, J., Birol, I., Connors, J., Gascoyne, R., Horsman, D., et al. (2009). Circos: an information aesthetic for comparative genomics. Genome Res. 19, 1639–1645. doi: 10.1101/gr.092759.109
Liu, R. H., and Meng, J. L. (2003). MapDraw: a microsoft excel macro for drawing genetic linkage maps based on given genetic linkage data. Yi Chuan 25, 317–321. doi: 10.3321/j.issn:0253-9772.2003.03.019
Long, Y., Zhao, L., Niu, B., Su, J., Wu, H., Chen, Y., et al. (2008). Hybrid male sterility in rice controlled by interaction between divergent alleles of two adjacent genes. Proc. Natl. Acad. Sci. U.S.A. 105, 18871–18876. doi: 10.1073/pnas.0810108105
Lou, Q., He, Y., Cheng, C., Zhang, Z., Li, J., Huang, S., et al. (2013). Integration of high-resolution physical and genetic map reveals differential recombination frequency between chromosomes and the genome assembling quality in cucumber. PLoS ONE 8:e62676. doi: 10.1371/journal.pone.0062676
Mizoguchi, T., Wright, L., Fujiwara, S., Cremer, F., Lee, K., Onouchi, H., et al. (2005). Distinct roles of GIGANTEA in promoting flowering and regulating circadian rhythms in Arabidopsis. Plant Cell 17, 2255–2270. doi: 10.1105/tpc.105.033464
Morán, T., and Fontdevila, A. (2014). Genome-wide dissection of hybrid sterility in Drosophila confirms a polygenic threshold architecture. J. Hered. 105, 381–396. doi: 10.1093/jhered/esu003
Moyle, L. C., and Nakazato, T. (2010). Hybrid incompatibility “snowballs” between Solanum species. Science 329, 1521–1523. doi: 10.1126/science.1193063
Ng, T. B., Chan, W. Y., and Yeung, H. W. (1992a). Proteins with abortifacient, ribosome inactivating, immunomodulatory, antitumor and anti-AIDS activities from Cucurbitaceae plants. Gen. Pharmacol. 23, 579–590. doi: 10.1016/0306-3623(92)90131-3
Ng, T. B., Wong, R. N., and Yeung, H. W. (1992b). Two proteins with ribosome-inactivating, cytotoxic and abortifacient activities from seeds of Luffa cylindrica roem (Cucurbitaceae). Biochem. Int. 27, 197–207.
Ng, Y. M., Yang, Y., Sze, K. H., Zhang, X., Zheng, Y. T., and Shaw, P. C. (2011). Structural characterization and anti-HIV-1 activities of arginine/glutamate-rich polypeptide Luffin P1 from the seeds of sponge gourd (Luffa cylindrica). J. Struct. Biol. 174, 164–172. doi: 10.1016/j.jsb.2010.12.007
Oboh, I., and Aluyor, E. (2009). Luffa cylindrical-an emerging cash crop. Afr. J. Agric. Res. 4, 684–688. Available online at: https://www.researchgate.net/publication/228995436_Luffa_cylindrica-an_emerging_cash_crop
Orr, H. A., and Presgraves, D. C. (2000). Speciation by postzygotic isolation: forces, genes and molecules. Bioessays 22, 1085–1094. doi: 10.1002/1521-1878(200012)22:12<1085::AID-BIES6>3.0.CO;2-G
Partap, S., Kumar, A., Sharma, N. K., and Jha, K. K. (2012). Luffa cylindrica: an important medicinal plant. J. Nat. Prod. Plant Resour. 2, 127–134. Available online at: http://scholarsresearchlibrary.com/JNPPR-vol2-iss1/JNPPR-2012-2-1-127-134.pdf
Prakash, K., Pandey, A., Radhamani, J., and Bisht, I. S. (2013). Morphological variability in cultivated and wild species of Luffa (Cucurbitaceae) from India. Genet. Resour. Crop Evol. 60, 2319–2329. doi: 10.1007/s10722-013-9999-7
Rabei, S., Rizk, R. M., and Khedr, A. A. (2013). Keys for and morphological character variation in some Egyptian cultivars of Cucurbitaceae. Genet. Resour. Crop Evol. 60, 1353–1364. doi: 10.1007/s10722-012-9924-5
Ren, Y., Zhang, Z., Liu, J., Staub, J. E., Han, Y., Cheng, Z., et al. (2009). An integrated genetic and cytogenetic map of the cucumber genome. PLoS ONE 4:e5795. doi: 10.1371/journal.pone.0005795
Ren, Y., Zhao, H., Kou, Q., Jiang, J., Guo, S., Zhang, H., et al. (2012). A high resolution genetic map anchoring scaffolds of the sequenced watermelon genome. PLoS ONE 7:e29453. doi: 10.1371/journal.pone.0029453
Rubio, V., and Deng, X. W. (2007). Plant science. Standing on the shoulders of GIGANTEA. Science 318, 206–207. doi: 10.1126/science.1150213
Saghai-Maroof, M. A., Soliman, K. M., Jorgensen, R. A., and Allard, R. W. (1984). Ribosomal DNA spacer-length polymorphisms in barley: mendelian inheritance, chromosomal location, and population dynamics. Proc. Natl. Acad. Sci. U.S.A. 81, 8014–8018. doi: 10.1073/pnas.81.24.8014
Van Ooijen, J. W. (2006). JoinMap®4.0: Software for the Calculation of Genetic Linkage Maps in Experimental Populations. Wageningen: Kyazma BV. Available online at: https://dendrome.ucdavis.edu/resources/tooldocs/joinmap/JM4manual.pdf
Wang, S., Basten, C. J., and Zeng, Z. B. (2007). Windows QTL Cartographer 2.5. Raleigh, NC: Department of Statistics, North Carolina State University.
Wu, H., Gong, H., Liu, P., He, X., Luo, S., Zheng, X., et al. (2014). Large-scale development of EST-SSR markers in sponge gourd via transcriptome sequencing. Mol. Breed. 34, 1903–1915. doi: 10.1007/s11032-014-0148-6
Xu, D., Zhu, D., and Deng, X. W. (2016). The role of COP1 in repression of photoperiodic flowering. F1000Research 5:178. doi: 10.12688/f1000research.7346.1
Yang, J., Zhao, X., Cheng, K., Du, H., Ouyang, Y., Chen, J., et al. (2012). A killer-protector system regulates both hybrid sterility and segregation distortion in rice. Science 337, 1336–1340. doi: 10.1126/science.1223702
Keywords: sponge gourd, EST-SSR marker, genetic linkage map, QTL mapping, flowering time, pollen fertility
Citation: Wu H, He X, Gong H, Luo S, Li M, Chen J, Zhang C, Yu T, Huang W and Luo J (2016) Genetic Linkage Map Construction and QTL Analysis of Two Interspecific Reproductive Isolation Traits in Sponge Gourd. Front. Plant Sci. 7:980. doi: 10.3389/fpls.2016.00980
Received: 23 February 2016; Accepted: 21 June 2016;
Published: 07 July 2016.
Edited by:
Jianjun Chen, University of Florida, USAReviewed by:
Zhilong Bao, University of Florida, USAAnna Maria Mastrangelo, CRA-Centro di Ricerca per la Cerealicoltura, Italy
Copyright © 2016 Wu, He, Gong, Luo, Li, Chen, Zhang, Yu, Huang and Luo. This is an open-access article distributed under the terms of the Creative Commons Attribution License (CC BY). The use, distribution or reproduction in other forums is permitted, provided the original author(s) or licensor are credited and that the original publication in this journal is cited, in accordance with accepted academic practice. No use, distribution or reproduction is permitted which does not comply with these terms.
*Correspondence: Jianning Luo, amlhbm5pbmdsdW9Ab3V0bG9vay5jb20=