 Lasse Tarvainen
 Martina Lutz2
 Torgny Näsholm
 Göran Wallin
- 1Department of Forest Ecology and Management, Swedish University of Agricultural Sciences, Umeå, Sweden
- 2Department of Biological and Environmental Sciences, University of Gothenburg, Gothenburg, Sweden
Numerous studies have shown that temperate and boreal forests are limited by nitrogen (N) availability. However, few studies have provided a detailed account of how carbon (C) acquisition of such forests reacts to increasing N supply. We combined measurements of needle-scale biochemical photosynthetic capacities and continuous observations of shoot-scale photosynthetic performance from several canopy positions with simple mechanistic modeling to evaluate the photosynthetic responses of mature N-poor boreal Pinus sylvestris to N fertilization. The measurements were carried out in August 2013 on 90-year-old pine trees growing at Rosinedalsheden research site in northern Sweden. In spite of a nearly doubling of needle N content in response to the fertilization, no effect on the long-term shoot-scale C uptake was recorded. This lack of N-effect was due to strong light limitation of photosynthesis in all investigated canopy positions. The effect of greater N availability on needle photosynthetic capacities was also constrained by development of foliar phosphorus (P) deficiency following N addition. Thus, P deficiency and accumulation of N in arginine appeared to contribute toward lower shoot-scale nitrogen-use efficiency in the fertilized trees, thereby additionally constraining tree-scale responses to increasing N availability. On the whole our study suggests that the C uptake response of the studied N-poor boreal P. sylvestris stand to enhanced N availability is constrained by the efficiency with which the additional N is utilized. This efficiency, in turn, depends on the ability of the trees to use the greater N availability for additional light capture. For stands that have not reached canopy closure, increase in leaf area following N fertilization would be the most effective way for improving light capture and C uptake while for mature stands an increased leaf area may have a rather limited effect on light capture owing to increased self-shading. This raises the question if N limitation in boreal forests acts primarily by constraining growth of young stands while the commonly recorded increase in stem growth of mature stands following N addition is primarily the result of altered allocation and only to a limited extent the result of increased stand C-capture.
Introduction
Many studies, since the mid-1900's, have shown how addition of nitrogen (N) to boreal, coniferous forests results in sharply increased basal area increment rates (Tamm, 1956; Brix, 1971, 1983; Linder and Axelsson, 1982; Axelsson and Axelsson, 1986; Linder, 1987). This well-known effect of N addition is also evidence for the general notion that such forests are N-limited (e.g., Tamm, 1991). Two interacting processes can explain the higher aboveground growth rates following N addition; increased canopy-scale photosynthesis and shifts in partitioning between the above- and belowground carbon (C) pools. Canopy-scale photosynthetic enhancements can be achieved either by higher needle N contents, owing to the central importance of N for Calvin cycle and thylakoid proteins (Evans, 1989), or by production of additional leaf area or both. Thus, the balance between photosynthetic capacity and leaf area responses may have important implications on how N addition affects the needle- and canopy-scale light- and nitrogen-use efficiencies. Moreover, the relative contributions to the observed aboveground growth response by enhanced canopy-scale C capture and by C partitioning shifts will likely depend on both needle-scale photosynthetic performance responses and stand age. While N responses of boreal conifers have been extensively studied with respect to stand growth (e.g., Tamm, 1956; Axelsson and Axelsson, 1986; Linder, 1987; Lim et al., 2015) and short-term needle photosynthetic capacities (e.g., Kellomäki and Wang, 1997; Laitinen et al., 2000; Sigurdsson et al., 2002), surprisingly few studies have investigated the long-term canopy-scale, and within-canopy, photosynthetic performance responses to N fertilization based on observations made under field conditions (but see Brix, 1971; Linder and Axelsson, 1982). Rather, canopy-scale estimates of photosynthetic performance in temperate and boreal stands are commonly based on a relationship between leaf-scale photosynthetic capacity and leaf N content. The use of N as a scaling factor is supported by observational data showing photosynthetic capacity variation in response to foliar N contents (e.g., Evans, 1989; Reich et al., 1995; Kellomäki and Wang, 1997; Niinemets et al., 2001; Han et al., 2004; Wyka et al., 2012), and by theoretical calculations indicating that canopy-scale photosynthesis is maximized when N is allocated proportionally to photosynthetic photon flux density (Q) within the canopy (Field, 1983; Farquhar, 1989). However, this proportionality is not observed in natural canopies and various explanations have been offered for why the theoretically optimal pattern does not emerge. These include within-leaf N allocation patterns (Hikosaka and Terashima, 1995, 1996), limitations due to leaf morphology (Dewar et al., 2012), constraints on hydraulic capacity (Peltoniemi et al., 2012; Buckley et al., 2013), and the importance of model assumptions regarding the within-canopy variation in light availability and quality (Hikosaka, 2014, 2016). While modeling studies have shown optimal N allocation to have the ability to considerably increase the plant-scale C uptake in some cases (Hirose and Werger, 1987; Hollinger, 1996), the predicted differences in C uptake between observed and optimal N allocation patterns were small for hemi-boreal Picea abies growing under N-rich conditions (Tarvainen et al., 2013).
High N deposition rates may lead to unbalanced nutrient availabilities and the observed potential of phosphorus (P) to constrain leaf-scale photosynthetic capacity (Reich and Schoettle, 1988; Niinemets et al., 2001; Bauer et al., 2004; Bown et al., 2007; Reich et al., 2009; Walker et al., 2014; Ellsworth et al., 2015) suggests that some of the observed non-optimality in N allocation under N-rich conditions could be caused by insufficient foliar P contents. This possibility is supported by a recent Europe-wide study reporting deteriorating foliar P concentrations in response to N deposition for several species, including Pinus sylvestris (Jonard et al., 2015), and by reports of P limitation of ecosystem productivity (Peñuelas et al., 2013) and forest growth (Gradowski and Thomas, 2006; Prietzel et al., 2008; Braun et al., 2010) in regions commonly considered N-limited. Foliar P content has been included in some recent models of leaf-scale photosynthetic capacity (Domingues et al., 2010) and forest productivity (Mercado et al., 2011) developed for the tropical region where P limitation is thought to be common (Vitousek, 1984). However, foliar P contents are rarely reported from photosynthetic studies in boreal ecosystems (but see Reich et al., 2009; Tarvainen et al., 2013), perhaps due to the predominance of N-poor soils, and data of potential P effects on C assimilation are lacking from this region (Walker et al., 2014).
Leaf photosynthetic capacity could also become decoupled from foliar N content in response to increasing N allocation to non-photosynthetic compounds such as free amino acids with increasing N availability (Näsholm and Ericsson, 1990; Näsholm, 1994). Arginine synthesis has been suggested to detoxify leaf tissues of ammonia (Rabe and Lovatt, 1984, 1986) and, accordingly, arginine commonly dominates the needle free amino acid N pool in conifers growing under N-rich conditions (Näsholm and Ericsson, 1990; Nordin et al., 2001; Bauer et al., 2004). While arginine synthesis often occurs in response to low P availability, it may be caused by deficiencies in several macro- and micronutrients (Rabe and Lovatt, 1984) and has been argued to be a general response to growth reducing stresses rather than a response to the availability of any specific nutrient (Näsholm and Ericsson, 1990). Excess N may also be stored in photosynthetic compounds as suggested by Warren et al. (2003) who found in their study of temperate P. sylvestris that <7% of the total N was in free amino acids or amides, and suggested that Rubisco functioned as a storage protein for N in addition to its role in C assimilation. The importance of arginine as a long-term N store in needle tissues is reduced because arginine-bound N is not readily retranslocated during senescence and is instead lost from the tree (Näsholm, 1994). However, the weak responsiveness of photosynthetic capacity to N reported in conifers (Reich et al., 1995; Han et al., 2004; Wyka et al., 2012; Tarvainen et al., 2013) may in part be explained by N allocation to such non-photosynthetic compounds. Furthermore, if leaf-scale nitrogen-use efficiency (NUE) varies within the canopy in response to patterns in P allocation or arginine synthesis, accurate predictions of the effects of N deposition on stand-scale C cycling may require models to include these factors.
We studied how needle-scale photosynthetic capacity and long-term shoot-scale photosynthetic performance in strongly N-limited P. sylvestris trees responded to N fertilization. Furthermore, we assessed the within-canopy N and P allocation patterns under low and high N availabilities, and their potential impacts on canopy-scale C assimilation. We hypothesized that increased N availability would lead to (1) increased shoot-scale photosynthesis, (2) lower shoot-scale NUE, (3) less optimal within-canopy N allocation pattern with respect to maximizing canopy-scale C gain due to N-binding to non-photosynthetic compounds and a greater limitation of photosynthesis by P deficiency in the upper canopy, and further that (4) canopy-scale C uptake may become substantially limited by P and arginine synthesis following N addition on N-poor boreal stands.
Materials and Methods
Site Description
This study was carried out in northern Sweden at Rosinedalsheden experimental forest (64° 10′N, 19° 45′E, 145 m a.s.l.) in August 2013. The experimental site was established for studies of the effects of N addition on stand-scale C cycling under N-poor boreal conditions. The homogeneous P. sylvestris forest was regenerated from seed trees in the 1920's and the stand was approximately 90-years-old at the time of the current study. Here we use data from the 15 ha control and high-N plots, one of each, within the experiment. The ambient N deposition rate at the site is < 5 kg N ha−1 yr−1 (Högberg et al., 2010). The high-N plot was annually fertilized with NH4NO3 corresponding to 100 kg N ha−1 yr−1 between 2006 and 2011, and 50 kg N ha−1 yr−1 from 2012 onwards. The fertilizer also included Ca (5%), Mg (2.4%) and B (0.2%) (Lim et al., 2015). The mean annual temperature and precipitation at Svartberget research station located within 8 km of the studied plots were 1.8°C and 614 mm, respectively, in 1981–2010 (Laudon et al., 2013). The weakly podzolised fine sandy soils have a thin (2–5 cm) organic layer and a C:N ratio of approximately 40 (Hasselquist et al., 2012).
The stand densities at the control and fertilized plots were 1010 ± 125 and 857 ± 83 trees ha−1 (mean ± SD) in 2013, respectively. The mean tree height in 2013 was 17.5 ± 0.0 m (mean ± SD) at the control plot compared to 16.6 ± 0.2 m at the fertilized plot, and the leaf area index c. 2.7 on the control plot and c. 3.1 at the fertilized plot (Lim et al., 2015). Based on dry mass, current-year needles accounted for approximately 29 and 37%, 1-year-old needles 33 and 40%, and 2-year-old needles 24 and 17% of the total needle biomass, at the control and fertilized plots, respectively. The oldest needles at both plots were 4 years old. The stands and the understory are described in more detail in Lim et al. (2015) and Hasselquist et al. (2012), respectively.
Photosynthetic Capacity Measurements
Needles were accessed using 16 m tall scaffolding towers located near the centers of the experimental plots. At each plot photosynthetic responses to intercellular CO2 concentration (A-Ci curves) were determined at three canopy levels in four dominant and co-dominant trees, growing within 10 m of each other. In the upper canopy measurements were made on current-year, 1-year-old and 2-year-old needles; in the middle and lower canopy only current-year and 1-year-old needles were measured. The A-Ci curves were determined from five attached fascicles (10 needles) using a LI-6400 Portable Photosynthesis System (Li-Cor Biosciences, Lincoln, NE, U.S.A.), with the standard 2 × 3 cm chamber and a light source (6400-02B LED Light Source), running in energy balance mode. To avoid mutual shading, the needles were separated and fixed in a horizontal plane at both ends using black PVC tape prior to insertion in the measurement chamber. Before each individual measurement series leaks were tested for by breathing around the chamber and monitoring the [CO2] inside it. The response of net photosynthesis (An) to photosynthetic photon flux density (Q) was measured after a period of dark acclimation for Q ranging from 0 to 1500 μmol m−2 s−1 with [CO2] set to 400 μmol mol−1. The CO2 response of An was measured immediately following the light response measurement for a [CO2] range from 60 to 2000 μmol mol−1 with Q set to 1500 μmol m−2 s−1. The A-Ci and the light response curves were determined at 20°C for all shoots.
Apparent quantum yield (α) was determined using the response of An to Q in the 30–75 μmol m−2 s−1 range. The photosynthetic capacity parameters (the maximum rate of ribulose bisphosphate saturated carboxylation, Vcmax, the maximum photosynthetic electron transport rate, Jmax, and the rate of triose phosphate utilization, TPU) were estimated from the A-Ci curves as described in Tarvainen et al. (2013). Briefly, the model by Farquhar et al. (1980), including TPU limitation (as in Sharkey et al., 2007) was modified to estimate the capacity parameters based on Ci rather than chloroplast CO2 concentrations. In all analyses, data points with Ci below 100 μmol mol−1 were assigned Vcmax-limited. For the Jmax calculations, the value of the quantum yield of electron transport was set to 0.3 (Long et al., 1993) and the parameter representing the curvature of the light response to 0.9. The temperature response functions of the photosynthetic CO2 compensation point and Michaelis-Menten coefficients of Rubisco were taken from Bernacchi et al. (2001) and the temperature response functions of Bernacchi et al. (2001, 2003) were used to scale the capacity parameters to 25°C in order to facilitate comparison with previously reported values. Because no indication of TPU limitation was found for any of the measured shoots (data not shown), only Vcmax and Jmax were considered in subsequent analyses of needle photosynthetic capacities and their responses to foliar nutrient contents.
Continuous Gas Exchange Measurements
Each plot was equipped with a custom-made multi-channel gas exchange system with an infrared gas analyzer (CIRAS-1 PP Systems, Hitchin Herts, UK) running in open mode (Wallin et al., 2001). Shoot-scale CO2 and H2O exchanges were measured continuously at each plot on two of the trees included in the photosynthetic capacity measurements. The measurements were made on 1-year-old attached shoots located at three canopy levels (in total 12 shoots, six per plot), near the shoots used for the capacity measurements. Shoot segments (55 mm) were inserted in temperature-controlled cuvettes modified for P. sylvestris (Image S1). The tubing connecting the cuvettes and the analyzers was insulated and heated. In order to avoid condensation within the cuvettes their temperatures were kept on average 0.2°C above the ambient by Peltier heat exchangers. The shoot-incident Q was measured with leveled quantum sensors [PAR-1(M), PP Systems, Hitchin Hertz, UK] placed within 5 cm of the shoot. The cuvettes were constructed from transparent Plexiglas that transmitted c. 90% of the incident Q (Hall et al., 2013). Shoot-scale An and Ci were determined using the equations of von Caemmerer and Farquhar (1981). Thus, both estimates were influenced by the respiration of woody twig. Two types of measurement cycles were run during the experiment and each shoot position was measured either for 30 s after a flow stabilization period of 270 s once every 30 min, or for 420 s after a stabilization period of 780 s once every 120 min. At a given time, the cycle times were the same for all cuvettes at one plot, but differed between the plots. The data used in the current study were collected between 1st and 31st of August 2013, and the estimates of mean long-term gas exchange rates were based on days with less than 10% gaps in the daily data set (56% of data).
The continuously measured data were used to calculate the long-term light-use efficiency (LUE) defined as mean An divided by mean Q, with the Q observation by the cuvette sensor multiplied by 0.9 to account for transmission losses through the cuvette wall. The long-term nitrogen- and phosphorus-use efficiencies (NUE and PUE, respectively) were defined as mean An divided by N or P per projected needle area, Na or Pa (in g nutrient m−2 needle) respectively. Thus, LUE is expressed as mol CO2 mol−1 photons and NUE and PUE as mol CO2 g−1 N s−1 and mol CO2 g−1 P s−1, respectively.
Determination of Needle Properties
The needles from the capacity and continuous measurements were harvested in August and November of 2013, respectively. The projected needle areas were determined using a flatbed scanner (Epson 1600+ equipped for dual scanning) and WinSEEDLE Pro 5.1a (Regent Instruments Inc., Quebec City, Canada) analysis software. The needle segments (20 mm) used in capacity measurements were cut along the edges of the tape holding them in place, and the needles used in the continuous measurements were detached from the shoot axis prior to scanning. The needle dry mass was determined after drying to constant weight at 70°C and an elemental analyzer (EA 1108, Fison Instruments, Rodano, Italy) was used to determine the mass-based needle N contents (Nm). Needle total Kjeldahl P contents were determined using Seal AutoAnalyzer HR 3 (Seal Analytical, Nordstedt, Germany; method G-189-97). The foliar nutrient contents of P. sylvestris exhibit some seasonality (Tamm, 1955; Näsholm and Ericsson, 1990). Therefore, Nm and the mass-based needle P contents (Pm) of the continuously measured needles, sampled later in the year, were expected to be greater than those of the needles used in the capacity measurements, although the two sets of needles likely had similar foliar nutrient contents in August. Furthermore, P. sylvestris needles tend to rotate around their axis and, thus, using whole needles for determining the leaf mass per projected needle area (LMA) results in greater estimates of LMA, Na, and Pa than analyses using shorter needle segments. This effect was quantified in a separate analysis that showed that LMA, Na, and Pa estimated for such segments were 12.5 ± 2.6% (n = 6) lower than for whole needles (Table S1).
In order to assess the within-canopy and age-related variation in arginine N, and its fraction of total needle N, an additional needle sampling on the studied trees was carried out in October 2014. Needles were collected from positions adjacent to those of the shoots used for capacity measurements the year before and stored at −20°C prior to analysis of their amino acid contents by reverse-phase liquid chromatography using a Waters Ultra High Performance (UPLC) system with a Waters Tunable UV detector (Waters, Corporation, Milford, MA, U.S.A.) following the procedure described in Inselsbacher et al. (2011). Needle N contents excluding arginine N were estimated assuming that the fractions of arginine N of total needle N at the studied canopy levels were equal in 2013 and 2014.
The light climate of each shoot used in the photosynthetic capacity measurements is expressed as diffuse non-interceptance (openness) at the shoot location measured using LAI-2200 Plant Canopy Analyzer (Li-Cor Biosciences, Lincoln, Nebraska). The LAI-2200 was run in two sensor mode with one of the sensors placed above the canopy. The vertical variation in openness is shown in Supplementary material (Figure S1).
Data Analysis and Statistics
Because the overall experimental design consisted of non-replicated plots centered on eddy-covariance flux measurement towers and due to the need of scaffolding towers for crown access, the measured trees were not randomly selected. While this raises concerns regarding pseudo-replication (Hurlbert, 1984) in response to potential between plots differences prior to the initial fertilizer application, the aim of the current experiment was to understand the photosynthetic constraints of P. sylvestris trees with strongly differing foliar N contents growing in the field under otherwise comparable environmental conditions rather than to study treatment effects on the stand-scale per se.
All statistical analyses were carried out in IBM SPSS Statistics 20 (IBM Corporation, Armonk, NY, U.S.A.). A three-way repeated measures ANOVA (RMA) with needle age and canopy position as within-subjects factors and fertilizer treatment (plot) as a between-subjects factor was utilized to detect significant differences (P < 0.05) in needle photosynthetic, structural and chemical properties. Shapiro-Wilk's and Mauchly's tests were performed to test the data for normality and sphericity, respectively. When the sphericity assumption was met the factor effects were evaluated based on the multivariate tests (Wilks' lambda), and if this assumption was violated the degrees of freedom were corrected using Greenhouse-Geisser estimates of sphericity. In cases where the needle properties of 2-year-old needles were measured only in the upper canopy (see Tables 1, 2), this age class was excluded from the analyses by three-way RMA. Separate tests with two-way RMA, with fertilizer treatment and age as factors, were used to evaluate the effects of needle age, including all three age classes, on the measured needle properties in the upper canopy. In cases where significant interactions between two factors were detected by RMA, tests of simple main effects were carried out to assess the responses to the individual factors. Bonferroni corrections were applied to post-hoc analyses of the effects of canopy position and needle age when appropriate.
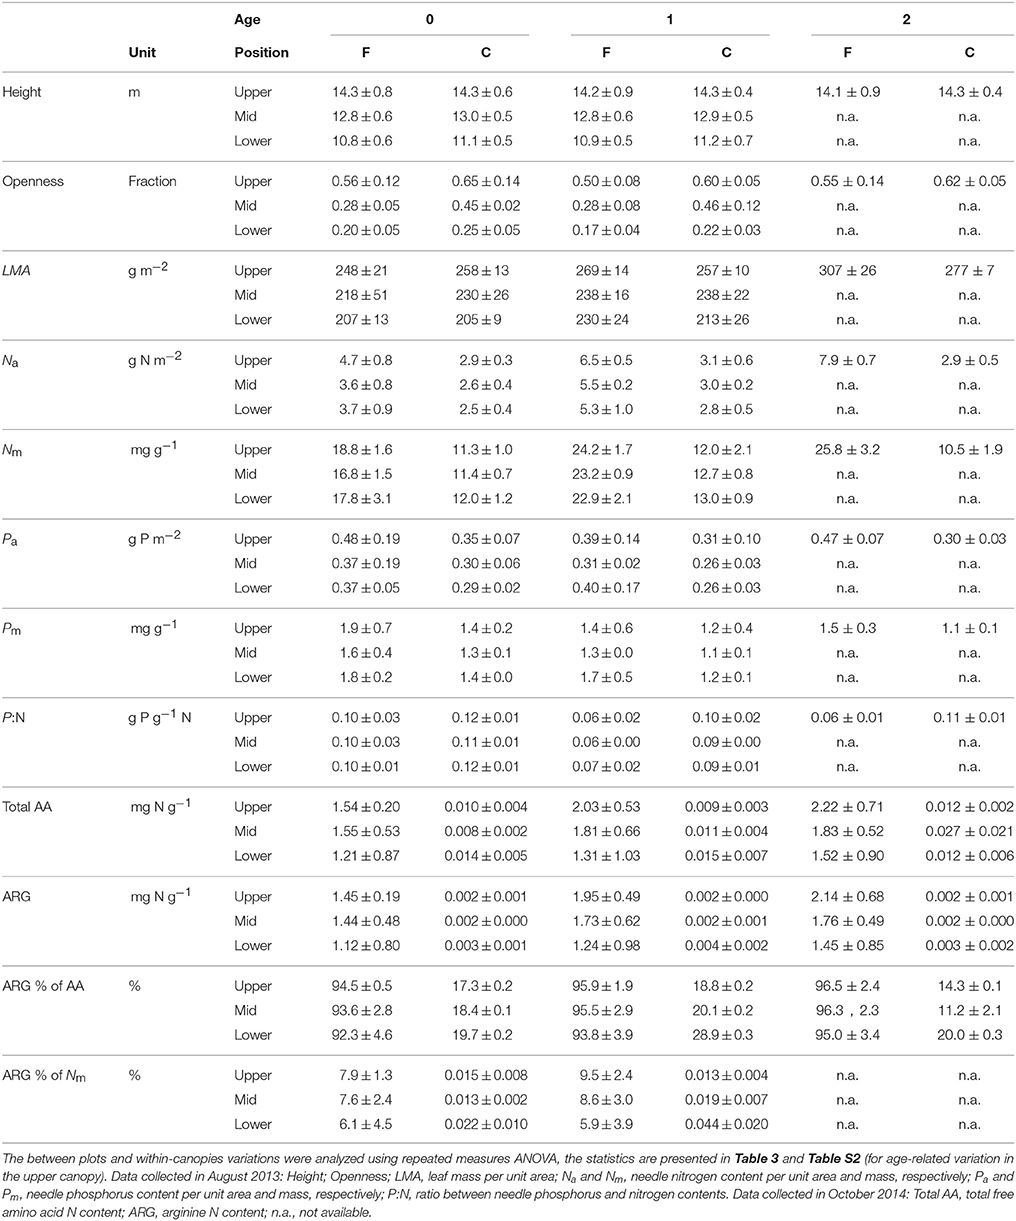
Table 1. Needle properties in relation to canopy position and age (years) in the Pinus sylvestris shoots used for photosynthetic capacity measurements at the fertilized (F) and control (C) plots (Mean ± SD, n = 3–4).
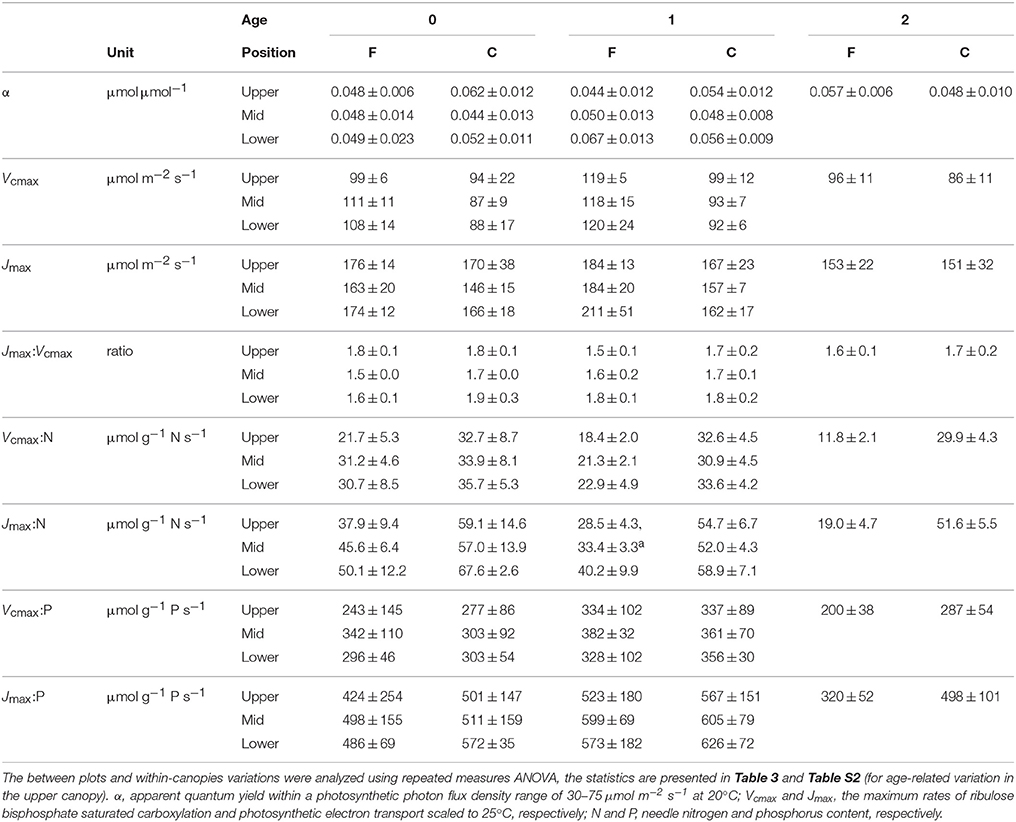
Table 2. Needle photosynthetic capacity in relation to canopy position and age (years) in the Pinus sylvestris shoots used for photosynthetic capacity measurements at the fertilized (F) and control (C) plots in August 2013 (Mean ± SD, n = 3–4).
The photosynthetic capacity responses to needle nutrient contents were evaluated by regression analyses based on: (i)Na, (ii)Pa, (iii)Na and Pa, (iv) area-based needle N content excluding arginine N (Nax), and (v)Nax and Pa. When both N and P were included (i.e., cases iii and v), the co-dependencies of N and P were determined by multiple linear regression analysis that also included the N*P interaction term. Because fertilizer application was expected to affect the relationships between N, P and photosynthetic capacity parameters, the multiple regression analyses were carried out separately for each plot. Regression analyses were also used to investigate the between plots differences in the long-term shoot-scale photosynthetic performance responses to environmental variables and needle properties. The differences between the regression slopes and intercepts were evaluated using ANCOVA. If the relationship between the dependent and independent variables was non-linear data were log-log transformed prior to the ANCOVA analysis.
Modeling of the Long-Term Photosynthetic Performance
The shoot-scale An was modeled based on the approach by Farquhar et al. (1980) as described in e.g., Harley et al. (1992), Medlyn et al. (2002), and Walker et al. (2014). According to this approach An can be estimated based on the minimum of the two rates, Rubisco activity (Wc) and Ribulose-1,5-bisphosphate (RuBP) regeneration (Wj), limiting the gross carboxylation rate, the CO2 compensation point (Γ*), Ci and mitochondrial respiration (Rd):
The Rubisco-limited gross carboxylation rate, Wc, is described as:
where Kc and Ko are the Michelis-Menten coefficients of Rubisco for CO2 and O2, respectively, and Oi is the intercellular O2 concentration. The RuBP regeneration-limited gross carboxylation rate, Wj, is described as:
where J is the rate of electron transport that is related to Q:
where αe is the apparent quantum yield of electron transport, assumed to be 0.24 mol electrons mol−1 photons (Harley et al., 1992).
The model was initially parameterized for 1-year-old needles utilizing plot specific data to test if model predictions of the long-term An were reasonable compared to the observations. Because no significant within-canopy capacity differences were detected (Tables 2, 3), canopy averages of Vcmax and Jmax were used. Dark respiration (Rd), at 0°C, and its temperature response were determined from the continuous shoot-scale measurements made when Q was below 2 μmol m−2 s−1. The Rd value, thus, includes the respiration from the woody twig but does not account for the reduction in respiration rates in light (e.g., Way and Yamori, 2014). The model was driven with needle temperature, Q and Ci data from the continuous measurements. As for the LUE calculation, the observed incident Q value was multiplied by 0.9 to account for the loss of light due to transmission through the cuvette walls. Occasionally condensation, and subsequent evaporation, of water in the tubing caused the Ci estimates to be in error; therefore data was excluded from the modeling when the Ci:Ca ratio was < 0.2 or > 1.2 (c. 10% of the data removed). These cut-off Ci:Ca ratios were determined from the LI-6400 derived light response curves, with the lower boundary corresponding to the minimum Ci:Ca ratio at light saturation and the upper boundary to the maximum Ci:Ca ratio in darkness.
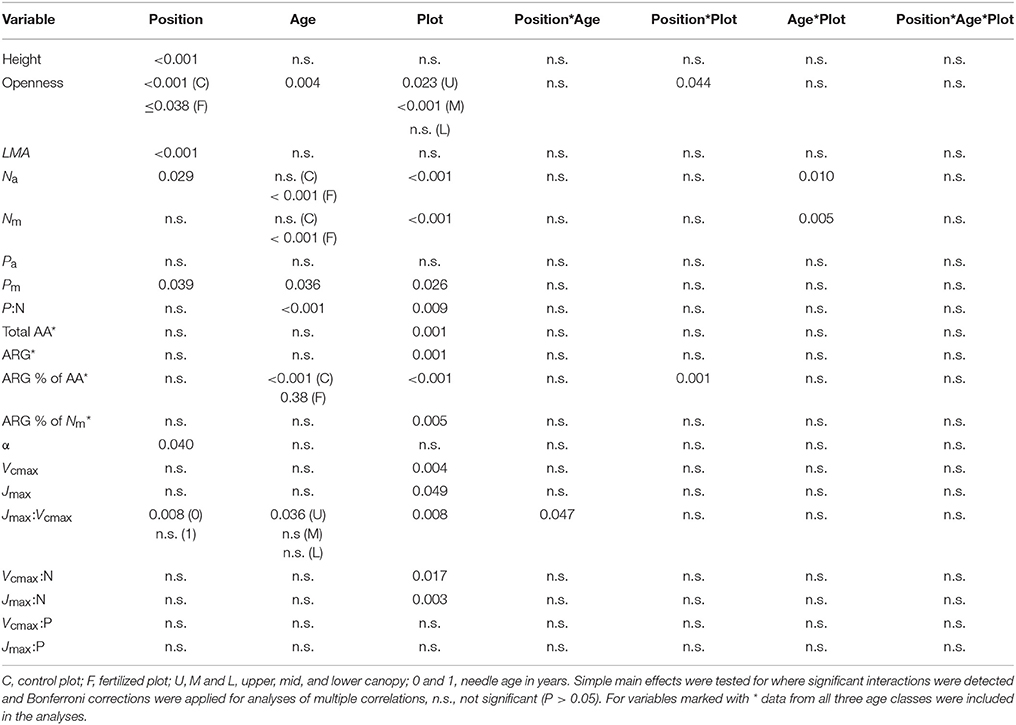
Table 3. Repeated measures ANOVA statistics for between plots and within-canopies variation in the needle properties of current-year and 1-year-old shoots presented in Tables 1, 2.
To determine the potential limitation of long-term An by foliar P deficiency and N binding to arginine, the model was run for the two continuously measured upper canopy shoots at the fertilized plot. In the first run the upper canopy mean Vcmax and Jmax from the capacity measurements on fertilized needles were used together with the continuously observed needle temperature, Q and Ci data. In the second run Vcmax and Jmax were estimated by extrapolating the Na dependencies of Vcmax and Jmax observed at the control plot (Figures 1A,C) to the mean Na of the fertilized upper canopy needles used for the capacity measurements, 6.5 g N m−2. Finally, the model was also run with Vcmax and Jmax estimated specifically for the two continuously measured fertilized upper canopy shoots, both with 7.6 g N m−2 when harvested in November.
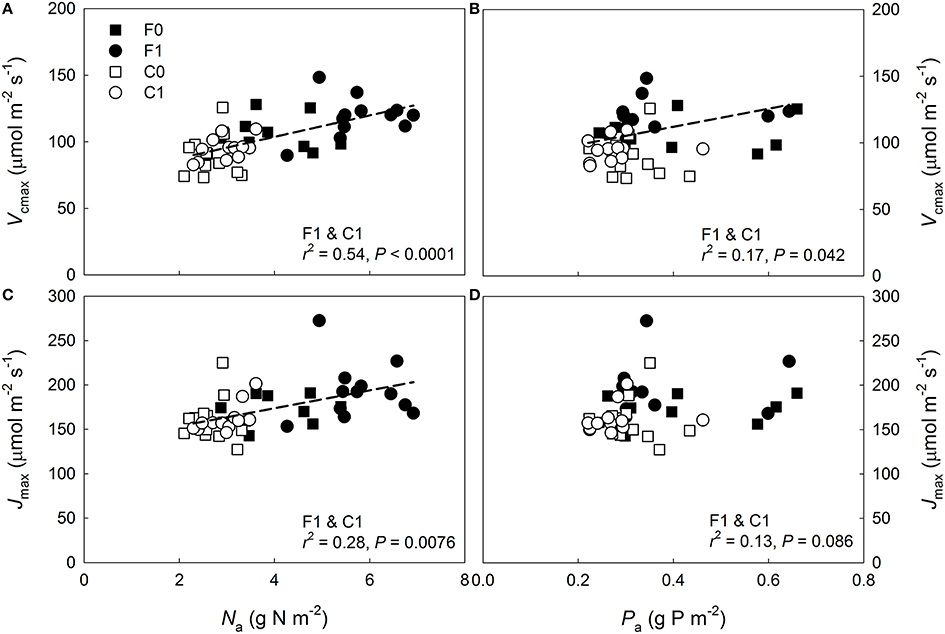
Figure 1. Photosynthetic capacity vs. needle nitrogen and phosphorus content per surface area (Na and Pa) in Pinus sylvestris. Variation in (A) maximum carboxylation rate (Vcmax) at 25°C with Na, (B) Vcmax at 25°C with Pa, (C) maximum electron transport rate (Jmax) at 25°C with Na, and (D) Jmax at 25°C with Pa. Control plot (C) = open symbols, fertilized plot (F) = filled symbols, squares = current-year needles, circles and dashed lines = 1-year-old needles.
Results
Variation in Needle Properties in Response to Nitrogen Addition, Canopy Position, and Age
The observations of the light climate (openness) of the shoots used in the photosynthetic capacity measurements suggest that the upper canopy needles received on average at least three times as much diffuse light than the lower canopy needles (Table 1). The continuous measurements, which integrated diffuse and direct light, showed that light availability varied considerably among the canopy positions with the average daily integrated Q ranging from 5.2 mol m−2 d−1 to 23.4 mol m−2 d−1 at the control plot and from 2.9 mol m−2 d−1 to 30.0 mol m−2 d−1 at the fertilized plot (Figure 3, x-axes). Trees growing at the fertilized plot exhibited significantly greater Na and Nm, as expected, but also greater Pm and lower P:N ratios than the trees at the control plot, while Pa did not vary significantly between the plots (Tables 1, 3). The RMA analysis indicated canopy position to be a significant main effect for LMA, Na and Pm with LMA and Na increasing from the lower to the upper canopy. The 1-year-old needles had greater Na and Nm, but lower Pm and P:N ratios than the current-year needles (Tables 1, 3). Significant age*plot interactions were found for Na and Nm, reflecting the lower needle N content in current-year needles compared to the 1-year-old needles at the fertilized plot (Tables 2, 3). Furthermore, significantly more of the total needle N, 6–10%, was bound to free amino acids, mostly arginine, at the fertilized plot, while < 0.05% of the total needle N was in free amino acids at the control plot (Tables 1, 3).
Apparent quantum yield (α) of the needles did not vary significantly with N availability or age, but was higher in lower than mid-canopy (Tables 2, 3). Both Vcmax and Jmax were significantly higher at the fertilized than at the control plot. Furthermore, no significant age-related or vertical within-canopy variations in Vcmax or Jmax were detected for the current-year and 1-year-old needles (Tables 2, 3). However, in the upper canopy the 1-year-old needles had significantly higher Vcmax than the 2-year-old needles (Table S2). The Jmax: Vcmax ratios were higher at the control plot and also exhibited a significant interaction between needle age and canopy position with low values in the current-year mid-canopy needles (Tables 2, 3).
Photosynthetic Capacity Responses to Nitrogen, Phosphorus, and Temperature
When data from both plots were pooled a significant increase in Vcmax with both Na and Pa was detected for the 1-year-old needles (Figures 1A,B), while the Jmax of the 1-year-old needles increased significantly with Na but not with Pa (Figures 1C,D). The relationships between capacity parameters and Na or Pa were not significant for the current-year needles at either plot (Figures 1A–D, P ≥0.13). When data was divided into groups based on plot and age, no significant relationships were found between the capacity parameters and Pa (Figures 1B,D, P = 0.37). The Jmax of 1-year-old needles increased significantly with Na at the control plot (r2 = 0.44, P = 0.02) but not at the fertilized plot (r2 < 0.01, P = 0.89), while Vcmax of the 1-year-old needles did not vary significantly with Na at either plot (fertilized plot: r2 = 0.04, P = 0.52, control plot: r2 = 0.25, P = 0.10). Expressing needle N content without arginine bound N did not improve the linear regression fits (P = 0.91, data not shown). Both Vcmax:N and Jmax:N were significantly greater at the control plot, while rate of return for P investment did not vary significantly between the plots (Tables 2, 3). The relationships between photosynthetic capacity parameters and foliar N or P contents were not affected by needle age or canopy position (Tables 2, 3).
The predictions of the Vcmax of 1-year-old shoots improved following the inclusion of the P and the N*P parameters at the fertilized plot (Figure 2A) but not at the control plot (Figure 2B). The importance of including P and N*P in Jmax predictions was especially clear at the fertilized plot where the prediction based on Na alone was unable to explain the observed variation, whereas including P and N*P in the regression model resulted in a strong correlation between the measured and the modeled values (Figure 2C). At the control plot, despite Jmax being significantly related to Na alone, including P and N*P also improved the Jmax predictions (Figure 2D). The accuracy of the capacity predictions for the current-year needles was unaffected by the inclusion of P and N*P for both age classes and plots (Figure S2). Although using Nax rather than Na in the multiple regression analyses increased the r2 value of the correlation between the modeled and the measured Vcmax of the 1-year-old needles at the fertilized plot from 0.56 to 0.77, no statistically significant improvements in the capacity predictions were detected at either plot or for either age class when N was expressed as Nax instead of Na (P = 0.31, data not shown).
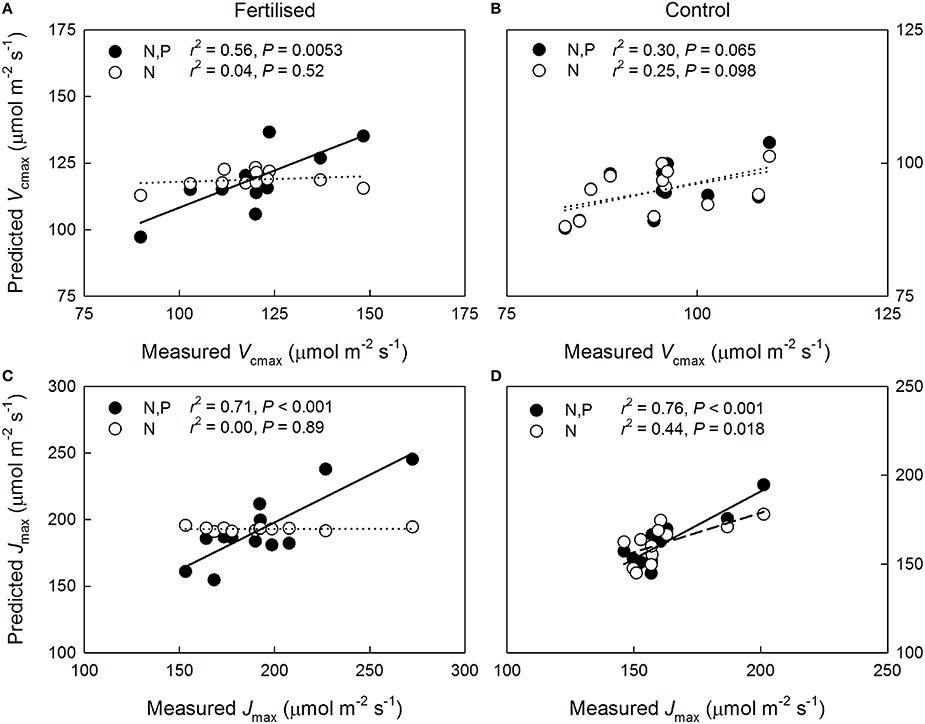
Figure 2. Relationship between predicted and measured maximum carboxylation rate (Vcmax) and maximum electron transport rate (Jmax) at 25°C in 1-year-old Pinus sylvestris needles based on (i) needle nitrogen content per unit area, Na, (N: open circles, dashed lines) and (ii) Na and needle phosphorus content per unit area, Pa, (N, P: filled circles, solid lines). Sub-figures: Vcmax on the (A) fertilized and (B) control plots; Jmax on the (C) fertilized, and (D) control plots. Dotted lines, non-significant relationships.
Long-Term Shoot-Scale Carbon Uptake
The vertical variation in the needle properties is described with respect to daily mean shoot-incident Q measured in August 2013 (Table 4), because the small sample size (n = 2–3) precluded using analysis of variance (Table S1). Leaf mass per area and Na increased significantly with Q at both plots whereas significant Pa increase was detected only at the fertilized plot. When nutrient contents were expressed on per mass basis they did not vary significantly with light availability at either plot.
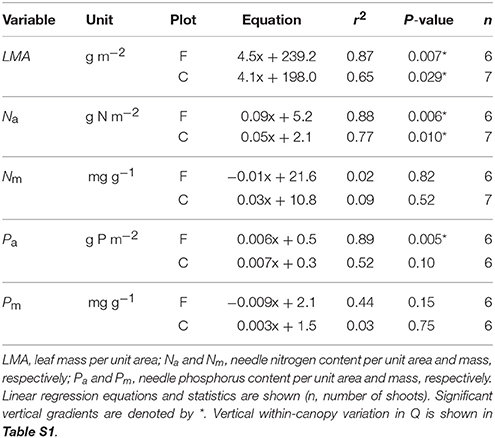
Table 4. Needle properties in relation to mean shoot-incident photosynthetic photon flux density (Q, μmol m−2 d−1) in 1-year-old Pinus sylvestris shoots used in continuous shoot-scale net gas exchange measurements at the fertilized (F) and control (C) plots in August 2013.
Shoot-incident Q declined more rapidly than Na through the canopy at both plots (Figure 3A). Overall more N was allocated to the needles per intercepted Q at the fertilized plot (P < 0.001) but the within-canopy variation was similar between the plots (P = 0.16). Shoot-scale LUE increased non-linearly with decreasing mean Q at both plots (Figure 3B). No significant between plots differences were detected in the LUE responses to Q (P = 0.63), or in LUE in general (P = 0.72), indicating that the long-term needle area-based photosynthetic performance between the plots was similar when light availability was accounted for. Because the light availability also was similar between the plots (Figure 4A), the long-term shoot-scale mean daily integrated An did not differ significantly between the plots (Figure 4B, P = 0.96). Moreover, the daily integrated An scaled significantly (Figure 4B) and similarly (P = 0.96) with daily integrated Q at both plots. Nitrogen-use efficiency increased significantly with light availability at both plots (Figure 3C) and the slopes of the NUE responses to Q were similar between the plots (P = 0.17). Furthermore, the non-significant difference in the regression intercepts indicated that there was no treatment effect on shoot-scale NUE (P = 0.052). Like NUE, PUE increased significantly with mean Q at both plots (Figure 3D). No significant differences were detected for the intercepts or the slopes of the regressions suggesting that N-addition did not affect either the overall shoot-scale PUE (P = 0.26) or the PUE responses to Q (P = 0.50).
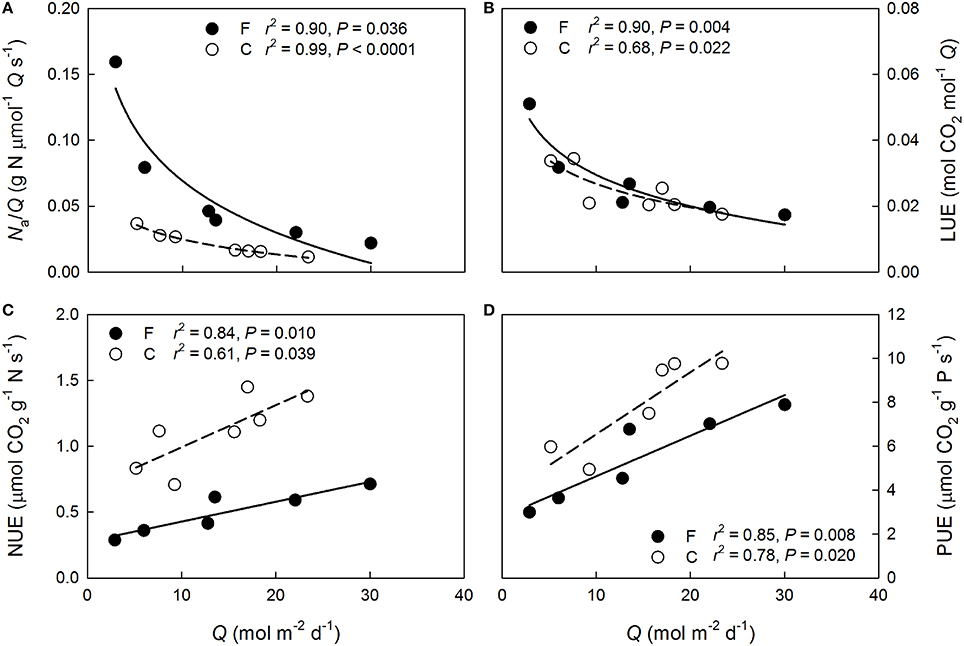
Figure 3. Variation with daily mean shoot-incident photosynthetic photon flux density (Q) in (A) needle N allocation per long-term mean incident light intensity (Na/Q), (B) light-use efficiency (LUE), (C) nitrogen-use efficiency (NUE), and (D) phosphorus-use efficiency (PUE) of 1-year-old Pinus sylvestris shoots within the fertilized (filled circles, solid lines) and the control (open circles, dashed lines) canopies in August 2013.
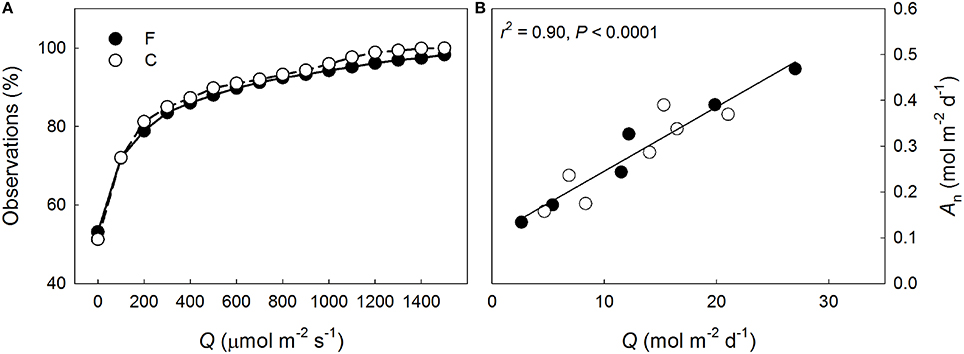
Figure 4. (A) Cumulative percentage of incident photosynthetic photon flux density (Q) measured adjacent to the continuously measured Pinus sylvestris shoots at the fertilized (F, filled symbols) and the control (C, open symbols) plots, and (B) the daily mean integrated shoot-scale net photosynthetic performance (An) in relation to daily mean Q at F and C observed in August 2013. The regression line and statistics in (B) are shown for the pooled data.
Limitation of Long-Term Photosynthetic Performance
The data used in the performance modeling are summarized in Table 5. While the model generally underestimated the observed long-term shoot-scale An, it performed qualitatively well exhibiting a slope of 1.0 (for data pooled from both plots) when canopy average Vcmax, Jmax and shoot specific environmental drivers were used (Figure 5). Notably, there was a tendency toward a greater variance in the model performance in the upper canopy shoots with the model producing overestimates in some cases.
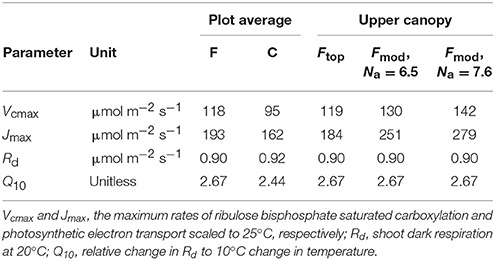
Table 5. Parameters used for modeling the per unit leaf area needle photosynthetic performance of Pinus sylvestris on the fertilized (F) and control (C) plots.
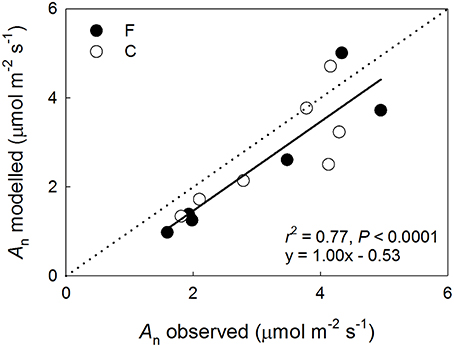
Figure 5. Modeled vs. observed net photosynthetic performance (An) of Pinus sylvestris shoots at the fertilized (F, filled symbols) and the control (C, open symbols) plots in August 2013. The regression line and statistics are shown for the pooled data.
When the model was parameterized specifically for upper canopy shoots at the fertilized plot, the predictions were also reasonable being c. 7% lower than the observations (0.37 ± 0.08 mol CO2 m−2 d−1 vs. 0.40 ± 0.04 mol CO2 m−2 d−1 [mean ± SD], respectively; n = 2 for both estimates). The second model run estimated the potential limitation of upper canopy long-term An by P deficiency and N allocation to arginine. The non-limited capacity estimates were obtained by extrapolating the capacity-Na relationship observed at the control plot (Figure 1) to the mean Na observed in the needles used in the capacity measurements, 6.5 g N m−2 s−1 (Table 1). Based on these capacity estimates and the continuously observed Q, needle temperature and Ci, the model predicted a non-limited An of 0.41 ± 0.09 mol CO2 m−2 d−1 (mean ± SD), suggesting a c. 10% mean reduction in long-term An for the two shoots due to capacity limitations. When the model was run using capacity estimates based on the observed upper canopy Na from the November harvest of the long-term measured shoots, 7.6 g N m−2 s−1, the predicted An was 0.43 ± 0.09 mol CO2 m−2 d−1, indicating a potential performance limitation of c. 13.5%.
Discussion
Boreal conifers are commonly considered N-limited (e.g., Tamm, 1991). Therefore, it would be reasonable to expect significant shoot-scale photosynthetic performance responses when N is added to such stands. The results of the current study, however, suggest that the aboveground growth response following N fertilization of mature stands (Tamm, 1956; Brix, 1971, 1983; Linder and Axelsson, 1982; Axelsson and Axelsson, 1986; Linder, 1987; Lim et al., 2015) reflects changes in C allocation patterns rather than any enhancements in long-term C uptake per unit leaf area. Furthermore, the reduced C allocation to root biomass following N fertilization (e.g., Lim et al., 2015) could negatively feedback to long-term foliar C uptake through reductions in tree-scale uptake of water and essential nutrients, such as P. Such responses would further oppose any positive effects on photosynthetic performance by enhanced N availability through reduced stomatal conductance and amplification of foliar nutrient imbalances in the fertilized trees. The observed photosynthetic responses of mature N-poor P. sylvestris to increased foliar N contents and their implications on the long-term stand-scale C cycling are discussed below.
Effects of Foliar Nutrient Contents and Needle Age on Photosynthetic Capacity
The greater observed P sensitivity of Jmax than of Vcmax in the 1-year-old needles of the trees with high N availability (Figure 2) agrees with the results of Niinemets et al. (2001) who collected data from two temperate P. sylvestris stands with strong, naturally occurring differences in N availability. Contrary to these findings, a recent meta-analysis by Walker et al. (2014) found the relationship between Jmax and Vcmax to be unaffected by leaf N, P or LMA, suggesting that the capacity parameters may be equally sensitive to P when evaluated for a range of species. Importantly, the varying strength of the capacity limitation by P detected in the current study indicates that assessments of canopy-scale photosynthetic capacity limitation by multiple nutrients must also account for within-canopy variation. Furthermore, while information of needle P contents considerably increased the accuracy of the capacity predictions, the apparent P deficiency may be indicative of general nutrient deficiency, relative to N, in the trees with high N availability.
The photosynthetic capacity of pine needles has been shown to vary seasonally and with needle age (Jach and Ceulemans, 2000; Han et al., 2004, 2008; Op de Beeck et al., 2010; Kolari et al., 2014). We found no needle age-related capacity trends at either plot with the exception of the Jmax:Vcmax variable for which a significant interaction between needle age and canopy position was detected (Tables 2, 3). Notably, neither N nor P alone or their combination was a successful predictor of the photosynthetic capacities of the current-year needles (Figure 1, Figure S2). Troeng and Linder (1982) have shown that the length growth of P. sylvestris needles in central Sweden continues until early- to mid-August. Thus, the lack of correlation between photosynthetic capacity and foliar nutrient contents observed in the current study may be due to the current-year needles not having been fully developed at the time of the measurement campaign.
Overall, the higher Vcmax and Jmax of 1-year-old needles at the fertilized plot support hypothesis #1 with respect to photosynthetic capacity (Tables 2, 3). However, the long-term shoot-scale photosynthetic performance was similar among fertilized and control trees (Figure 4B), thus, contradicting the observed positive biochemical capacity response to N.
Nutrient-Use Efficiency and Optimality of Nitrogen Allocation
Our results support hypothesis #2, that greater N availability reduces shoot-scale NUE, with respect to the photosynthetic capacity responses to N but not with respect to the long-term photosynthetic performance. As observed in previous studies (Näsholm and Ericsson, 1990; Nordin et al., 2001), arginine was produced in response to N fertilization but N allocation to arginine can only explain a fraction of the observed between plots difference in the efficiency with which N is used for generating photosynthetic capacity. The improvements in the capacity predictions following inclusion of the P and N*P parameters (Figure 2), however, appear to explain the weak N dependencies of photosynthetic capacities at the fertilized plot (Figure 1) and also indicate that properly assessing N allocation requires knowledge of the availability of other resources. These results further suggest that the N allocation pattern at the fertilized plot is non-optimal with the upper canopy needles having more N than they can effectively utilize given their P contents. This supports hypothesis #3 with respect to instantaneous photosynthetic capacity. Interestingly, no vertical variation was observed in the P:N ratio at either plot indicating that P was not preferentially allocated to the upper canopy high-N needles. An upper canopy P limitation could also explain why the capacities did not scale with long-term light availability, i.e., with vertical canopy position, as commonly observed (e.g., Han et al., 2003; Niinemets, 2007; Niinemets et al., 2015). This finding further implies that having lower and mid-canopy needles with reasonably high photosynthetic capacities may have benefits, such as higher long-term canopy-scale LUE, that outweigh the non-optimality of within-canopy N allocation with respect to maximal photosynthetic capacities. Accordingly, it has been previously suggested that due to the photosynthesis of evergreens often being limited by sub-optimal environmental conditions, having foliage capable of high assimilation rates under optimal conditions may offer little long-term benefit (Warren and Adams, 2004; also see Tarvainen et al., 2015). The significant vertical variations in the long-term NUE at both plots suggest that N was non-optimally allocated for maximizing long-term shoot-scale C uptake independently of N availability. Therefore, our results do not support hypothesis #3 with respect to long-term photosynthetic performance. The non-optimality at the N-poor control plot may reflect excess N allocation to lower canopy in response to constraints on leaf morphology (Dewar et al., 2012) or, possibly, resource-use efficiency trade-offs allowing for a higher shoot-scale LUE in the shaded lower canopy at the cost of reduced NUE (Tarvainen et al., 2015).
Photosynthetic Performance Modeling
The modeling was rather successful in predicting observed long-term An (Figure 5), especially considering that canopy mean Vcmax or Jmax were used for all shoots. The overestimation of An in some of the high performance, upper canopy, shoots is likely related to mutual shading of the needles in the continuously measured shoots leading to a lower per unit needle area light interception than indicated by the sensor reading. The effect would be weaker at low Q when the incoming light is mostly diffuse and at very high, but rare, Q when there is an excess of light. Because the needles were separated to avoid shading when the capacity parameters were determined, the model calculations do not account for this effect. Additionally, it should be noted that the modeling was based on Ci rather than chloroplast CO2 concentrations, which has been shown to affect the predictive power of the Farquhar et al. (1980) photosynthesis model (Niinemets et al., 2009). The relatively higher CO2 assimilation rates in the upper canopy shoots, due to higher light availability, could lead to the difference between Ci and chloroplast CO2 concentrations becoming considerable in these locations. In such cases, using Ci-based modeling would likely contribute toward overestimation of An. Furthermore, both nutrient availability (Warren, 2004; Bown et al., 2009) and tree height (Han, 2011) can affect mesophyll conductance suggesting that some of the apparent between-plots capacity differences observed in this study could also result from differences in mesophyll conductance. The modeling also did not account for the reduction in respiration rate in light (e.g., Way and Yamori, 2014), which would push the model toward underestimating An during daytime hours. However, given the relative magnitudes of respiration and assimilation rates, an adjustment of the respiration term would have only a negligible impact on the predicted long-term An. Despite of these potential confounding factors, we found the accuracy of the model to be acceptable for estimating long-term An losses due to P deficiency and N allocation to arginine.
Phosphorus and Arginine Effects on Needle- and Canopy-Scale Carbon Uptake
Assessing the capacity limitation of 1-year-old fertilized upper canopy needles, with mean Na of 6.5 g N m−2 s−1, by extrapolating the capacity—Na relationships from the control plot suggested that Vcmax was reduced by 8.5% and Jmax by 27%. Similar results were presented by Loustau et al. (1999) who found that P deficiency constrained An through Vcmax at high light availability and through Jmax at low light availability in 2-year-old pot-grown Pinus pinaster seedlings. Despite the considerable apparent limitation of Vcmax and Jmax in the current study, the predicted long-term performance loss in the 1-year-old fertilized upper canopy shoots was estimated to c. 10% per unit needle area. Furthermore, because capacity limitation was only observed in 1-year-old needles and would occur predominantly in the upper canopy, the reduction of canopy-scale C uptake at the fertilized plot by P and arginine appears to be modest and, thus, our findings do not support hypothesis #4. Similarly, Op de Beeck et al. (2010) showed that seasonal and age-related photosynthetic capacity variation had negligible effects on model predictions of annual canopy-scale gas exchange of a temperate P. sylvestris stand experiencing high N deposition rates.
Constraints of Long-Term Canopy-Scale Carbon Assimilation
The similarity of needle area-based LUE between the plots (Figure 3B) after 8 years of heavy N-fertilization, suggests that any long-term differences in canopy-scale C assimilation will depend on differences in total canopy-scale leaf area and light interception rather than foliar nutrient contents as has also been suggested previously (Brix, 1971; Linder and Axelsson, 1982). As observed in previous studies of N fertilization effects on N-limited forests (see the review by Hyvönen et al., 2007), leaf area of the fertilized plot has increased in response to N addition and was c. 13 % greater than at the control plot in 2013 (Lim et al., 2015). Nitrogen availability has been observed to affect shoot structure and, thereby, the light interception efficiency in P. sylvestris (Niinemets et al., 2002). However, the lack of between plots variation in the vertical LUE patterns (Figure 3B) indicates that needle-area based C assimilation was insensitive to any such potential changes in shoot structure. This agrees with the suggestion by Lim et al. (2015) that the impact of fertilization on canopy-scale light absorption at the current site was rather small and mainly due to leaf area responses to increasing N availability. Moreover, the positive effect of the observed leaf area increase on the canopy-scale C uptake was likely reduced by lower average Q per unit needle area caused by increased within-canopy shading. The smallish between plots difference in expected canopy-scale light interception is relevant for stand-scale C cycling considering that Lim et al. (2015) observed a 27 ± 7% higher aboveground primary production (ANPP) at the fertilized plot compared to the control plot. Increasing aboveground productivity is a commonly observed response to N addition in boreal conifers (e.g., Axelsson and Axelsson, 1986; Linder, 1987), and in agreement with previous studies (e.g., Linder and Axelsson, 1982; Axelsson and Axelsson, 1986; Gower et al., 1994), Lim et al. (2015) suggested that the ANPP difference resulted mainly from changes in C partitioning to aboveground and belowground biomass pools. The current study provides additional evidence of the importance of partitioning shifts by showing that photosynthetic performance per unit needle area was not enhanced in response to the N fertilization and, thus, increased canopy-scale C uptake could only account for a portion of the observed ANPP difference.
In summary, our results suggest that in mature stands mutual shading largely negates the canopy-scale C uptake benefit of having foliage with high photosynthetic capacities, i.e., high Na. The light limitation also reduces the benefit of using captured C for construction of additional leaf area; rather the most beneficial strategy appears to be to have low- and mid-canopy foliage capable of reasonable C uptake and to grow in height to maximize light interception. Many of the large-scale fertilization trials that have concluded that boreal forests are N-limited have, however, been carried out in young stands. Such stands are likely to be able to greatly increase their light capture and C uptake by increasing the rate of leaf area expansion, and by having foliage with greater photosynthetic capacity, prior to canopy closure. In such cases, limitations to N availability could considerably reduce the canopy-scale C uptake and, thus, growth.
Conclusions
Our results suggest that the canopy-scale photosynthetic performance of the studied N-poor stand was not greatly limited by N, or by capacity constraints in response to P deficiency or arginine synthesis following N addition. Rather, the long-term photosynthetic limitation was caused by the existing foliar nutrients not being utilized to their full potential due to the light availability constraints affecting most of the canopy. The weak N dependency of long-term foliar C uptake suggests that models predicting stand-scale responses to changes in N availability should include robust representations of N effects on within-tree C partitioning and light-use efficiency as well as availability patterns, rather than being reliant on N-based estimates of photosynthetic capacity. In this context, it would be particularly interesting to explore the potential shift in fertilization response from maintaining high NUE, as the additional N is spread among more needles, in expanding stands to prioritizing high needle-scale LUE in closed stands where the additional N must be allocated within the existing canopy structure. Finally, our results suggest that there is a strong need for studies investigating photosynthetic acclimation responses under sub-optimal environmental conditions, such as low light availabilities and nutrient imbalances, likely experienced by the majority of the foliage within a canopy.
Author Contributions
LT, ML, and GW designed the experiment. LT, ML, MR, and GW performed the field measurements. All authors contributed to the analysis and interpretation of the results. LT wrote the manuscript with ML, MR, TN, and GW providing editorial advice. All authors read and approved the final manuscript.
Funding
This study was supported by The Kempe foundations, The Swedish University of Agricultural Sciences (TC4F and Bio4E), The Strategic Research Area “Biodiversity and Ecosystem Services in a Changing Climate” (BECC) and the research councils: The Swedish Research Council for Environment, Agricultural Sciences and Spatial Planning, The Swedish Research Council and The Swedish Governmental Agency for Innovation Systems.
Conflict of Interest Statement
The authors declare that the research was conducted in the absence of any commercial or financial relationships that could be construed as a potential conflict of interest.
Acknowledgments
We are grateful to Christer Renman, Giuseppe De Simon, and Thomas Hörnlund at Svartberget Research Station for technical help at the field site. We would like to thank Margaretha Zetherström, Åsa Boily, and Jonas Lundholm for the amino acid and phosphorus analyses performed at Umeå Plant Science Centre and the analytical lab at the Department of Forest Ecology and Management, the Swedish University of Agricultural Sciences in Umeå, Sweden. Finally, we would like to thank Sune Linder for supporting the set-up of the long-term gas exchange measurements at the site.
Supplementary Material
The Supplementary Material for this article can be found online at: http://journal.frontiersin.org/article/10.3389/fpls.2016.01051
Image S1. Photograph of an automated cuvette used for continuous measurements of shoot-scale gas exchange.
Figure S1. Vertical variation in fraction visible sky (openness) in the studied Pinus sylvestris plots.
Figure S2. The impact of including both nitrogen and phosphorus in the predictions of maximum carboxylation rate (Vcmax) and maximum electron transport rate (Jmax) at 25°C in current-year Pinus sylvestris needles.
Table S1. Variation in needle physical and chemical properties with canopy position (upper, mid, lower) in 1-year-old Pinus sylvestris shoots used in continuous shoot-scale net gas exchange measurements.
Table S2. Repeated measures ANOVA statistics for between plots and age-related variation in the needle properties in the upper canopy shoots including all age three classes presented in Tables 1, 2.
References
Axelsson, E., and Axelsson, B. (1986). Changes in carbon allocation patterns in spruce and pine trees following irrigation and fertilization. Tree Physiol. 2, 189–204. doi: 10.1093/treephys/2.1-2-3.189
Bauer, G. A., Bazzaz, F. A., Minocha, R., Long, S., Magill, A., Aber, J., et al. (2004). Effects of chronic N additions on tissue chemistry, photosynthetic capacity, and carbon sequestration potential of a red pine (Pinus resinosa Ait.) stand in the NE United States. Forest Ecol. Manag. 196, 173–186. doi: 10.1016/j.foreco.2004.03.032
Bernacchi, C. J., Pimentel, C., and Long, S. P. (2003). In vivo temperature response functions of parameters required to model RuBP-limited photosynthesis. Plant Cell Environ. 26, 1419–1430. doi: 10.1046/j.0016-8025.2003.01050.x
Bernacchi, C. J., Singsaas, E. L., Pimentel, C., Portis, A. R., and Long, S. P. (2001). Improved temperature response functions for models of Rubisco-limited photosynthesis. Plant Cell Environ. 24, 253–259. doi: 10.1111/j.1365-3040.2001.00668.x
Bown, H. E., Watt, M. S., Clinton, P. W., Mason, E. G., and Richardson, B. (2007). Partititioning concurrent influences of nitrogen and phosphorus supply on photosynthetic model parameters of Pinus radiata. Tree Physiol. 27, 335–344. doi: 10.1093/treephys/27.3.335
Bown, H. E., Watt, M. S., Mason, E. G., Clinton, P. W., and Whitehead, D. (2009). The influence of nitrogen and phosphorus supply and genotype on mesophyll conductance limitations to photosynthesis in Pinus radiata. Tree Physiol. 29, 1143–1151. doi: 10.1093/treephys/tpp051
Braun, S., Thomas, V. F. D., Quiring, R., and Fluckiger, W. (2010). Does nitrogen deposition increase forest production? The role of phosphorus. Environ. Pollut. 158, 2043–2052. doi: 10.1016/j.envpol.2009.11.030
Brix, H. (1971). Effects of nitrogen fertilization on photosynthesis and respiration of Douglas-fir. Forest Sci. 17, 407–414.
Brix, H. (1983). Effects of thinning and nitrogen fertilization on growth of Douglas-fir: relative contribution of foliage quantity and efficiency. Can. J. For. Res. 13, 167–175. doi: 10.1139/x83-023
Buckley, T. N., Cescatti, A., and Farquhar, G. D. (2013). What does optimization theory actually predict about crown profiles of photosynthetic capacity when models incorporate greater realism? Plant Cell Environ. 36, 1547–1563. doi: 10.1111/pce.12091
Dewar, R. C., Tarvainen, L., Parker, K., Wallin, G., and McMurtrie, R. E. (2012). Why does leaf nitrogen decline within tree canopies less rapidly than light? An explanation from optimization subject to a lower bound on leaf mass per area. Tree Physiol. 32, 520–534. doi: 10.1093/treephys/tps044
Domingues, T. F., Meir, P., Feldpausch, T. R., Saiz, G., Veenendaal, E. M., Schrodt, F., et al. (2010). Co-limitation of photosynthetic capacity by nitrogen and phosphorus in West Africa woodlands. Plant Cell Environ. 33, 959–980. doi: 10.1111/j.1365-3040.2010.02119.x
Ellsworth, D. S., Crous, K. Y., Lambers, H., and Cooke, J. (2015). Phosphorus recycling in photorespiration maintains high photosynthetic capacity in woody species. Plant Cell Environ. 38, 1142–1156. doi: 10.1111/pce.12468
Evans, J. R. (1989). Photosynthesis and nitrogen relationships in leaves of C3 plants. Oecologia 78, 9–19. doi: 10.1007/BF00377192
Farquhar, G. D. (1989). Models of integrated photosynthesis of cells and leaves. Philos. Trans. R. Soc. B 323, 357–367. doi: 10.1098/rstb.1989.0016
Farquhar, G. D., Caemmerer, S. V., and Berry, J. A. (1980). A biochemical-model of photosynthetic CO2 assimilation in leaves of C-3 species. Planta 149, 78–90. doi: 10.1007/BF00386231
Field, C. (1983). Allocating leaf nitrogen for maximization of carbon gain – leaf age as a control on the allocation program. Oecologia 56, 341–347. doi: 10.1007/BF00379710
Gower, S. T., Gholz, H. L., Nakane, K., and Baldwin, V. C. (1994). Production and carbon allocation patterns of pine forests. Ecol. Bull. 43, 115–135.
Gradowski, T., and Thomas, S. C. (2006). Phosphorus limitation of sugar maple growth in central Ontario. Forest Ecol. Manag. 226, 104–109. doi: 10.1016/j.foreco.2005.12.062
Hall, M., Medlyn, B. E., Abramowitz, G., Franklin, O., Räntfors, M., Linder, S., et al. (2013). Which are the most important parameters for modelling carbon assimilation in boreal Norway spruce under elevated [CO2] and temperature conditions? Tree Physiol. 33, 1156–1176. doi: 10.1093/treephys/tpt014
Han, Q. M. (2011). Height-related decreases in mesophyll conductance, leaf photosynthesis and compensating adjustments associated with leaf nitrogen concentrations in Pinus densiflora. Tree Physiol. 31, 976–984. doi: 10.1093/treephys/tpr016
Han, Q. M., Kawasaki, T., Katahata, S., Mukai, Y., and Chiba, Y. (2003). Horisontal and vertical variations in photosynthetic capacity in a Pinus densiflora crown in relation to leaf nitrogen allocation and acclimation to irradiance. Tree Physiol. 23, 851–857. doi: 10.1093/treephys/23.12.851
Han, Q. M., Kawasaki, T., Nakano, T., and Chiba, Y. (2004). Spatial and seasonal variability of temperature responses of biochemical photosynthesis parameters and leaf nitrogen content within a Pinus densiflora crown. Tree Physiol. 24, 737–744. doi: 10.1093/treephys/24.7.737
Han, Q. M., Kawasaki, T., Nakano, T., and Chiba, Y. (2008). Leaf-age effects on seasonal variability in photosynthetic parameters and its relationships with leaf mass per area and leaf nitrogen concentration within a Pinus densiflora crown. Tree Physiol. 28, 551–558. doi: 10.1093/treephys/28.4.551
Harley, P. C., Thomas, R. B., Reynolds, J. F., and Strain, B. R. (1992). Modeling photosynthesis of cotton grown in elevated CO2. Plant Cell Environ. 15, 271–282. doi: 10.1111/j.1365-3040.1992.tb00974.x
Hasselquist, N. J., Metcalfe, D. B., and Högberg, P. (2012). Contrasting effects of low and high nitrogen additions on soil CO2 flux components and ectomycorrhizal fungal sporocarp production in a boreal forest. Glob. Change Biol. 18, 3596–3605. doi: 10.1111/gcb.12001
Hikosaka, K. (2014). Optimal nitrogen distribution within a leaf canopy under direct and diffuse light. Plant Cell Environ. 37, 2077–2085. doi: 10.1111/pce.12291
Hikosaka, K. (2016). Optimality of nitrogen distribution among leaves in plant canopies. J. Plant Res. 129, 299–311. doi: 10.1007/s10265-016-0824-1
Hikosaka, K., and Terashima, I. (1995). A model of the acclimation of photosynthesis in leaves of C-3 plants to sun and shade with respect to nitrogen use. Plant Cell Environ. 18, 605–618. doi: 10.1111/j.1365-3040.1995.tb00562.x
Hikosaka, K., and Terashima, I. (1996). Nitrogen partitioning among photosynthetic components and its consequence in sun and shade plants. Funct. Ecol. 10, 335–343. doi: 10.2307/2390281
Hirose, T., and Werger, M. J. A. (1987). Maximizing daily canopy photosynthesis with respect to the leaf nitrogen allocation pattern in the canopy. Oecologia 72, 520–526. doi: 10.1007/BF00378977
Högberg, M. N., Briones, M. J. I., Keel, S. G., Metcalfe, D. B., Campbell, C., Midwood, A. J., et al. (2010). Quantification of effects of season and nitrogen supply on tree below-ground carbon transfer to ectomycorrhizal fungi and other soil organisms in a boreal pine forest. New Phytol. 187, 485–493. doi: 10.1111/j.1469-8137.2010.03274.x
Hollinger, D. Y. (1996). Optimality and nitrogen allocation in a tree canopy. Tree Physiol. 16, 627–634. doi: 10.1093/treephys/16.7.627
Hurlbert, S. H. (1984). Pseudoreplication and the design of ecological field experiments. Ecol. Monogr. 54, 187–211. doi: 10.2307/1942661
Hyvönen, R., Ågren, G. I., Linder, S., Persson, T., Cotrufo, M. F., Ekblad, A., et al. (2007). The likely impact of elevated CO(2), nitrogen deposition, increased temperature and management on carbon sequestration in temperate and boreal forest ecosystems: a literature review. New Phytol. 173, 463–480. doi: 10.1111/j.1469-8137.2007.01967.x
Inselsbacher, E., Öhlund, J., Jämtgard, S., Huss-Danell, K., and Näsholm, T. (2011). The potential of microdialysis to monitor organic and inorganic nitrogen compounds in soil. Soil Biol. Biochem. 43, 1321–1332. doi: 10.1016/j.soilbio.2011.03.003
Jach, M. E., and Ceulemans, R. (2000). Effects of season, needle age and elevated atmospheric CO2 on photosynthesis in Scots pine (Pinus sylvestris). Tree Physiol. 20, 145–157. doi: 10.1093/treephys/20.3.145
Jonard, M., Fürst, A., Verstraeten, A., Thimonier, A., Timmermann, V., Potocic, N., et al. (2015). Tree mineral nutrition is deteriorating in Europe. Glob. Change Biol. 21, 418–430. doi: 10.1111/gcb.12657
Kellomäki, S., and Wang, K. Y. (1997). Photosynthetic responses of Scots pine to elevated CO2 and nitrogen supply: Results of a branch-in-bag experiment. Tree Physiol. 17, 231–240. doi: 10.1093/treephys/17.4.231
Kolari, P., Chan, T., Porcar-Castell, A., Bäck, J., Nikinmaa, E., and Juurola, E. (2014). Field and controlled environment measurements show strong seasonal acclimation in photosynthesis and respiration potential in boreal Scots pine. Front. Plant Sci. 5:717. doi: 10.3389/fpls.2014.00717
Laitinen, K., Luomala, E.-M., Kellomäki, S., and Vapaavuori, E. (2000). Carbon assimilation and nitrogen in needles of fertilized and unfertilized field-grown Scots pine at natural and elevated CO2. Tree Physiol. 20, 881–892. doi: 10.1093/treephys/20.13.881
Laudon, H., Taberman, I., Ågren, A., Futter, M., Ottosson-Löfvenius, M., and Bishop, K. (2013). The Krycklan Catchment Study-a flagship infrastructure for hydrology, biogeochemistry, and climate research in the boreal landscape. Water Resour. Res. 49, 7154–7158. doi: 10.1002/wrcr.20520
Lim, H., Oren, R., Palmroth, S., Tor-ngern, P., Mörling, T., Näsholm, T., et al. (2015). Inter-annual variability of precipitation constrains the production response of boreal Pinus sylvestris to nitrogen fertilization. Forest Ecol. Manag. 348, 31–45. doi: 10.1016/j.foreco.2015.03.029
Linder, S., and Axelsson, B. (1982). “Changes in carbon uptake and allocation patterns as a result of irrigation and fertilization in a young Pinus sylvestris stand”, in Carbon Uptake and Allocation in Subalpine Ecosystems as a Key to Management, Proceedings of an IUFRO Workshop, August. 2–3, 1982, Corvallis, ed R. H. Waring (Corvallis, OR: Forest Research Laboratory, Oregon State University), 38–44.
Linder, S. (1987). “Responses to water and nutrients in coniferous ecosystems”, in Potentials and Limitations of Ecosystem Analysis, Ecological Studies, Vol. 61, eds E. D. Schulze and H. Zwölfer (Berlin, Heidelberg; New York, NY: Springer), 180–202.
Long, S. P., Postl, W. F., and Bolharnordenkampf, H. R. (1993). Quantum yields for uptake of carbon-dioxide in C-3 vascular plants of contrasting habitats and taxonomic groupings. Planta 189, 226–234. doi: 10.1007/BF00195081
Loustau, D., Ben Brahim, M., Gaudillère, J. P., and Dreyer, E. (1999). Photosynthetic responses to phosphorus nutrition in two-year-old maritime pine seedlings. Tree Physiol. 19, 707–715. doi: 10.1093/treephys/19.11.707
Medlyn, B. E., Dreyer, E., Ellsworth, D., Forstreuter, M., Harley, P. C., Kirschbaum, M. U. F., et al. (2002). Temperature response of parameters of a biochemically based model of photosynthesis. II. A review of experimental data. Plant Cell Environ. 25, 1167–1179. doi: 10.1046/j.1365-3040.2002.00891.x
Mercado, L. M., Patiño, S., Domingues, T. F., Fyllas, N. M., Weedon, G. P., Sitch, S., et al. (2011). Variations in Amazon forest productivity correlated with foliar nutrients and modelled rates of photosynthetic carbon supply. Philos. Trans. R. Soc. B 366, 3316–3329. doi: 10.1098/rstb.2011.0045
Näsholm, T. (1994). Removal of nitrogen during needle senescence in Scots pine (Pinus sylvestris L.). Oecologia 99, 290–296. doi: 10.1007/BF00627741
Näsholm, T., and Ericsson, A. (1990). Seasonal changes in amino acids, protein and total nitrogen in needles of fertilized Scots pine trees. Tree Physiol. 6, 267–281. doi: 10.1093/treephys/6.3.267
Niinemets, Ü. (2007). Photosynthesis and resource distribution through plant canopies. Plant Cell Environ. 30, 1052–1071. doi: 10.1111/j.1365-3040.2007.01683.x
Niinemets, Ü., Cescatti, A., Lukjanova, A., Tobias, M., and Truus, L. (2002). Modification of light-acclimation of Pinus sylvestris shoot architecture by site fertility. Agric. Forest Meteorol. 111, 121–140. doi: 10.1016/S0168-1923(02)00011-4
Niinemets, Ü., Díaz-Espejo, A., Flexas, J., Galmés, J., and Warren, C. R. (2009). Importance of mesophyll diffusion conductance in estimation of plant photosynthesis in the field. J.Exp. Bot. 60, 2271–2282. doi: 10.1093/jxb/erp063
Niinemets, Ü., Ellsworth, D. S., Lukjanova, A., and Tobias, M. (2001). Site fertility and the morphological and photosynthetic acclimation of Pinus sylvestris needles to light. Tree Physiol. 21, 1231–1244. doi: 10.1093/treephys/21.17.1231
Niinemets, Ü., Keenan, T. F., and Hallik, L. (2015). A worldwide analysis of within-canopy variations in leaf structural, chemical and physiological traits across plant functional types. New Phytol. 205, 973–993. doi: 10.1111/nph.13096
Nordin, A., Uggla, C., and Näsholm, T. (2001). Nitrogen forms in bark, wood and foliage of nitrogen-fertilized Pinus sylvestris. Tree Physiol. 21, 59–64. doi: 10.1093/treephys/21.1.59
Op de Beeck, M., Gielen, B., Jonckheere, I., Samson, R., Janssens, I. A., and Ceulemans, R. (2010). Needle age-related and seasonal photosynthetic capacity variation is negligible for modelling yearly gas exchange of a sparse temperate Scots pine forest. Biogeosciences 7, 199–215. doi: 10.5194/bg-7-199-2010
Peltoniemi, M. S., Duursma, R. A., and Medlyn, B. E. (2012). Co-optimal distribution of leaf nitrogen and hydraulic conductance in plant canopies. Tree Physiol. 32, 510–519. doi: 10.1093/treephys/tps023
Peñuelas, J., Poulter, B., Sardans, J., Ciais, P., van der Velde, M., Bopp, L., et al. (2013). Human-induced nitrogen-phosphorus imbalances alter natural and managed ecosystems across the globe. Nat. Commun. 4:2934. doi: 10.1038/ncomms3934
Prietzel, J., Rehfuess, K. E., Stetter, U., and Pretzsch, H. (2008). Changes of soil chemistry, stand nutrition, and stand growth at two Scots pine (Pinus sylvestris L.) sites in Central Europe during 40 years after fertilization, liming, and lupine introduction. Eur. J. For. Res. 127, 43–61. doi: 10.1007/s10342-007-0181-7
Rabe, E., and Lovatt, C. J. (1984). De novo arginine biosynthesis in leaves of phosphorus-deficient citrus and poncirus species. Plant Physiol. 76, 747–752. doi: 10.1104/pp.76.3.747
Rabe, E., and Lovatt, C. J. (1986). Increased arginine biosynthesis during phosphorus deficiency – A response to increased ammonia content of leaves. Plant Physiol. 81, 774–779. doi: 10.1104/pp.81.3.774
Reich, P. B., Kloeppel, B. D., Ellsworth, D. S., and Walters, M. B. (1995). Different photosynthesis-nitrogen relations in deciduous hardwood and evergreen coniferous tree species. Oecologia 104, 24–30. doi: 10.1007/BF00365558
Reich, P. B., Oleksyn, J., and Wright, I. J. (2009). Leaf phosphorus influences the photosynthesis-nitrogen relation: a cross-biome analysis of 314 species. Oecologia 160, 207–212. doi: 10.1007/s00442-009-1291-3
Reich, P. B., and Schoettle, A. W. (1988). Role of phosphorus and nitrogen in photosynthetic and whole plant carbon gain and nutrient use efficiency in eastern white pine. Oecologia 77, 25–33. doi: 10.1007/BF00380920
Sharkey, T. D., Bernacchi, C. J., Farquhar, G. D., and Singsaas, E. L. (2007). Fitting photosynthetic carbon dioxide response curves for C3 leaves. Plant Cell Environ. 30, 1035–1040. doi: 10.1111/j.1365-3040.2007.01710.x
Sigurdsson, B. D., Roberntz, P., Freeman, M., Naess, M., Saxe, H., Thorgeirsson, H., et al. (2002). Impact studies on Nordic forests: effects of elevated CO2 and fertilization on gas exchange. Can. J. Forest Res. 32, 779–788. doi: 10.1139/X01-114
Tamm, C. O. (1955). Studies on forest nutrition. I. Seasonal variation in the nutrient content of conifer needles. Meddelanden fran Statens Skogsforskningsinstitut, 1–34.
Tamm, C. O. (1956). Studies on forest nutrition. III. The effect of supply of plant nutrients to a forest stand on a poor site. Meddelanden fran Statens Skogsforskningsinstitut 46, 1–84.
Tamm, C. O. (1991). Nitrogen in Terrestrial Ecosystems. Ecological Studies, Vol. 81, Berlin, Heidelberg; New York, NY: Springer.
Tarvainen, L., Wallin, G., Räntfors, M., and Uddling, J. (2013). Weak vertical canopy gradients of photosynthetic capacities and stomatal responses in a fertile Norway spruce stand. Oecologia 173, 1179–1189. doi: 10.1007/s00442-013-2703-y
Tarvainen, L., Räntfors, M., and Wallin, G. (2015). Seasonal and within-canopy variation in shoot-scale resource use efficiency trade-offs in a Norway spruce stand. Plant Cell Environ. 38, 2487–2496. doi: 10.1111/pce.12565
Troeng, E., and Linder, S. (1982). Gas-exchange in a 20-year-old stand of Scots pine. 1. Net photosynthesis of current and one-year-old shoots within and between seasons. Physiol. Plantarum 54, 7–14. doi: 10.1111/j.1399-3054.1982.tb00569.x
Vitousek, P. M. (1984). Litterfall, nutrient cycling, and nutrient limitation in tropical forests. Ecology 65, 285–298. doi: 10.2307/1939481
von Caemmerer, S., and Farquhar, G. D. (1981). Some relationships between the biochemistry of photosynthesis and gas exchange of leaves. Planta 153, 376–387. doi: 10.1007/BF00384257
Walker, A. P., Beckerman, A. P., Gu, L. H., Kattge, J., Cernusak, L. A., Domingues, T. F., et al. (2014). The relationship of leaf photosynthetic traits - Vcmax and Jmax - to leaf nitrogen, leaf phosphorus, and specific leaf area: a meta-analysis and modeling study. Ecol. Evol. 4, 3218–3235. doi: 10.1002/ece3.1173
Wallin, G., Linder, S., Lindroth, A., Räntfors, M., Flemberg, S., and Grelle, A. (2001). Carbon dioxide exchange in Norway spruce at the shoot, tree and ecosystem scale. Tree Physiol. 21, 969–976. doi: 10.1093/treephys/21.12-13.969
Warren, C. R. (2004). The photosynthetic limitation posed by internal conductance to CO2 movement is increased by nutrient supply. J. Exp. Bot. 55, 2313–2321. doi: 10.1093/jxb/erh239
Warren, C. R., and Adams, M. A. (2004). Evergreen trees do not maximize instantaneous photosynthesis. Trends Plant Sci. 9, 270–274. doi: 10.1016/j.tplants.2004.04.004
Warren, C. R., Dreyer, E., and Adams, M. A. (2003). Photosynthesis-Rubisco relationships in foliage of Pinus sylvestris in response to nitrogen supply and the proposed role of Rubisco and amino acids as nitrogen stores. Trees Struct. Funct. 17, 359–366. doi: 10.1007/s00468-003-0246-2
Way, D. A., and Yamori, W. (2014). Thermal acclimation of photosynthesis: on the importanceof adjusting our definitions and accounting for thermal acclimation of respiration. Photosynth. Res. 119, 89–100. doi: 10.1007/s11120-013-9873-7
Wyka, T. P., Oleksyn, J., Zytkowiak, R., Karolewski, P., Jagodzinski, A. M., and Reich, P. B. (2012). Responses of leaf structure and photosynthetic properties to intra-canopy light gradients: a common garden test with four broadleaf deciduous angiosperm and seven evergreen conifer tree species. Oecologia 170, 11–24. doi: 10.1007/s00442-012-2279-y
Keywords: arginine, Jmax, optimality, phosphorus, photosynthesis, Pinus sylvestris, resource-use efficiency, Vcmax
Citation: Tarvainen L, Lutz M, Räntfors M, Näsholm T and Wallin G (2016) Increased Needle Nitrogen Contents Did Not Improve Shoot Photosynthetic Performance of Mature Nitrogen-Poor Scots Pine Trees. Front. Plant Sci. 7:1051. doi: 10.3389/fpls.2016.01051
Received: 21 April 2016; Accepted: 05 July 2016;
Published: 20 July 2016.
Edited by:
Judy Simon, University of Konstanz, GermanyReviewed by:
Jürgen Kreuzwieser, University of Freiburg, GermanyBartosz Adamczyk, University of Helsinki, Finland
Copyright © 2016 Tarvainen, Lutz, Räntfors, Näsholm and Wallin. This is an open-access article distributed under the terms of the Creative Commons Attribution License (CC BY). The use, distribution or reproduction in other forums is permitted, provided the original author(s) or licensor are credited and that the original publication in this journal is cited, in accordance with accepted academic practice. No use, distribution or reproduction is permitted which does not comply with these terms.
*Correspondence: Lasse Tarvainen, bGFzc2UudGFydmFpbmVuQHNsdS5zZQ==