 Lulu Xie
 Fei Li
- Department of Chinese Cabbage, Institute of Vegetables and Flowers, Chinese Academy of Agricultural Sciences, Beijing, China
Introgression breeding is a widely used method for the genetic improvement of crop plants; however, the mechanism underlying candidate gene flow patterns during hybridization is poorly understood. In this study, we used a powerful pipeline to investigate a Chinese cabbage (Brassica rapa L. ssp. pekinensis) introgression line with the anthocyanin overaccumulation phenotype. Our purpose was to analyze the gene flow patterns during hybridization and elucidate the genetic factors responsible for the accumulation of this important pigment compound. We performed RNA-seq analysis by using two pipelines, one with and one without a reference sequence, to obtain transcriptome data. We identified 930 significantly differentially expressed genes (DEGs) between the purple-leaf introgression line and B. rapa green cultivar, namely, 389 up-regulated and 541 down-regulated DEGs that mapped to the B. rapa reference genome. Since only one anthocyanin pathway regulatory gene was identified, i.e., Bra037887 (bHLH), we mined unmapped reads, revealing 2031 de novo assembled unigenes, including c3563g1i2. Phylogenetic analysis suggested that c3563g1i2, which was transferred from the Brassica B genome of the donor parental line Brassica juncea, may represent an R2R3-MYB transcription factor that participates in the ternary transcriptional activation complex responsible for the anthocyanin overaccumulation phenotype of the B. rapa introgression line. We also identified genes involved in cold and light reaction pathways that were highly upregulated in the introgression line, as confirmed using quantitative real-time PCR analysis. The results of this study shed light on the mechanisms underlying the purple leaf trait in Brassica plants and may facilitate the use of introgressive hybridization for many traits of interest.
Introduction
Despite advances in genetic engineering, introgression breeding is still a widely used technique for genetically improving crop plants. Introgression breeding begins with interspecific hybridization between a recipient and a donor plant, followed by backcrosses to the recipient plant. After selection for the trait of interest, recipient crop introgression lines will have chromosome segments containing the target genes (Twyford and Ennos, 2012). Genetic materials transferred via this process often contain genes responsible for many valuable agronomic phenotypes, such as insect resistance and improved nutritional quality (Rubiales et al., 2014; Zhang et al., 2015).
Chinese cabbage is the main leafy vegetable available in North China in the winter due to its high yield and ease of storage. In the current study, we utilized a purple Chinese cabbage germplasm with excess anthocyanin accumulation in its leaves (Sun et al., 2006). In constructing this Chinese cabbage (Brassica rapa L. ssp. pekinensis) germplasm, the first hybridization was carried out between the projected recipient B. rapa (AA genome of the U-triangle, 2n = 20) (Nagaharu, 1935) and the anthocyanin candidate donor B. juncea (AABB genome of the U-triangle, 4n = 36). Previous HPLC analysis showed significantly increased anthocyanin levels in purple cabbage compared to its green B. rapa parent. Purple B. juncea and purple cabbage both contain the cyanidin-type of anthocyanidin, but with slightly different modification groups (Zhang et al., 2014). Anthocyanins contribute greatly to the quality of horticultural crops by affecting their colors and health-promoting properties. High dietary intake of foods rich in anthocyanins can help reduce cancer risks (Thomasset et al., 2009). Clarifying the mechanisms underlying the formation of purple cabbage progeny will greatly facilitate breeding.
Anthocyanins, the most prominent class of flavonoids, which are widespread in nature, are implicated in protecting vegetative organs from biotic and abiotic stress (Steyn et al., 2002). Structural genes in the anthocyanin biosynthesis pathway were identified and characterized in early studies of Zea mays, Antirrhinum majus, Petunia hybrid, and Arabidopsis thaliana (Winkel-Shirley, 2001; Koes et al., 2005). Anthocyanin biosynthesis is primarily regulated at the transcriptional level. Studies in A. thaliana revealed the presence of the MYB-bHLH-WD40 (M-B-W) ternary transcriptional activation complex (Zhang et al., 2003; Baudry et al., 2004), which has subsequently been identified in a number of species (Feller et al., 2011). The transcription factors R2R3-MYB and bHLH can bind to specific cis-elements in promoters of structural genes (Lang et al., 2010). While the levels of MYB and bHLH differed from cell types and fluctuate in changing environments (Albert et al., 2011), the transcription factor WD40 always maintained at the same level (Morita et al., 2006). Some MYB and bHLH proteins are autoregulated (Baudry et al., 2006; Espley et al., 2009), and bHLH can be regulated by MYB (Baudry et al., 2004; Zhu et al., 2015). In seedlings and leaves of Arabidopsis, the R2R3-MYB proteins PAP1, PAP2, MYB113, and MYB114, the bHLH proteins TT8, EGL3, and GL3 and the WD40 protein TTG1 are involved in the upregulation of anthocyanin biosynthesis (Gonzalez et al., 2008). When PAP1 was overexpressed in Arabidopsis, the anthocyanin content dramatically increased (Tohge et al., 2005; Rowan et al., 2009), as was the case for its homologs in Brassica (Chiu et al., 2010). Additional R2R3-MYB homologs are involved in anthocyanin biosynthesis in Solanum lycopersicum (ANT1) (Mathews et al., 2003), Ipomoea batatas (IbMYB1) (Mano et al., 2007), Malus domestica (MdMYB10) (Espley et al., 2009), and Citrus sinensis (Ruby) (Butelli et al., 2012).
Regulatory mechanisms for anthocyanin biosynthesis in many species, especially in the model plant Arabidopsis, are relatively well-understood, and they should help in clarifying the mechanisms underlying the formation of the anthocyanin overaccumulation phenotype of the parental purple Brassica juncea. However, the situation is complicated in the case of purple B. rapa obtained from introgressive hybridization. We need to solve not only the problem of finding the candidate genes but also the flow patterns of genetic materials from the donor genome to the recipient. Confirmation of the flowed components will also help in the search for the candidate genes in the progeny. In the current study, we performed RNA-seq of an introgression line to obtain information.
Transcriptome sequencing techniques, such as microarray analysis and RNA-seq, have led to breakthroughs in understanding the genetic mechanisms of metabolism pathways at the transcriptional level. RNA-seq provides more information on both known and unknown transcripts, and it is more suitable for data mining of a known genome with generally unknown exogenous segments containing candidate genes responsible for the interesting traits. However, use of the current pipelines has been restricted to species with (Trapnell et al., 2012) or without (Grabherr et al., 2011) a whole-genome reference sequence. For introgressive hybridization, the use of a pipeline with a reference sequence (with-reference pipeline) often results in the loss of exogenous transcripts, while the use of a pipeline without a reference sequence (without-reference pipeline) often leads to the loss of genome location and junction information. Using a novel bioinformatic analysis strategy that combines with-reference and without-reference pipelines, we aimed to determine the candidate factors responsible for the formation of the purple leaf trait in donor B. juncea and hybrid B. rapa that flowed between different genomes. During breeding, hybridization processes often occur between a projected crop species and its relatives with interesting traits to genetically improve crop quality. This introgression line transcriptome-based method will be useful for mining candidate genes of interesting traits in different crops and horticultural species.
Materials and Methods
Plant Materials and Sample Collection
The B. rapa introgression line (Figure 1E) with dark-purple leaves was derived from a cross between B. juncea “Hunan Qianyang” (donor, AABB; 2n = 36) and B. rapa “Charming Yellow” (recipient, AA; 2n = 20) by using the embryo rescue technique (Sharmal et al., 1996). Purple B. juncea is a local variety of Hunan Province, China, and it originated by natural mutation. To clarify the inheritance pattern of purple B. juncea, we crossed purple B. juncea with a green cultivar and grew F2 segregation populations (n > 200) for 2 years in an open field. The chi-square showed that the F2 segregation ratio of purple to green individuals was 3:1. Heterologous hybrids of the donor and recipient with the purple phenotype were selected to backcross with the recipient green B. rapa for one generation, followed by self-crossing for three generations, after which the leaf color trait and chromosome number (2n = 20) of the offspring became stable (Li and Zhang unpublished data). To collect samples for transcriptome sequencing, purple B. rapa introgression line (maternal parent) and green B. rapa (paternal parent) individuals were crossed to construct the F1 generation and F2 segregation population. The plants used for RNA-seq, high-performance liquid chromatography with mass spectrometry (HPLC-MS), and PCR were grown in an open field in Beijing, China, at a temperature of 10 to 15°C.
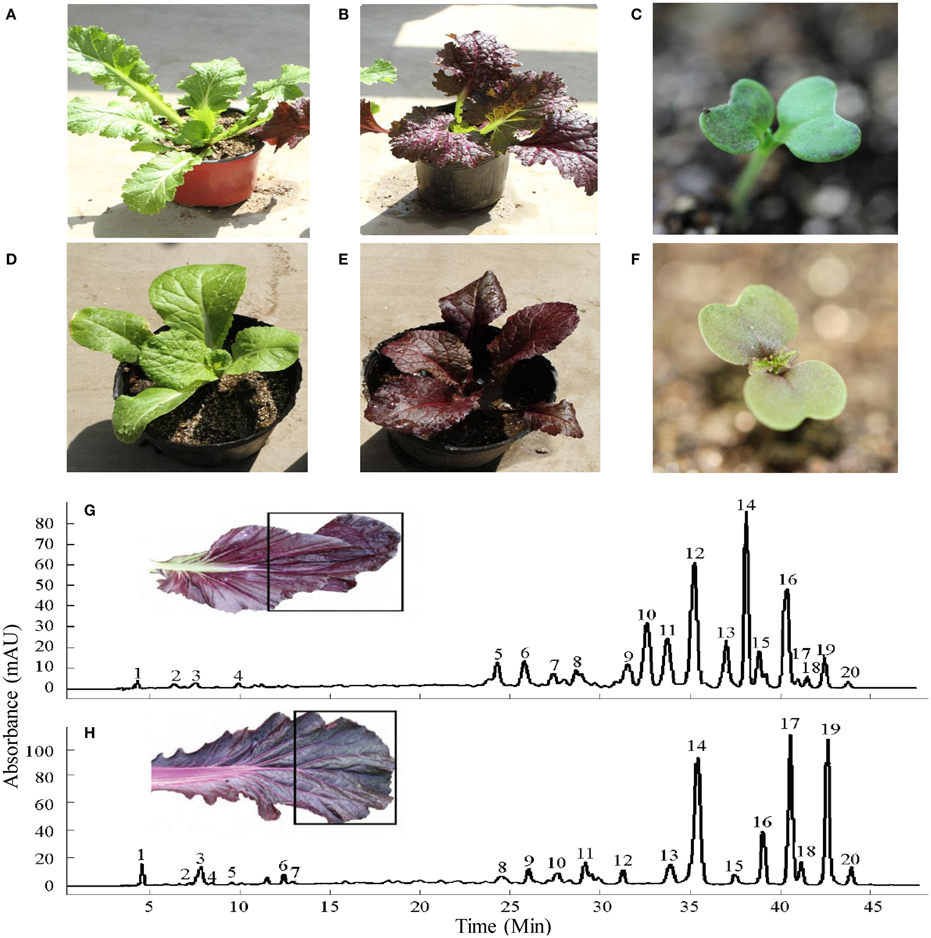
Figure 1. Young plants of green B. juncea (A) and donor purple B. juncea (B) cotyledons of purple B. juncea (C) young plants of recipient green B. rapa (D) and introgression line purple B. rapa (E) cotyledons of purple B. rapa (F). HPLC chromatograms for the anthocyanins of purple B. juncea (G) and purple B. rapa (H) extracts recorded at 530 nm (peak numbers refer to the anthocyanins listed in Table 1). The black boxes on leaves show the sampling sections. Modified from Zhang et al. (2014).
For RNA-seq, cotyledons of two purple (P1 and P2) and two green (G1 and G2) Chinese cabbages were randomly chosen from the F2 population and used to construct an mRNA-seq library with the TruSeq RNA Sample Preparation Kit (Illumina) and insert sizes of 200 ± 25 bp for each sample and was sequenced using the Illumina HiSeq™2000 platform. All RNA-seq reads and de-novo assembled transcripts have been submitted to the NCBI SRA and TSA databases (http://www.ncbi.nlm.nih.gov/) under BioProject 312129.
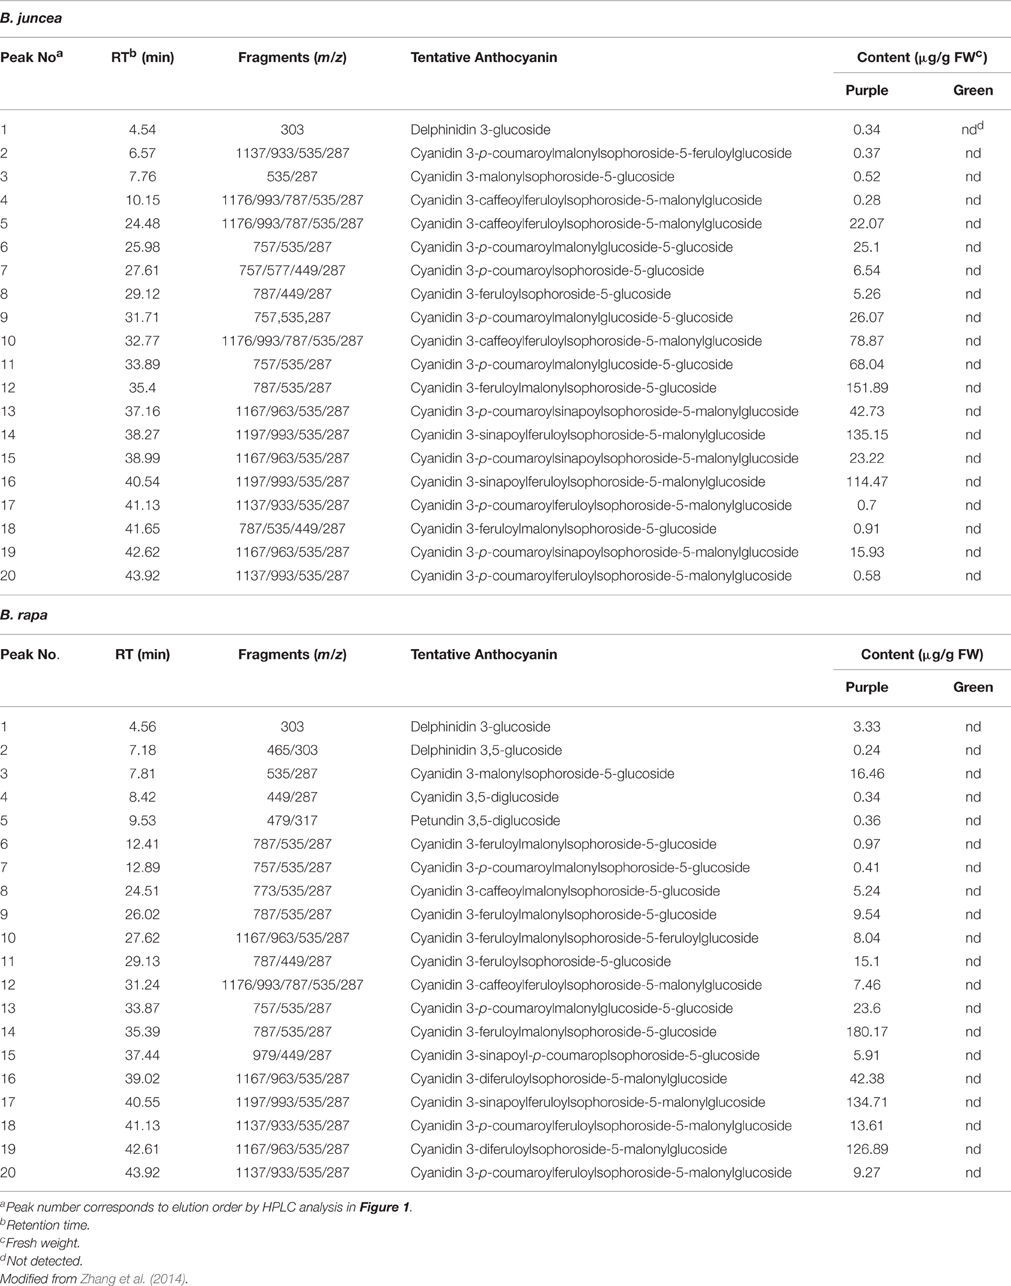
Table 1. Anthocyanin identified in leaves of the purple B. juncea and introgression line purple B. rapa.
For HPLC-MS analysis, the tip of the blades were cut from young leaves of purple B. juncea and purple B. rapa. For PCR amplification of DNA sequences of predicted transcripts, young leaves of B. rapa (green, recipient), Brassica nigra (green), B. juncea (purple, donor), B. rapa (purple, introgression line), B. rapa (green), and purple and green individuals from F2 segregation of the B. rapa introgression line and green B. rapa were collected.
For cold and high light treatments, all the purple and green B. juncea and purple B. rapa individuals were grown till 1 month of age in a greenhouse and then transferred to an artificial climate incubator (MGC-250P; Shanghai Yiheng Technical Co., Ltd). The plants were initially grown under 16/8-h light/dark cycles for 5 days, with a light intensity of 4000 lx and a temperature of 25°C. At the end of this period, young leaves of the green and purple B. juncea lines (7 cm in length) were collected. Green B. juncea samples were used as the control for purple B. juncea, and the two purple lines were used as the control for the stress environmental treatments. Then, light intensity and temperature parameters were changed to 12,000 lx and 10°C, respectively, for the same period of 5 days, and leaves of the same size were selected for the cold and high light treatments. Three biological replicates were collected at each sampling time.
HPLC-MS Analysis
The leaf samples were extracted in 60% ethanol aqueous solution (pH value adjusted to 3; solid:liquid ratio of 1:20) at 50°C for 2 h and then filtered through a membrane filter (0.22 μm). The extract was injected into a C18 column (4.6 × 150 mm, 5 μm; Waters XBridge) mounted on an analytical HPLC-MS system (Agilent 1200 series, Ion Trap 6310). Elution was performed using mobile phase A (5% formic acid aqueous solution) and mobile phase B (acetonitrile). Detection was performed at 530 nm, and the column oven temperature was set at 25°C. The flow rate was 0.8 mL/min. The gradient program was as follows: 0–15 min, 10–13% B; 15–45 min, 13–20% B; 45–50 min, 20–23% B; and 50–55 min, 23–100% B. Quantification of the different anthocyanins was based on peak areas and calculated as equivalents of the external standards; cyanidin 3,5-diglucoside was used as the reference standard (Extrasynthese). The mass spectrometer conditions were as follows: ESI interface; nebulizer, 50 psi; dry temperature, 350°C; scan range, 100–1500 m/z; and nitrogen flow rate, 12 L/min.
Transcriptome Analysis
The B. rapa reference genome v1.5 sequence and the 41,019 reference transcripts were downloaded from the BRAD database (http://brassicadb.org/) (Cheng et al., 2011). As shown in Figure 2, two successive alignments of reads were performed for DEG analysis. The first step was alignment of the reads to the B. rapa reference genome. To process the raw reads, NGS QC Toolkit v2.3.3 (Patel and Jain, 2012) was used to discard the pair-end reads containing ambiguous Ns or low quality bases (PHRED-like score <20) exceeding 20%. The first unstable 10 bp of filtered reads were trimmed. Clean reads of four samples were mapped to the B. rapa reference genome sequence using TopHat v2.0.9 (Trapnell et al., 2009) with default settings. After duplicates were removed using SAMtools v0.1.19 (Li et al., 2009), the accepted reads were assembled according to the B. rapa reference general feature format files, and the abundance of each sample was estimated using Cufflinks (v2.2.1) (Trapnell et al., 2010). DEGs were extracted using cummeRbund v2.12.0 (Goff et al., 2013) with a false discovery rate (FDR ≤ 0.001) and |log2FC| ≥ 1 and were displayed using Circos v0.66 (Krzywinski et al., 2009). The unmapped reads were transformed back to fastq format with bam2fastq v1.1.0 (http://www.hudsonalpha.org/gsl/information/software/bam2fastq) for subsequent de novo assembly using Trinity r20140717 (Grabherr et al., 2011). The ORFs were predicted and redundancy was removed using EMBOSS v6.6.0 (Rice et al., 2000) and Cd-hit v4.6.1 (Li and Godzik, 2006), respectively.
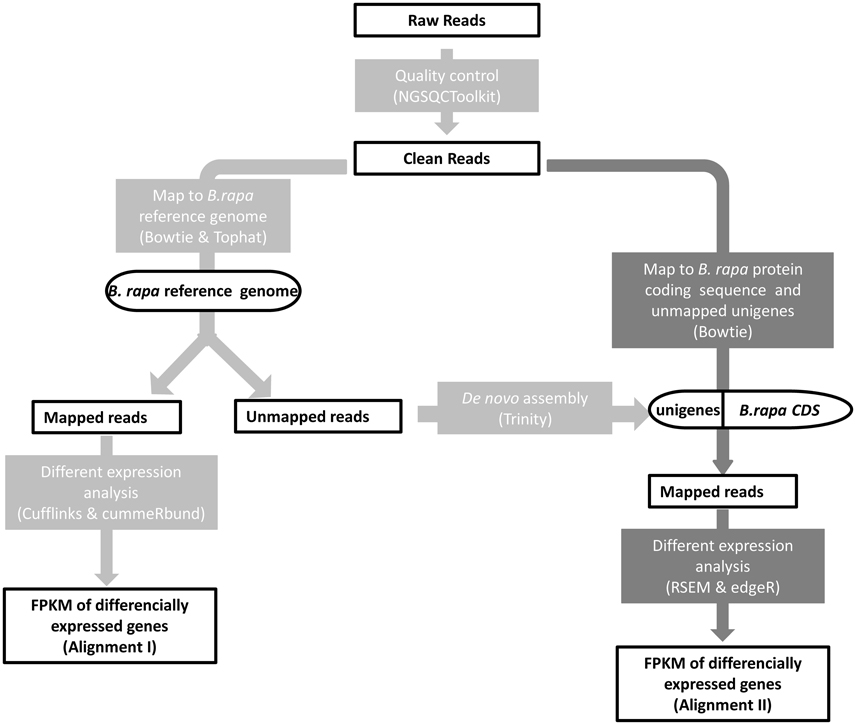
Figure 2. Mapping strategy. Alignment I (light gray): reads mapping to the B. rapa reference genome; Alignment II (dark gray): reads stem from the unmapped reads of Alignment I mapping to the B. rapa transcript sequences and de novo assembled unigenes.
Second, clean reads were aligned to the merged transcript sequences of 41,019 reference B. rapa genes and 27,286 newly obtained unigenes from the de novo assembly of unmapped reads. The mapping statistics of the two alignments, Alignment I and Alignment II, are shown in Supplemental Table 4. Only uniquely mapped reads were reserved. RSEM v1.2.8 (Li and Dewey, 2011) and edgeR v3.12.0 (Robinson et al., 2010) were used to distinguish the DEGs. The same thresholds of FDR ≤ 0.001 and |log2FC| ≥ 1 or more were used to judge the significance of differences and to identify DEGs. Annotation of these transcripts was performed with MapMan (Thimm et al., 2004) using homologous A. thaliana genes in TAIR10 (Lamesch et al., 2012). The conserved domain annotation was performed using CCD (Marchler-Bauer et al., 2015) in NCBI.
Multiple Sequence Alignment and Phylogenetic Analysis
R2R3-MYB gene families were obtained from the B. rapa genome using the BLAST algorithm v2.2.28+ (Altschul et al., 1990) and HMMer v3.0 (Eddy, 2009) and were visually verified. Anthocyanin-related R2R3-MYB homologous protein sequences were obtained from GenBank. A multiple sequence alignment was assembled using MAFFT v7.266 (Katoh et al., 2002) and manually adjusted. The conserved domain (nucleotide-binding site) sequences of the R2R3-MYB proteins were extracted to construct a neighbor-joining tree in MEGA5 (Tamura et al., 2011) with 1000 bootstraps.
Sequence Amplification and Real-Time Quantitative PCR
DNA was isolated from leaves by the CTAB method and diluted to ~500 ng/μl. Full-length gene sequences or fragments were amplified using Ex Taq® (Takara) DNA polymerase. Total RNA was isolated from young leaves using a Trizol® Reagent Kit (Invitrogen) according to the manufacturer's instructions. Subsequently, the RNA was reverse transcribed using a TransScript® One-Step gDNA Removal and cDNA Synthesis SuperMix Kit (TransGen Biotech Co., Ltd.). Real-time quantitative PCR (qPCR) was performed in a MX3000P qPCR system (Agilent). The PCR mixture (final volume of 20 μL) contained 10 μL SYBR® Premix Ex Taq™ (Takara), 0.4 μL ROX Reference Dye (Takara), 0.2 μM of each gene-specific forward and reverse primer and ~50 ng of cDNA. The following thermal profile was used: 45 cycles of 95°C for 5 s, 56°C for 10 s and 72°C for 10 s. The results were analyzed using the 2−ΔΔCT method (Livak and Schmittgen, 2001), with the stable housekeeping gene eEF1Bα2 (Bra002241) as the internal control (Tong et al., 2013). Primers used in the above experiments are listed in Supplemental Table 5.
Results
Alignment of Reads to the B. rapa Reference Genome and Differentially Expressed Gene (DEG) Analysis Reveal Up-Regulated Genes in the Anthocyanin Pathway
The B. rapa introgression line (Figure 1E) used in this study, with dark-purple leaves, was derived from a cross between purple B. juncea and green B. rapa by using the embryo rescue technique (see Materials and Methods). The purple phenotype of the donor plant B. juncea was controlled by a single gene with dominant inheritance, as determined by the hybridization and F2 segregation ratio (purple:green = 3:1) between purple B. juncea (Figure 1B) and green B. juncea (Figure 1A). The leaf blades of the purple B. rapa were darker than that of the donor purple plant; the leaf veins of B. rapa were purple, while the leaf veins of B. juncea were green (Figures 1B,E). Pigments were differentially distributed in the cotyledons: Dark purple color was scattered in B. juncea and gathered near the veins in B. rapa. (Figures 1C,F). We used the purple B. rapa and green B. rapa (Figure 1D) as the parents to obtain an F2 segregation population. Purple and green individuals in the F2 population were selected to perform chemical component and transcriptome analyses. Anthocyanin contents and components of the donor purple B. juncea and introgression line purple B. rapa were extracted for the HPLC-MS analysis (Figures 1G,H; Table 1), as described in our previous study (Zhang et al., 2014). The analysis revealed that the purple individuals of B. juncea and B. rapa all accumulated higher contents of anthocyanins than the green ones; both had cyanidin-type anthocyanins as the main components, but differences existed in the modification of the acyl groups (Table 1).
Cotyledons of two purple and two green Chinese cabbage from the F2 segregation population were collected for RNA sequencing. Because the main genetic background of this Chinese cabbage introgression line is B. rapa, we first mapped the clean reads to the genome sequence of B. rapa cultivar “Chiifu” and identified DEGs, as shown in the light-gray pipeline on the left side of Figure 2. Under a threshold of FDR ≤ 0.001, |Log2FC| ≥ 1 and fragments per kilobase of transcript per million (FPKM) (Mortazavi et al., 2008) mapped reads values > 10 in both sample sets, we determined 930 significant DEGs (Supplemental Table 1), including 389 up-regulated and 541 down-regulated.
Among the up-regulated genes, almost all of the structural anthocyanin pathway genes (Guo et al., 2014) were found, as they had significantly higher fold-changes than average (Figure 3). These anthocyanin pathway genes were scattered among the chromosomes, and their expression levels did not show any correlation with genome blocks or degrees of gene density (Cheng et al., 2014). This result indicates that regulatory genes or more upstream mechanisms play a major role in coordinately regulating the entire pathway.
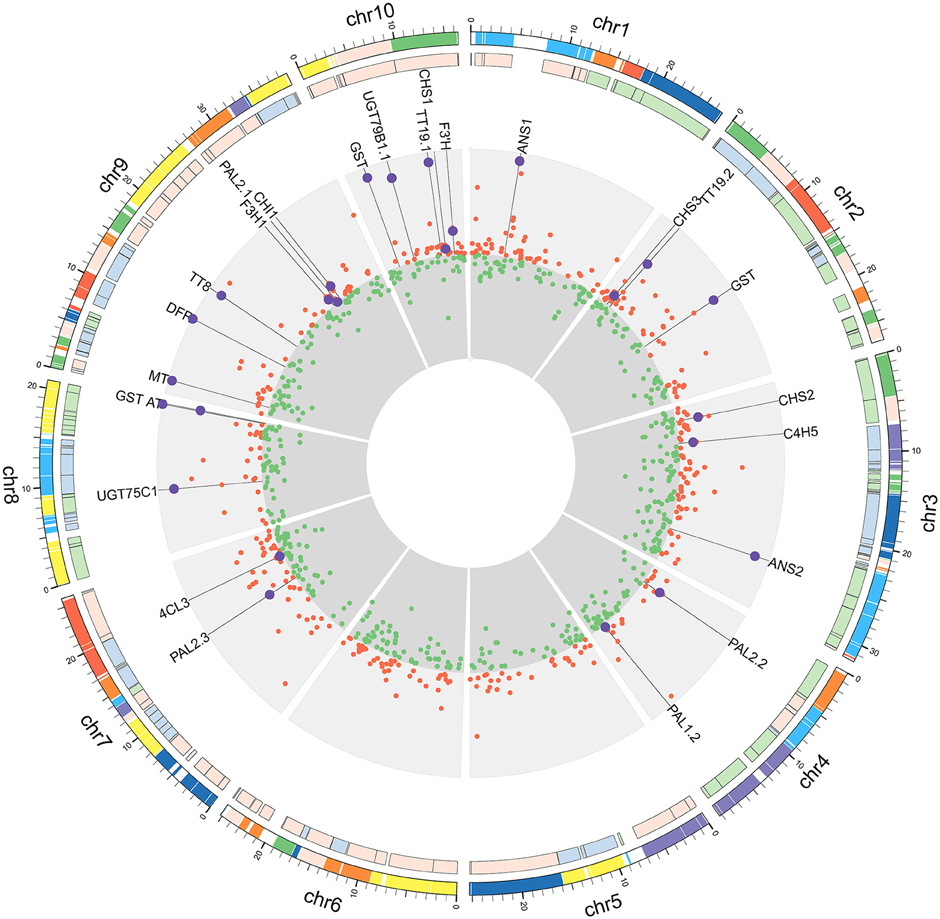
Figure 3. DEGs from reads mapped to the B. rapa genome. From the outer ring to the center: genome blocks designated by different colors (Cheng et al., 2013); degree of gene density designated by different colors (Cheng et al., 2014); Log2FC values of up-regulated genes (red circle, outward orientation); Log2FC values of down-regulated genes (green circle, inward orientation). The values in both up- and down-regulated regions were set to the highest |log2FC| value. Larger purple circles represent anthocyanin-related genes.
The formation and amplification of the ternary transcriptional activation complex are prerequisites for the transcription of structural genes in the anthocyanin pathway (Zhu et al., 2015). Thus, except for WD40, which is constitutively expressed, at least one bHLH and one R2R3-MYB should be up-regulated in the purple line. However, only one regulatory gene, Bra037887 (bHLH), was significantly up-regulated in this line, and we did not find any up-regulated R2R3-MYB genes among the DEGs in the B. rapa genome, suggesting that some information was missing. Therefore, to avoid missing any information, we focused on unmapped reads.
The De novo Assembly of Unmapped Reads and Mining of a New Set of Candidate Genes
To obtain additional information, we mined unmapped reads. After de novo assembly and identification of unique ORFs, 27,286 unigenes were discovered. We merged these unigenes with 41,019 B. rapa gene-coding sequences and aligned the clean reads from four samples to this new chimeric database (Figure 2, dark gray pipeline). Under the threshold of FDR ≤ 0.001 and |Log2FC| ≥ 1, a total of 2996 differentially expressed transcripts (Supplemental Table 2) were identified, including 2031 de novo assembled unigenes. By comparing these unigenes with their B. rapa homologs, were determined that their similarity values mainly ranged from 90 to 95%. Considering the homologous recombination events during hybridization, and the source of those de novo assembled transcripts, we thought that chromosomal locations of transcript-coding genes might reflect some specific patterns. So we divided the 2996 transcripts into four groups, including 580 up-regulated B. rapa genes, 385 down-regulated B. rapa genes, 1814 up-regulated unigenes and 217 down-regulated unigenes, and we displayed the genome locations of B. rapa genes or the best B. rapa genes hits of unigenes. An interesting pattern emerged, that is, the 1814 up-regulated unigenes were clustered in two segments on chromosome 1 and 2, while the three other groups were not (Figure 4). These results suggest that a large segment may have been imported from the exogenous genome to the B. rapa AA genome.
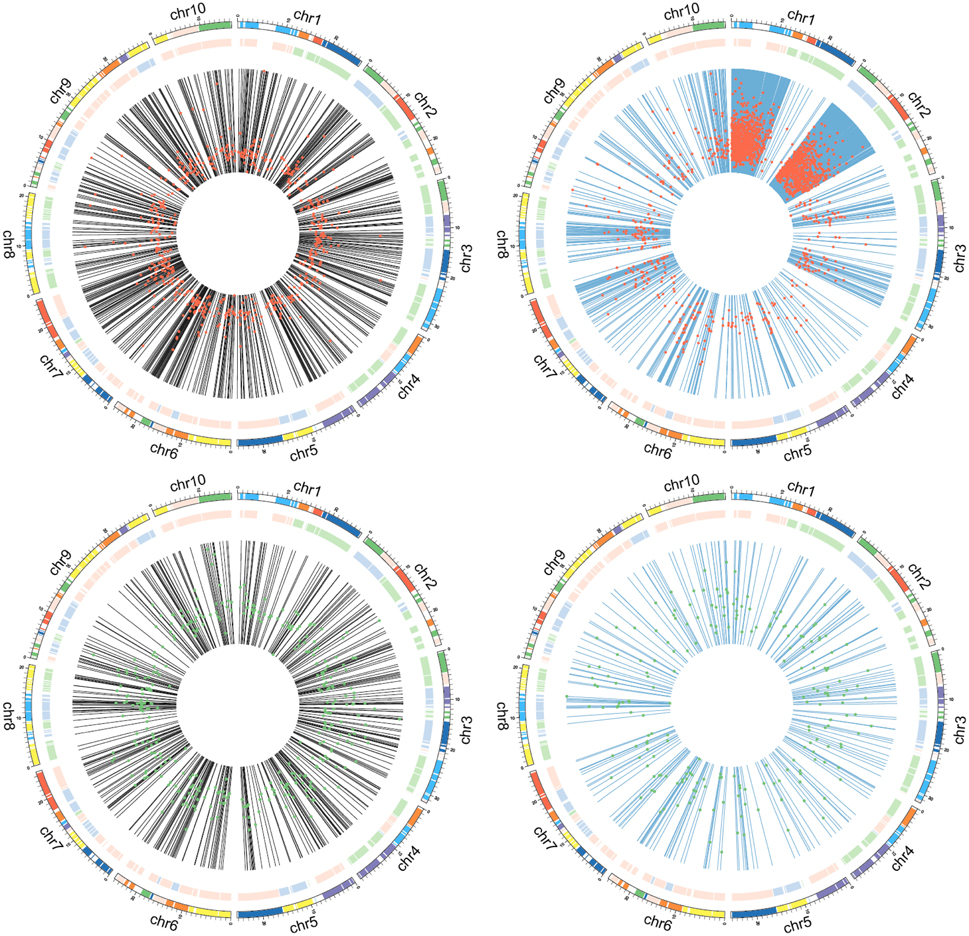
Figure 4. Chromosomal locations of differentially expressed transcripts. Black lines show the chromosomal locations of B. rapa genes, blue lines show the chromosomal locations of B. rapa genes most similar to unigenes; red dots represent upregulation, with Log2FC values increasing from the inner to outer regions; green dots represent downregulation, with Log2FC values increasing from the inner to outer region.
Figure 5 shows a depiction of the up- and downregulation of the transcripts constructed using MapMan software. Several significantly differentially expressed pathways were distinguished by the Wilcoxon Rank Sum test (probability < 0.05), including hormone metabolism, protein, tricarboxylic acid cycle, minor carbohydrate metabolism, signaling and secondary metabolism. When the DEGs were sorted by the Log2FC values of transcripts, anthocyanin pathway genes, from phenylalanine ammonia lyase to glutathione-S-transferase, were clearly up-regulated synergistically. Supplemental Table 3 lists the Log2FC values of anthocyanin pathway genes originating from the two alignments. The Log2FC values between these alignments had a Spearman correlation coefficient of 0.99, indicating the consistency of the results achieved using the two different methods. However, there were additional homologous transcripts in the unmapped reads (Figure 6, dark gray background). These anthocyanin structural genes with a non-AA genome origin may contribute to the dosage effect responsible for the darker purple appearance of introgression line B. rapa compared to their B. juncea donor (Figure 1). And the existence of different glycosyltranferases and acyltransferases may cause slight difference of anthocyanin types between purple B. juncea and purple Chinese cabbage.
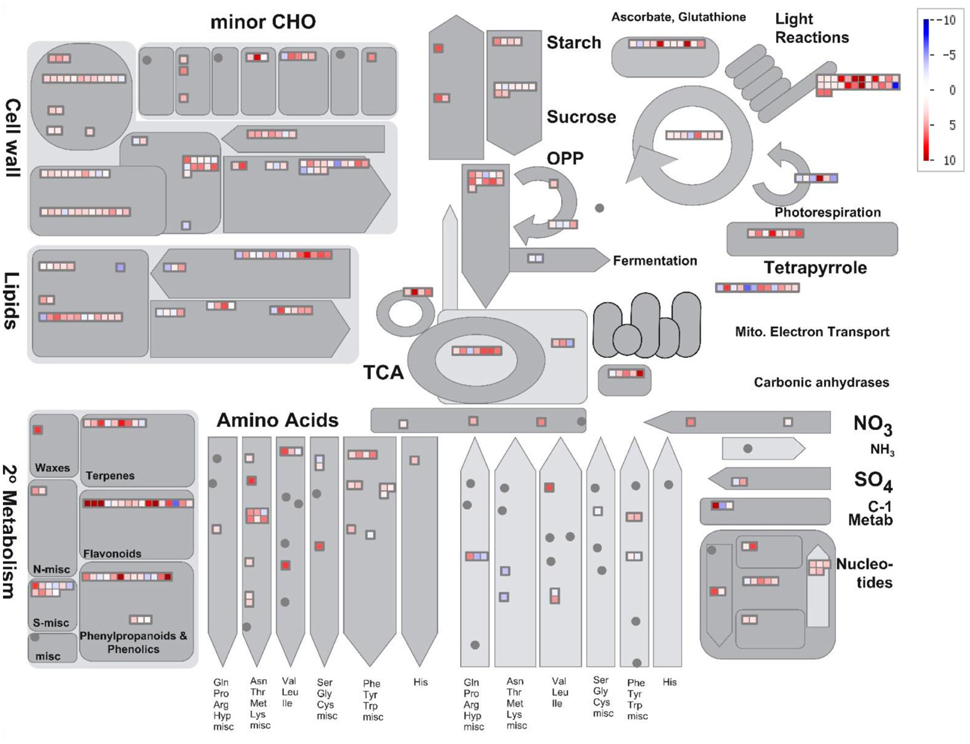
Figure 5. Overview of changes in metabolic-related gene expression in anthocyanin-overaccumulating leaves. DEGs were binned to MapMan functional categories. Log2FC values of up- and down-regulated transcripts are shown in red and blue, respectively.
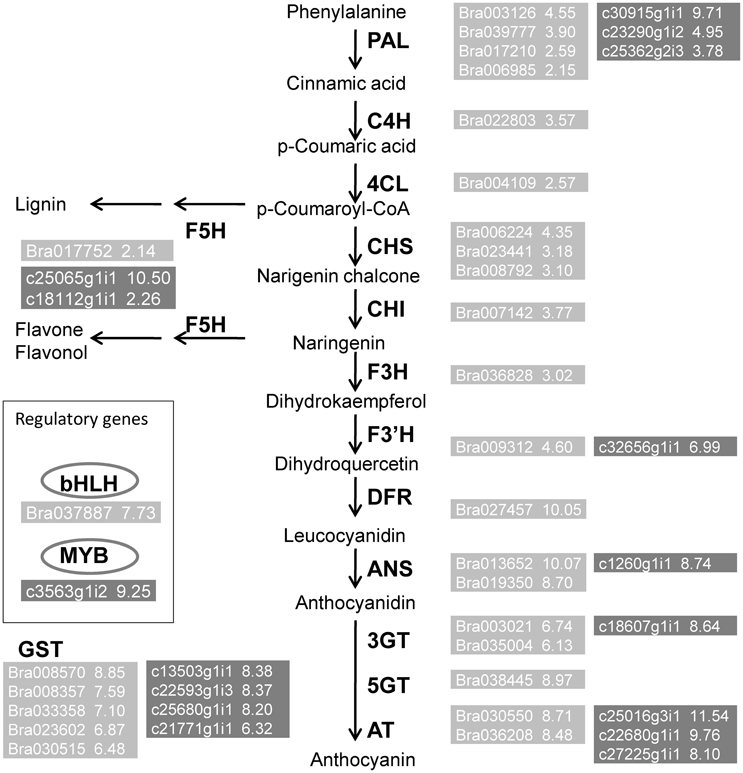
Figure 6. Up regulated genes belong to the anthocyanin biosynthesis pathway. Transcripts obtained from Alignment I (light gray) and Alignment II (dark gray). Numbers beside gene names represent up-regulated Log2FC values.
More importantly, in the unmapped parts of the reads, we identified an R2R3-MYB transcript, c3563g1i2. According to the annotation, c3563g1i2 is the homolog of Arabidopsis MYB90, also known as production of anthocyanin pigment 2 (PAP2), implying that its function is related to anthocyanin biosynthesis. We used the protein sequence of c3563g1i2, along with the protein sequences of all R2R3-MYBs in the B. rapa genome and anthocyanin-specific R2R3-MYBs in the literature, to construct a neighbor-joining tree (Figure 7). In this phylogenetic tree, c3563g1i2 and its Brassicaceae homologs are clustered together, embedded in a clade consisting of anthocyanin-related R2R3-MYBs of various species and cell types. Thus, c3563g1i2 may represent the R2R3-MYB that participates in the ternary transcriptional activation complex responsible for the anthocyanin overaccumulation phenotype of the B. rapa introgression line.
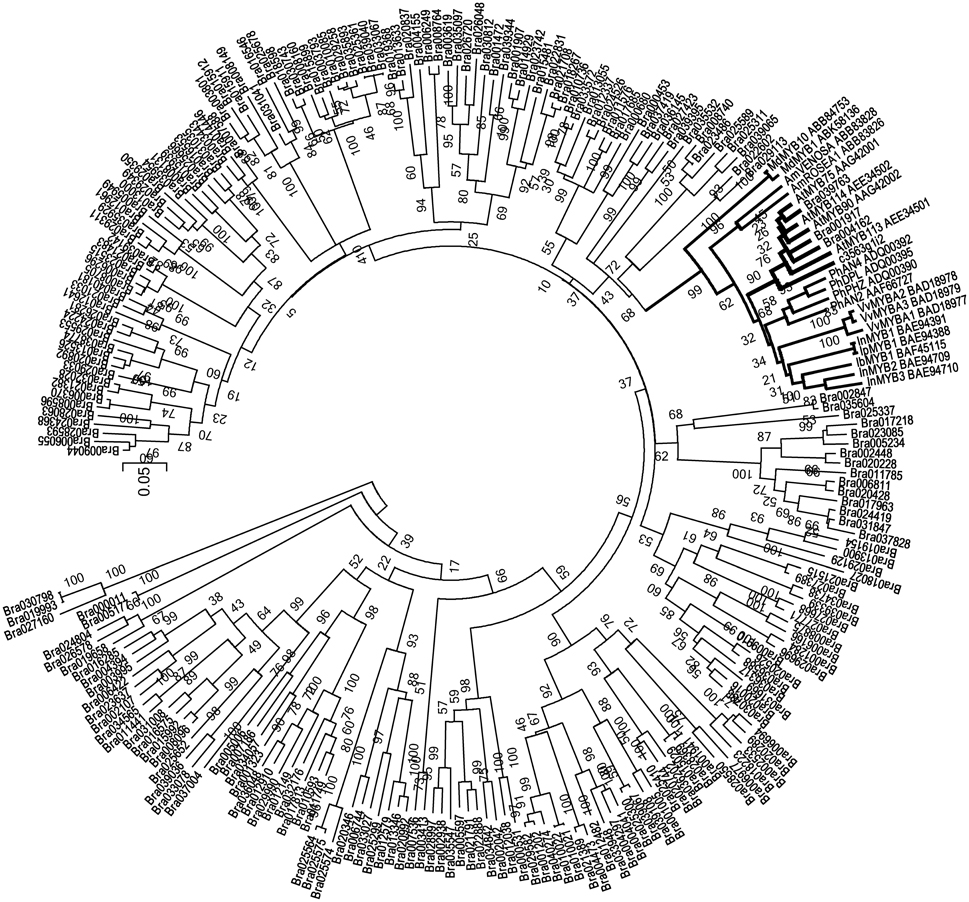
Figure 7. Neighbor-Joining tree of R2R3-MYB sequences containing c3563g1i2, anthocyanin-related R2R3-MYB (indicated as names in reference, and accession numbers in GenBank) and all of the R2R3-MYB superfamily members of B. rapa.
In addition to structural and regulatory genes involved in anthocyanin biosynthesis, genes involved in cold and light reaction pathways, such as homologs of cold-related 6.6 (c23142g1i5) and photosystem II subunits R (c20348g1i2), were expressed at extremely high levels in purple individuals compared to green individuals in the F2 population, as shown in Supplemental Table 2. As it is known that anthocyanin biosynthesis often response to environmental changes, these transcripts may need to be included as candidates, validating their genome sequences at the DNA level and transcriptional expression at the RNA level. Accordingly, the B. rapa gene Bra037887 and the unigenes c3563g1i2, c23142g1i5, and c20348g1i2 were selected for further analysis.
Experimental Verification of Candidate Genes Responsible for the Anthocyanin Overaccumulation Phenotype
Bioinformatics analysis of transcripts derived from unmapped reads suggested that B genome components flowed to purple Chinese cabbage. To help confirm this hypothesis, we designed primers for specific sites in unigenes c3563g1i2, c23142g1i5, and c20348g1i2 that can distinguish these genes from their AA genome homologs and performed PCR using DNA samples extracted from the donor plant purple B. juncea, recipient green B. rapa, Brassica BB genome plant Brassica nigra and F2 individuals with purple or green leaves. As shown in Figure 8A, bands of c3563g1i2 (BjPAP1), c23142g1i5 (BjCOR6.6), c20348g1i2 (BjPsbR) of the expected sizes could be amplified from purple B. rapa and all materials with a Brassica B genome, but not from the green B. rapa parent or green F2 offspring. We confirmed the PCR fragments by Sanger sequencing and found that all had the same sequence as transcripts assembled from RNA-seq reads. These results help confirm the notion that the B genome components flowed to the purple Chinese cabbage genome.
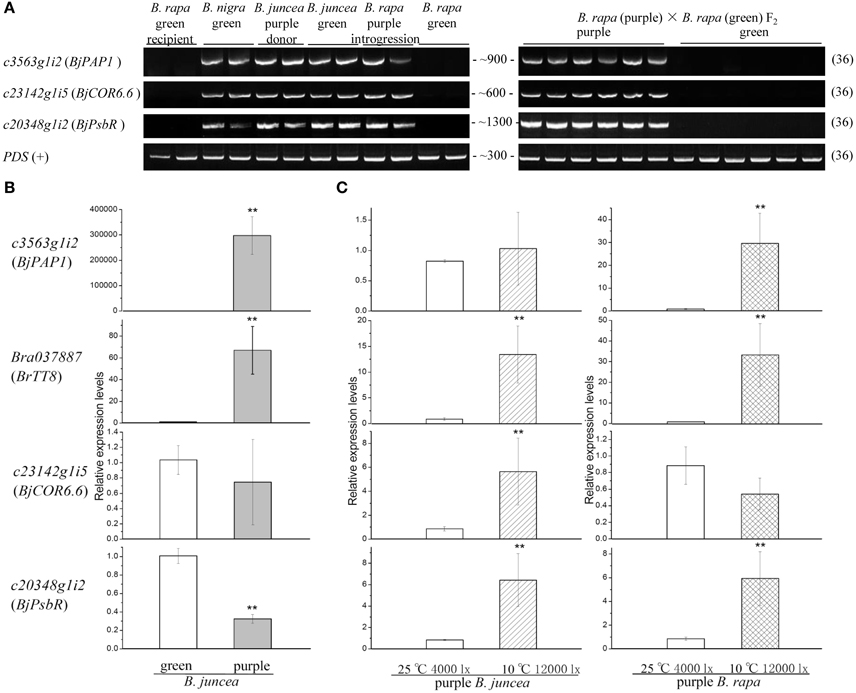
Figure 8. PCR and qPCR validation of candidate transcripts. (A) PCR amplification (all 36 cycles) of candidate genes from different lines. PDS was used as a positive control. (B) Relative expression levels of green and purple B. juncea (eEF1Bα2 was used as an internal control). (C) Relative gene expression levels under cold and high light treatment (eEF1Bα2 was used as an internal control). **Means statistically significant.
Since, the purple vs. green trait in the B. rapa introgression line is not due to the presence or absence of a gene at the DNA level, we did not perform qPCR to compare the transcript abundance in B. rapa; instead, we performed qPCR to compare B. juncea with purple vs. green leaves. We selected green B. juncea varieties grown in the same environment as controls to obtain relative gene expression levels. The anthocyanin pathway regulatory genes c3563g1i2 and Bra037887 were significantly up-regulated in purple individual (Figure 8B), especially the B. juncea PAP1 homolog c3563g1i2. This result is consistent with the finding from many previous studies that overexpressing anthocyanin-related R2R3-MYB always leads to anthocyanin overaccumulation (Borevitz et al., 2000; Chiu et al., 2010).
During planting, we observed that the color of purple Chinese cabbage leaves often changed to a small extent when the climate changed. To analyze the influence of the environment on gene expression in purple Chinese cabbage, we used temperature and light treatments to observe the behaviors of the selected transcripts (Figure 8C). In previous studies on wild type Arabidopsis, low temperature often induced the transcription of anthocyanin regulation genes in a light-dependent manner (Leyva et al., 1995; Soitamo et al., 2008). The light and temperature conditions were set to about 7100 lx (100 μmol·m−2·s−1) and 4°C, respectively. In a PAP1 overexpression line, the leaves were dark purple at 22°C (440 μmol·m−2·s−1) and still purple at 30°C (150 μmol·m−2·s−1) (Rowan et al., 2009). On the basis of both the reported range and growth circumstances of Brassica plants in greenhouses during late autumn (10–25°C and 4000–12000 lx), the treatment parameters in this study were set to a moderate combination of 10°C and 12000 lx, with 25°C and 4000 lx as the controls. In the donor purple B. juncea, cold and high light treatments significantly influenced the expression of Bra037887, c23142g1i5, and c20348g1i2, but not c3563g1i2. In purple B. rapa individuals of the introgression line, c3563g1i2, Bra037887, and c20348g1i2 were upregulated, but c23142g1i5 was not. The responses of c23142g1i5 to external conditions were significant in the original genome, but altered in the new genome. As for c3563g1i2, when transferred to another genome, the environmental effect was more apparent. These results reveal the environmental influence on candidate genes and imply that some transcripts exhibit different behaviors during hybridization and gene flow.
According to fold changes, the varying expression of c3563g1i2 caused by genetic divergence provides the main effect underlying the purple leaf trait. In addition, c23142g1i5 and c20348g1i2 are slightly upregulated by the cold and high light in B. juncea, suggesting that environmental factors also contribute to the phenotypic presentation. Changes in both DNA and mRNA levels of the candidate genes originating from the donor plants are attributable to the ultimate phenotype of the purple Chinese cabbage.
Discussion
Candidate Genes Flow from the Donor's Genome to the Recipient's genome to Influence the Hybrid Phenotypes in a Dosage-Dependent Manner
By analyzing transcriptomes of Chinese cabbage leaves with purple and green color, we gradually mined candidate genes responsible for anthocyanin overaccumulation trait. Of the mapped B. rapa AA genome transcripts examined, we found only the bHLH regulatory genes and a greater proportion of structural genes. From the set of unmapped reads, we identified an exogenous R2R3-MYB gene and another group of structural genes. PCR and qPCR validation indicated that c3563g1i2 from the green B. juncea and purple B. juncea lines did not differ in terms of their protein-coding nucleotide sequences, whereas they exhibited highly different expression levels. As no other R2R3-MYB transcript was up-regulated in the purple- vs. green-leaf lines, have the c3563g1i2 genes or not is the key reason for the purple phenotype in both B. juncea and B. rapa. The extremely close relationship among species within Brassica likely provides compatibility between the M-B-W regulatory machinery and their binding sites in promoters of structural genes originating from the AA or BB genome. Hence, the integrity of the M-B-W regulatory complex and the up-regulation of its members' transcripts are necessary for the formation of the purple trait. Reasons that caused the overexpression of c3563g1i2 has not been analyzed. Potential differences may exist in cis regulatory regions or upstream trans factors, or even epigenetic marks (Wang et al., 2013). Moreover, the flowed structural genes may contribute to the content and modification of anthocyanins, which may explain why the purple leaves/cotyledons of the B. rapa introgression line are darker than those of the donor plant B. juncea, and slight modification difference between them.
In addition, based on RNA-seq sample sets related to anthocyanin phenotypes, analysis of the DEGs revealed some putative factors acting upstream of the M-B-W ternary transcriptional activation complex. Although anthocyanin accumulation is significantly induced after high light and cold treatment, all of the factors in the cascade have not yet been identified. In this study, we first predicted many highly up-regulated transcripts in purple individuals than in green under the same environmental conditions, including factors responding to cold and light, along with hormone and signaling pathways. By PCR and Sanger sequencing, the selected two transcripts c23142g1i5 and c20348g1i2 were comfirmed as B genome components. As we investigated a line produced by introgressive hybridization, the large amounts of transcripts from genes encoding cold response and photosystem proteins identified in this study may have been due to the presence of chromosome segments transferred among different genomes on the DNA level. If genes are constitutively and highly expressed in the original genome, they would likely still contribute high levels of transcripts to the new recipient genome, explaining the significant DEGs identified by bioinformatics methods.
We performed qPCR to validate the expression levels of the selected transcripts in the purple B. juncea line and purple B. rapa introgression line. B. juncea homologs of COR6.6 and PsbR were significantly higher under cold and high light than under control conditions. This suggests that these transcripts respond to environmental changes, which might partly explain the small color changes in different climates. However, the presented fold changes were <10. The temperature (10°C) and light (12000 lx) treatments might not reach the strongest stress extent. As for c3563g1i2, the treatments did not cause any significant changes. We think this is because the transcriptional expression of c3563g1i2 in purple B. juncea was completely triggered by the genetic effect. Furthermore, we found that some transcripts exhibited divergent behaviors in the original and new recipient genome, for example, c3563g1i2 and c23142g1i5; this suggests a more complicated situation in the background genome. Thus, further analyses of the upstream mechanisms underlying the over-expression pattern of c3563g1i2 in the purple leaves of Brassica and expression behavior changes during transfer between genomes are required.
The identification of sequences with particular differential transcription patterns lays the foundation for further studies, especially in the vegetative tissues of horticultural Brassica crops.
RNA-seq Analysis Combining the with- and without-Reference Pipelines Will Assist in Candidate Gene Mining in Introgression Lines
Resistance or quality traits of related species provide abundant resources for varietal breeding. During the process of hybridization, the genes responsible for candidate traits are transferred between species. Determining the critical factors and mechanisms underlying this process would provide guidance for future breeding programs. Normally, gene flow caused by recombination or chromosome number variations can be detected using AFLP or SSR markers (Schlötterer, 2004), bulk segregant analysis (Quarrie et al., 1999), or whole-genome resequencing (Bentley, 2006). These methods are used to detect pivotal single nucleotide polymorphisms or insertion-deletions. However, these techniques only offer information at the DNA level, and much more complicated changes occur at the transcriptional or post-transcriptional levels. Therefore, identifying the transcriptomes of tissues with interesting traits using RNA-seq technology represents a more rapid, important supplemental method for elucidating these changes.
RNA-seq data, regardless of origin (i.e., from species with or without available whole-genome sequences) have mature pipelines (Grabherr et al., 2011; Trapnell et al., 2012). Since, the lines targeted for RNA-seq are not always the same as those used for whole-genome sequencing, these lines may differ from the reference lines due to their diverse breeding histories. To mine our introgression line for candidate genes, we employed combined bioinformatics pipelines for use with and without reference genomes. Using TopHat and Cufflinks software tools, FPKM values and alternative-splicing differences will be uncovered. Using unmapped reads and Trinity software, the possibility of losing important information during transcript assembly is reduced. Therefore, this method is particularly suitable for investigating introgression-like or even hybrid vigor situations with sequenced background genome and exogenous chromosome segment insertions.
Reads not aligned to the reference genome, except for true exogenous transcripts, will crease background noise due to the lack of a complete genome sequence, the presence of gaps or the lack of mitochondrial and chloroplast genomes. As shown in Figure 4, homologous transcripts outside the thickened region should represent false positives. We found that much of the noise can be eliminated by setting the appropriate thresholds for differential gene expression between the trait of interest and the control. However, fold change values often bring another type of noise, especially for genes that are highly expressed in the primary genome. Therefore, experimental validation by PCR or qPCR remains an important step for candidate gene screening. Along with annotations, these filtered candidate transcripts provide much data for further experimental analyses. Due to the rapid increase in whole-genome sequencing projects, our bioinformatics strategy may be applied to similar situations, making mining for candidate genes for interesting traits during introgression breeding more efficient.
Conclusions
We uncovered gene flow patterns during interspecific hybridization by performing transcriptome analysis of an introgression plant line. Anthocyanin overaccumulation-related genes in B. rapa introgression line were found in the original B. rapa A genome or were transferred from the Brassica B genome of B. juncea. Among these genes, the B. juncea anthocyanin regulatory gene R2R3-MYB was the major contributor to the purple leaf phenotype. DNA-level changes provided by donor chromosome segments, such as cold and light response factors, may also influence the leaf color phenotypes of the hybrids through upstream pathways of the anthocyanin regulatory complex. In addition, we developed a powerful pipeline for distinguishing transcripts originating from two genomes sharing a very close relationship and identified some interesting candidate genes.
Author Contributions
RS and ShuZ designed the study. LX conducted the experiments, analyzed the data and drafted the manuscript. FL prepared samples. WQ collected samples. ShiZ, HZ, and PL helped conduct experiments.
Funding
This research was supported by China Agricultural Research System (CARS-25-A-01), a Chinese 973 Program Grant (2012CB113900) and a Chinese 863 Program Grant (2012AA100100), both to RS. This study was carried out in the Key Laboratory of Biology and Genetic Improvement of Horticultural Crops, Ministry of Agriculture, P.R. China.
Conflict of Interest Statement
The authors declare that the research was conducted in the absence of any commercial or financial relationships that could be construed as a potential conflict of interest.
Acknowledgments
The authors are thankful to Guoliang Li and Yunxiao Wei for laboratory assistance and helpful comments about the study.
Supplementary Material
The Supplementary Material for this article can be found online at: http://journal.frontiersin.org/article/10.3389/fpls.2016.01245
Supplementary Table 1. DEGs of Alignment I.
Supplementary Table 2. DEGs of Alignment II.
Supplementary Table 3. FPKM values of anthocyanin biosynthesis genes in Alignment I and II.
Supplementary Table 4. Mapping statistics of Alignment I and II.
Supplementary Table 5. Primers used in PCR and qPCR validations.
References
Albert, N. W., Lewis, D. H., Zhang, H., Schwinn, K. E., Jameson, P. E., and Davies, K. M. (2011). Members of an R2R3-MYB transcription factor family in Petunia are developmentally and environmentally regulated to control complex floral and vegetative pigmentation patterning. Plant J. 65, 771–784. doi: 10.1111/j.1365-313X.2010.04465.x
Altschul, S. F., Gish, W., Miller, W., Myers, E. W., and Lipman, D. J. (1990). Basic local alignment search tool. J. Mol. Biol. 215, 403–410. doi: 10.1016/S0022-2836(05)80360-2
Baudry, A., Caboche, M., and Lepiniec, L. (2006). TT8 controls its own expression in a feedback regulation involving TTG1 and homologous MYB and bHLH factors, allowing a strong and cell-specific accumulation of flavonoids in Arabidopsis thaliana. Plant J. 46, 768–779. doi: 10.1111/j.1365-313X.2006.02733.x
Baudry, A., Heim, M. A., Dubreucq, B., Caboche, M., Weisshaar, B., and Lepiniec, L. (2004). TT2, TT8, and TTG1 synergistically specify the expression of BANYULS and proanthocyanidin biosynthesis in Arabidopsis thaliana. Plant J. 39, 366–380. doi: 10.1111/j.1365-313X.2004.02138.x
Bentley, D. R. (2006). Whole-genome re-sequencing. Curr. Opin. Genet. Dev. 16, 545–552. doi: 10.1016/j.gde.2006.10.009
Borevitz, J. O., Xia, Y., Blount, J., Dixon, R. A., and Lamb, C. (2000). Activation tagging identifies a conserved MYB regulator of phenylpropanoid biosynthesis. Plant Cell 12, 2383–2393. doi: 10.1105/tpc.12.12.2383
Butelli, E., Licciardello, C., Zhang, Y., Liu, J., Mackay, S., Bailey, P., et al. (2012). Retrotransposons control fruit-specific, cold-dependent accumulation of anthocyanins in blood oranges. Plant Cell 24, 1242–1255. doi: 10.1105/tpc.111.095232
Cheng, F., Liu, S., Wu, J., Fang, L., Sun, S., Liu, B., et al. (2011). BRAD, the genetics and genomics database for Brassica plants. BMC Plant Biol. 11:136. doi: 10.1186/1471-2229-11-136
Cheng, F., Mandáková, T., Wu, J., Xie, Q., Lysak, M. A., and Wang, X. (2013). Deciphering the diploid ancestral genome of the mesohexaploid Brassica rapa. Plant Cell 25, 1541–1554. doi: 10.1105/tpc.113.110486
Cheng, F., Wu, J., and Wang, X. (2014). Genome triplication drove the diversification of Brassica plants. Hortic. Res. 1, 1–8. doi: 10.1038/hortres.2014.24
Chiu, L. W., Zhou, X., Burke, S., Wu, X., Prior, R. L., and Li, L. (2010). The purple cauliflower arises from activation of a MYB transcription factor. Plant Physiol. 154, 1470–1480. doi: 10.1104/pp.110.164160
Eddy, S. R. (2009). A new generation of homology search tools based on probabilistic inference. Genome Inform. 23, 205–211. doi: 10.1142/9781848165632_0019
Espley, R. V., Brendolise, C., Chagné, D., Kutty-Amma, S., Green, S., Volz, R., et al. (2009). Multiple repeats of a promoter segment causes transcription factor autoregulation in red apples. Plant Cell 21, 168–183. doi: 10.1105/tpc.108.059329
Feller, A., Machemer, K., Braun, E. L., and Grotewold, E. (2011). Evolutionary and comparative analysis of MYB and bHLH plant transcription factors. Plant J. 66, 94–116. doi: 10.1111/j.1365-313X.2010.04459.x
Goff, L., Trapnell, C., and Kelley, D. (2013). Cummerbund: Analysis, Exploration, Manipulation, and Visualization of Cufflinks High-Throughput Sequencing Data. Cambridge, MA: R package version 2.12.10.
Gonzalez, A., Zhao, M., Leavitt, J. M., and Lloyd, A. M. (2008). Regulation of the anthocyanin biosynthetic pathway by the TTG1/bHLH/Myb transcriptional complex in Arabidopsis seedlings. Plant J. 53, 814–827. doi: 10.1111/j.1365-313X.2007.03373.x
Grabherr, M. G., Haas, B. J., Yassour, M., Levin, J. Z., Thompson, D. A., Amit, I., et al. (2011). Full-length transcriptome assembly from RNA-Seq data without a reference genome. Nat. Biotechnol. 29, 644–652. doi: 10.1038/nbt.1883
Guo, N., Cheng, F., Wu, J., Liu, B., Zheng, S., Liang, J., et al. (2014). Anthocyanin biosynthetic genes in Brassica rapa. BMC Genomics 15:426. doi: 10.1186/1471-2164-15-426
Katoh, K., Misawa, K., Kuma, K., and Miyata, T. (2002). MAFFT: a novel method for rapid multiple sequence alignment based on fast Fourier transform. Nucleic Acids Res. 30, 3059–3066. doi: 10.1093/nar/gkf436
Koes, R., Verweij, W., and Quattrocchio, F. (2005). Flavonoids: a colorful model for the regulation and evolution of biochemical pathways. Trends Plant Sci. 10, 236–242. doi: 10.1016/j.tplants.2005.03.002
Krzywinski, M., Schein, J., Birol, I., Connors, J., Gascoyne, R., Horsman, D., et al. (2009). Circos: an information aesthetic for comparative genomics. Genome Res. 19, 1639–1645. doi: 10.1101/gr.092759.109
Lamesch, P., Berardini, T. Z., Li, D., Swarbreck, D., Wilks, C., Sasidharan, R., et al. (2012). The Arabidopsis Information Resource (TAIR): improved gene annotation and new tools. Nucleic Acids Res. 40, 1202–1210. doi: 10.1093/nar/gkr1090
Lang, D., Weiche, B., Timmerhaus, G., Richardt, S., Riaño-Pachón, D. M., Correa, L. G., et al. (2010). Genome-wide phylogenetic comparative analysis of plant transcriptional regulation: a timeline of loss, gain, expansion, and correlation with complexity. Genome Biol. Evol. 2, 488–503. doi: 10.1093/gbe/evq032
Leyva, A., Jarillo, J. A., Salinas, J., Miguel, J., and Martinez-Zapater, J. M. (1995). Low temperature induces the accumulation of phenylalanine ammonia-lyase and chalcone synthase mRNAs of Arabidopsis thaliana in a light-dependent manner. Plant Physiol. 108, 39–46.
Li, B., and Dewey, C. N. (2011). RSEM: accurate transcript quantification from RNA-Seq data with or without a reference genome. BMC Bioinformatics 12:323. doi: 10.1186/1471-2105-12-323
Li, H., Handsaker, B., Wysoker, A., Fennell, T., Ruan, J., Homer, N., et al. (2009). The Sequence Alignment/Map format and SAMtools. Bioinformatics 25, 2078–2079. doi: 10.1093/bioinformatics/btp352
Li, W., and Godzik, A. (2006). Cd-hit: a fast program for clustering and comparing large sets of protein or nucleotide sequences. Bioinformatics 22, 1658–1659. doi: 10.1093/bioinformatics/btl158
Livak, K. J., and Schmittgen, T. D. (2001). Analysis of relative gene expression data using real-time quantitative PCR and the 22−ΔΔCT Method. Methods 25, 402–408. doi: 10.1006/meth.2001.1262
Mano, H., Ogasawara, F., Sato, K., Higo, H., and Minobe, Y. (2007). Isolation of a regulatory gene of anthocyanin biosynthesis in tuberous roots of purple-fleshed sweet potato. Plant Physiol. 143, 1252–1268. doi: 10.1104/pp.106.094425
Marchler-Bauer, A., Derbyshire, M. K., Gonzales, N. R., Lu, S., Chitsaz, F., Geer, L. Y., et al. (2015). CDD: NCBI's conserved domain database. Nucleic Acids Res. 43, 222–226. doi: 10.1093/nar/gku1221
Mathews, H., Clendennen, S. K., Caldwell, C. G., Liu, X. L., Connors, K., Matheis, N., et al. (2003). Activation tagging in tomato identifies a transcriptional regulator of anthocyanin biosynthesis, modification, and transport. Plant Cell 15, 1689–1703. doi: 10.1105/tpc.012963
Morita, Y., Saitoh, M., Hoshino, A., Nitasaka, E., and Iida, S. (2006). Isolation of cDNAs for R2R3-MYB, bHLH and WDR transcriptional regulators and identification of c and ca mutations conferring white flowers in the Japanese morning glory. Plant Cell Physiol. 47, 457–470. doi: 10.1093/pcp/pcj012
Mortazavi, A., Williams, B. A., McCue, K., Schaeffer, L., and Wold, B. (2008). Mapping and quantifying mammalian transcriptomes by RNA-Seq. Nat. Methods 5, 621–628. doi: 10.1038/nmeth.1226
Nagaharu, U. (1935). Genome analysis in Brassica with special reference to the experimental formation of B. napus and peculiar mode of fertilization. Jap. J. Bot. 7, 389–452.
Patel, R. K., and Jain, M. (2012). NGS QC Toolkit: a toolkit for quality control of next generation sequencing data. PLoS ONE 7:e30619. doi: 10.1371/journal.pone.0030619.g001
Quarrie, S. A., Lazić-Jačić, V., Kovačević, D., Steed, A., and Pekić, S. (1999). Bulk segregant analysis with molecular markers and its use for improving drought resistance in maize. J. Exp. Bot. 50, 1299–1306. doi: 10.1093/jxb/50.337.1299
Rice, P., Longden, I., and Bleasby, A. (2000). EMBOSS: the european molecular biology open software suite. Trends Genet. 16, 276–277. doi: 10.1016/S0168-9525(00)02024-2
Robinson, M. D., McCarthy, D. J., and Smyth, G. K. (2010). Edger: a bioconductor package for differential expression analysis of digital gene expression data. Bioinformatics 26, 139–140. doi: 10.1093/bioinformatics/btp616
Rowan, D. D., Cao, M., Lin-Wang, K., Cooney, J. M., Jensen, D. J., Austin, P. T., et al. (2009). Environmental regulation of leaf colour in red 35S:PAP1 Arabidopsis thaliana. New Phytol. 182, 102–115. doi: 10.1111/j.1469-8137.2008.02737.x
Rubiales, D., Fondevilla, S., Chen, W., Gentzbittel, L., Higgins, T. J. V., Castillejo, M. A., et al. (2014). Achievements and challenges in legume breeding for pest and disease resistance. Crit. Rev. Plant Sci. 34, 195–236. doi: 10.1080/07352689.2014.898445
Schlötterer, C. (2004). The evolution of molecular markers - just a matter of fashion? Nat. Rev. Genet. 5, 64–69. doi: 10.1038/nrg1249
Sharmal, D. R., Kaur, R., and Kumar, K. (1996). Embryo rescue in plants – a review. Euphytica 89, 325–337. doi: 10.1007/BF00022289
Soitamo, A. J., Piippo, M., Allahverdiyeva, Y., Battchikova, N., and Aro, E. M. (2008). Light has a specific role in modulating Arabidopsis gene expression at low temperature. BMC Plant Biol. 8:13. doi: 10.1186/1471-2229-8-13
Steyn, W. J., Wand, S. J. E., Holcroft, D. M., and Jacobs, G. (2002). Anthocyanins in vegetative tissues: a proposed unified function in photoprotection. New Phytol. 155, 349–361. doi: 10.1046/j.1469-8137.2002.00482.x
Sun, R., Zhang, S., Zhang, S., and Li, F. (2006). Research on creation of purple Chinese cabbage germplasm. Acta Horticul. Sin. 33, 1032–1032.
Tamura, K., Peterson, D., Peterson, N., Stecher, G., Nei, M., and Kumar, S. (2011). MEGA5: molecular evolutionary genetics analysis using maximum likelihood, evolutionary distance, and maximum parsimony methods. Mol. Biol. Evol. 28, 2731–2739. doi: 10.1093/molbev/msr121
Thimm, O., Bläsing, O., Gibon, Y., Nagel, A., Meyer, S., Krüger, P., et al. (2004). MAPMAN: a user-driven tool to display genomics data sets onto diagrams of metabolic pathways and other biological processes. Plant J. 37, 914–939. doi: 10.1111/j.1365-313X.2004.02016.x
Thomasset, S., Teller, N., Cai, H., Marko, D., Berry, D. P., Steward, W. P., et al. (2009). Do anthocyanins and anthocyanidins, cancer chemopreventive pigments in the diet, merit development as potential drugs? Cancer Chemother. Pharmacol. 64, 201–211. doi: 10.1007/s00280-009-0976-y
Tohge, T., Nishiyama, Y., Hirai, M. Y., Yano, M., Nakajima, J., Awazuhara, M., et al. (2005). Functional genomics by integrated analysis of metabolome and transcriptome of Arabidopsis plants over-expressing an MYB transcription factor. Plant J. 42, 218–235. doi: 10.1111/j.1365-313X.2005.02371.x
Tong, C., Wang, X., Yu, J., Wu, J., Li, W., Huang, J., et al. (2013). Comprehensive analysis of RNA-seq data reveals the complexity of the transcriptome in Brassica rapa. BMC Genomics 14:689. doi: 10.1186/1471-2164-14-689
Trapnell, C., Pachter, L., and Salzberg, S. L. (2009). TopHat: discovering splice junctions with RNA-Seq. Bioinformatics 25, 1105–1111. doi: 10.1093/bioinformatics/btp120
Trapnell, C., Roberts, A., Goff, L., Pertea, G., Kim, D., Kelley, D. R., et al. (2012). Differential gene and transcript expression analysis of RNA-seq experiments with TopHat and Cufflinks. Nat. Protoc. 7, 562–578. doi: 10.1038/nprot.2012.016
Trapnell, C., Williams, B. A., Pertea, G., Mortazavi, A., Kwan, G., van Baren, M. J., et al. (2010). Transcript assembly and quantification by RNA-Seq reveals unannotated transcripts and isoform switching during cell differentiation. Nat. Biotechnol. 28, 511–515. doi: 10.1038/nbt.1621
Twyford, A. D., and Ennos, R. A. (2012). Next-generation hybridization and introgression. Heredity 108, 179–189. doi: 10.1038/hdy.2011.68
Wang, Z., Meng, D., Wang, A., Li, T., Jiang, S., Cong, P., et al. (2013). The methylation of the PcMYB10 promoter is associated with green-skinned sport in Max Red Bartlett pear. Plant Physiol. 162, 885–896. doi: 10.1104/pp.113.214700
Winkel-Shirley, B. (2001). It takes a garden.how work on diverse plant species has contributed to an understanding of flavonoid metabolism. Plant Physiol. 127, 1399–1405. doi: 10.1104/pp.127.4.1399
Zhang, F., Gonzalez, A., Zhao, M., Payne, C. T., and Lloyd, A. (2003). A network of redundant bHLH proteins functions in all TTG1-dependent pathways of Arabidopsis. Development 130, 4859–4869. doi: 10.1242/dev.00681
Zhang, H., Shao, Y., Bao, J., and Beta, T. (2015). Phenolic compounds and antioxidant properties of breeding lines between the white and black rice. Food Chem. 172, 630–639. doi: 10.1016/j.foodchem.2014.09.118
Zhang, S., Ma, Y., Xu, X., Qian, W., Zhang, S., Li, F., et al. (2014). Components and amounts of anthocyanins in several Brassica vegetables. Acta Horticul. Sinica 41, 1451–1460.
Keywords: transcriptome analysis, RNA-seq, introgression lines, Brassica, anthocyanin
Citation: Xie L, Li F, Zhang S, Zhang H, Qian W, Li P, Zhang S and Sun R (2016) Mining for Candidate Genes in an Introgression Line by Using RNA Sequencing: The Anthocyanin Overaccumulation Phenotype in Brassica. Front. Plant Sci. 7:1245. doi: 10.3389/fpls.2016.01245
Received: 11 April 2016; Accepted: 05 August 2016;
Published: 22 August 2016.
Edited by:
Soren K. Rasmussen, University of Copenhagen, DenmarkReviewed by:
Zhongyun Piao, Shenyang Agricultural University, ChinaNandini Prasad Shetty, Central Food Technological Research Institute, India
Copyright © 2016 Xie, Li, Zhang, Zhang, Qian, Li, Zhang and Sun. This is an open-access article distributed under the terms of the Creative Commons Attribution License (CC BY). The use, distribution or reproduction in other forums is permitted, provided the original author(s) or licensor are credited and that the original publication in this journal is cited, in accordance with accepted academic practice. No use, distribution or reproduction is permitted which does not comply with these terms.
*Correspondence: Shujiang Zhang, emhhbmdzaHVqaWFuZ0BjYWFzLmNu
Rifei Sun, c3VucmlmZWlAY2Fhcy5jbg==