 Junji Su1,2Shuli Fan1Libei Li1Hengling Wei1Caixiang Wang1Hantao Wang1Meizhen Song1Chi Zhang1Lijiao Gu1Shuqi Zhao1Guangzhi Mao1Chengshe Wang2Chaoyou Pang1*
 Shuxun Yu1,2*
- 1State Key Laboratory of Cotton Biology, Institute of Cotton Research of CAAS, Anyang, China
- 2Department of Plant Sciences, College of Agronomy, Northwest A&F University, Yangling, China
Improving cotton yield is a major breeding goal for Chinese upland cotton. Lint percentage is an important yield component and a critical economic index for cotton cultivars, and raising the lint percentage has a close relationship to improving cotton lint yield. To investigate the genetic architecture of lint percentage, a diversity panel consisting of 355 upland cotton accessions was grown, and the lint percentage was measured in four different environments. Genotyping was performed with specific-locus amplified fragment sequencing (SLAF-seq). Twelve single-nucleotide polymorphisms (SNPs) associated with lint percentage were detected via a genome-wide association study (GWAS), in which five SNP loci distributed on chromosomes At3 (A02) and At4 (A08) and contained two major-effect QTLs, which were detected in the best linear unbiased predictions (BLUPs) and in more than three environments simultaneously. Furthermore, favorable haplotypes (FHs) of two major-effect QTLs and 47 putative candidate genes in the two linkage disequilibrium (LD) blocks of these associated loci were identified. The expression levels of these putative candidate genes were estimated using RNA-seq data from ten upland cotton tissues. We found that Gh_A02G1268 was very highly expressed during the early fiber development stage, whereas the gene was poorly expressed in the seed. These results implied that Gh_A02G1268 may determine the lint percentage by regulating seed and fiber development. The favorable QTL alleles and candidate genes for lint percentage identified in this study will have high potential for improving lint yield in future Chinese cotton breeding programs.
Introduction
Upland cotton (Gossypium hirsutum L.; AADD, 2n = 4x = 52) is the most important natural textile fiber source worldwide, accounting for approximately 95% of the world's cotton production (Chen et al., 2007). Although fiber quality traits, which are of upmost importance to cotton breeding programs, have dominated these studies in cotton (Rong et al., 2007; Said et al., 2013), improving cotton yield is still a primary goal in Chinese cotton breeding. Lint percentage is an important yield component and a critical economic index for cotton cultivars, and many studies have showed that raising the lint percentage is closely related to cotton lint yield improvement (Culp and Harrell, 1975; Li et al., 2009; Zeng and Meredith, 2009). However, the genetic and molecular mechanisms underlying variations in lint percentage in upland cotton remain poorly understood.
Quantitative trait locus (QTL) mapping has been widely used to dissect the genetic changes for cotton complex traits, such as fiber quality and yield component traits (Rong et al., 2007; Said et al., 2013, 2015). Over the past two decades, a number of QTLs for lint percentage have been identified through biparental linkage mapping in upland cotton (Zhang et al., 2005; Abdurakhmonov et al., 2007; Shen et al., 2007; Wan et al., 2007; Liu et al., 2012, 2015; Yu et al., 2013a,b; Wang et al., 2014). Association mapping as an alternative for detecting QTLs has been used widely in QTL mapping for important economic traits in cotton, such as fiber quality traits (Abdurakhmonov et al., 2008; Zhang et al., 2013; Nie et al., 2016), yield and its components (Mei et al., 2013; Qin et al., 2015), and resistance traits (Zhao et al., 2014). However, reports of association analysis for lint percentage in upland cotton are still rare. Only a small number of simple sequence repeat (SSR) and amplified fragment length polymorphism (AFLP) markers associated with lint percentage have been identified through association mapping (Mei et al., 2013; Badigannavar and Myers, 2015; Qin et al., 2015). In recent years, genome-wide association studies (GWASs) have become a higher-resolution and more cost-effective tool for detecting important QTLs or genes associated with complex traits compared with linkage mapping. Although, GWASs have been widely performed for a large number of single-nucleotide polymorphisms (SNPs) in Arabidopsis (Zhao et al., 2007; Atwell et al., 2010), maize (Kump et al., 2011) and rice (Huang et al., 2010; Zhao et al., 2011), they have seldom been used for large quantities of SNPs in cotton.
Upland cotton is an allopolyploid species with a complex genome structure due to high homology between its A- and D-subgenomes. Although this situation imposes a huge challenge for the high-throughput discovery of high-quality SNPs for GWAS, next-generation sequencing technologies, such as genotyping-by-sequencing (GBS), restriction site-associated DNA sequencing (RAD-seq) and specific-locus amplified fragment sequencing (SLAF-seq), have provided opportunities to identify required marker coverage in upland cotton (Gore et al., 2014; Chen et al., 2015; Wang H. et al., 2015; Wang Y. et al., 2015; Zhang et al., 2016). To better understand the genetic variations of lint percentage at a natural population level, a diversity panel consisting of 355 upland cotton accessions was genotyped by SLAF-sequencing. The lint percentage was measured in four different environments. A GWAS was performed to identify SNP loci or QTL regions associated with the lint percentage trait in upland cotton. The candidate genes that control lint percentage were further predicted by RNA-seq analysis in major-effect QTL regions. These results will lay the foundation for lint percentage improvement through marker-assisted breeding.
Materials and Methods
Plant Materials
A diversity panel consisting of 355 representative upland cotton accessions (Supplementary Table S1) obtained from cotton germplasm collections in our laboratory and from the low-temperature germplasm genebank of the Cotton Research Institute, Chinese Academy of Agricultural Sciences (CRI-CAAS), was examined. The population consisted of 331 cultivars or accessions developed in China and 24 introduced from abroad. These accessions were divided into the following five groups according to their ecological areas: (1) YR group (162 accessions from the Yellow River region in China), (2) YZR group (51 accessions from the Yangtze River region in China), (3) NW group (98 accessions from the northwest inland region in China), (4) LN group (20 accessions from the Liaoning province in China) and (5) foreign group (20 accessions from the United States of America and 4 accessions from central Asia countries).
Field Experiments and Phenotyping
All of the 355 upland cotton accessions were planted at Anyang, Henan, China (36⋅ 08′ N, 114⋅ 48′ E) in 2014 and 2015 (designated AY-14 and AY-15, respectively) and at Shihezi (SHZ), Xinjiang, China (44⋅ 31′ N, 86⋅ 01′ E) in 2014 and 2015 (designated SHZ-14 and SHZ-15, respectively). The field experiments followed a randomized complete block design with three replications. At Anyang, Henan, each accession was grown in a single-row plot (5.00 m long and 0.80 m row wide) with 18–23 plants, while at Shihezi (SHZ), Xinjiang, each accession was grown in a plot with 30–40 plants in two rows, with 0.10 m between the plants in each row and 0.45 m between the rows. The trial management followed standard breeding field practices. The fully opened random 20 cotton middle bolls for each accession were manually harvested annually in September. The lint percentage (LP, %) of each harvested sample was evaluated. The correlation coefficients for the lint percentage between environments were calculated and the analysis of variance (ANOVA) was conducted using R software. The broad-sense heritability of lint percentage was calculated using the R software package “lem4.”
SNP Genotyping
Genomic DNA from all of the accessions was extracted from young leaf tissue using a modified cetyl trimethyl ammonium bromide (CTAB) method (Paterson et al., 1993). SNP genotyping of the association panel was performed using a SLAF-seq approach (Sun et al., 2013). Two restriction enzymes (Rsa I and Hae III, New England Biolabs, NEB, USA) were used for library preparation. Paired-end sequencing (125 bp at each end) was performed on an Illumina HiSeq 2500 system (Illumina, Inc., San Diego, CA, USA) according to the manufacturer's recommendations. The GATK and Samtools packages were used for SNP calling. BWA software was used to map the raw paired-end reads onto the reference genome (Gossypium hirsutum v 1.0) (Li et al., 2015). SNPs with a missing rate < 10% and a minor allele frequency (MAF) ≤ 0.05 were excluded. A total of 81,675 SNP markers were identified and used for the subsequent analysis.
Genome-Wide Association Study
The best linear unbiased predictions (BLUPs) for lint percentage across the four environments were estimated using R software. The BLUP values for the four environments and the phenotypic values for each environment's lint percentage were used for GWAS. A mixed linear model (MLM) was used to calculate the associations in all of the analyses by incorporating both principal components (PCs) and kinship data (Lipka et al., 2012). The suggestive and significant P thresholds were 6.12E–06 (P = 0.5/n, where n = the number of markers used; −log10 (0.5/81,675) = 5.21) and 6.12E–07 (P = 0.05/n, where n = the number of markers used; −log10 (0.05/81,675) = 6.21), respectively, for the entire population (Holm, 1979; Mao et al., 2015). Manhattan plots were performed using the R software package “CMplot.”
Haplotype Analysis
The phenotypic value of each haplotype was estimated by averaging the phenotypic values over the accessions with each type of SNP locus associated with a specific target trait. The favorable haplotypes (FHs) were subsequently identified according to the breeding objectives of target trait. Box plots for the relative phenotypic values were performed using R software.
Candidate Gene Annotation and Prediction
Linkage disequilibrium (LD) blocks containing SNP loci associated with target traits were generated using the R software package “LDheatmap” (Shin et al., 2013). LD blocks harboring significantly associated SNPs were then defined as the candidate genome regions. The genes distributed in these regions were collected. The gene annotation closest to the Arabidopsis homolog was obtained from the Arabidopsis information resource (http://www.arabidopsis.org/). Transcriptome sequencing data (SRA: PRJNA248163) from 10 upland cotton (TM-1) tissues (including root, stem, leaf, torus, seed, cotyledon, fiber-5 DPA (days post-anthesis), fiber-10 DPA, fiber-20 DPA and fiber-25 DPA) were available on the EBI website (http://www.ebi.ac.uk/). Expression analysis of the high-throughput mRNA sequencing was performed using TopHat and Cufflinks software (Trapnell et al., 2012). Heat maps of the putative candidate gene expression patterns were created using the R package “pheatmap.”
Results
Phenotypic Variation of Lint Percentage
Significant variation was observed for lint percentage among the 355 upland cotton accessions, ranging from 26.58 to 48.13%, with an average of 41.03%. In the AY-14, AY-15, SHZ-14, and SHZ-15 environments, the natural population exhibited average lint percentage values (±SD) of 41.05 ± 2.87, 39.70 ± 3.18, 41.78 ± 2.78, and 41.58 ± 2.64%, respectively (Figure 1). The ANOVA showed that the genotype (G), environment (E) and genotype × environment (G × E) interactions have significant effects on the lint percentage (P < 0.001, Supplementary Table S2). The phenotypic trait also showed significant differences (P < 0.01) among the four environments (Supplementary Table S2), suggesting that the lint percentage was significantly influenced by the environment. However, significant positive correlations (P < 0.001) between the genotypes across the four environments were observed, with correlation coefficients ranging from 0.7462 to 0.8620 (Supplementary Table S3). Additionally, the broad-sense heritability of lint percentage was as high as 69.72% (Supplementary Table S2). The results indicated that the stability of the lint percentage was high, even though significant G × E was observed.
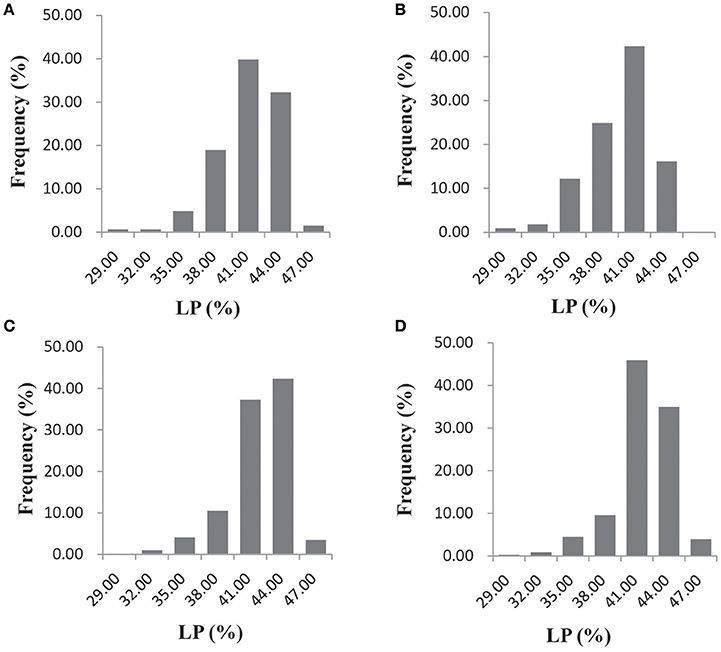
Figure 1. Frequency distribution of the lint percentage (LP, %) in the four environments (AY-14, AY-15, SHZ-14, and SHZ-15) among the 355 upland cotton accessions. (A) AY-14, (B) AY-15, (C) SHZ-14, and (D) SHZ-15.
Genome-Wide Association Studies (GWASs)
In our previous studies, 355 upland cotton accessions were grouped into two major subpopulations by principal component analysis (PCA) and clustering analysis, and LD was estimated as r2 (the squared Pearson correlation coefficient) between all pairs of SNP markers; the approximated LD decay distance was 100 kb (Su et al., 2016). In this study, GWASs were conducted for lint percentage using the BLUPs across four environments and an individual environment in an MLM. The threshold of −log10 (P) > 5.21 was also derived from the quantile-quantile (QQ) plots because most of the upward deviation from the linear line occurred around −log10 (P) = 5.21, which presumably indicates true positives (Figure 2B). Twelve SNPs were significantly associated with lint percentage; these SNP loci were positioned on chromosomes At3 (3), At4 (4), At10 (1), At11 (2), and Dt3 (2) (Figure 2A). Most importantly, five of the twelve SNPs significantly associated with the trait were detected with the lowest P-value (−log10(P) > 6.21); these five loci were positioned on chromosomes At3 and At4 of upland cotton and explained 9.42–12.88% of the total phenotypic variance (Figure 2A, Table 1). Interestingly, two SNP loci (rsAt4:15572813 and rsAt4:15573052) on chromosome At4 showed significant marker-trait associations with the highest −log10(P) values, which were detected in BLUP and each of the four environments simultaneously (Figure 2A, Supplementary Figure S1, and Table 1). Additionally, three SNP loci (rsAt3:43538238, rsAt3:43631774, and rsAt3:43631819) on chromosome At3 were associated with the target trait in BLUP and three of the four environments at the same time (Figure 2A, Supplementary Figure S1, and Table 1). These results indicated that there were two major-effect QTLs for lint percentage on chromosomes At3 and At4.
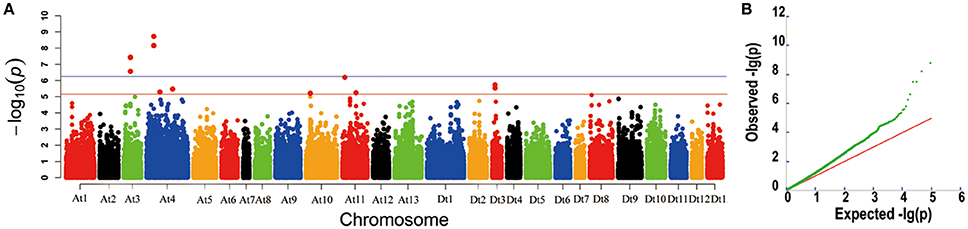
Figure 2. Genome-wide association study for lint percentage. (A) Manhattan plots of the mixed linear model (MLM) for the best linear unbiased prediction (BLUP) across the four environments of lint percentage. Each dot represents a SNP. The horizontal full red and blue lines indicate the Bonferroni-corrected significance thresholds at −log10(P) = 5.21 and −log10(P) = 6.21, respectively. (B) A quantile-quantile (QQ) plot of MLM for lint percentage.
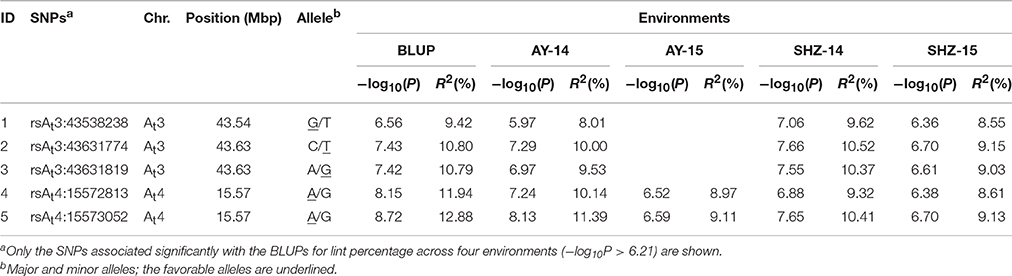
Table 1. SNPs significantly associated with lint percentage by the MLM.
Identification of Favorable Haplotypes (FHs) of Two Major-Effect QTLs for Lint Percentage
To identify favorable QTL alleles for lint percentage, the five significantly associated SNP loci (−log10(P) > 6.21) in two major-effect QTLs were selected, which exhibited the minimum P-value and could explain the maximum phenotypic variation. Three SNP loci from chromosome At3 (rsAt3:43538238, rsAt3:43631774, and rsAt3:43631819) were associated with lint percentage via GWAS; these SNP alleles were G/T, C/T, and A/G, respectively. Three types of haplotypes (GG-TT-GG, TT-CC-AA, and GT-CT-AG) were found because of a close linkage relationship among the three SNP loci. The GG-TT-GG haplotype included 308 lines and was considered the favorable haplotype (FH) because the average lint percentage (41.32%) of the haplotype was significantly higher than the mean value (35.81%) of the other corresponding haplotype (TT-CC-AA, the unfavorable haplotype, UFH) and included 26 lines. The remaining 21 lines were heterozygous haplotypes (HH, GT-CT-AG), with a mean lint percentage of 38.77% (Figure 3A). Furthermore, the FH accounted for a very large proportion of the accessions with higher lint percentage than that with lower lint percentage. For example, there was no FH in the accessions with a low lint percentage (< 30.50%), and there was no UFH in the lines with a high lint percentage (>45.50%), (Figure 3D). The other two SNP loci (rsAt4:15572813 and rsAt4:15573052) associated with the lint percentage were closely linked and were located on chromosome At4, separated by 238 bp. Similarly, the lint percentage of accessions with the FH (AA-AA, 41.36%), was higher on average than that of accessions with the UFH (GG-GG, 34.79%; Figure 3B). The FH accounted for a large proportion of the accessions with a higher lint percentage, and the UFH was not found among the upland cotton lines with lint percentage values >39.50% (Figure 3E). These results further confirmed that there were two major QTLs controlling lint percentage in the adjacent regions of the five associated SNP loci.
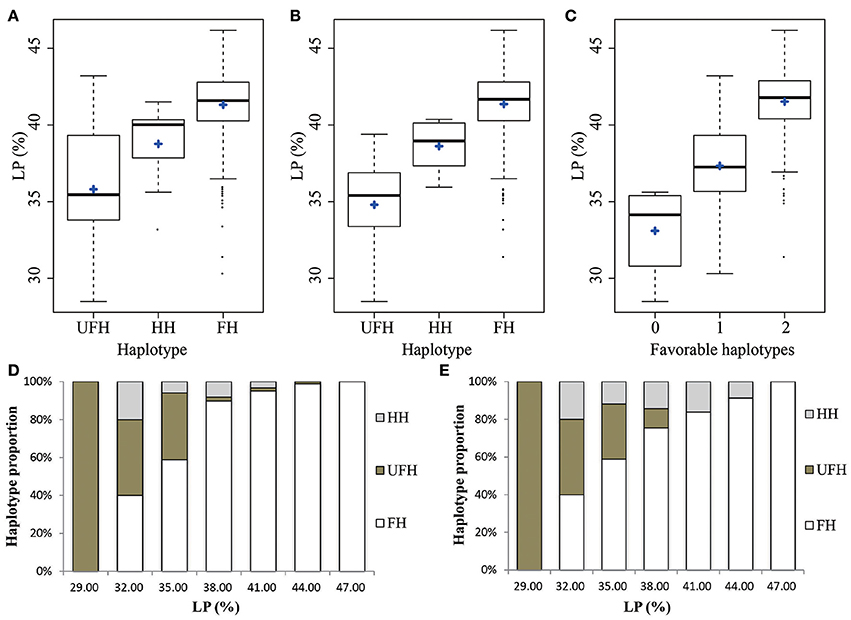
Figure 3. Phenotypic distribution of the haplotypes of two major-effect QTLs for lint percentage. (A,B) Box plots for the phenotypic values of the major-effect QTLs on chromosomes At3 and At4, respectively. (C) Box plot for lint percentage plotted as the favorable haplotype number. (D,E) Charts of several types of haplotypes accounting for proportion. FHs, favorable haplotypes; UFHs, unfavorable haplotypes; HHs, heterozygous haplotypes; LP, lint percentage. The middle line is the median, the blue plus sign indicates the mean, the box represents the range from the 25th to 75th percentiles of the total data, the whiskers represent the inter-quartile range, and the outer dots are outliers.
To further understand the cumulative effect of FHs on lint percentage, the 355 upland cotton lines were grouped into three groups according to the number of FHs. The cotton lint percentage among the three groups obviously increased with an increasing number of FHs (Figure 3C). For example, accessions with two FHs showed a 41.53% mean lint percentage, which was higher than accessions with one FH (37.33%) and those without a FH (33.09%). These results suggested that the genetic control of lint percentage exhibits a largely additive effect in upland cotton.
Prediction of Candidate Genes
Two upland cotton (TM-1) reference genome sequences are currently available in a public database (http://www.cottongen.org). To identify the corresponding chromosomal locations of the SNP loci associated with the target trait between two upland cotton reference genomes, 250 bp of the sequence on either side of each associated SNP were extracted from one upland cotton reference genome (Li et al., 2015), and 501 bp of the sequences was aligned with the other upland cotton reference genome (Zhang et al., 2015). There was a clear correspondence between the chromosomal positions of the SNP loci associated with lint percentage between these two upland cotton reference genomes. For example, positions 15572813 and 15573052 on chromosome At4 corresponded to 52098956 and 52098717 on chromosome A08, respectively, while positions 43538238, 43631774 and 43631819 on chromosome At3 corresponded to 74801531, 74713290 and 74713245 on chromosome A02, respectively (Table 2).
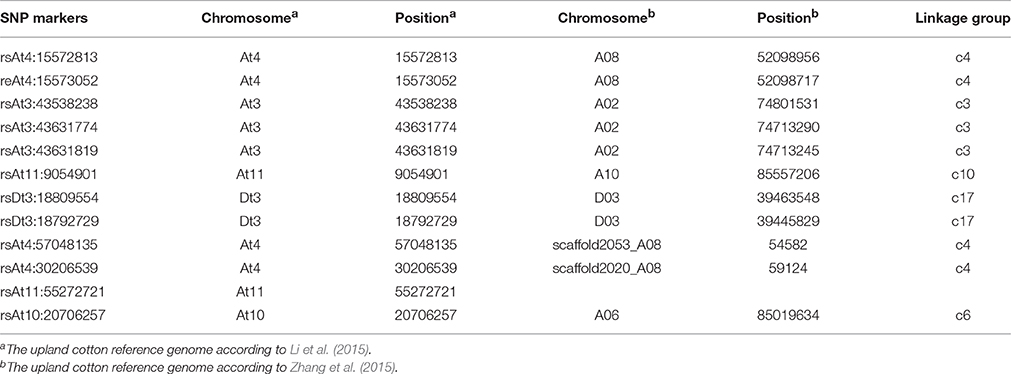
Table 2. Corresponding chromosomal positions for the SNP loci associated with lint percentage between two upland cotton reference genomes.
To look for putative candidate genes in the neighboring regions of the SNP loci associated with lint percentage, we further determined LD blocks harboring five significant SNPs (−log10(P) > 6.21). Two LD blocks were found on chromosomes A02 (73.25–74.75 Mb) and A08 (51.95–52.12 Mb) (Figures 4A,B). Based on the results of the genes annotated in the CottonGen database (http://www.cottongen.org), a total of 45 and 2 putative candidate genes were contained in two LD blocks on chromosomes A02 and A08, respectively. Furthermore, the expression levels of 47 putative candidate genes were analyzed using RNA-seq data from ten upland cotton (TM-1) tissues (Zhang et al., 2015). Six genes (Gh_A02G1229, Gh_A02G1262, Gh_A02G1259, Gh_A02G1263, Gh_A02G1268, and Gh_A02G1228) presented higher expression levels in the fiber-5 DPA and fiber-10 DPA than in the other eight tissues. Specifically, only one gene (Gh_A02G1268) was predominantly expressed in fiber-5 DPA, and its expression levels in fiber-5 DPA were 300-fold higher than in the seeds in TM-1 (Figure 4C), suggesting its potential role in increasing the lint percentage and improving fiber quality in upland cotton. Gh_A02G1268, a member of the myo-inositol-1-phosphate synthase (MIPS) gene family, was located 95.81 kb away from the peak SNP (A02:74713245). Its closest Arabidopsis homolog (At2g22240) is known to regulate embryogenesis and seed development (Mitsuhashi et al., 2008; Luo et al., 2011).
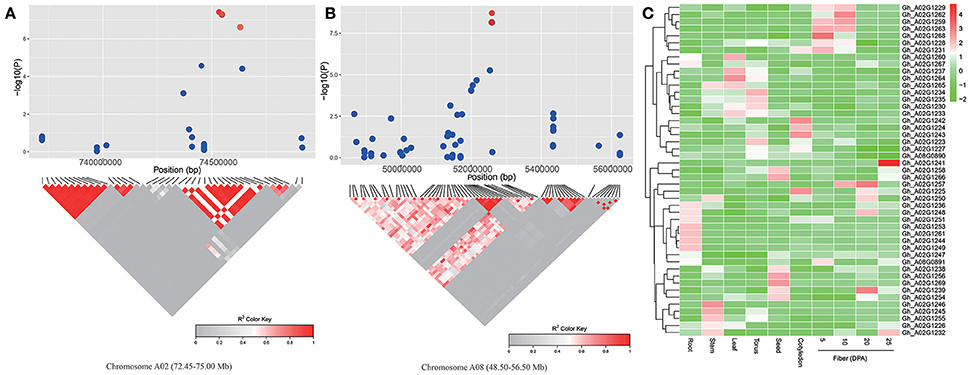
Figure 4. Prediction of the candidate genes for lint percentage. (A) The peak region (72.45–75.00 Mb) on chromosome A02. (B) The peak region (48.50–56.50 Mb) on chromosome A08. (A,B) The pair-wise LD between the SNP markers is indicated as D' values, where dark red indicates a value of 1 and gray indicates 0. The dotted squares in (A,B) indicate the LD blocks that contain significant SNPs (red dot). (C) Heat map of the putative candidate gene expression patterns in 10 upland cotton (TM-1) tissues. Red indicates high expression, and green indicates low expression.
Comparison of the GWAS with QTLs Identified in Previous Studies
To further confirm these SNP loci associated with the lint percentage, our new GWAS was compared with previous linkage and association studies. Regarding previous QTL mapping studies, 281 SSR markers (Supplementary Tables S4, S5) containing QTLs for lint percentage were selected from 23 reports of QTL mapping (Supplementary Table S6), and 183 primer sequences corresponding to these markers (Supplementary Table S4) were obtained from the CottonGen Database (http://www.cottongen.org). The physical locations of these SSR primer sequences were mapped to the reference genome sequence (Zhang et al., 2015) via electronic PCR (e-PCR), among which 6, 4, 7, 8, and 18 SSR primers were mapped to chromosomes A02, A06 A08, A10, and D03, respectively (Figure 5). Three SNP loci from chromosome A02 (At3) (rsAt3:43538238, rsAt3:43631774, and rsAt3:43631819) were mapped to an adjacent region of HAU2014; two SNP loci (rsAt4:15572813 and rsAt4:15573052) from chromosome A08 (At4) were positioned between MUSS167 and MUCS531; rsAt11:9054901 near CIR166 was located on chromosome A10 (At11); and two SNP loci (rsDt3:18792729 and rsDt3:18809554) from chromosome D03 (Dt3) were mapped in the vicinity of many QTL-SSR markers, such as BNL2443, NAU3479 and NAU5444.
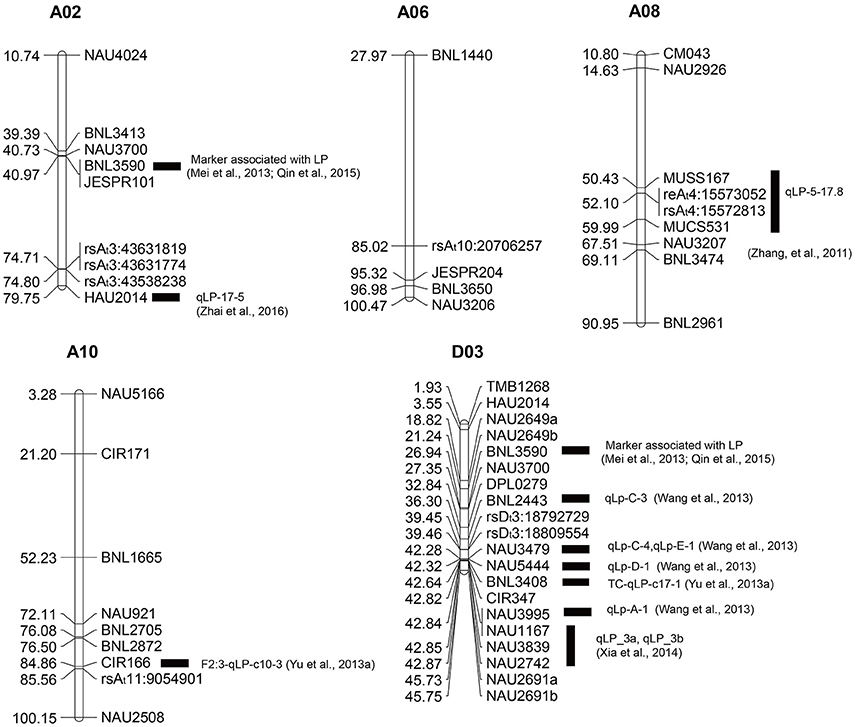
Figure 5. Physical map of molecular markers identified on five chromosomes (A02, A06 A08, A10, and D03) based on our GWAS and QTL and association mapping from previous studies. The unit of physical distance for the chromosomes is Mb; black rectangles represent SSR markers or QTLs from previous studies in the vicinity of the associated SNP loci identified through our GWAS.
Discussion
The power to resolve associated loci for a target trait via GWAS depends on the marker density, the experimental population size and statistical methods (Liu et al., 2016). Association analyses based on SSR markers have been widely reported in upland cotton (Abdurakhmonov et al., 2008; Mei et al., 2013; Qin et al., 2015; Nie et al., 2016). Sequencing technologies, such as GBS, RAD-seq, and SLAF-seq, are now available for the development of abundant SNPs in upland cotton (Gore et al., 2014; Chen et al., 2015; Wang H. et al., 2015; Wang Y. et al., 2015; Zhang et al., 2016). Therefore, development of SNP markers using GBS, RAD-seq and SLAF-seq can currently meet the needs of GWAS in cotton. The decay of LD over physical distances in a population determines the density of the marker coverage needed to perform a GWAS (Yu and Buckler, 2006). The faster LD decays, the more markers are likely needed for GWAS for complex traits. In previous studies, the average distance of LD decay was 3–7 cM, and 100–400 SSR markers were used for statistical analysis in upland cotton (Abdurakhmonov et al., 2008; Fang et al., 2013; Mei et al., 2013; Cai et al., 2014; Qin et al., 2015; Nie et al., 2016). In our study, a considerable number of markers (81,675 SNPs) were identified by SLAF-seq, and a mean LD decay distance of 100 kb was estimated in the population. Considering the LD status in the panel of upland cotton lines, the mean marker density (1 SNP per 24.85 kb) in this study was sufficient to perform a GWAS. Population size is another determinant affecting the power of GWAS. It has been shown that increasing the population size has a greater influence on the power of QTL detection than increasing the SNP marker density (Long and Langley, 1999). Indeed, increasing the number of population individuals would likely identify more smaller-effect QTLs (Zhu et al., 2008). Population sizes ranging from 100 to 500 have been used for association analysis in upland cotton in previous studies (Abdurakhmonov et al., 2008; Mei et al., 2013; Qin et al., 2015; Nie et al., 2016). In our study, although a population with 355 diverse accessions was not sufficiently large, the phenotypic variations in the lint percentage were very large, ranging from 26.58 to 48.13%. At present, MLM, which simultaneously estimates the population structure and unequal relatedness among individuals, is a widely used statistical model in plant association mapping and allows a large reduction in spurious associations (Yu et al., 2006). It has been recently suggested that PCA is a fast and effective way to infer population structure (Yu et al., 2006). Using PCA to estimate population structure was better than using the Q model for controlling false positives (Zhao et al., 2007; Xu et al., 2016). In this study, to further control for false positives, MLM was selected for association mapping by incorporating PCs and kinship data, and some SNP loci that significantly associated with lint percentage throughout the upland cotton genome could be identified at one time.
The phenotypes of complex traits often result from the combined actions of multiple genes and environmental factors, all of which can easily lead to lost heritability (Mackay et al., 2009). Therefore, only those traits with high heritability can be stably detected. The stably associated markers with target traits should be useful for cotton breeding with broad adaptability to different environments (Mei et al., 2013). In our study, we found that all five SNPs significantly associated with lint percentage were detected in BULP and three or more environments, which was consistent with the phenotypic statistical analysis that lint percentage demonstrated a particularly high broad-sense heritability (69.72%). Linkage mapping was the uppermost method for QTL identification. Previous linkage mapping identified at least 25 distinct QTLs for lint percentage distributed in 14 linkage groups in tetraploid cotton (Said et al., 2013). Seven hotspots (c3-mQTL-LP-Gh-1: 0-20 cM, c3-mQTL-LP-Gh-2: 25-45 cM, c7-mQTL-LP-Gh-3: 0-20 cM, c11-mQTL-LP-Gh-4: 0-20 cM, c13-mQTL-LP-Gh-5: 39-60 cM, c16-mQTL-LP-Gh-6: 0-23 cM and c24-mQTL-LP-Gh-7: 0-20 cM) for lint percentage QTLs were identified in intraspecific G. hirsutum populations (Said et al., 2015). Association mapping can serve as a complement for linkage mapping and may identify more loci or QTLs because linkage mapping detects only QTLs that exist as polymorphisms in the parents. Using association mapping, a number of SSR loci associated with lint percentage were detected. For example, 31 SSR markers distributed on 20 chromosomes were shown to be significantly associated with lint percentage (Mei et al., 2013; Qin et al., 2015). In this study, 12 associated loci were detected based on GWAS (Table 2), and these SNP loci were positioned on chromosomes At3 (A02), At4 (A08), At10 (A06), At11 (A10), and Dt3 (D03). We found that 10/12 (83.33%) SNP loci associated with lint percentage were distributed on the A subgenome. Interestingly, two SNP loci (rsAt4:15572813 and rsAt4:15573052) on chromosome At4 (A08) with the highest −log10(P) values were distributed within a QTL (qLP-5-17.8) identified in a previous study (Zhang et al., 2011), and two SNP loci (rsDt3:18792729 and rsDt3:18809554) from chromosome D03 (Dt3) were mapped in the vicinity of five QTLs (qLp-A-1 qLp-C-3 qLp-C-4 qLp-D-1 and qLp-E-1) located on chromosome A3 (Wang et al., 2013). These findings validate the GWAS results and increase confidence in the identity of some SNP loci. In addition, we found the SSR marker BNL3590 mapped to A02:40,971,023-40,971,204 bp and D03: 26,940,735- 26,940,924 bp in the reference genome sequence (Zhang et al., 2015) by e-PCR. Although, the SSR marker BNL3590 was significantly associated with the lint percentage in previous studies (Mei et al., 2013; Qin et al., 2015), it was not in the associated genome region (A02: 74801531-74713245) identified in our study. We also found that accumulating FHs might be an effective way to increase the lint percentage during the selection of high lint percentage lines. Genotypic classification revealed that the cotton lint percentage can be increased by pyramiding the FHs. This result strongly suggests that lint percentage is largely controlled by quantitative genes with mainly additive effects.
Cotton fiber development is a complex process that involves fiber initiation, elongation, secondary cell wall synthesis, and maturation (Kim and Triplett, 2001). Long lint fibers are initiated before or on the day of anthesis (Meinert and Delmer, 1977), and most of the genes showing significant differences are found during earlier stages of fiber development (Al-Ghazi et al., 2009). Previous research results suggested that different final fiber properties may be established at earlier stages of fiber development. Two determinant factors for cotton lint percentage are seed and fiber. Similarly, we hypothesized that high expression of genes controlling the lint percentage would be observed at earlier stages in fiber development. In our study, six genes (Gh_A02G1229, Gh_A02G1262, Gh_A02G1259, Gh_A02G1263, Gh_A02G1268, and Gh_A02G1228) in two LD blocks containing five significant SNPs showed higher expression levels at earlier stages during fiber development. The previous studies showed that plant MIPS genes were highly expressed in developing seeds, suggesting that myo-inositol plays an important role in seed/embryo development (Johnson and Wang, 1996; Hegeman et al., 2001). In this study, Gh_A02G1268 (MIPS) was very highly expressed in fiber-5 DPA, while the gene was poorly expressed in TM-1 seeds. These results implied that Gh_A02G1268 may determine lint percentage by regulating seed and fiber development and indicated that Gh_A02G1268 was a candidate gene for QTLs that control the lint percentage trait.
Conclusion
In this study, 12 SNP loci associated with lint percentage were identified via GWAS, in which five SNP loci that significantly associated with the trait were detected with the lowest P-value (−log10(P) > 6.21). These five loci were located on chromosomes At3 (A02) and At4 (A08) of upland cotton and explained 9.42–12.88% of the total phenotypic variance. The favorable haplotypes (FHs) for two major-effect QTLs for lint percentage were identified and 47 putative candidate genes were annotated in two LD blocks harboring five significant SNPs. By analyzing RNA-seq data, we found that Gh_A02G1268 was very highly expressed during an early fiber development stage and poorly expressed in the TM-1 seed. These results implied that Gh_A02G1268 may determine lint percentage by regulating seed and fiber development. The favorable QTL alleles and candidate genes for lint percentage identified in this study show high potential for the improvement of lint yield in future cotton breeding programs.
Author Contributions
SY, CP designed and supervised the research. JS, CP, LL, and HLW analyzed the data. JS, LL, SF, CZ, SZ, and GM conducted the field trials to evaluate the traits. LL, CSW, and LG performed the data analysis. JS, CXW wrote the manuscript. All of the authors read and approved the manuscript.
Conflict of Interest Statement
The authors declare that the research was conducted in the absence of any commercial or financial relationships that could be construed as a potential conflict of interest.
Acknowledgments
This research was funded by the China Agriculture Research System (CARS-18).
Supplementary Material
The Supplementary Material for this article can be found online at: http://journal.frontiersin.org/article/10.3389/fpls.2016.01576
Supplementary Figure S1. Manhattan plots of the genome-wide association studies (GWASs) for each environment for lint percentage. (A–D) represent the AY-14, AY-15, SHZ-14, and SHZ-15 environments, respectively. Each dot represents a SNP. The horizontal dotted red and blue lines indicate the Bonferroni-corrected significance thresholds at −log10(P) = 5.21 and −log10(P) = 6.21, respectively.
Supplementary Table S1. Information on the 355 upland cotton accessions.
Supplementary Table S2. Descriptive statistics for the lint percentage in the four different environments.
Supplementary Table S3. Correlations between the different environments based on the 355 upland cotton accessions.
Supplementary Table S4. The 183 SSR primers whose sequences were obtained from public databases.
Supplementary Table S5. The 98 SSR primers whose sequences were not obtained from public databases.
Supplementary Table S6. The QTLs of FL and FS from 23 reports of QTL mapping.
References
Abdurakhmonov, I. Y., Buriev, Z. T., Saha, S., Pepper, A. E., Musaev, J. A., Almatov, A., et al. (2007). Microsatellite markers associated with lint percentage trait in cotton, Gossypium hirsutum. Euphytica 156, 141–156. doi: 10.1007/s10681-007-9361-2
Abdurakhmonov, I. Y., Kohel, R. J., Yu, J. Z., Pepper, A. E., Abdullaev, A. A., Kushanov, F. N., et al. (2008). Molecular diversity and association mapping of fiber quality traits in exotic G. hirsutum L. germplasm. Genomics 92, 478–487. doi: 10.1016/j.ygeno.2008.07.013
Al-Ghazi, Y., Bourot, S., Arioli, T., Dennis, E. S., and Llewellyn, D. J. (2009). Transcript profiling during fiber development identifies pathways in secondary metabolism and cell wall structure that may contribute to cotton fiber quality. Plant Cell Physiol. 50, 1364–1381. doi: 10.1093/pcp/pcp084
Atwell, S., Huang, Y. S., Vilhjálmsson, B. J., Willems, G., Horton, M., Li, Y., et al. (2010). Genome-wide association study of 107 phenotypes in Arabidopsis thaliana inbred lines. Nature 465, 627–631. doi: 10.1038/nature08800
Badigannavar, A., and Myers, G. O. (2015). Genetic diversity, population structure and marker trait associations for seed quality traits in cotton (Gossypium hirsutum). J. Genet. 94, 87–94. doi: 10.1007/s12041-015-0489-x
Cai, C., Ye, W., Zhang, T., and Guo, W. (2014). Association analysis of fiber quality traits and exploration of elite alleles in upland cotton cultivars/accessions (Gossypium hirsutum L.). J. Integr. Plant Biol. 56, 51–62. doi: 10.1111/jipb.12124
Chen, W., Yao, J., Chu, L., Yuan, Z., Li, Y., and Zhang, Y. (2015). Genetic mapping of the nulliplex-branch gene (gb_nb1) in cotton using next-generation sequencing. Theor. Appl. Genet. 128, 539–547. doi: 10.1007/s00122-014-2452-2
Chen, Z. J., Scheffler, B. E., Dennis, E., Triplett, B. A., Zhang, T., Guo, W., et al. (2007). Toward sequencing cotton (Gossypium) genomes. Plant Physiol. 145, 1303–1310. doi: 10.1104/pp.107.107672
Culp, T. W., and Harrell, D. C. (1975). Influence of lint percentage, boll size, and seed size on lint yield of upland cotton with high fiber strength. Crop Sci. 15, 741–746. doi: 10.2135/cropsci1975.0011183X001500060001x
Fang, D. D., Hinze, L. L., Percy, R. G., Li, P., Deng, D., and Thyssen, G. (2013). A microsatellite-based genome-wide analysis of genetic diversity and linkage disequilibrium in upland cotton (Gossypium hirsutum L.) cultivars from major cotton-growing countries. Euphytica 191, 391–401. doi: 10.1007/s10681-013-0886-2
Gore, M. A., Fang, D. D., Poland, J. A., Zhang, J., Percy, R. G., and Cantrell, R. G. (2014). Linkage map construction and quantitative trait locus analysis of agronomic and fiber quality traits in cotton. Plant Genome 7, 1–10. doi: 10.3835/plantgenome2013.07.0023
Hegeman, C. E., Good, L. L., and Grabau, E. A. (2001). Expression of D-myo-inositol-3-phosphate synthase in soybean. Implications for phytic acid biosynthesis. Plant Physiol. 125, 1941–1948. doi: 10.1104/pp.125.4.1941
Huang, X., Wei, X., Sang, T., Zhao, Q., Feng, Q., Zhao, Y., et al. (2010). Genome-wide association studies of 14 agronomic traits in rice landraces. Nat. Genet. 42, 961–967. doi: 10.1038/ng.695
Johnson, M. D., and Wang, X. (1996). Differentially expressed forms of 1-L-myo-inositol-1-phosphate synthase (EC 5.5.1.4) in Phaseolus vulgaris. J. Biol. Chem. 271, 17215–17218. doi: 10.1074/jbc.271.29.17215
Kim, H. J., and Triplett, B. A. (2001). Cotton fiber growth in planta and in vitro. Models for plant cell elongation and cell wall biogenesis. Plant Physiol. 127, 1361–1366. doi: 10.1104/pp.010724
Kump, K. L., Bradbury, P. J., Wisser, R. J., Buckler, E. S., Belcher, A. R., Oropeza-Rosas, M. A., et al. (2011). Genome-wide association study of quantitative resistance to southern leaf blight in the maize nested association mapping population. Nat. Genet. 43, 163–168. doi: 10.1038/ng.747
Li, C., Guo, W., and Zhang, T. (2009). Quantitative inheritance of yield and its components in upland cotton (Gossypium hirsutum L.) cultivars with varied lint percentages. Acta Agron. Sin. 35, 1990–1999. doi: 10.3724/SP.J.1006.2009.01990
Li, F., Fan, G., Lu, C., Xiao, G., Zou, C., Kohel, R. J., et al. (2015). Genome sequence of cultivated upland cotton (Gossypium hirsutum TM-1) provides insights into genome evolution. Nat. Biotechnol. 33, 524- 530. doi: 10.1038/nbt.3208
Lipka, A. E., Tian, F., Wang, Q., Peiffer, J., Li, M., Bradbury, P. J., et al. (2012). GAPIT: genome association and prediction integrated tool. BioInformatics 28, 2397–2399. doi: 10.1093/bioinformatics/bts444
Liu, D., Liu, F., Shan, X., Zhang, J., Tang, S., Fang, X., et al. (2015). Construction of a high-density genetic map and lint percentage and cottonseed nutrient trait QTL identification in upland cotton (Gossypium hirsutum L.). Mol. Gen. Genet. 290, 1–18. doi: 10.1007/s00438-015-1027-5
Liu, R., Wang, B., Guo, W., Qin, Y., Wang, L., Zhang, Y., et al. (2012). Quantitative trait loci mapping for yield and its components by using two immortalized populations of a heterotic hybrid in Gossypium hirsutum L. Mol. Breed. 29, 297–311. doi: 10.1007/s11032-011-9547-0
Liu, S., Fan, C., Li, J., Cai, G., Yang, Q., Wu, J., et al. (2016). A genome-wide association study reveals novel elite allelic variations in seed oil content of Brassica napus. Theor. Appl. Genet. 129, 1203–1215. doi: 10.1007/s00122-016-2697-z
Long, A. D., and Langley, C. H. (1999). The power of association studies to detect the contribution of candidate genetic loci to variation in complex traits. Genome Res. 9, 720–731.
Luo, Y., Qin, G., Zhang, J., Liang, Y., Song, Y., Zhao, M., et al. (2011). D-myo-inositol-3-phosphate affects phosphatidylinositol-mediated endomembrane function in Arabidopsis and is essential for auxin-regulated embryogenesis. Plant Cell 23, 1352–1372. doi: 10.1105/tpc.111.083337
Mackay, T. F., Stone, E. A., and Ayroles, J. F. (2009). The genetics of quantitative traits: challenges and prospects. Nat. Rev. Genet. 10, 565–577. doi: 10.1038/nrg2612
Mao, H., Wang, H., Liu, S., Li, Z., Yang, X., Yan, J., et al. (2015). A transposable element in a NAC gene is associated with drought tolerance in maize seedlings. Nat. Commun. 6, 8326. doi: 10.1038/ncomms9326
Mei, H., Zhu, X., and Zhang, T. (2013). Favorable QTL alleles for yield and its components identified by association mapping in Chinese upland cotton cultivars. PLoS ONE 8:e82193. doi: 10.1371/journal.pone.0082193
Meinert, M. C., and Delmer, D. P. (1977). Changes in biochemical composition of the cell wall of the cotton fiber during development. Plant Physiol. 59, 1088–1097. doi: 10.1104/pp.59.6.1088
Mitsuhashi, N., Kondo, M., Nakaune, S., Ohnishi, M., Hayashi, M., Hara-Nishimura, I., et al. (2008). Localization of myo-inositol-1-phosphate synthase to the endosperm in developing seeds of Arabidopsis. J. Exp. Bot. 59, 3069–3076. doi: 10.1093/jxb/ern161
Nie, X., Huang, C., You, C., Li, W., Zhao, W., Shen, C., et al. (2016). Genome-wide SSR-based association mapping for fiber quality in nation-wide upland cotton inbreed cultivars in China. BMC Genomics 17:352. doi: 10.1186/s12864-016-2662-x
Paterson, A. H., Brubaker, C. L., and Wendel, J. F. (1993). A rapid method for extraction of cotton (Gossypium Spp.) genomic DNA suitable for RFLP or PCR analysis Plant Mol. Biol. Rep. 11, 122–127. doi: 10.1007/BF02670470
Qin, H., Chen, M., Yi, X., Bie, S., Zhang, C., Zhang, Y., et al. (2015). Identification of associated SSR markers for yield component and fiber quality traits based on frame map and upland cotton collections. PLoS ONE 10:e0118073. doi: 10.1371/journal.pone.0118073
Rong, J., Feltus, F. A., Waghmare, V. N., Pierce, G. J., Chee, P. W., Draye, X., et al. (2007). Meta-analysis of polyploid cotton QTL shows unequal contributions of subgenomes to a complex network of genes and gene clusters implicated in lint fiber development. Genetics 176, 2577–2588. doi: 10.1534/genetics.107.074518
Said, J. I., Lin, Z., Zhang, X., Song, M., and Zhang, J. (2013). A comprehensive meta QTL analysis for fiber quality, yield, yield related and morphological traits, drought tolerance, and disease resistance in tetraploid cotton. BMC Genomics 14:776. doi: 10.1186/1471-2164-14-776
Said, J. I., Song, M., Wang, H., Lin, Z., Zhang, X., Fang, D. D., et al. (2015). A comparative meta-analysis of QTL between intraspecific Gossypium hirsutum and interspecific G. hirsutum × G. Barbadense populations. Mol. Genet. Genom. 290, 1003–1025. doi: 10.1007/s00438-014-0963-9
Shen, X., Guo, W., Lu, Q., Zhu, X., Yuan, Y., and Zhang, T. (2007). Genetic mapping of quantitative trait loci for fiber quality and yield trait by RIL approach in upland cotton. Euphytica 155, 371–380. doi: 10.1007/s10681-006-9338-6
Shin, J., Blay, S., Graham, J., and McNeney, B. (2013). LDheatmap: an R function for graphical display of pairwise linkage disequilibria between single nucleotide polymorphisms. J. Stat. Softw. 16, 1–10. doi: 10.18637/jss.v016.c03
Su, J., Pang, C., Wei, H., Li, L., Liang, B., Wang, C., et al. (2016). Identification of favorable SNP alleles and candidate genes for traits related to early maturity via GWAS in upland cotton. BMC Genomics 17:687. doi: 10.1186/s12864-016-2875-z
Sun, X., Liu, D., Zhang, X., Li, W., Liu, H., Hong, W., et al. (2013). SLAF-seq: an efficient method of large-scale de novo SNP discovery and genotyping using high-throughput sequencing. PLoS ONE 8:e58700. doi: 10.1371/journal.pone.0058700
Trapnell, C., Roberts, A., Goff, L., Pertea, G., Kim, D., Kelley, D. R., et al. (2012). Differential gene and transcript expression analysis of RNA-seq experiments with TopHat and cufflinks. Nat. Protoc. 7, 562–578. doi: 10.1038/nprot.2012.016
Wan, Q., Zhang, Z., Hu, M., Chen, L., Liu, D., Chen, X., et al. (2007). T1 locus in cotton is the candidate gene affecting lint percentage, fiber quality and spiny bollworm (Earias spp.) resistance. Euphytica 158, 241–247. doi: 10.1007/s10681-007-9446-y
Wang, C., Zhang, T., and Guo, W. (2013). The im mutant gene negatively affects many aspects of fiber quality traits and lint percentage in cotton. Crop Sci. 52, 27–37. doi: 10.2135/cropsci2012.05.0304
Wang, H., Jin, X., Zhang, B., Shen, C., and Lin, Z. (2015). Enrichment of an intraspecific genetic map of upland cotton by developing markers using parental RAD sequencing. DNA Res. 22, 147–160. doi: 10.1093/dnares/dsu047
Wang, M., Li, C., and Wang, Q. (2014). Quantitative trait loci mapping and genetic dissection for lint percentage in upland cotton (Gossypium hirsutum). J. Genet. 93, 371–378. doi: 10.1007/s12041-014-0385-9
Wang, Y., Ning, Z., Hu, Y., Chen, J., Zhao, R., Chen, H., et al. (2015). Molecular mapping of restriction-site associated DNA markers in allotetraploid upland cotton. PLoS ONE 10:e0124781. doi: 10.1371/journal.pone.0124781
Xia, Z., Zhang, X., Liu, Y., Jia, Z., Zhao, H., Li, C., et al. (2014). Major gene identification and quantitative trait locus mapping for yield-related traits in upland cotton (Gossypium hirsutum L.). J. Integr. Agric. 13, 299–309. doi: 10.1016/S2095-3119(13)60508-0
Xu, L., Hu, K., Zhang, Z., Guan, C., Chen, S., Hua, W., et al. (2016). Genome-wide association study reveals the genetic architecture of flowering time in rapeseed (Brassica napus L.). DNA Res. 23, 43–52. doi: 10.1093/dnares/dsv035
Yu, J., and Buckler, E. S. (2006). Genetic association mapping and genome organization of maize. Curr. Opin. Biotechnol. 17, 155–160. doi: 10.1016/j.copbio.2006.02.003
Yu, J., Pressoir, G., Briggs, W. H., Vroh Bi, I., Yamasaki, M., Doebley, J. F., et al. (2006). A unified mixed-model method for association mapping that accounts for multiple levels of relatedness. Nat. Genet. 38, 203–208. doi: 10.1038/ng1702
Yu, J., Yu, S., Gore, M., Wu, M., Zhai, H., Li, X., et al. (2013a). Identification of quantitative trait loci across interspecific F2, F2:3 and testcross populations for agronomic and fiber traits in tetraploid cotton. Euphytica 191, 375–389. doi: 10.1007/s10681-013-0875-5
Yu, J., Zhang, K., Li, S., Yu, S., Zhai, H., Wu, M., et al. (2013b). Mapping quantitative trait loci for lint yield and fiber quality across environments in a Gossypium hirsutum × Gossypium barbadense backcross inbred line population. Theor. Appl. Genet. 126, 275–287. doi: 10.1007/s00122-012-1980-x
Zeng, L., and Meredith, W. R. (2009). Associations among lint yield, yield components, and fiber properties in an introgressed population of cotton. Crop Sci. 49, 1647–1654. doi: 10.2135/cropsci2008.09.0547
Zhai, H., Gong, W., Tan, Y., Liu, A., Song, W., Li, J., et al. (2016). Identification of chromosome segment substitution lines of gossypium barbadense introgressed in G. hirsutum and quantitative trait locus mapping for fiber quality and yield traits. PLoS ONE 11:e0159101. doi: 10.1371/journal.pone.0159101
Zhang, T., Hu, Y., Jiang, W., Fang, L., Guan, X., Chen, J., et al. (2015). Sequencing of allotetraploid cotton (Gossypium hirsutum L. acc. TM-1) provides a resource for fiber improvement. Nat. Biotechnol. 33, 531–537. doi: 10.1038/nbt.3207
Zhang, T., Qian, N., Zhu, X., Chen, H., Wang, S., Mei, H., et al. (2013). Variations and transmission of QTL alleles for yield and fiber qualities in upland cotton cultivars developed in China. PLoS ONE 8:e57220. doi: 10.1371/journal.pone.0057220
Zhang, W., Liu, F., Li, S., Wang, W., Wang, C., Zhang, X., et al. (2011). QTL analysis on yield and its components in upland cotton RIL. Acta Agron. Sin. 37, 433–442. doi: 10.3724/SP.J.1006.2011.00433
Zhang, Z., Shang, H., Shi, Y., Huang, L., Li, J., Ge, Q., et al. (2016). Construction of a high-density genetic map by specific locus amplified fragment sequencing (SLAF-seq) and its application to quantitative trait loci (QTL) analysis for boll weight in upland cotton (Gossypium hirsutum.). BMC Plant Biol. 16:79. doi: 10.1186/s12870-016-0741-4
Zhang, Z. S., Xiao, Y. H., Luo, M., Li, X. B., Luo, X. Y., Hou, L., et al. (2005). Construction of a genetic linkage map and QTL analysis of fiber-related traits in upland cotton (Gossypium hirsutum L.). Euphytica 144, 91–99. doi: 10.1007/s10681-005-4629-x
Zhao, K., Aranzana, M. J., Kim, S., Lister, C., Shindo, C., Tang, C., et al. (2007). An Arabidopsis example of association mapping in structured samples. PLoS Genet. 3:e4. doi: 10.1371/journal.pgen.0030004
Zhao, K., Tung, C. W., Eizenga, G. C., Wright, M. H., Ali, M. L., Price, A. H., et al. (2011). Genome-wide association mapping reveals a rich genetic architecture of complex traits in Oryza sativa. Nat. Commun. 2, 1020–1021. doi: 10.1038/ncomms1467
Zhao, Y., Wang, H., Chen, W., and Li, Y. (2014). Genetic structure, linkage disequilibrium and association mapping of verticillium wilt resistance in elite cotton (Gossypium hirsutum L.) germplasm population. PLoS ONE 9:e86308. doi: 10.1371/journal.pone.0086308
Keywords: upland cotton, lint percentage, genome-wide association study, favorable haplotypes, candidate genes
Citation: Su J, Fan S, Li L, Wei H, Wang C, Wang H, Song M, Zhang C, Gu L, Zhao S, Mao G, Wang C, Pang C and Yu S (2016) Detection of Favorable QTL Alleles and Candidate Genes for Lint Percentage by GWAS in Chinese Upland Cotton. Front. Plant Sci. 7:1576. doi: 10.3389/fpls.2016.01576
Received: 21 July 2016; Accepted: 06 October 2016;
Published: 21 October 2016.
Edited by:
Chengdao Li, Murdoch University, AustraliaReviewed by:
Qing-Yong Yang, Huazhong Agricultural University, ChinaLiezhao Liu, Southwest University, China
Copyright © 2016 Su, Fan, Li, Wei, Wang, Wang, Song, Zhang, Gu, Zhao, Mao, Wang, Pang and Yu. This is an open-access article distributed under the terms of the Creative Commons Attribution License (CC BY). The use, distribution or reproduction in other forums is permitted, provided the original author(s) or licensor are credited and that the original publication in this journal is cited, in accordance with accepted academic practice. No use, distribution or reproduction is permitted which does not comply with these terms.
*Correspondence: Chaoyou Pang, Y2h5cGFuZ0AxNjMuY29t
Shuxun Yu, eXN4MTk1MzExQDE2My5jb20=