 Jinlong Zhang
 Jiaxue Wang
 Wei Jiang
 Junyi Gai
 Yan Li
- National Key Laboratory of Crop Genetics and Germplasm Enhancement, National Center for Soybean Improvement, Key Laboratory for Biology and Genetic Improvement of Soybean (Ministry of Agriculture), Jiangsu Collaborative Innovation Center for Modern Crop Production, Nanjing Agricultural University, Nanjing, China
Soil alkalinity is a major abiotic constraint to crop productivity and quality. Wild soybean (Glycine soja) is considered to be more stress-tolerant than cultivated soybean (G. max), and has considerable genetic variation for increasing alkalinity tolerance of soybean. In this study, we analyzed the transcriptome profile in the roots of an alkalinity tolerant wild soybean variety N24852 at 12 and 24 h after 90 mM NaHCO3 stress by RNA-sequencing. Compared with the controls, a total of 449 differentially expressed genes (DEGs) were identified, including 95 and 140 up-regulated genes, and 108 and 135 down-regulated genes at 12 and 24 h after NaHCO3 treatment, respectively. Quantitative RT-PCR analysis of 14 DEGs showed a high consistency with their expression profiles by RNA-sequencing. Gene Ontology (GO) terms related to transcription factors and transporters were significantly enriched in the up-regulated genes at 12 and 24 h after NaHCO3 stress, respectively. Nuclear factor Y subunit A transcription factors were enriched at 12 h after NaHCO3 stress, and high percentages of basic helix-loop-helix, ethylene-responsive factor, Trihelix, and zinc finger (C2H2, C3H) transcription factors were found at both 12 and 24 h after NaHCO3 stress. Genes related to ion transporters such as ABC transporter, aluminum activated malate transporter, glutamate receptor, nitrate transporter/proton dependent oligopeptide family, and S-type anion channel were enriched in up-regulated DEGs at 24 h after NaHCO3 treatment, implying their roles in maintaining ion homeostasis in soybean roots under alkalinity. Kyoto Encyclopedia of Genes and Genomes pathway enrichment analysis showed “phenylpropanoid biosynthesis” and “phenylalanine metabolism” pathways might participate in soybean response to alkalinity. This study provides a foundation to further investigate the functions of NaHCO3 stress-responsive genes and the molecular basis of soybean tolerance to alkalinity.
Introduction
Salt-affected soils are major abiotic constraints to crop yield and agricultural sustainability, and can be classified into two main categories: saline and alkaline (Tuyen et al., 2010; Xu and Tuyen do, 2012). Different from salinity, alkalinity is mainly caused by sodium bicarbonate (NaHCO3) or sodium carbonate (Na2CO3), which affects seed germination, plant growth and productivity by the presence of excess Na+, combined with HCO3-, CO32-, high pH (>8.5), and poor soil structure. The Food and Agriculture Organization/United Nations Educational, Scientific and Cultural Organization (FAO/UNESCO) showed that alkaline soils cover an area of 434 million hectares (ha) worldwide (FAO, 2000; Munns, 2005). North America and Latin America has 14.5 and 50.9 million ha alkalinity soils, respectively (FAO, 2000; Tuyen et al., 2010). The Song-Nen Plain, a major soybean cultivation region in northeastern China, is one of the top three major contiguous saline-alkali-affected areas in the world, which has an estimated area of 3.73 million ha alkaline soils, and the size of which is increasing by 1.4% annually (Ge et al., 2010; Zhang L.M. et al., 2013). Therefore increasing crop tolerance to alkalinity is essential for food security.
Extensive investigations have been devoted to determine how plants respond to salinity/alkalinity. High concentrations of toxic ions in soils, such as Na+ or sometimes Cl-, HCO3-, or CO32-, cause an increase in external osmotic pressure and ion imbalance in plants (Serrano and Rodriguez-Navarro, 2001; Zhu, 2001). There is evidence that high soil pH (>8.5) imposes adverse effect on roots, affecting nutrient uptake, disturbing organic acids balance, distribution and accumulation of inorganic ions, especially disrupting cellular pH stability (Chen et al., 2009; Yang et al., 2009; Zhang L.M. et al., 2013; Zhang X. et al., 2013). It has been proposed that there are three major mechanisms for plant salinity tolerance: tolerance to osmotic stress, sodium (Na+) exclusion from leaf blades, and tissue tolerance (Munns and Tester, 2008). Osmotic stress inhibits plant growth and causes stomatal closure. An osmotic stress tolerant plant shows less reduction in shoot growth and greater stomatal conductance (Munns and Tester, 2008). Many compatible solutes (such as glycine betaine, proline, sugars, and polyols) are accumulated in plants under salinity, and are essential to balance the osmotic pressure of the cytoplasm (Munns, 2005). Ion exclusion means plants do not accumulate toxic concentration of Na+ (Serrano and Rodriguez-Navarro, 2001; Zhu, 2003). Several gene families such as SOS and HKT are involved in ion exclusion mechanisms (Zhu, 2001; Munns, 2005). Tissue tolerance represents a compartmentalization of ions at the cellular level by sequestration of Na+ in vacuoles to enhance tolerance to high concentration of ions. Two key genes, AtNHX1 and AtAVP1, are involved in the movement of Na+ into vacuoles, affecting tissue tolerance of Arabidopsis (Gaxiola et al., 1999, 2001; Pardo et al., 2006). Under alkaline stress, alkalinity-tolerant plants can uptake nutrients such as iron more efficiently than sensitive plants (Munns, 2005; Peiffer et al., 2012; Xu and Tuyen do, 2012). However, the details about genes and mechanisms of plant tolerance to alkalinity are largely unknown.
RNA-seq has several advantages such as no requirement of prior genome sequence information, higher throughput, wider range of expression levels, and less noise. Therefore it can be used for both model and non-model plant species. RNA-seq has been widely used for transcriptome analysis of crop response to salinity stress, such as wheat (Zhang et al., 2016), rice (Zhou et al., 2016), maize (Zhang L.M. et al., 2013), cotton (Yao et al., 2011), and oilseed rape (Yong et al., 2014). However, fewer studies on RNA-seq analysis of crops response to alkalinity have been reported so far (Fan et al., 2013; Zhang L.M. et al., 2013; DuanMu et al., 2015).
Soybean is one of the most important oilseed crops worldwide, which is rich in vegetable oil, protein and nutraceutical compounds such as isoflavones and saponins (Lam et al., 2010; Schmutz et al., 2010; Korir et al., 2013; Krishnamurthy et al., 2015). It is widely used for human food, animal feed, and industrial products. In ancient China ∼6,000–9,000 years ago, farmers used wild soybean (Glycine soja) to select domesticated soybean (Carter et al., 2004; Zhou et al., 2015). Cultivated soybean (G. max) has much lower genetic diversity than their wild progenitor (Hyten et al., 2006; Lam et al., 2010; Qi et al., 2014). Wild soybean is generally more tolerant and adapted to biotic and abiotic stress conditions than cultivated soybean. Both species have chromosomes 2n = 40 and can be crossed to generate viable, fertile offspring (Xu and Gai, 2003; Ge et al., 2010; Kim et al., 2010; Tuyen et al., 2010). The genomes of both species have been sequenced (Kim et al., 2010; Lam et al., 2010; Schmutz et al., 2010; Li et al., 2014; Zhou et al., 2015), providing useful information for functional genomics studies. However, transcriptome analysis of soybean in response to alkalinity by RNA-seq was limited.
Previous studies on expression profiles of soybean in response to alkaline stress were carried out using hydroponic solution with 50 mM NaHCO3 (Ge et al., 2010, 2011), which provides a general knowledge of soybean response to alkalinity. Root is the primary tissue in soil encountering alkaline stress, therefore in this research, we investigated the transcriptome profiles in the roots of an alkalinity-tolerant wild soybean variety, N24852, using quartz sand culture medium subjected to higher concentration of NaHCO3 (90 mM), which is more similar to the alkalinity in the field. The aim of this study was to find differentially expressed genes (DEGs), metabolic pathways, and overall transcriptional regulation of soybean response to early stage of NaHCO3 stress, which would broaden our understanding of the molecular and regulatory mechanisms of plant response to alkaline stress, and to identify candidate genes that could be utilized to improve soybean tolerance to alkalinity in future breeding programs.
Materials and Methods
Plant Growth and NaHCO3 Stress Treatment
We identified an alkalinity-tolerant wild soybean variety N24852 from a preliminary screening of 129 soybean varieties (our unpublished data), which showed more alkalinity-tolerant than 95% of the 129 varieties. N24852 is tolerant to biotic and abiotic stresses (Wang et al., 2013) and its alkalinity tolerance was confirmed in this study (Supplementary Figure S1). A widely used salinity-tolerant (but moderately sensitive to alkalinity) cultivated soybean variety Lee 68 (Abel and Mackenzie, 1964), was used as a genotype control to evaluate the alkalinity tolerance of N24852. These two varieties were grown in a growth chamber (E-41HO, Percival, USA) with 60% relative humidity, 15 h light (50000 lx)/9 h darkness photoperiod and corresponding temperature regime of 28°C/24°C. These two varieties showed obvious phenotypic difference when using 90 mM NaHCO3 treatment, but only showed subtle difference at 80 mM NaHCO3 and no difference at 100 mM NaHCO3 treatment in the preliminary experiment (Supplementary Figure S1). Therefore, 90 mM NaHCO3 was used for RNA-seq study.
Soybean seeds were surface-sterilized with 1% sodium hypochlorite for 30 s, and rinsed three times with deionized water. Twenty seeds were sown in plastic pots (Φ10 × 8 cm) which filled with clean quartz sand. Seven days after germination, the seedlings were thinned to four plants per pot. Four pots were placed in a plastic container (34 cm × 24 cm × 8 cm) containing 1.5 L fresh 1/2 strength Hoagland nutrient solution (pH ≈ 6.5), which could be absorbed through small holes at the bottom, and the solution was changed every 2 days. When the second trifoliolate leaves appeared (V3, approximately 14 days after planting), a treatment solution containing 90 mM NaHCO3 (with a final pH of 8.5, adjusted by addition of KOH) was applied to induce alkaline stress. The control contained no NaHCO3. The experiment included three independent biological replications.
Tissue Harvest
Before harvest, roots were dipped into an iso-osmotic solution of 10 mM Ca(NO3)2 for 10–20 s to avoid turgor loss and rapid efflux of ions from the apoplast and epidermal cells due to osmotic shock (Munns et al., 2010), and rinsed three times with deionized water. Root tips (3 cm) of NaHCO3-treated and control plants were harvested after 12 and 24 h treatment, then immediately frozen in liquid nitrogen and stored at -80°C for RNA isolation. The remaining root tissues and leaves from the stressed and control plants were harvested at the same time points for measurement of ion concentration. For determination of ion concentrations, samples were pretreated at 105°C for 30 min to deactivate enzymes and dried at 80°C for 5 days. In order to minimize variation between individual plants, bulked roots and leaves were harvested from four uniform plants in a single pot for each biological replicate.
Measurement of Ion Concentrations
Methods for ion extraction and measurement followed Munns et al. (2010). Dried samples were ground into powder. Then 0.1 g of the powder was digested in 2 mL nitric acid (HNO3) in a microwave digestion system (ETHOS T, Milestone, Italy) following the manufacturer’s recommendations. Na+, K+, and Ca2+ concentrations were estimated using an Inductively Coupled Plasma Optical Emission Spectrometer (ICP-OES) Optima 8000 (PerkinElmer, USA) according to the manufacturer’s instructions. The mg/L values were converted to mg/g dry weight (DW) using the formula of (concentration in mg/L as measured × dilution factor × volume of dilute nitrate acid)/(DW of tissue used in extraction × 1000). Differences between two soybean genotypes were compared by t-tests using the SAS proc ttest.
RNA Isolation, cDNA Library Construction and RNA-seq
Roots of wild soybean N24852 under 90 mM NaHCO3 and control at 12 and 24 h were harvested for RNA extraction and RNA-seq. A total of 12 samples (2 time points × 2 treatments × 3 biological replicates) were prepared for RNA-seq. Total RNA was extracted using Trizol® reagent (Invitrogen, USA). Total concentration and quality of the RNA samples were determined by agarose gel electrophoresis and a NanoDrop 2000 Spectrophotometer (Thermo Fisher Scientific, USA). An Agilent 2100 Bioanalyzer RNA Nano chip (Agilent Technologies, USA) was used for accurate quantification.
Messenger RNA (mRNA) was isolated from the total RNA by magnetic beads coated with oligo (dT) using a Dynabeads mRNA DIRECT Kit (Invitrogen, USA). Approximately 5 μg of mRNA from each sample was prepared to construct a library. The mRNA was fragmented into small pieces with fragmentation buffer at 90°C. Purified mRNA fragments were reverse transcribed (Invitrogen, USA) with random hexamer adaptors to synthesize the first strand cDNA. Second strand cDNA was synthesized with RNaseH (Invitrogen, USA) and DNA polymerase I (Invitrogen, USA). The cDNA was cleaned using Agencourt Ampure XP SPRI beads (Beckman Coulter, USA). The synthesized cDNAs were appended with an ‘A’ base at the 3′-end and ligated with paired-end adaptors. Paired-end cDNA libraries were amplified using PCR, and fragments of 400–500 bp insertions were selected from 2% agarose gel electrophoresis separation and quantified using qPCR. The twelve cDNA libraries were sequenced on an Illumina HiSeq 2500 platform (Illumina Inc. USA) according to the manufacturer’s recommendations at Berry Genomics Company, Beijing, China.
Sequencing Data Analysis
The sequence data (in FastQ format) have been submitted to the National Center for Biotechnology Information (NCBI) Sequence Read Archive (SRA) databases with the study accession SRP093892. The raw reads were cleaned by removing adaptor reads and low-quality reads (ambiguous sequences with ‘N’ percentage values ≤3 and the percentage of low-quality bases less than 3 is ≥50%) using an in-house script written in C. The clean data were used for subsequent data analysis. High-quality clean reads were mapped to the latest version (G. max Wm82.a2.v1) of soybean reference genome (Goodstein et al., 2012) downloaded from phytozome1, using Tophat2 (v2.0.13) software (Kim et al., 2013). Mismatches of less than or equal to 2 bp were allowed in mapping to reference sequences. Subsequently, the sequencing saturation of the library, coverage analysis of clean reads on reference genes, as well as the genomic distributions in CDS (exons), introns, and intergenic regions were analyzed.
Identification of Differentially Expressed Genes (DEGs)
Gene expression levels were normalized to Fragments Per Kilobase of transcript per Million fragments mapped (FPKM) by Cufflinks v2.2.2 software (Trapnell et al., 2010). DEGs were identified by comparing the NaHCO3-treated and control samples at the same time point using the R package DESeq (Anders and Huber, 2010). The significant DEGs were identified using the false discovery rate (FDR) ≤ 0.01 and | log2FoldChange|≥ 1.
Functional Annotation and Pathway Analysis
All mapped unigenes and new genes found in this study were compared against seven databases including National Center for Biotechnology Information (NCBI) non-redundant protein database (NR), Gene Ontology (GO), Clusters of Orthologous Groups of proteins (COG) (Tatusov et al., 2000), euKaryotic Ortholog Groups (KOG) (Koonin et al., 2004), reviewed protein sequence database (Swiss-Prot) (Apweiler et al., 2004), and Kyoto Encyclopedia of Genes and Genomes (KEGG) Ontology (KO) (Kanehisa et al., 2004) using BLASTn (v 2.2.26) software (Altschul et al., 1999) with an E-value cutoff at 10-5, and searched against the Protein family (Pfam) database (Finn et al., 2014) by hmmscan (v 3.0) software (Johnson et al., 2010). All genes were also BLAST against the Plant Transcription Factors Database v3.0 (Jin et al., 2014) with an E-value cutoff at 10-5. The WEGO software package (Ye et al., 2006) was used for describing GO functional classification of cellular component, molecular function and biological process. GO enrichment analyses of DEGs were performed using Singular Enrichment Analysis (SEA) method with P < 0.01 and FDR < 0.05 by agriGO (Du et al., 2010), and the newest soybean genome Wm82.a2.v1 was set as background. The hypergeometric Fisher exact test (P < 0.01) and Benjamini and Hochberg method (FDR < 0.05) was performed to detect statistically significant enrichment of KEGG pathway and transcription factors, in comparison with the whole soybean transcriptome as the background. DEGs were also blasted against the KOG databases2 for functional classification.
Heat Map with Clustering Analysis
Heat map of the DEGs overlapped between two time points (12 and 24 h), were analyzed using heatmap.2 function of the R/Bioconductor package gplots with default options (Warnes, 2016). The gene expression levels were transformed by log2 (FPKM+1) using three biological replications.
Quantitative Real-Time PCR (qRT-PCR)
To validate the RNA-seq gene expression patterns, 14 DEGs were selected and investigated by qRT-PCR using the same RNA samples for the RNA-seq library construction. We used the housekeeping gene GmUKN1 (Glyma.12G020500) as an internal control to normalize the level of gene expression (Hu et al., 2009; Guan et al., 2014). Primer pairs were designed for qRT-PCR using the online website NCBI primer-BLAST3. Primer sequences and gene annotations are listed in Supplementary Table S1. First-strand cDNA was synthesized from 500 ng/10 μl total RNA by using a PrimeScript RT Reagent Kit (TaKaRa, Japan). qRT-PCRs were performed in a LightCycler® 480 II (Roche, Germany) in a final volume of 25 μl containing 12.5 μl SYBR Premix Ex Taq II (Tli RNaseH Plus) (TaKaRa, Japan), 2 μl (200 ng) of cDNA, 1 μl (10 mM) of the forward and reverse primers, and 8.5 μl of ddH2O. PCR conditions were set at 95°C pre-denaturation for 3 min and followed by 40 cycles of 95°C denaturation for 15 s, 60°C annealing for 15 s, and 72°C extension for 15 s. Relative gene expression level was calculated using the 2-ΔΔCT method (Livak and Schmittgen, 2001). All qRT-PCR were performed in three technical replicates. The correlation of RNA-seq data with qRT-PCR analysis was calculated using SAS (v9.3) proc corr based on log2 fold changes.
Results
Phenotypic and Physiological Responses of Wild Soybean N24852 to NaHCO3 Stress
Maintenance of a low Na+ concentration, and low ratios of Na+/K+ and Na+/Ca2+ are widely used as indices of plant salinity tolerance (Puranik et al., 2011; Yong et al., 2014; Tuyen et al., 2016). To evaluate the alkalinity tolerance of wild soybean N24852, the salt tolerant soybean variety Lee 68 was used for comparison. The wild soybean N24852 showed more tolerance to 90 mM NaHCO3 stress than Lee 68, as indicated by the later appearance of chlorosis and wilting (Supplementary Figure S1). The concentration of Na+, ratios of Na+/K+ and Na+/Ca2+ in the roots of both soybean varieties increased after NaHCO3 treatment (Figure 1). But the wild soybean N24852 showed significantly (P < 0.05, student’s t-tests) lower concentration of Na+, ratios of Na+/K+ and Na+/Ca2+ in the roots than Lee68 under NaHCO3 stress (Figure 1). And the Na+ concentration, ratios of Na+/K+ and Na+/Ca2+ in the leaves of N24852 were also lower than those of Lee68 (Figure 1).
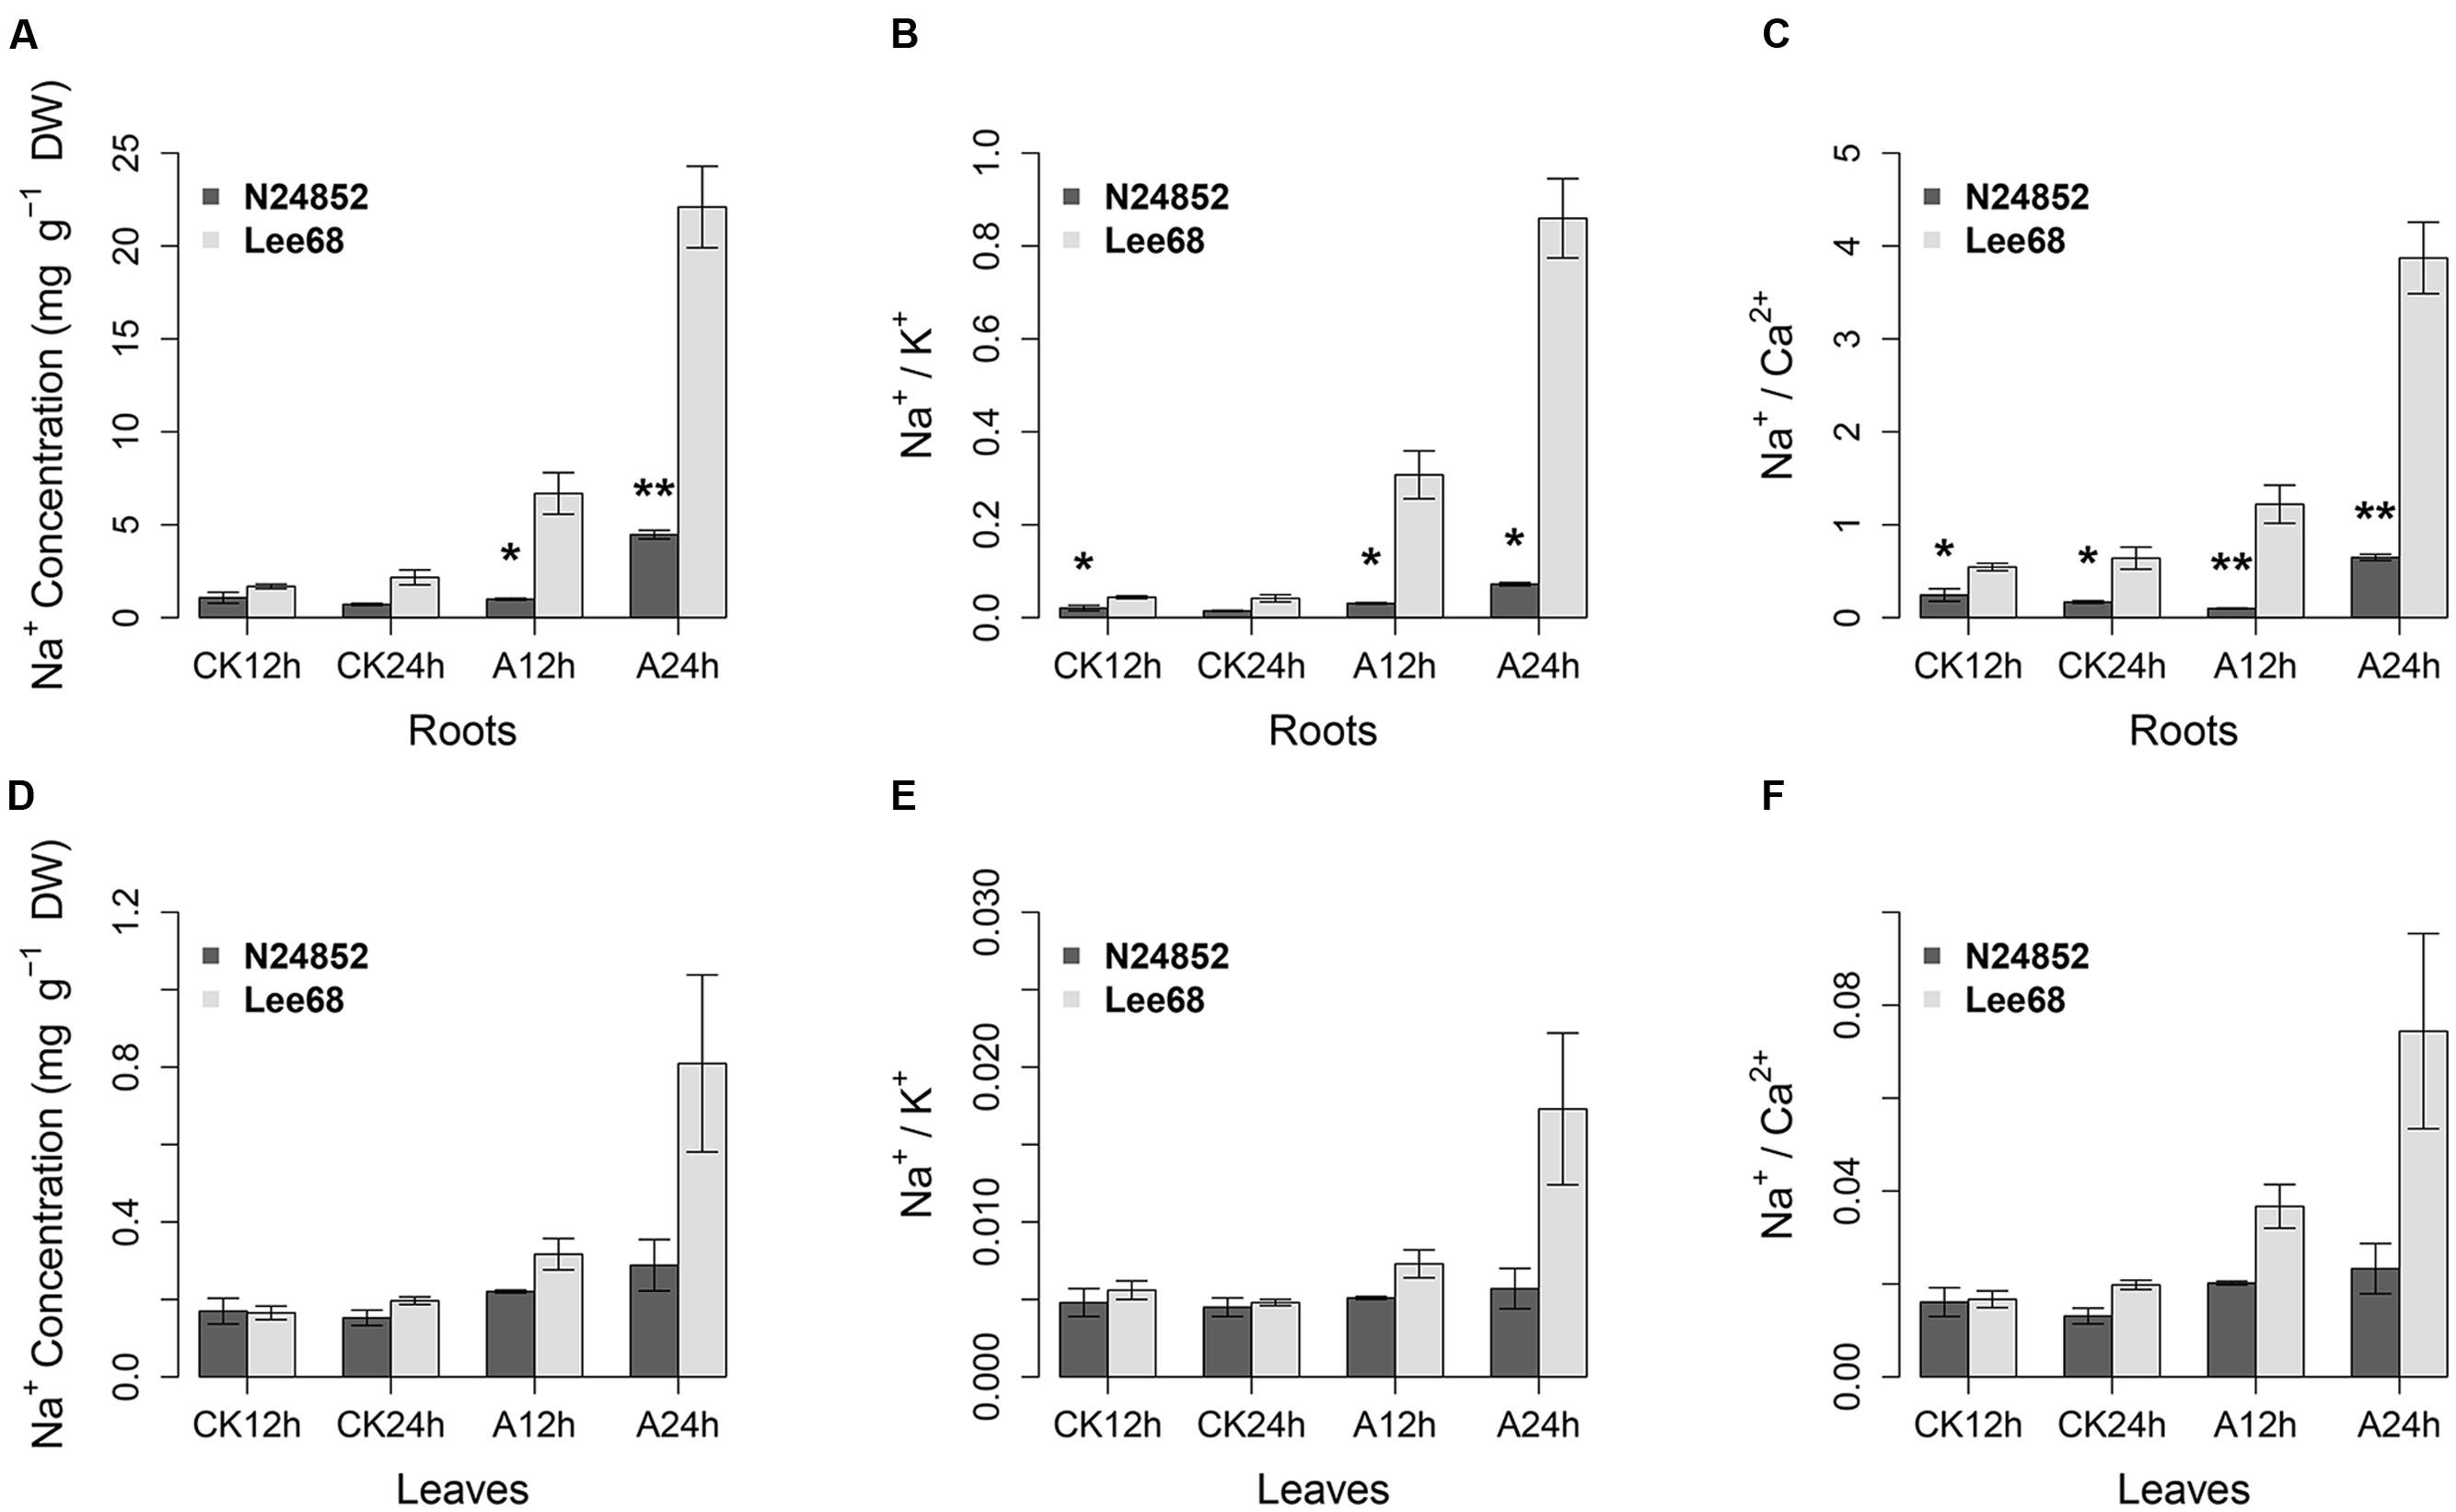
FIGURE 1. Ion concentrations and ratios in N24852 and Lee 68 under control (CK) and alkaline stress for 12 and 24 h. (A) Na+ concentration in roots, (B) Na+/K+ ratio in roots, (C) Na+/Ca2+ ratio in roots. (D) Na+ concentration in leaves, (E) Na+/K+ ratio in leaves, (F) Na+/Ca2+ ratio in leaves. Alkaline stress was 90 mM NaHCO3 (pH = 8.5) treatment, and control was 0 mM NaHCO3 (pH = 6.5). ∗ and ∗∗ indicate significant difference at 0.05 and 0.01 level by student’s t-tests between two soybean genotypes, respectively. DW, dry weight.
RNA-seq Data Output, Quality Assessment, Mapping and Annotation
Due to the lower Na+ concentration in the roots of N24852 than that of Lee 68 (Figure 1) was observed as early as 12 h after alkalinity, RNA-seq analyses of N24852 roots after 12 and 24 h of NaHCO3 stress in comparison with control were performed on three independent biological replicates. A total of 12 cDNA libraries were constructed and sequenced on Illumina HiSeq 2500, and 283.6 million raw reads were generated (Supplementary Table S2). After removing adaptors and low quality sequences, a total of 270.5 million (95.38% of the raw reads) clean reads (approximately 67.63 Gb clean data) were obtained. On average, 23.6 million clean reads (5.64 Gb clean data) were obtained from each sample (Supplementary Table S2). The percentages of Phred-like quality scores at the Q30 level (an error probability of 1‰) ranged from 87.24 to 94.45% and the average GC content was estimated as 46.43% (Supplementary Table S2). Among the 12 samples, 88.16–91.69% of the clean reads were mapped to the reference genome, and 89.85–96.60% of clean reads were uniquely mapped (Supplementary Table S2). The saturation curves of 12 RNA-seq samples (genes with FPKM ≥ 0.01) estimated that the gene coverage started to show saturation when approximately more than 5 million clean reads were aligned (Supplementary Figure S2A). The average clean reads of our 12 samples were 22.54 million, which is more than the saturation threshold. Gene coverage analysis indicates that the sequencing reads were uniformly distributed from the 5′ to 3′ of genes (Supplementary Figure S2B). On average, more than 80% of the mapped reads were located at the exon region (Supplementary Figure S3). Detailed information of the RNA-seq data was listed in Supplementary Table S2, suggesting that the sequencing quality was high and sequencing depth was sufficient for transcriptome coverage.
A total of 54,844 unigenes were detected in our transcriptome by cufflinks program, including 54331 genes that were aligned to the soybean reference genome (96.94% of the total 56044 genes in Williams 82) and 513 new genes. Among these, 54342 genes (including 53888 mapped unigenes and 454 new genes) were annotated by at least one of the seven databases (Supplementary Table S3). Taken together, 96.08% (54342) of the expressed genes were successfully annotated in at least one of databases, with 10.51% (5946) of genes annotated in all databases (Supplementary Table S3). The 54342 annotated genes are listed in Supplementary Table S4.
Identification of Differentially Expressed Genes (DEGs) in Soybean Roots under NaHCO3 Stress
By using the criteria of FDR ≤ 0.01 and | log2FoldChange|≥ 1, a total of 449 genes were differentially expressed in wild soybean roots under NaHCO3 stress compared with control (Supplementary Table S5). As shown in the Venn diagram (Figure 2), there were 95 and 140 up-regulated genes and 108 and 135 down-regulated genes after 12 and 24 h of alkaline stress, respectively, with more DEGs detected after 24 h alkaline stress than 12 h, implying more transcriptional changes at 24 h. The numbers of up- and down-regulated genes were similar. Nine genes were up-regulated and 20 genes were down-regulated at both time points (Figures 2 and 3), suggesting their importance in soybean response to NaHCO3 Stress. The overlapped up-regulated genes (Figure 3) included two aluminum-activated malate transporter (ALMT) genes (Glyma.11G179100 and Glyma.12G094400) and one gene (Glyma.13G363300) encoding a late embryogenesis abundant protein (LEA). ALMT transporters have been reported to play roles in adaptation of plants to abiotic stress (Henderson et al., 2014), and LEA proteins accumulate in response to water deficit caused by drought, heat and salinity (Battaglia and Covarrubias, 2013; Kosova et al., 2014). No DEG showed opposite regulation patterns at two time points (Figure 2; Supplementary Table S5).
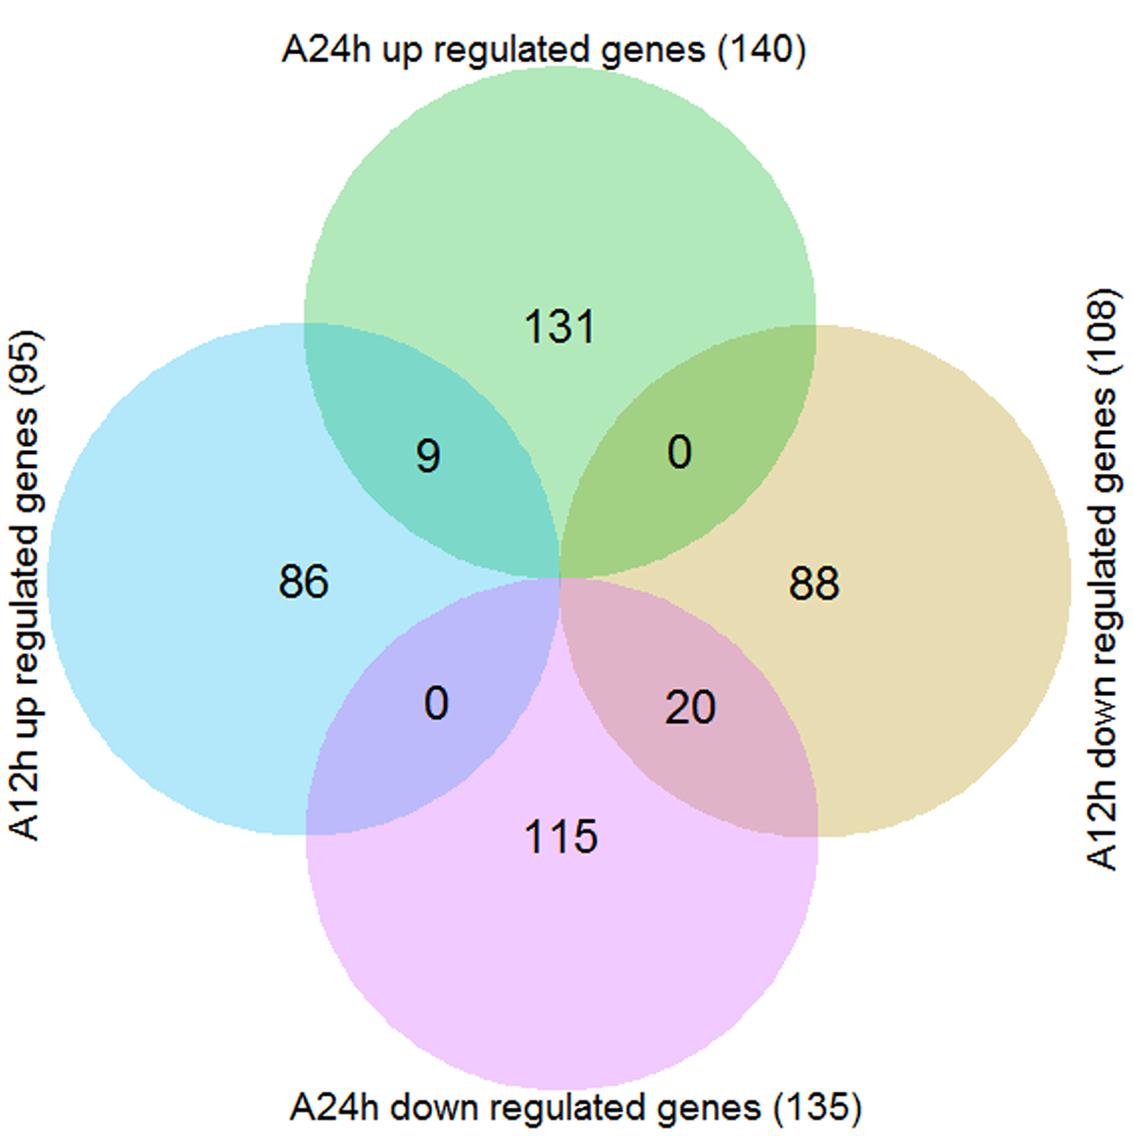
FIGURE 2. Venn diagram of the differentially expressed genes (DEGs) between alkaline stress (90 mM NaHCO3, pH = 8.5) and control. A12h, 12 h of alkaline stress; A24h, 24 h of alkaline stress.
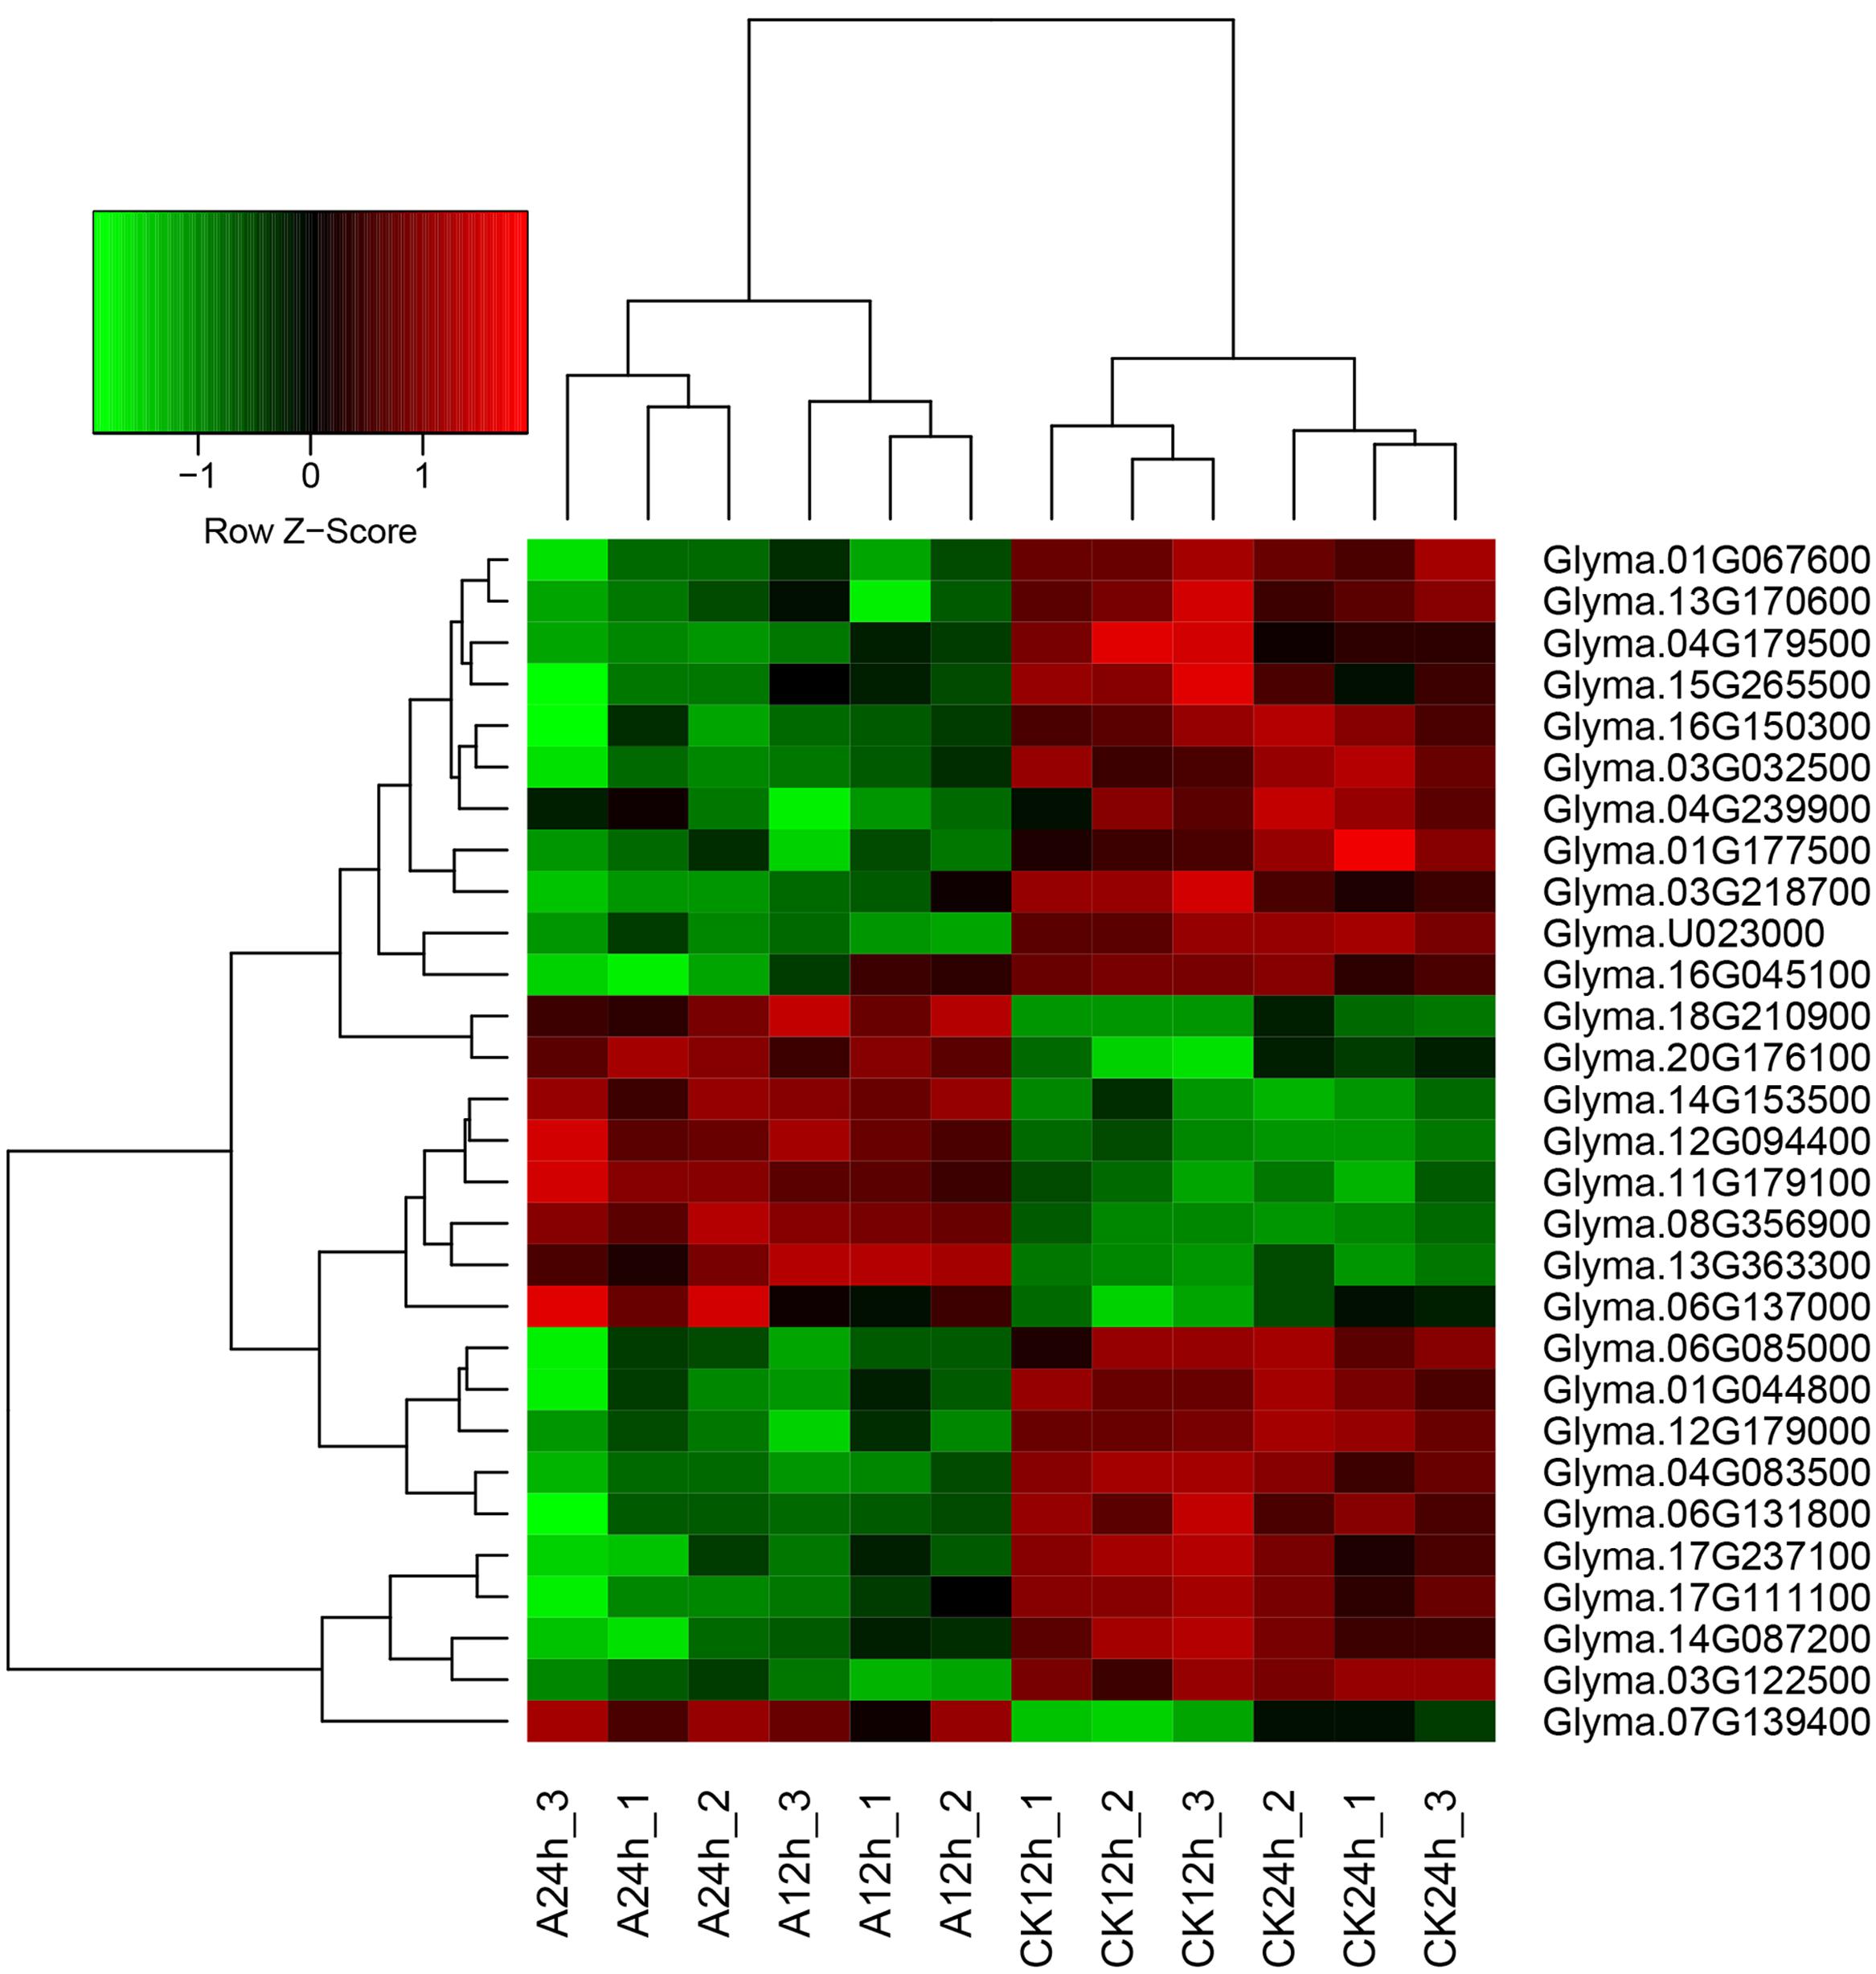
FIGURE 3. Heatmap of the overlap DEGs between two time points (12 and 24 h). Heatmap was plotted using heatmap.2 function of the R/Bioconductor package gplots. Hierarchical clustering of the DEGs was done by complete method with Euclidean distance. The gene expression levels were transformed by log2 (FPKM+1) and the values were centered and scaled in row direction. X-axis, samples; Y-axis, differentially expressed gene names.
Functional Classification and Gene Ontology (GO) Enrichment Analysis of DEGs
By WEGO database, the DEGs were classified into 12, 9, 12 categories for cellular components, molecular functions, and biological processes, respectively, after 12 h of NaHCO3 stress, and were classified into 12, 13, and 16 categories, respectively, at 24 h of NaHCO3 treatment (Supplementary Figure S4). By KOG database, there were 97 and 138 DEGs with KOG functional classification information at 12 and 24 h of NaHCO3 stress, respectively, and they were classified into 17 functional categories (Supplementary Figure S5).
We also performed GO enrichment analyses of DEGs using agriGO (P < 0.01, FDR < 0.05). At 12 h of alkaline stress, genes with transcription factor activity (GO:0003700) were significantly enriched in up-regulated genes (Figure 4A), while genes with peptidase activity (GO:0008233) and related to biological process of proteolysis (GO:0006508) were enriched in down-regulated genes (Supplementary Figure S6A). At 24 h of alkaline stress, genes with the molecular function of transporter activity (GO:0005215) and carbohydrate binding (GO:0030246), and involved in biological process of transport (GO:0006810) were significantly enriched in up-regulated genes (Figure 4B), while GO terms in molecular functions of “hydrolase activity (GO:0016787),” “transferase activity (GO:0016757),” and “oxidoreductase activity (GO:0016705),” biological process of “carbohydrate metabolic process (GO:0005975)” especially “cellular glucan metabolic process (GO:0006073)” were enriched in down-regulated genes (Supplementary Figure S6B). Consistent with the number of DEGs, the numbers of enriched GO terms at 24 h were greater than 12 h after alkaline stress.
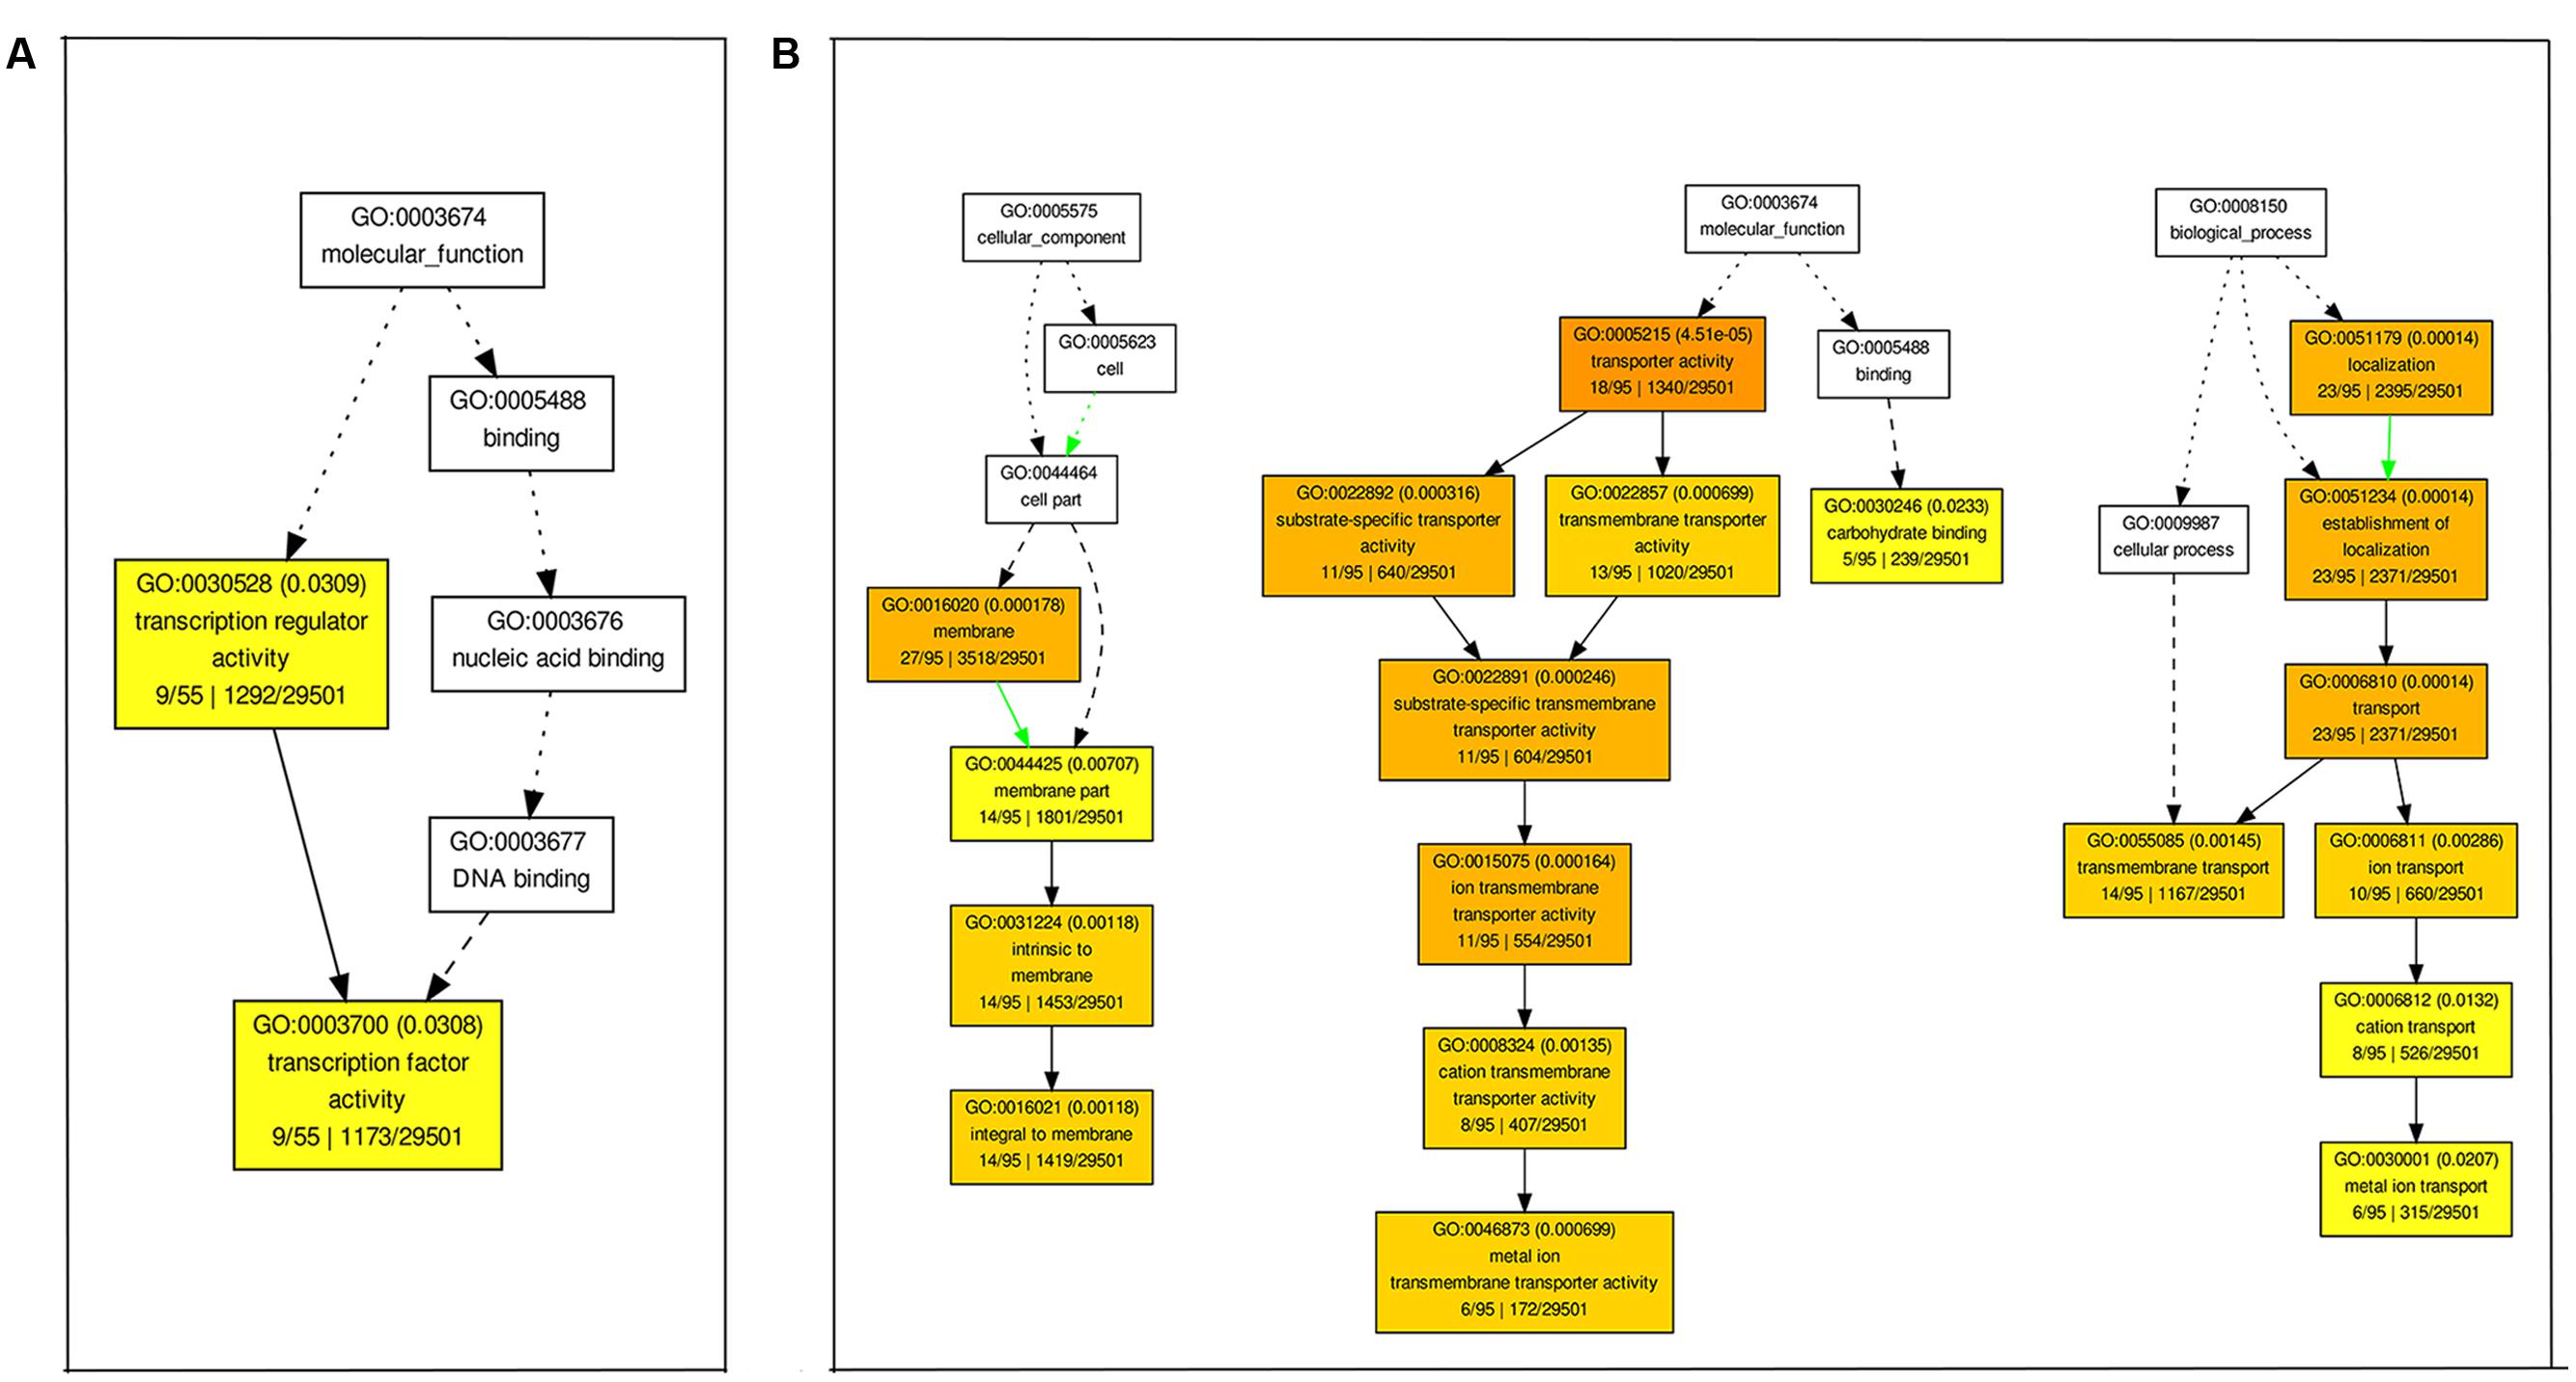
FIGURE 4. Enriched Gene ontology (GO) terms for up-regulated genes at 12 h (A) and 24 h (B) after 90 mM NaHCO3 (pH = 8.5) stress. The Singular Enrichment Analysis (SEA) was carried out by agriGO. The GO terms with their IDs are written in boxes. The significant (P < 0.01, FDR < 0.05) GO terms are in colored boxes (the degree of color saturation is positively correlated to the enrichment level of the GO term), and non-significant terms are in white boxes.
KEGG Pathway Classification and Enrichment Analysis of DEGs
All DEGs were BLAST against the KEGG Ontology (KO) database. At 12 h of NaHCO3 stress, 30 DEGs were classified into 29 biological pathways belonging to 13 KEGG categories (Supplementary Table S6). At 24 h after NaHCO3 stress, 48 DEGs were classified into 37 biological pathways belonging to 12 KEGG categories (Supplementary Table S7).
We also used the Fisher exact test to analyze KEGG enrichment for DEGs (P < 0.01, FDR < 0.05). No enriched biological pathways were found at 12 h after NaHCO3 stress, but enrichment of “phenylpropanoid biosynthesis” and “phenylalanine metabolism” was found at 24 h after 90 mM NaHCO3 (pH = 8.5) treatment (Supplementary Figures S7 and S8). The genes involved in both pathways were peroxidase-encoding genes, including three up-regulated genes (Glyma.07G209900, Glyma.17G053000, and Glyma.20G169200) and one down-regulated gene (Glyma.02G171600). As one of the important antioxidant enzymes, peroxidases (PODs) could protect plants from oxidative damage by scavenging of reactive oxygen species (ROS), which is induced by various abiotic and biotic stresses (Miller et al., 2008; Gill and Tuteja, 2010).
Validation of RNA-seq Data by qRT-PCR Analysis
To validate the expression data of RNA-seq, we selected 14 DEGs for qRT-PCR analysis, including four POD-encoding genes, three up-regulated genes and two down-regulated genes at both 12 and 24 h, and five genes that were up- or down- regulated at only one time point (Figure 5; Supplementary Table S1). To compare the expression data between RNA-seq and qRT-PCR, the relative expression level was transformed to log2 fold change. The qRT-PCR results showed a high consistency (linear regression equation y = 0.9142x + 0.0851, R2 = 0.9763) with RNA-seq data (Figure 5), indicating the reliability of RNA-seq expression profile in this study.
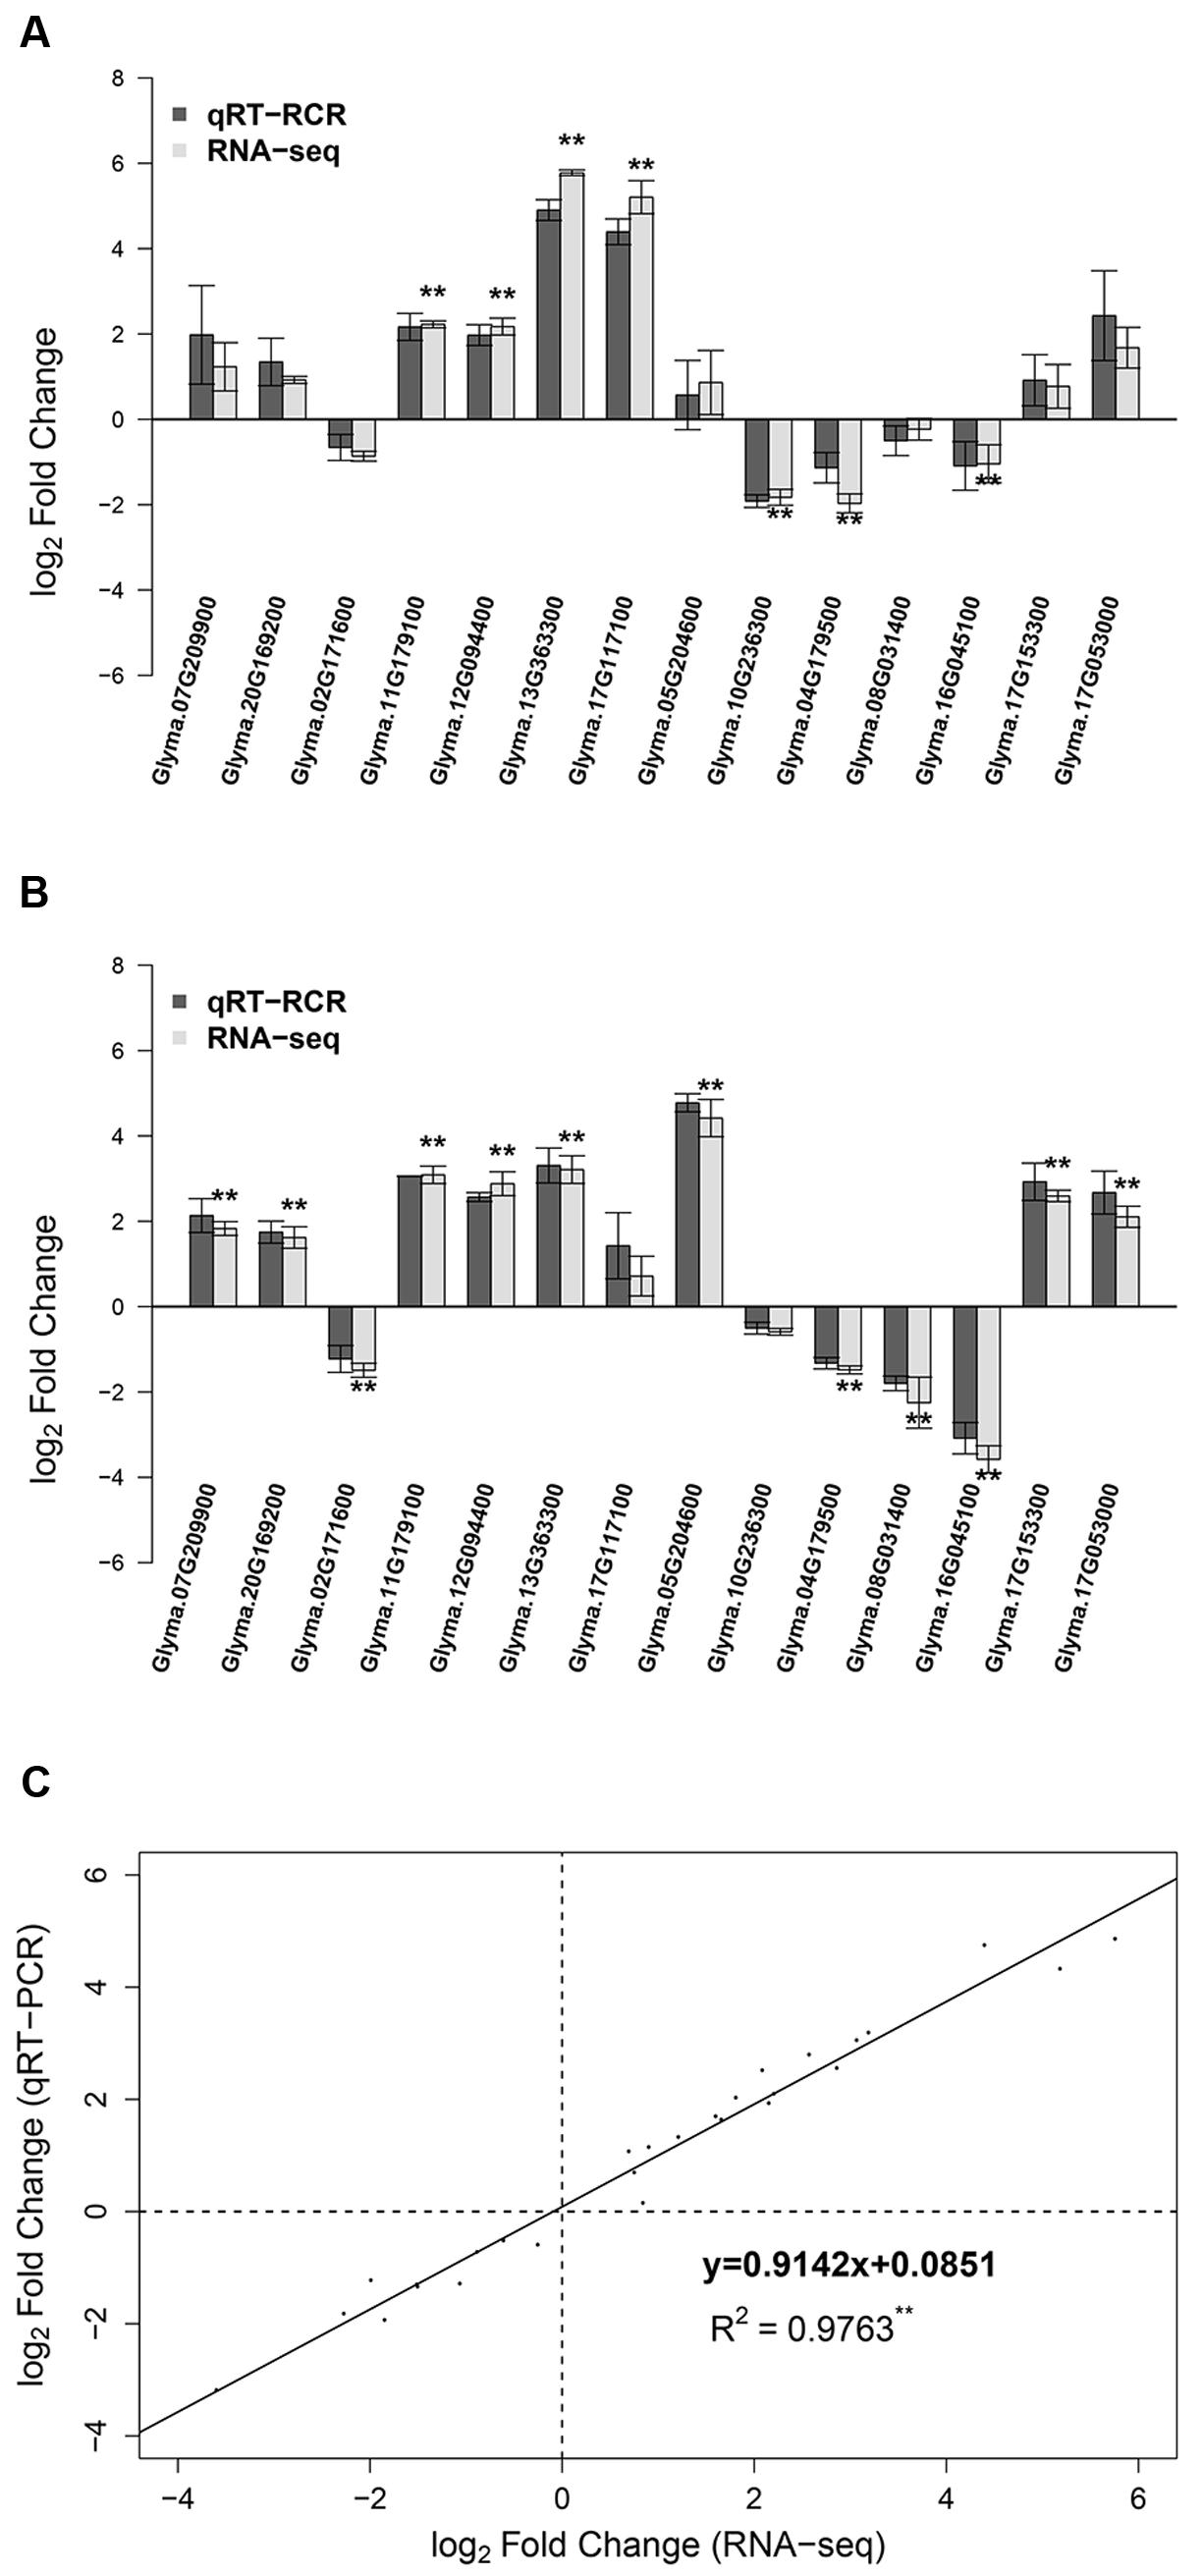
FIGURE 5. Comparison of RNA-seq results and qRT-PCR analysis of gene expression levels. (A) Log2 fold change of 14 genes at 12 h after 90 mM NaHCO3 (pH = 8.5) stress. (B) Log2 fold change of 14 genes at 24 h after 90 mM NaHCO3 (pH = 8.5) stress. (C) The comparison of log2 fold change obtained by RNA-seq (x-axis) and qRT-PCR (y-axis). ∗∗Differentially expressed genes at FDR ≤ 0.01 and | log2FoldChange|≥ 1 from RNA-seq.
DEGs Related to Transcription Factors
Transcription factors are essential for regulation of gene expression, by binding to the specific cis-acting elements in the genes that they regulate. A total of 130 and 173 transcription factors representing 36 and 38 different families were differentially expressed at 12 and 24 h, respectively, under NaHCO3 stress comparing with control in wild soybean roots (Figure 6). Among the differentially expressed transcription factors, high percentages of basic helix-loop-helix (bHLH), ethylene-responsive factor (ERF), Trihelix, and zinc finger (C2H2, C3H) families were found at both time points. Nuclear Factor Y subunit A (NF-YA) family was enriched at 12 h after NaHCO3 stress. These transcription factors have already been reported to play roles in plant response to abiotic stress (Ge et al., 2010; Kielbowicz-Matuk, 2012; Li et al., 2013; Yong et al., 2014; Dey and Vlot, 2015). No transcription factor family was enriched at 24 h after NaHCO3 stress.
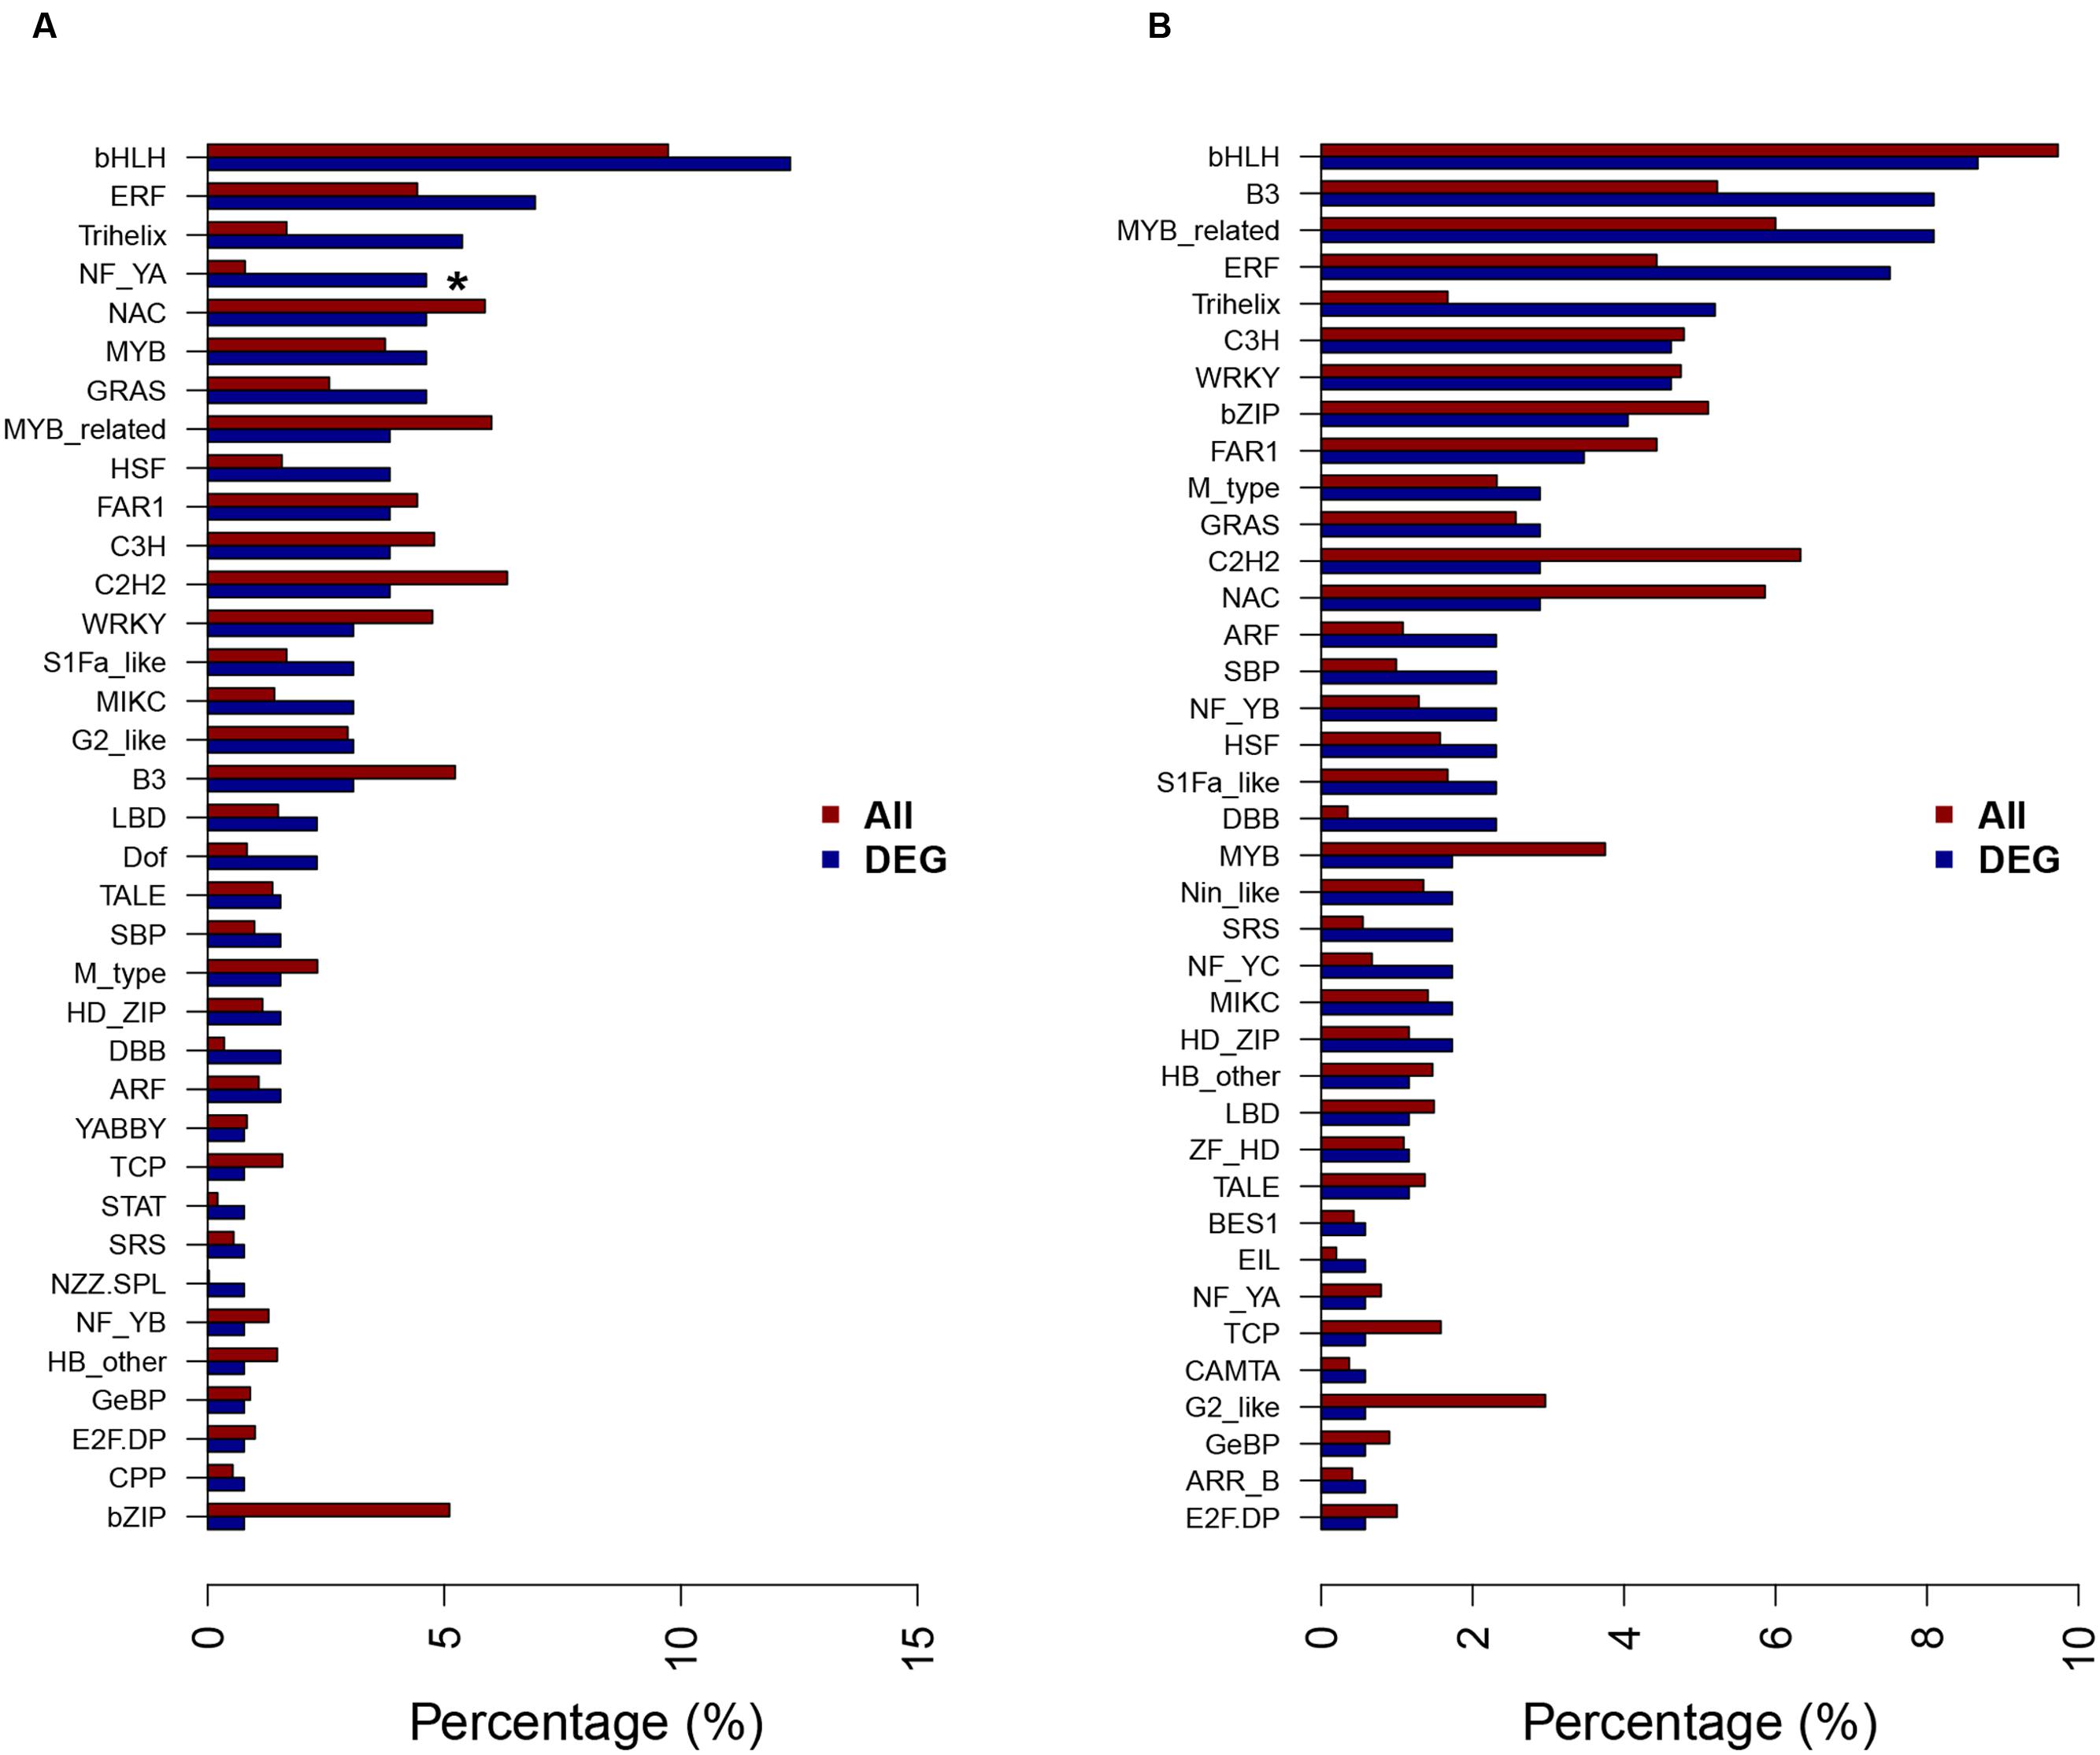
FIGURE 6. Transcription factor families of the DEGs at 12 h (A) and 24 h (B) of NaHCO3 treatment. A total of 130 and 173 transcription factors (TFs) were differentially expressed at 12 and 24 h after 90 mM NaHCO3 (pH 8.5) stress, respectively, and the percentages of TF families in DEGs and all genes in soybean genome were shown as blue bars and red bars, respectively. ∗Significantly enriched TF family identified by hypergeometric Fisher exact test (P < 0.01) and Benjamini and Hochberg method (FDR < 0.05).
DEGs Related to Ion Transport
ABC transporter (Lee et al., 2004; Henderson et al., 2014), ALMT family (Barbier-Brygoo et al., 2011; Henderson et al., 2014), glutamate receptor (GLR) (Demidchik et al., 2002), nitrate transporter (NRT)/proton dependent oligopeptide (POT) family (Li et al., 2010; Barbier-Brygoo et al., 2011; Chen et al., 2012), and S-type anion channel (SLAH) (Negi et al., 2008; Barbier-Brygoo et al., 2011) have been reported to play roles in ion transport, which indicates their importance in maintaining ion homeostasis in plant response to NaHCO3 stress. Nine transporter genes were differentially expressed at 12 h after NaHCO3 stress (Table 1). At 24 h after NaHCO3 treatment, the up-regulated genes were enriched in transport related genes as shown by GO enrichment analysis (Figure 4B). Twenty-four transporter genes were up-regulated and three transporter genes were down-regulated at 24 h after NaHCO3 stress (Table 1), including the genes encoding ABC transporter, ALMT, ammonium transporter, aquaporin transporter, cation efflux family, GLR, NRT/POT family, SLAH, sulfate transporter, and zinc/iron transporter. Our results indicate the importance of these transporter genes in maintaining ion homeostasis in soybean response to NaHCO3 stress.
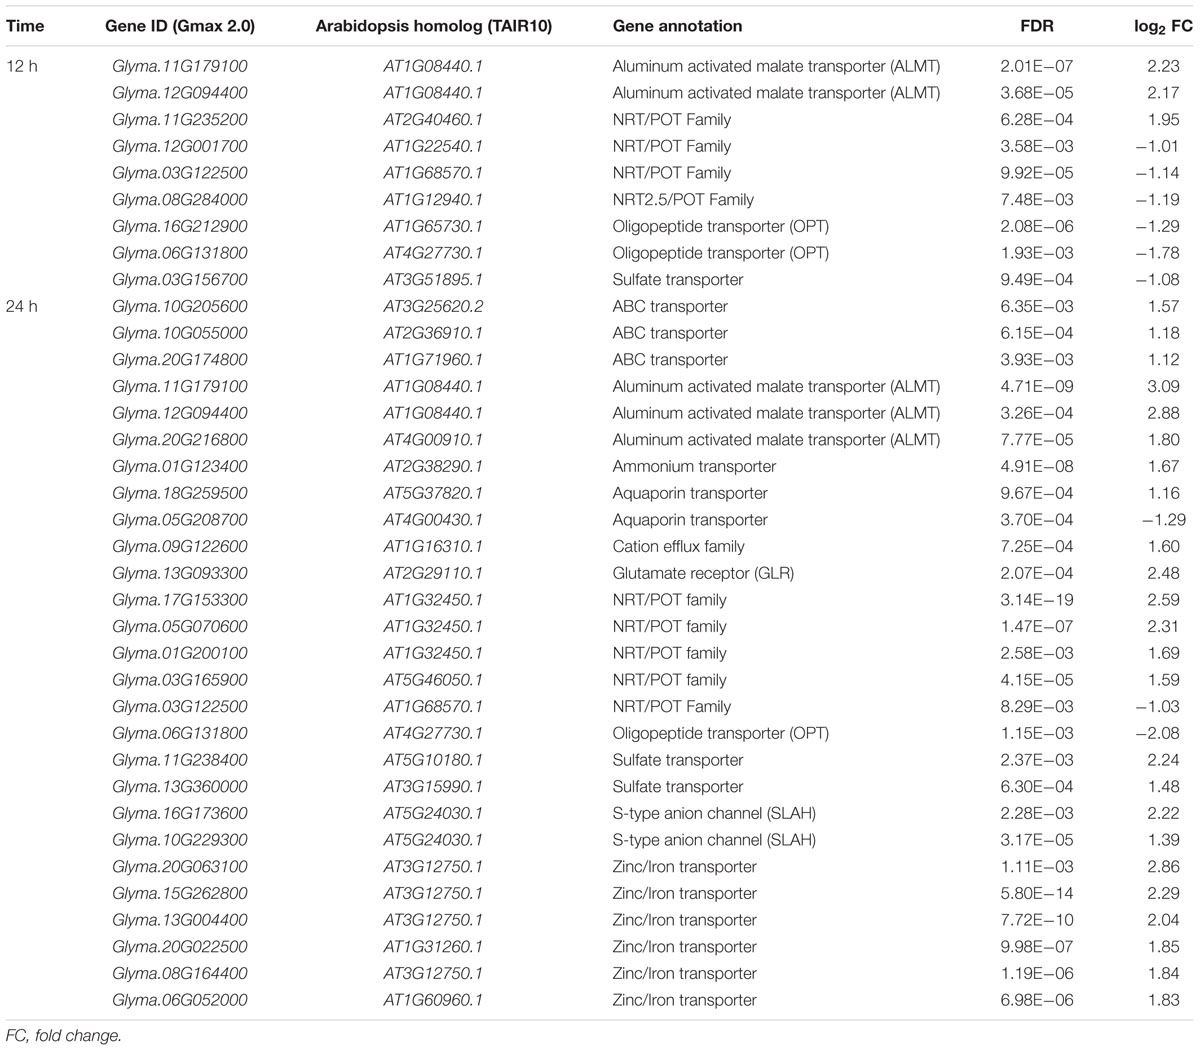
TABLE 1. Transport related differentially expressed genes between NaHCO3 treatment and control in the roots of wild soybean N24852.
Discussion
The alkalinity-tolerant wild soybean variety N24852 showed lower Na+ concentration, and lower ratios of Na+/K+ and Na+/Ca2+ in leaves and roots under NaHCO3 stress in this study. This was similar to the previously reported salt tolerance phenotype of G. max (Tuyen et al., 2016), Brassica napus line N119 (Yong et al., 2014), Oryza sativa line FL478 (Walia et al., 2005), and Foxtail millet cv. Prasad (Puranik et al., 2011), all of which maintained lower Na+ concentrations, and ratios of Na+/K+ and Na+/Ca2+ compared with sensitive lines. For RNA sequencing, we used clean quartz as the cultivation medium to mimic the alkalinity in fields, and set up controls at each time point to identify DEGs between NaHCO3 stress and control, avoiding interference from the development-related DEGs.
Gene Ontology enrichment analyses of the DEGs showed that different GO terms were enriched for different time points. For example, genes with transcription factor activity (GO: 0003700) were significantly enriched in up-regulated genes at 12 h of alkaline stress (Figure 4A), while genes with transporter activity (GO: 0005215) were significantly enriched in up-regulated genes at 24 h of alkaline stress (Figure 4B). Transcription factors play important roles in plant response to abiotic stresses. NF-YA transcription factors were enriched at 12 h after NaHCO3 stress in this study (Figure 6). AtNF-YA1 plays a role in regulating post-germination growth arrest under salt stress in Arabidopsis (Li et al., 2013). In addition, high percentages of bHLH, ERF, Trihelix, and zinc finger (C2H2, C3H) transcription factors were found at both 12 and 24 h after alkaline stress in our result (Figure 6). A great percentage of bHLH transcription factor family has been found in the transcriptome profiles of wild soybean roots (Ge et al., 2010) and leaves (Ge et al., 2011) under NaHCO3 treatment, and was enriched in the transcriptome of oilseed rape roots and leaves under NaCl treatment (Yong et al., 2014). AP2/ERF transcription factors have been shown to play roles in plant response to abiotic stress (Mizoi et al., 2012; Dey and Vlot, 2015) including salt stress (Wang L.Q. et al., 2015), and overexpression of ERF1 in Arabidopsis thaliana enhanced plant tolerance to salt stress (Cheng et al., 2013). C2H2 zinc finger proteins are important components in regulation of plant tolerance to biotic and abiotic stresses (Kielbowicz-Matuk, 2012). Over-expression of a zinc finger protein gene IbZFP1 from sweet potato increased salt and drought tolerance in transgenic Arabidopsis (Wang F. et al., 2015).
ABC transporters might play roles in Na+ and K+ homeostasis in Arabidopsis and Cl- transport in grapevine (Lee et al., 2004; Henderson et al., 2014). Three ABC transporter genes were up-regulated at 24 h after NaHCO3 stress in this study (Table 1), suggesting their possible roles in mediating ion homeostasis of wild soybean under alkaline stress conditions. Among the nine up-regulated DEGs overlapped between the two time points, there are two ALMT genes. The ALMT gene family not only chelates aluminum in the plant rhizosphere, but also has multiple roles in plant adaptation to abiotic stress such as transport of anions involved in mineral nutrition and ion homeostasis processes (Henderson et al., 2014). Three ALMT1 homolog genes changed expression levels in grapevine roots under 50 mM Cl- conditions (Henderson et al., 2014). A gene (Glyma.13G093300) encoding GLR was up-regulated at 24 h after NaHCO3 stress (Table 1). GLR was predicted to have permeability to Na+ and K+, and regulated by Ca2+ (Demidchik et al., 2002). Four and five NRT/POT genes were differentially expressed at 12 and 24 h of NaHCO3 stress, respectively (Table 1). The NRT/POT family is involved in uptake of nitrate and various peptides (Tsay et al., 2007). AtNRT1.8 was up-regulated while AtNRT1.5 was down-regulated by salt and cadmium stress in Arabidopsis roots (Li et al., 2010; Chen et al., 2012). Two SLAH genes were up-regulated at 24 h of NaHCO3 stress, which encode the SLAHs and might be involved in the transmembrane transfer of anions (Barbier-Brygoo et al., 2011). The guard-cell-specific expression of SLAC1/SLAH3 resulted in the dissipation of the over-accumulated osmoregulatory anions in the Arabidopsis slac1 mutant (Negi et al., 2008).
KEGG enrichment analysis of DEGs showed “phenylpropanoid biosynthesis” and “phenylalanine metabolism” pathways were enriched at 24 h after NaHCO3 treatment (Supplementary Figures S7 and S8). A previous study using the Affymetrix® Soybean Genome Array (Ge et al., 2010) indicated that genes participating in the “phenylpropanoid biosynthesis” pathway were significantly up-regulated in wild soybean roots under NaHCO3 stress. Transcriptomes of maize roots under Na2CO3 treatment (Zhang L.M. et al., 2013), oilseed rape roots under NaCl treatment (Yong et al., 2014), and bermudagrass roots under NaCl treatment (Hu et al., 2015) also showed an enrichment in the “phenylpropanoid biosynthesis” pathway. These results suggest “phenylpropanoid biosynthesis” pathway might play an important role in plant response to alkalinity and salinity. The DEGs involved in both “phenylpropanoid biosynthesis” and “phenylalanine metabolism” pathways in this study were POD genes, including three up-regulated (Glyma.07G209900, Glyma.17G053000, Glyma.20G169200) and one down-regulated (Glyma.02G171600). DuanMu et al. (2015) showed that two POD genes were differentially expressed in wild soybean roots treated with NaHCO3. As one of the important antioxidant enzymes, PODs could protect plants from oxidative damage by scavenging of ROS. Activities of POD in salt-tolerant species Beta maritima were higher than salt-sensitive relative Beta vulgaris at 150 and 500 mM NaCl stress (Chen et al., 2009). “Phenylpropanoid biosynthesis” pathway showed that POD also have an important role in lignin synthesis. Lignin is a phenylpropanoid compound derived from phenylalanine. Lignin and suberin could deposit in the primary cell wall and form into the Casparian strip in vascular plant roots, which appears as a tight barrier that reduces non-selective apoplastic transport of toxic solutes into the stelar tissues under alkaline-salt conditions (Chen et al., 2011).
Recently, great progress has been made on soybean tolerance to salinity. Several independent studies consistently verified a major quantitative trait locus (QTL) on Chromosome 3 for soybean tolerance to NaCl stress (Chen et al., 2008; Hamwieh and Xu, 2008; Hamwieh et al., 2011; Ha et al., 2013). A cation/H+ exchanger family gene, GmCHX1/GmSALT3/Ncl/ (Glyma03g32900), was identified in this genomic region, which regulated Na+, K+, and Cl- homeostasis in the shoot of soybean under NaCl stress, and the functional allele of this gene could improve soybean salt tolerance and yield under salinity stress (Guan et al., 2014; Qi et al., 2014; Tuyen et al., 2016). Guan et al. (2014) identified two salt-tolerant haplotypes and seven salt-sensitive haplotypes in GmCHX1 by analyzing the SNP variation among 172 soybean accessions. Patil et al. (2016) identified three major structural variants and several SNPs in GmCHX1 based on the re-sequencing (15X) of 129 soybean accessions.
The transcript abundance of GmCHX1/GmSALT3/Ncl/Glyma03g32900 increased after NaCl treatment in salt-tolerant soybean lines (Guan et al., 2014; Qi et al., 2014). In the new version of soybean genome reference sequence (Williams 82. a2.v1), Glyma03g32900 was assembled into two genes/transcript models, including Glyma.03G171600 and Glyma.03g171700 (Patil et al., 2016). In this study, these two genes/transcripts were not detected as a DEG at 12 or 24 h after 90 mM NaHCO3 treatment. And the published alkalinity-tolerance QTL were mapped on Chromosome 17 (Tuyen et al., 2010, 2013), which did not overlap with the major salt tolerance QTL on Chromosome 3 (Guan et al., 2014; Qi et al., 2014; Tuyen et al., 2016). These comparisons suggest that there might be different genes controlling soybean tolerance to alkalinity or salinity. The 68 candidate genes within the alkalinity-tolerance QTL on Chromosome 17 (Tuyen et al., 2013) were not detected as DEGs in this study, which might be due to different genes controlling alkalinity-tolerance in different soybean varieties (JWS156-1 for published QTL mapping study and N24852 for RNA-seq in this study). We did observe lower Na+ concentration, lower ratios of Na+/K+ and Na+/Ca2+ in both roots and leaves of the wild soybean variety N24852 under NaHCO3 stress (Figure 1), indicating that the alkalinity tolerance is primarily due to Na+ exclusion from the roots, which leads to less Na+ transport into the aerial part. In our analysis, genes related to ion transporters were enriched in NaHCO3 stress-responsive genes, which might play a role to maintain ion homeostasis of wild soybean (N24852) under alkalinity. Further studies, such as co-localization of alkalinity tolerance QTL with alkalinity-responsive genes using the same soybean tolerant variety, and functional study of candidate alkalinity-tolerance genes, would help to elucidate the genes and mechanisms underlying alkalinity tolerance.
On the other hand, under alkaline stress or salt stresses, plants encounter both ionic and osmotic stresses. Therefore, there might be some overlapped responsive genes between alkaline and salt stress, as well as other stresses. We compared the expression patterns of the alkalinity-responsive genes encoding NF-YA transcription factors and transporters in this study (Supplementary Table S8) with the published RNA-seq data in soybean under salt (Belamkar et al., 2014), drought (Belamkar et al., 2014; Chen et al., 2016), flooding (Chen et al., 2016), potassium deficiency (Wang et al., 2012), and shade stresses (Gong et al., 2014). Among these 39 alkalinity-responsive genes, there are 20, 16, 8, 9, and 8 genes were also detected as DEGs in soybean response to salt, drought, flooding, potassium deficiency, and shade, respectively. Therefore, some NF-YA transcription factors and transporters are involved in soybean response to general abiotic stresses mentioned above. More comprehensive analyses such as genome-wide comparisons of DEGs and GO and KEGG pathway enrichment could provide the overall picture of common and specific genes/pathways/mechanisms in soybean responses to different stresses, which would be a great study to follow in the future.
Conclusion
In this study, an alkalinity-tolerant wild soybean variety N24852 was identified, which showed low Na+ concentration in both leaves and roots under NaHCO3 (pH = 8.5) stress. Nine genes (including two ALMT genes and one LEA gene) were up-regulated at both 12 and 24 h of NaHCO3 (pH = 8.5) treatment. NF-YA transcription factors were enriched in the up-regulated genes at 12 h after NaHCO3 stress, while genes related to ion transporters such as ABC transporter, ALMT, GLR, NRT/POT family, and SLAH were enriched in up-regulated genes at 24 h after NaHCO3 stress. “phenylpropanoid biosynthesis” and “phenylalanine metabolism” pathways were enriched at 24 h after NaHCO3 treatment. This study provides a list of NaHCO3 stress-responsive genes to help us further understanding plant response to alkaline stress.
Author Contributions
JZ and YL conceived and designed the experiments. JZ, JW, and WJ performed the experiments. JZ, JW, WJ, JL, SY, and YL analyzed the data. JG and YL contributed reagents/materials and interpretation of the results. JZ and YL wrote and revised the manuscript. All authors read, revised and approved the final manuscript.
Funding
This work was supported by the National High-tech R & D Program of China (grant number 2013AA102602), the National Natural Science Foundation of China (31371645), the Fundamental Research Funds for the Central Universities, the Program for Changjiang Scholars and Innovative Research Team in University (grant number PCSIRT13073), the MOE 111 Project (grant number B08025), the Program for MOA Innovative Research Team, the Program for High-level Innovative and Entrepreneurial Talents in Jiangsu Province, and the Jiangsu Higher Education PAPD Program.
Conflict of Interest Statement
The authors declare that the research was conducted in the absence of any commercial or financial relationships that could be construed as a potential conflict of interest.
Acknowledgments
The authors thank Professor Robert A. McIntosh, University of Sydney for his critical reviewing of the manuscript, and thank Genepioneer Biotechnologies (Nanjing, China) for the assistance in analysis of RNA-seq data.
Supplementary Material
The Supplementary Material for this article can be found online at: http://journal.frontiersin.org/article/10.3389/fpls.2016.01842/full#supplementary-material
Footnotes
- ^ http://phytozome.jgi.doe.gov/pz/portal.html
- ^ http://www.ncbi.nlm.nih.gov/COG
- ^ http://www.ncbi.nlm.nih.gov/tools/primer-blast/index.cgi?LINK_LOC=BlastHome
References
Abel, G. H., and Mackenzie, A. J. (1964). Salt tolerance of soybean varieties (Glycine max L. Merrill) during germination and later growth. Crop Sci. 4, 157–161. doi: 10.2135/cropsci1964.0011183X000400020010x
Altschul, S., Madden, T. L., Schaffer, A. A., Zhang, J., Zhang, Z., Miller, W., et al. (1999). Gapped BLAST and PSI-BLAST: a new generation of protein database search programs. Nucleic Acids Res. 1997, 3389–3402.
Anders, S., and Huber, W. (2010). Differential expression analysis for sequence count data. Genome Biol. 11:R106. doi: 10.1186/Gb-2010-11-10-R106
Apweiler, R., Bairoch, A., Wu, C. H., Barker, W. C., Boeckmann, B., Ferro, S., et al. (2004). UniProt: the universal protein knowledgebase. Nucleic Acids Res. 32, D115–D119. doi: 10.1093/nar/gkh131
Barbier-Brygoo, H., De Angeli, A., Filleur, S., Frachisse, J.-M., Gambale, F., Thomine, S., et al. (2011). Anion channels/transporters in Plants: from molecular bases to regulatory networks. Annu. Rev. Plant Biol. 62, 25–51. doi: 10.1146/annurev-arplant-042110-103741
Battaglia, M., and Covarrubias, A. A. (2013). Late embryogenesis abundant (LEA) proteins in legumes. Front. Plant Sci. 4:190. doi: 10.3389/Fpls.2013.00190
Belamkar, V., Weeks, N. T., Bharti, A. K., Farmer, A. D., Graham, M. A., and Cannon, S. B. (2014). Comprehensive characterization and RNA-Seq profiling of the HD-Zip transcription factor family in soybean (Glycine max) during dehydration and salt stress. BMC Genomics 15:950. doi: 10.1186/1471-2164-15-950
Carter, T. E., Nelson, R. L., Sneller, C. H., and Cui, Z. (2004). Soybeans: Improvement, Production, and Uses: Agronomy Monograph, 3rd Edn. Madison, WI: American Society of Agronomy, Crop Science Society of America, Soil Science Society of America.
Chen, C. Z., Lv, X. F., Li, J. Y., Yi, H. Y., and Gong, J. M. (2012). Arabidopsis NRT1.5 is another essential component in the regulation of nitrate reallocation and stress tolerance. Plant Physiol. 159, 1582–1590. doi: 10.1104/pp.112.199257
Chen, H. T., Cui, S. Y., Fu, S. X., Gai, J. Y., and Yu, D. Y. (2008). Identification of quantitative trait loci associated with salt tolerance during seedling growth in soybean (Glycine max L.). Aust. J. Agric. Res. 59, 1086–1091. doi: 10.1071/AR08104
Chen, T., Cai, X., Wu, X., Karahara, I., Schreiber, L., and Lin, J. (2011). Casparian strip development and its potential function in salt tolerance. Plant Signal. Behav. 6, 1499–1502. doi: 10.4161/psb.6.10.17054
Chen, W., Yao, Q., Patil, G. B., Agarwal, G., Deshmukh, R. K., Lin, L., et al. (2016). Identification and comparative analysis of differential gene expression in soybean leaf tissue under drought and flooding stress revealed by RNA-Seq. Front. Plant Sci. 7:1044. doi: 10.3389/fpls.2016.01044
Chen, W. C., Cui, P. J., Sun, H. Y., Guo, W. Q., Yang, C. W., Jin, H., et al. (2009). Comparative effects of salt and alkali stresses on organic acid accumulation and ionic balance of seabuckthorn (Hippophae rhamnoides L.). Ind. Crops Prod. 30, 351–358. doi: 10.1016/j.indcrop.2009.06.007
Cheng, M. C., Liao, P. M., Kuo, W. W., and Lin, T. P. (2013). The Arabidopsis EthyleneResponse Factor1 regulates abiotic stress-responsive gene expression by binding to different cis-acting elements in response to different stress signals. Plant Physiol. 162, 1566–1582. doi: 10.1104/pp.113.221911
Demidchik, V., Davenport, R. J., and Tester, M. (2002). Nonselective cation channels in plants. Annu. Rev. Plant Biol. 53, 67–107. doi: 10.1146/annurev.arplant.53.091901.161540
Dey, S., and Vlot, A. C. (2015). Ethylene responsive factors in the orchestration of stress responses in monocotyledonous plants. Front. Plant Sci. 6:640. doi: 10.3389/Fpls.2015.00640
Du, Z., Zhou, X., Ling, Y., Zhang, Z. H., and Su, Z. (2010). agriGO: a GO analysis toolkit for the agricultural community. Nucleic Acids Res. 38, W64–W70. doi: 10.1093/nar/gkq310
DuanMu, H., Wang, Y., Bai, X., Cheng, S., Deyholos, M. K., Wong, G. K., et al. (2015). Wild soybean roots depend on specific transcription factors and oxidation reduction related genesin response to alkaline stress. Funct. Integr. Genomics 15, 651–660. doi: 10.1007/s10142-015-0439-y
Fan, X. D., Wang, J. Q., Yang, N., Dong, Y. Y., Liu, L., Wang, F. W., et al. (2013). Gene expression profiling of soybean leaves and roots under salt, saline-alkali and drought stress by high-throughput Illumina sequencing. Gene 512, 392–402. doi: 10.1016/j.gene.2012.09.100
FAO (2000). Extent and Causes of Salt Affected Soils in Participating Countries. Available at: http://www.fao.org/ag/agl/agll/spush/topic2.htm
Finn, R. D., Bateman, A., Clements, J., Coggill, P., Eberhardt, R. Y., Eddy, S. R., et al. (2014). Pfam: the protein families database. Nucleic Acids Res. 42, D222–D230. doi: 10.1093/nar/gkt1223
Gaxiola, R. A., Li, J. S., Undurraga, S., Dang, L. M., Allen, G. J., Alper, S. L., et al. (2001). Drought- and salt-tolerant plants result from overexpression of the AVP1 H+-pump. Proc. Natl. Acad. Sci. U.S.A. 98, 11444–11449. doi: 10.1073/pnas.191389398
Gaxiola, R. A., Rao, R., Sherman, A., Grisafi, P., Alper, S. L., and Fink, G. R. (1999). The Arabidopsis thaliana proton transporters, AtNhx1 and Avp1, can function in cation detoxification in yeast. Proc. Natl. Acad. Sci. U.S.A. 96, 1480–1485. doi: 10.1073/pnas.96.4.1480
Ge, Y., Li, Y., Lv, D. K., Bai, X., Ji, W., Cai, H., et al. (2011). Alkaline-stress response in Glycine soja leaf identifies specific transcription factors and ABA-mediated signaling factors. Funct. Integr. Genomics 11, 369–379. doi: 10.1007/s10142-010-0191-2
Ge, Y., Li, Y., Zhu, Y. M., Bai, X., Lv, D. K., Guo, D., et al. (2010). Global transcriptome profiling of wild soybean (Glycine soja) roots under NaHCO3 treatment. BMC Plant Biol. 10:153. doi: 10.1186/1471-2229-10-153
Gill, S. S., and Tuteja, N. (2010). Reactive oxygen species and antioxidant machinery in abiotic stress tolerance in crop plants. Plant Physiol. Biochem. 48, 909–930. doi: 10.1016/j.plaphy.2010.08.016
Gong, W., Qi, P., Du, J., Sun, X., Wu, X., Song, C., et al. (2014). Transcriptome analysis of shade-induced inhibition on leaf size in relay intercropped soybean. PLoS ONE 9:e98465. doi: 10.1371/journal.pone.0098465
Goodstein, D. M., Shu, S. Q., Howson, R., Neupane, R., Hayes, R. D., Fazo, J., et al. (2012). Phytozome: a comparative platform for green plant genomics. Nucleic Acids Res. 40, D1178–D1186. doi: 10.1093/nar/gkr944
Guan, R., Qu, Y., Guo, Y., Yu, L., Liu, Y., Jiang, J., et al. (2014). Salinity tolerance in soybean is modulated by natural variation in GmSALT3. Plant J. 80, 937–950. doi: 10.1111/tpj.12695
Ha, B. K., Vuong, T. D., Velusamy, V., Nguyen, H. T., Shannon, J. G., and Lee, J. D. (2013). Genetic mapping of quantitative trait loci conditioning salt tolerance in wild soybean (Glycine soja) PI 483463. Euphytica 193, 79–88. doi: 10.1007/s10681-013-0944-9
Hamwieh, A., Tuyen, D. D., Cong, H., Benitez, E. R., Takahashi, R., and Xu, D. H. (2011). Identification and validation of a major QTL for salt tolerance in soybean. Euphytica 179, 451–459. doi: 10.1007/s10681-011-0347-8
Hamwieh, A., and Xu, D. H. (2008). Conserved salt tolerance quantitative trait locus (QTL) in wild and cultivated soybeans. Breed. Sci. 58, 355–359. doi: 10.1270/Jsbbs.58.355
Henderson, S. W., Baumann, U., Blackmore, D. H., Walker, A. R., Walker, R. R., and Gilliham, M. (2014). Shoot chloride exclusion and salt tolerance in grapevine is associated with differential ion transporter expression in roots. BMC Plant Biol. 14:273. doi: 10.1186/S12870-014-0273-8
Hu, L., Li, H., Chen, L., Lou, Y., Amombo, E., and Fu, J. (2015). RNA-seq for gene identification and transcript profiling in relation to root growth of bermudagrass (Cynodon dactylon) under salinity stress. BMC Genomics 16:575. doi: 10.1186/s12864-015-1799-3
Hu, R., Fan, C., Li, H., Zhang, Q., and Fu, Y. F. (2009). Evaluation of putative reference genes for gene expression normalization in soybean by quantitative real-time RT-PCR. BMC Mol. Biol. 10:93. doi: 10.1186/1471-2199-10-93
Hyten, D. L., Song, Q. J., Zhu, Y. L., Choi, I. Y., Nelson, R. L., Costa, J. M., et al. (2006). Impacts of genetic bottlenecks on soybean genome diversity. Proc. Natl. Acad. Sci. U.S.A. 103, 16666–16671. doi: 10.1073/pnas.0604379103
Jin, J., Zhang, H., Kong, L., Gao, G., and Luo, J. (2014). PlantTFDB 3.0: a portal for the functional and evolutionary study of plant transcription factors. Nucleic Acids Res. 42, D1182–D1187. doi: 10.1093/nar/gkt1016
Johnson, L. S., Eddy, S. R., and Portugaly, E. (2010). Hidden Markov model speed heuristic and iterative HMM search procedure. BMC Bioinformatics 11:431. doi: 10.1186/1471-2105-11-431
Kanehisa, M., Goto, S., Kawashima, S., Okuno, Y., and Hattori, M. (2004). The KEGG resource for deciphering the genome. Nucleic Acids Res. 32, D277–D280. doi: 10.1093/nar/gkh063
Kielbowicz-Matuk, A. (2012). Involvement of plant C(2)H(2)-type zinc finger transcription factors in stress responses. Plant Sci. 18, 78–85. doi: 10.1016/j.plantsci.2011.11.015
Kim, D., Pertea, G., Trapnell, C., Pimentel, H., Kelley, R., and Salzberg, S. L. (2013). TopHat2: accurate alignment of transcriptomes in the presence of insertions, deletions and gene fusions. Genome Biol. 14:R36. doi: 10.1186/Gb-2013-14-4-R36
Kim, M. Y., Lee, S., Van, K., Kim, T. H., Jeong, S. C., Choi, I. Y., et al. (2010). Whole-genome sequencing and intensive analysis of the undomesticated soybean (Glycine soja Sieb. and Zucc.) genome. Proc. Natl. Acad. Sci. U.S.A. 107, 22032–22037. doi: 10.1073/pnas.1009526107
Koonin, E. V., Fedorova, N. D., Jackson, J. D., Jacobs, A. R., Krylov, D. M., Makarova, K. S., et al. (2004). A comprehensive evolutionary classification of proteins encoded in complete eukaryotic genomes. Genome Biol. 5:R7. doi: 10.1186/Gb-2004-5-2-R7
Korir, P. C., Zhang, J., Wu, K., Zhao, T., and Gai, J. (2013). Association mapping combined with linkage analysis for aluminum tolerance among soybean cultivars released in Yellow and Changjiang River Valleys in China. Theor. Appl. Genet. 126, 1659–1675. doi: 10.1007/s00122-013-2082-0
Kosova, K., Vitamvas, P., and Prasil, I. T. (2014). Wheat and barley dehydrins under cold, drought, and salinity - what can LEA-II proteins tell us about plant stress response? Front. Plant Sci. 5:343. doi: 10.3389/Fpls.2014.00343
Krishnamurthy, P., Lee, J. D., Ha, B. K., Chae, J. H., Song, J. T., Tsukamoto, C., et al. (2015). Genetic characterization of group A acetylsaponin-deficient mutants from wild soybean (Glycine soja Sieb. and Zucc.). Plant Breed. 134, 316–321. doi: 10.1111/pbr.12269
Lam, H. M., Xu, X., Liu, X., Chen, W. B., Yang, G. H., Wong, F. L., et al. (2010). Resequencing of 31 wild and cultivated soybean genomes identifies patterns of genetic diversity and selection. Nat. Genet. 42, 1053–1059. doi: 10.1038/ng.715
Lee, E. K., Kwon, M., Ko, J. H., Yi, H., Hwang, M. G., Chang, S., et al. (2004). Binding of sulfonylurea by AtMRP5, an Arabidopsis multidrug resistance-related protein that functions in salt tolerance. Plant Physiol. 134, 528–538. doi: 10.1104/pp.103.027045
Li, J. Y., Fu, Y. L., Pike, S. M., Bao, J., Tian, W., Zhang, Y., et al. (2010). The Arabidopsis nitrate transporter NRT1.8 functions in nitrate removal from the xylem sap and mediates cadmium tolerance. Plant Cell 22, 1633–1646. doi: 10.1105/tpc.110.075242
Li, Y. H., Zhou, G., Ma, J., Jiang, W., Jin, L. G., Zhang, Z., et al. (2014). De novo assembly of soybean wild relatives for pan-genome analysis of diversity and agronomic traits. Nat. Biotechnol. 32, 1045–1052. doi: 10.1038/nbt.2979
Li, Y. J., Fang, Y., Fu, Y. R., Huang, J. G., Wu, C. A., and Zheng, C. C. (2013). NFYA1 is involved in regulation of postgermination growth arrest under salt stress in Arabidopsis. PLoS ONE 8:e61289. doi: 10.1371/journal.pone.0061289
Livak, K. J., and Schmittgen, T. D. (2001). Analysis of relative gene expression data using real-time quantitative PCR and the 2(T)(-Delta Delta C) method. Methods 25, 402–408. doi: 10.1006/meth.2001.1262
Miller, G., Shulaev, V., and Mittler, R. (2008). Reactive oxygen signaling and abiotic stress. Physiol. Plant. 133, 481–489. doi: 10.1111/j.1399-3054.2008.01090.x
Mizoi, J., Shinozaki, K., and Yamaguchi-Shinozaki, K. (2012). AP2/ERF family transcription factors in plant abiotic stress responses. Biochim. Biophys. Acta 1819, 86–96. doi: 10.1016/j.bbagrm.2011.08.004
Munns, R. (2005). Genes and salt tolerance: bringing them together. New Phytol. 167, 645–663. doi: 10.1111/j.1469-8137.2005.01487.x
Munns, R., and Tester, M. (2008). Mechanisms of salinity tolerance. Annu. Rev. Plant Biol. 59, 651–681. doi: 10.1146/annurev.arplant.59.032607.092911
Munns, R., Wallace, P. A., Teakle, N. L., and Colmer, T. D. (2010). Measuring soluble ion concentrations (Na(+), K(+), Cl(-)) in salt-treated plants. Methods Mol. Biol. 639, 371–382. doi: 10.1007/978-1-60761-702-0_23
Negi, J., Matsuda, O., Nagasawa, T., Oba, Y., Takahashi, H., Kawai-Yamada, M., et al. (2008). CO2 regulator SLAC1 and its homologues are essential for anion homeostasis in plant cells. Nature 452, 483–486. doi: 10.1038/nature06720
Pardo, J. M., Cubero, B., Leidi, E. O., and Quintero, F. J. (2006). Alkali cation exchangers: roles in cellular homeostasis and stress tolerance. J. Exp. Bot. 57, 1181–1199. doi: 10.1093/jxb/erj114
Patil, G., Do, T., Vuong, T. D., Valliyodan, B., Lee, J. D., Chaudhary, J., et al. (2016). Genomic-assisted haplotype analysis and the development of high-throughput SNP markers for salinity tolerance in soybean. Sci. Rep. 6:19199. doi: 10.1038/srep19199
Peiffer, G. A., King, K. E., Severin, A. J., May, G. D., Cianzio, S. R., Lin, S. F., et al. (2012). Identification of candidate genes underlying an iron efficiency quantitative trait locus in soybean. Plant Physiol. 158, 1745–1754. doi: 10.1104/pp.111.189860
Puranik, S., Jha, S., Srivastava, P. S., Sreenivasulu, N., and Prasad, M. (2011). Comparative transcriptome analysis of contrasting foxtail millet cultivars in response to short-term salinity stress. J. Plant Physiol. 168, 280–287. doi: 10.1016/j.jplph.2010.07.005
Qi, X., Li, M. W., Xie, M., Liu, X., Ni, M., Shao, G., et al. (2014). Identification of a novel salt tolerance gene in wild soybean by whole-genome sequencing. Nat. Commun. 5:4340. doi: 10.1038/ncomms5340
Schmutz, J., Cannon, S. B., Schlueter, J., Ma, J., Mitros, T., Nelson, W., et al. (2010). Genome sequence of the palaeopolyploid soybean. Nature 463, 178–183. doi: 10.1038/nature08670
Serrano, R., and Rodriguez-Navarro, A. (2001). Ion homeostasis during salt stress in plants. Curr. Opin. Cell Biol. 13, 399–404. doi: 10.1016/S0955-0674(00)00227-1
Tatusov, R. L., Galperin, M. Y., Natale, D. A., and Koonin, E. V. (2000). The COG database: a tool for genome-scale analysis of protein functions and evolution. Nucleic Acids Res. 28, 33–36. doi: 10.1093/Nar/28.1.33
Trapnell, C., Williams, B. A., Pertea, G., Mortazavi, A., Kwan, G., van Baren, M. J., et al. (2010). Transcript assembly and quantification by RNA-Seq reveals unannotated transcripts and isoform switching during cell differentiation. Nat. Biotechnol. 28, 511–515. doi: 10.1038/nbt.1621
Tsay, Y. F., Chiu, C. C., Tsai, C. B., Ho, C. H., and Hsu, P. K. (2007). Nitrate transporters and peptide transporters. FEBS Lett. 581, 2290–2300. doi: 10.1016/j.febslet.2007.04.047
Tuyen, D. D., Chen, H. T., Vu, H. T. T., Hamwieh, A., Yamada, T., Sato, T., et al. (2016). Ncl synchronously regulates Na+, K+, and Cl- in soybean and greatly increases the grain yield in saline field conditions. Sci. Rep. 6:19147. doi: 10.1038/srep19147
Tuyen, D. D., Lal, S. K., and Xu, D. H. (2010). Identification of a major QTL allele from wild soybean (Glycine soja Sieb. & Zucc.) for increasing alkaline salt tolerance in soybean. Theor. Appl. Genet. 121, 229–236. doi: 10.1007/s00122-010-1304-y
Tuyen, D. D., Zhang, H. M., and Xu, D. H. (2013). Validation and high-resolution mapping of a major quantitative trait locus for alkaline salt tolerance in soybean using residual heterozygous line. Mol. Breed. 31, 79–86. doi: 10.1007/s11032-012-9771-2
Walia, H., Wilson, C., Condamine, P., Liu, X., Ismail, A. M., Zeng, L. H., et al. (2005). Comparative transcriptional profiling of two contrasting rice genotypes under salinity stress during the vegetative growth stage. Plant Physiol. 139, 822–835. doi: 10.1104/pp.105.065961
Wang, C., Chen, H., Hao, Q., Sha, A., Shan, Z., Chen, L., et al. (2012). Transcript profile of the response of two soybean genotypes to potassium deficiency. PLoS ONE 7:e39856. doi: 10.1371/journal.pone.0039856
Wang, F., Tong, W., Zhu, H., Kong, W., Peng, R., Liu, Q., et al. (2015). A novel Cys/His zinc finger protein gene from sweetpotato, IbZFP1, is involved in salt and drought tolerance in transgenic Arabidopsis. Planta 243, 783–797. doi: 10.1007/s00425-015-2443-9
Wang, L. Q., Wang, C., Qin, L. P., Liu, W. J., and Wang, Y. C. (2015). ThERF1 regulates its target genes via binding to a novel cis-acting element in response to salt stress. J. Integr. Plant Biol. 57, 838–847. doi: 10.1111/jipb.12335
Wang, W. B., He, Q. Y., Yang, H. Y., Xiang, S. H., Zhao, T. J., and Gai, J. Y. (2013). Development of a chromosome segment substitution line population with wild soybean (Glycine soja Sieb. et Zucc.) as donor parent. Euphytica 189, 293–307. doi: 10.1007/s10681-012-0817-7
Warnes, G. R. (2016). gplots: Various R Programming Tools for Plotting Data. Available at: https://cran.r-project.org/web/packages/gplots/.
Xu, D., and Tuyen do, D. (2012). Genetic studies on saline and sodic tolerances in soybean. Breed. Sci. 61, 559–565. doi: 10.1270/jsbbs.61.559
Xu, D. H., and Gai, J. Y. (2003). Genetic diversity of wild and cultivated soybeans growing in China revealed by RAPD analysis. Plant Breed. 122, 503–506. doi: 10.1046/j.0179-9541.2003.00911.x
Yang, C. W., Xu, H. H., Wang, L. L., Liu, J., Shi, D. C., and Wang, D. L. (2009). Comparative effects of salt-stress and alkali-stress on the growth, photosynthesis, solute accumulation, and ion balance of barley plants. Photosynthetica 47, 79–86. doi: 10.1007/s11099-009-0013-8
Yao, D., Zhang, X., Zhao, X., Liu, C., Wang, C., Zhang, Z., et al. (2011). Transcriptome analysis reveals salt-stress-regulated biological processes and key pathways in roots of cotton (Gossypium hirsutum L.). Genomics 98, 47–55. doi: 10.1016/j.ygeno.2011.04.007
Ye, J., Fang, L., Zheng, H. K., Zhang, Y., Chen, J., Zhang, Z. J., et al. (2006). WEGO: a web tool for plotting GO annotations. Nucleic Acids Res. 34, W293–W297. doi: 10.1093/nar/gkl1031
Yong, H. Y., Zou, Z., Kok, E. P., Kwan, B. H., Chow, K., Nasu, S., et al. (2014). Comparative transcriptome analysis of leaves and roots in response to sudden increase in salinity in Brassica napus by RNA-seq. Biomed. Res. Int. 2014:467395. doi: 10.1155/2014/467395
Zhang, L. M., Liu, X. G., Qu, X. N., Yu, Y., Han, S. P., Dou, Y., et al. (2013). Early transcriptomic adaptation to Na(2)CO(3) stress altered the expression of a quarter of the total genes in the maize genome and exhibited shared and distinctive profiles with NaCl and high pH stresses. J. Integr. Plant Biol. 55, 1147–1165. doi: 10.1111/jipb.12100
Zhang, X., Wei, L. Q., Wang, Z. Z., and Wang, T. (2013). Physiological and molecular features of Puccinellia tenuiflora tolerating salt and alkaline-salt stress. J. Integr. Plant Biol. 55, 262–276. doi: 10.1111/jipb.12013
Zhang, Y., Liu, Z., Khan, A. A., Lin, Q., Han, Y., Mu, P., et al. (2016). Expression partitioning of homeologs and tandem duplications contribute to salt tolerance in wheat (Triticum aestivum L.). Sci. Rep. 6:21476. doi: 10.1038/srep21476
Zhou, Y., Yang, P., Cui, F., Zhang, F., Luo, X., and Xie, J. (2016). Transcriptome analysis of salt stress responsiveness in the seedlings of Dongxiang wild rice (Oryza rufipogon Griff.). PLoS ONE 11:e0146242. doi: 10.1371/journal.pone.0146242
Zhou, Z., Jiang, Y., Wang, Z., Gou, Z., Lyu, J., Li, W., et al. (2015). Resequencing 302 wild and cultivated accessions identifies genes related to domestication and improvement in soybean. Nat. Biotechnol. 33, 408–414. doi: 10.1038/nbt.3096
Zhu, J. K. (2001). Plant salt tolerance. Trends Plant Sci. 6, 66–71. doi: 10.1016/S1360-1385(00)01838-0
Keywords: alkalinity, differentially expressed gene (DEG), Gene Ontology (GO) enrichment analysis, RNA-seq, ion transporter, wild soybean
Citation: Zhang J, Wang J, Jiang W, Liu J, Yang S, Gai J and Li Y (2016) Identification and Analysis of NaHCO3 Stress Responsive Genes in Wild Soybean (Glycine soja) Roots by RNA-seq. Front. Plant Sci. 7:1842. doi: 10.3389/fpls.2016.01842
Received: 13 June 2016; Accepted: 22 November 2016;
Published: 09 December 2016.
Edited by:
Anna Maria Mastrangelo, Centro di Ricerca per l’Orticoltura, ItalyReviewed by:
Gunvant Baliram Patil, University of Missouri, USAMatthew Bellgard, Murdoch University, Australia
Taku Takahashi, Okayama University, Japan
Copyright © 2016 Zhang, Wang, Jiang, Liu, Yang, Gai and Li. This is an open-access article distributed under the terms of the Creative Commons Attribution License (CC BY). The use, distribution or reproduction in other forums is permitted, provided the original author(s) or licensor are credited and that the original publication in this journal is cited, in accordance with accepted academic practice. No use, distribution or reproduction is permitted which does not comply with these terms.
*Correspondence: Yan Li, eWFubGkxQG5qYXUuZWR1LmNu