 Kuiju Niu
 Yi Shi
 Huiling Ma
- Key Laboratory of Grassland Ecosystem of Ministry of Education, College of Grassland Science, Gansu Agricultural University, Lanzhou, China
Kentucky bluegrass (Poa pratensis L.) belong to Gramineae and is widely used in lawns, golf courses, landscapes, and sport fields as a prominent cool-season grass. Gene expression patterns during different stages of plant development can provide clues toward the understanding of its biological functions. The selection and validation of reference genes are the first steps in any real-time quantitative PCR gene expression study. Therefore, suitable reference genes are necessary for obtaining reliable results in real-time quantitative PCR analyses of Kentucky bluegrass. In the present study, 9 candidate reference genes were chosen, and their expression stability in the leaves and roots of Kentucky bluegrass under different stresses (drought, salt, heat, and cold) were evaluated using the GeNorm, NormFinder, BestKeeper, and RefFinder programs. The results showed that the expression stability of the candidate reference genes was dependent on the experimental conditions. The combination of SAM with GAPDH was the most stable in leaves under salt stress and cold stress, while TUB combined with ACT or GAPDH was stable in roots under salt or cold stress, respectively. ACT and SAM maintained stable expression in drought-treated leaves, and GAPDH combined with ACT was stable in drought-treated roots. SAM and TUB exhibited stable expression in heat-treated leaves. ACT and RPL were stable in heat-treated roots. In addition, the expression patterns of PpFEH in response to drought and cold stress were used to confirm the reliability of the selected reference genes, indicating that the use of an inappropriate reference gene as the internal control will cause erroneous results. This work is the first study on the expression stability of reference genes in Kentucky bluegrass and will be particularly useful in the selection of stress-tolerance genes and the identification of the molecular mechanisms conferring stress tolerance in this species.
Introduction
The study of gene expression is fundamental to understanding signal transduction, metabolic pathways, and development. Northern blotting, DNA microarray hybridization and real-time quantitative polymerase chain reaction (RT-qPCR) are commonly used to determine gene expression in response to abiotic stress (Le et al., 2012). RT-qPCR analysis is the most common technique for studying the expression of genes because it is sensitive, specific, cost-effective, and reproducible, and it has been widely applied to study variation in gene expression in diverse organisms and tissues and under different stress conditions (Hong et al., 2008; Chen et al., 2015; Kanakachari et al., 2016). However, the application of RT-qPCR is often affected by methodological errors, including variations in the quality of RNA, variations in the efficiency of cDNA synthesis, and variations in the efficiency of amplification (Delporte et al., 2015). These errors will cause the quantitation of target gene transcripts to be unreliable. Therefore, RT-qPCR data should be normalized. It has been widely reported that the most effective way to normalize the data is to use appropriate reference genes (Hong et al., 2008; Delporte et al., 2015).
Ideal reference genes would be expressed at a constant level in each cell under different physical conditions and would thus be representative of the cDNA concentration in each sample, but there are often variations in their expression due to different experimental treatments (Bustin et al., 2005; Sgamma et al., 2016). Therefore, it is crucial to select reference genes with relatively constant expression. Common reference genes include the basic components of the cytoskeleton (ACT, TUA, TUB) or genes involved in the basic biochemical metabolism of organisms (GAPDH, EF-1a, UBQ), as they are stably expressed in some tissues and organs (Huggett et al., 2005; Gutierrez et al., 2008). Recent studies have found that there is also variation in the expression of these genes in different cells and tissues and in different developmental stages and various experimental treatments (Hu et al., 2009; Die et al., 2010). Therefore, an increasing number of studies on the identification and evaluation of the stability of reference genes in many types of plants under different conditions have been reported, including Saccharum sinensis (Iskandar et al., 2004), Brachypodium distachyon (Hong et al., 2008), Oryza sativa (Jain, 2009), Triticum aestivum (Paolacci et al., 2009), Solanum lycopersicum (Long et al., 2010), Pisum sativum (Die et al., 2010), Hordeum vulgare (Rapacz et al., 2012), Lactuca sativa (Borowski et al., 2014; Sgamma et al., 2016), Buchloe dactyloides (Li et al., 2014), Festuca arundinacea (Yang et al., 2015), and Agrostis stolonifera (Chen et al., 2015).
Kentucky bluegrass (Poa pratensis L.) belongs to the Gramineae family and is widely used in lawns, golf courses, landscapes, and sports fields as a prominent cool-season grass (Puyang et al., 2015). This grass is often subjected to various abiotic stresses, which result in reduced aesthetic quality and seed yield. Among all types of abiotic stress, drought, salt, heat, and cold stress are the most common detrimental factors affecting its growth in various regions (Huang et al., 2014). The validation of reference genes under various stress conditions is necessary for understanding the molecular mechanisms underlying stress responses and cultivating superior stress-tolerant germplasm through biotechnology breeding programs for Kentucky bluegrass. It is worth noting that no research has been conducted to identify and validate reference genes in Kentucky bluegrass.
In the present study, 9 candidate reference genes, 18S, ACT, EF-1a, GAPDH, RPL, RUBP, SAM, TUA, and TUB, were selected, and the expression stability of these genes was evaluated to validate stable reference genes for use in RT-qPCR analysis of gene expression in leaves and roots of Kentucky bluegrass under drought, salt, heat, and cold stress. In addition, the expression of a target gene (PpFEH) related to the treatments evaluated was investigated to demonstrate the effectiveness of the selected reference genes identified during the study.
Materials and Methods
Preparation of Plant Materials
Kentucky bluegrass (cv. Midnight II) seeds were soaked overnight in tap water and then washed several times to rinse away the empty seeds floating on the water. The washed seeds were sown in plastic pots filled with sand and maintained in a growth chamber controlled at 25/25°C (day/night) with a daily photoperiod cycle of 14 h and relative humidity of 65%. After 3 weeks of seeding, seedlings were transferred into half-strength Hoagland's nutrient solution (Hoagland and Arnon, 1950). The hydroponic culture period lasted for 4 weeks, and the nutrient solution was refreshed weekly during this period.
Abiotic Stress Treatments
Seedlings of uniform size were selected and divided into four groups to impose four abiotic stress conditions. For drought or salt treatment, plants were transferred to nutrient solution containing 25% PEG 6000 with −1.25 MPa osmotic potential or 250 mM NaCl, respectively. Heat stress was imposed in a growth chamber set at 40°C, and cold stress was imposed at 4°C in an incubator. At 0, 2, 4, 8, 16, and 24 h of stress treatment, leaves and roots were harvested and immediately frozen in liquid nitrogen and stored at −80°C for further analysis. Each treatment type and duration was replicated three times in three containers of nutrient solution containing PEG 6000 (drought) or NaCl (salt) or three chambers for the heat or cold treatment.
Total RNA Isolation and First-Strand cDNA Synthesis
Total RNA was isolated from Kentucky bluegrass leaves and roots using the RNAsimple Total RNA Kit (TIANGEN) according to the kit instructions. The RNA quality and concentration were measured with a spectrophotometer (NanoVue™ plus, Wilmington, DE, USA), and samples with an A260/A280 ratio within 1.8–2.2 and an A260/A230 ratio of ~2.0 were retained. The removal of genomic DNA contamination and 1st strand cDNA synthesis were performed using the PrimeScript™ RT reagent Kit with gDNA Eraser (TaKaRa) following the manufacturer's instructions.
Selection of Candidate Reference Genes and Primer Design
A total of 9 candidate reference genes (18S, ACT, EF-1a, GAPDH, RPL, RUBP, SAM, TUA, TUB) that have been reported to be good potential candidates in previously published papers were selected (Hong et al., 2008; Rapacz et al., 2012; Kanakachari et al., 2016). Although many gene high-throughput sequence approaches have been widely provided on plant genetic research, Kentuchy bluegrass is still a less studied species with these approaches. Raw data of Kentuchy bluegrass transcriptome sequences can be found from Genebank database (Bushman et al., 2016; Gan et al., 2016), while it did no help to identify candidate reference genes with these short reads. Due to the absence of draft genome and EST sequences, we could not complete a blast search using the homologous sequences from Arabidopsis or another species as a query to identify the coding DNA sequences of candidate reference genes in Kentucky bluegrass in the EST database. Therefore, we had to clone a 500–800-bp core sequence of these genes using the known sequences of some closely related species (e.g., B. distachyon, T. aestivum, O. sativa, H. vulgare, and Zea mays) before this research. The cloned sequences of the candidate reference genes are provided in Supplementary material Data Sheet 1. The coding sequences of the candidate reference genes were used to design primers using Primer3 (http://bioinfo.ut.ee/primer3-0.4.0/) according to the following parameters: Melting temperature (Tm) of 58–62°C, with an ideal Tm of 60°C; GC content of 45–55%, with an ideal content of 50%; an optimum length of 17–23 bp and amplicon lengths of 50–200 bp. Descriptions of the candidate reference genes and primer sequences are shown in Table 1.
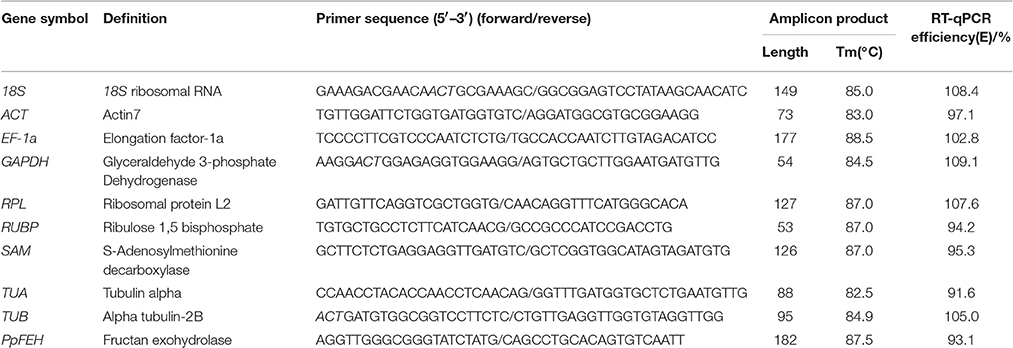
Table 1. Description of the candidate reference genes, primer sequences and RT–qPCR amplification efficiencies.
For verifying the cloned sequences, one library of the raw reads (SRR3080330) of Kentucky bluegrass transcriptom was downloaded from NCBI (https://www.ncbi.nlm.nih.gov/), which was submitted with the bioproject PRJNA307470. Trinity (v2.1.1, https://github.com/trinityrnaseq/trinityrnaseq/wiki) was used for transcriptom assembling. The stats of the assembly are provided in Supplementary material Table 1. The cloned sequences of 9 candidate reference genes were blasted with the transcriptom. The result showed that not only single hit can be found in the transcriptom for each reference genes, but one or two similar hits can be found with a more than 90% identity. However, the output of blast results of qpcr primers against the transcriptom can demonstrate that all of the primers can be aligned only on these similar genes, and the amplicon products of each pair of primers in these similar genes are exactly the same with the amplicon in the cloned sequences. The blast results can be found in Supplementary material Table 2. This result demonstrated that the cloned sequences are credible for the following analysis.
The primer specificities were verified by the presence of a single DNA band with the expected size in 1.5% agarose gel electrophoresis and the presence of a single peak in RT-qPCR melting curve assays (Figure 1). RT-qPCR amplification efficiencies for each reference gene were measured using LinRegPCR software (Ruijter et al., 2009). The theoretical optimum value is 100%, indicating that the template is duplicated in an exponential manner, and the acceptable range is usually set between 90 and 110% (Bustin et al., 2009; Sgamma et al., 2016). The RT-qPCR efficiencies for the 9 reference genes and 1 target gene (PpFEH) varied from 93.1 to 109.1%, representing acceptable efficiency (Table 1).
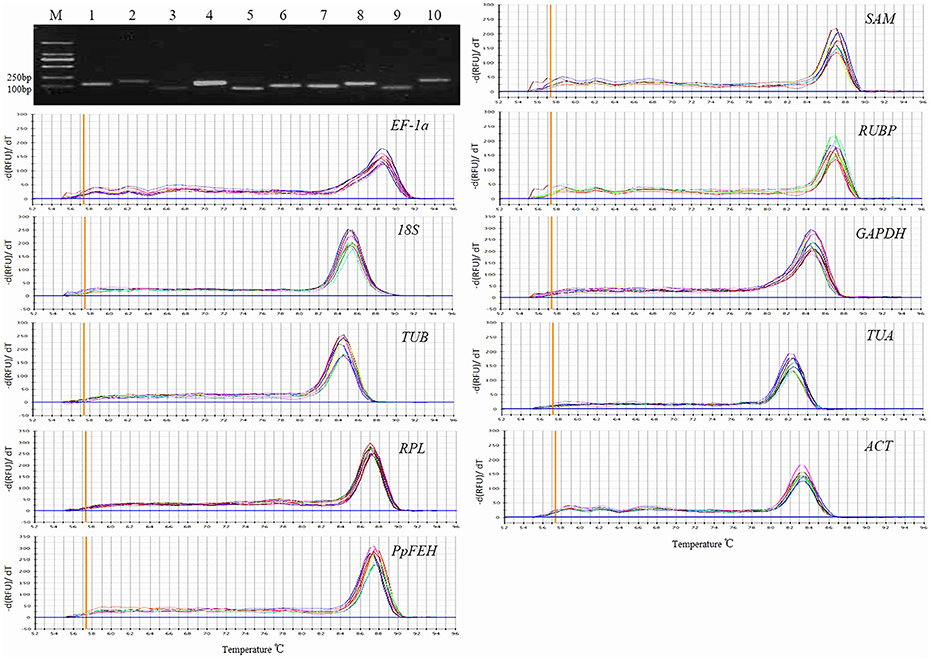
Figure 1. Primer specificity and amplicon size. Agarose gel (1.5%) electrophoresis indicated the amplification of a single PCR product of the expected size for 10 genes (lines 1–10: SAM, EF-1α, RUBP, 18S, GAPDH, TUB, TUA, RPL, ACT, PpFEH). The melting curves for the 10 genes show single peaks. M represents a 2000 bp DNA marker.
Real-Time Quantitative PCR Analysis
RT-qPCR was conducted with an iQ™ 5 real time PCR machine (Bio-Rad, USA) using SYBR® Premix DimerEraser™ (TaKaRa). Each 20-μL reaction mixture contained 2 μL DNA, 10 μL 2 × SYBR® Premix DimerEraser, 0.6 μL each primer (10 μM) and 6.8 μL ddH2O. The amplification conditions were as follows: 95°C for 3 min followed by 40 cycles of 95°C for 10 s and 55°C for 30 s. The melting curve was produced by varying the amplification temperature from 55 to 95°C, with a temperature increase of 0.5°C per cycle. No-template controls were included, and RT-qPCR analysis of each sample was performed in triplicate.
Stability Analysis of Reference Genes
Four programs, GeNorm (Vandesompele et al., 2002), NormFinder (Andersen et al., 2004), BestKeeper (Pfaffl et al., 2004) and RefFinder (http://fulxie.0fees.us/?type=reference) were used to evaluate the stability of the nine potential reference genes. For GeNorm and NormFinder, the raw quantification cycle (Cq) values were transformed into relative quantities (Q-value) using the formula Q = 2−ΔCq, in which ΔCq = each corresponding Cq value—minimum Cq value (Yang et al., 2015). The Q-value was then uploaded into the GeNorm applet to calculate the expression stability measurement (M-value) based on the average of the pairwise variation for a candidate reference gene with all other genes tested. NormFinder calculates the stability value using an ANOVA-based model to consider the intra- and inter-group variation of the candidate reference genes, with the lowest value representing the highest stability. For BestKeeper, the raw Cq values were used to calculate the coefficient of variance (CV) and the standard deviation (SD), with the lowest CV representing the highest stability. RefFinder integrated the data from GeNorm (M-values), NormFinder (stability values), BestKeeper (CV and SD), and the delta Cq values and then generated the comprehensive ranking.
Validation of Reference Gene Stability
The previous studies showed that fructan exohydrolase (FEH) transcriptional factors are responsive to abiotic stresses (Rao et al., 2011; Xu et al., 2015). PpFEH (accession number GQ383670.1) was identified from the Kentucky bluegrass nucleotide database in GenBank. To confirm the reliability of the selected reference gene, the relative expression profiles of FEH in samples of Kentucky bluegrass leaves under drought stress and roots under cold stress were measured and normalized to the most stable and the least stable reference genes identified by RefFinder. The 2−ΔΔCq method was used to calculate the relative expression data. Three technical replicates were performed for each biological sample.
Results
Expression Levels and Variations in Candidate Reference Genes
The quantification cycle (Cq) value reflected the mRNA transcript level. The Cq value produced from the RT-qPCR analysis was used to detect the expression levels of the 9 candidate reference genes. The expression level of each candidate reference gene is presented in Table 2. The Cq values of all the candidate reference genes under different treatments ranged from 10.5 to 33.2. 18S had the highest level of expression, with a mean Cq of 11.8, and EF-1a exhibited the lowest expression level, with a mean Cq of 26.1 (Table 2). The coefficients of variation (CV) show the degree of variation in the observed values within a sample (lower values mean lower variability). Throughout all the treatments, 18S showed the lowest variability with a CV value of 5.7%, while RUBP was the most variable (CV, 23.4%).
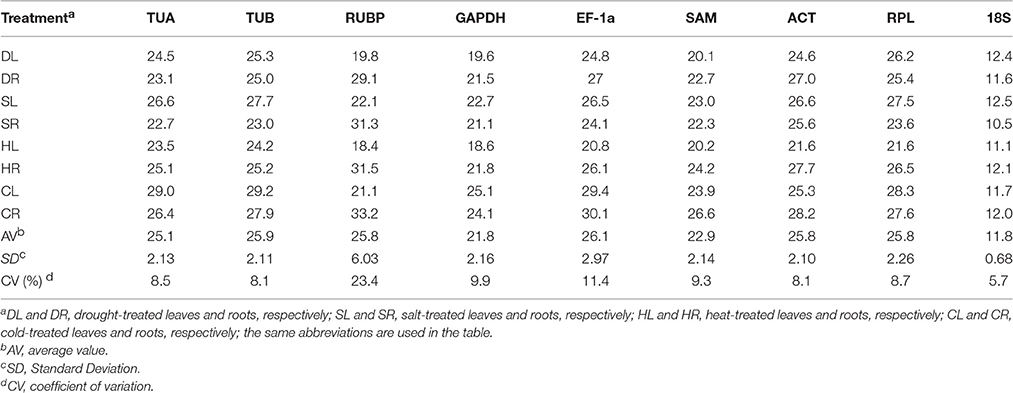
Table 2. Expression levels of the 9 candidate reference genes.
Stability of Candidate Reference Genes
Genorm Analysis
The GeNorm program was used to evaluate the stability of the 9 candidate reference genes using the M-values, which were defined as the mean variation of a gene relative to all others. In GeNorm, the threshold for eliminating a gene as stable was set as M < 1.5, with lower M-values indicating higher stability (Vandesompele et al., 2002). Based on this criterion, the results showed that TUB and GAPDH, which had the same values, were the most stable reference genes for salt-treated roots (SR) or heat-treated and cold-treated roots (HR and CR), while GAPDH and SAM were the most stable reference genes for salt-treated leaves (SL) or cold-treated leaves (CL), SAM and ACT were the most stable reference genes for drought-treated leaves (DL), GAPDH and ACT were the most stable reference genes for drought-treated roots (DR), TUB and SAM were the most stable reference genes for heat-treated leaves (HL), and TUA and TUB were the most stable reference genes for pooled samples that included all treatments (Total) (Figure 2). EF-1a, RUBP, and 18S were determined to be the least stable reference genes in most samples.
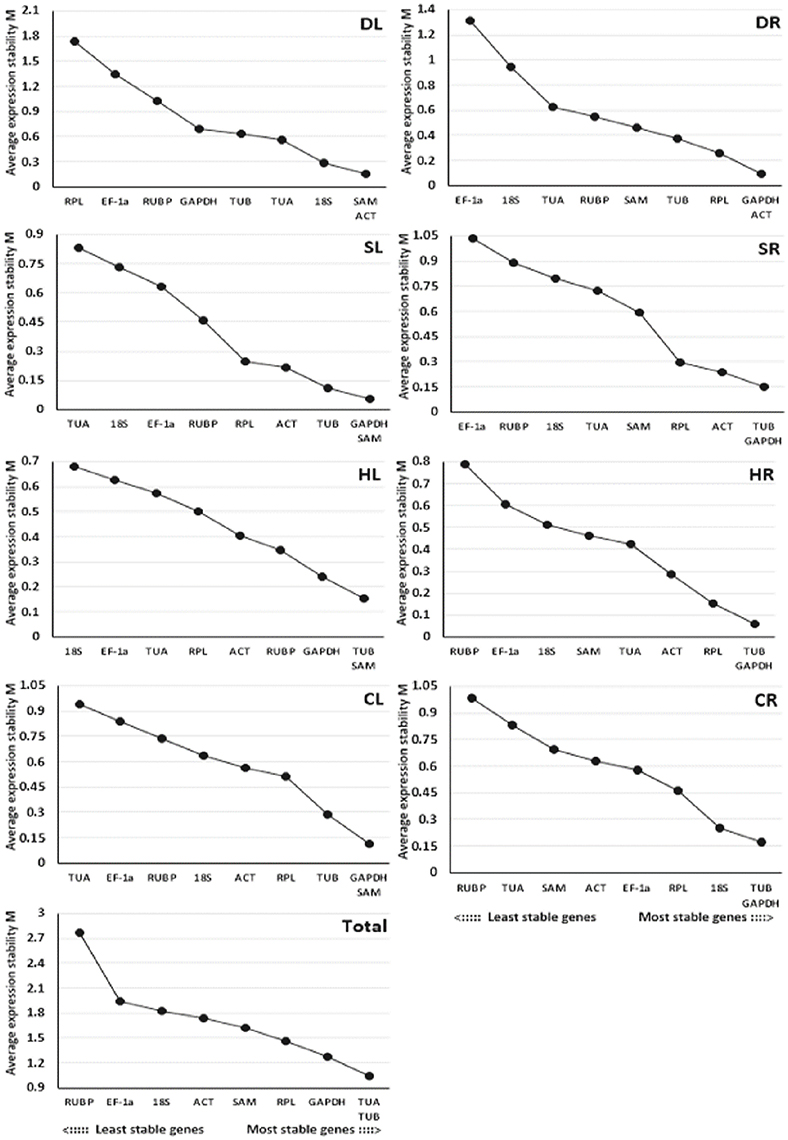
Figure 2. Average expression stability values (M) of the 9 candidate reference genes assayed with GeNorm software. The most stable genes on the right and the least stable genes are on the left. DL and DR: Drought-treated leaves and roots, respectively; SL and SR: Salt-treated leaves and roots, respectively; HL and HR: Heat-treated leaves and roots, respectively; CL and CR: Cold-treated leaves and roots, respectively; Total: Pooled samples from all treatments.
In addition, GeNorm software also provides information on the optimum number of reference genes to be used in the experiment based on the pairwise variation between ranked genes (Vn/Vn+1). A cut-off of 0.15 (Vn value) is usually applied (Vandesompele et al., 2002). The difference in Vn values of V2/3 and V3/4 was noted in this work. The V2/3 values for DL (0.113), DR (0.113), SL (0.044), SR (0.092), HL (0.093), HR (0.067), CL (0.126), and CR (0.095) samples were lower than 0.15 (Figure 3), which indicated that two reference genes would be sufficient for the accurate normalization of these samples. However, a cut-off value of 1.5 should not be considered a rigorous standard, and several reports have found higher cut-off values of Vn/Vn+1(Silveira et al., 2009; Chen et al., 2014; Yang et al., 2015). Our data showed a slight variation between V3/4 (0.367) and V4/5 (0.348) in Total samples (pooled samples), suggesting that three genes (TUA, TUB, GAPDH) may be necessary for the efficient normalization of all the samples.
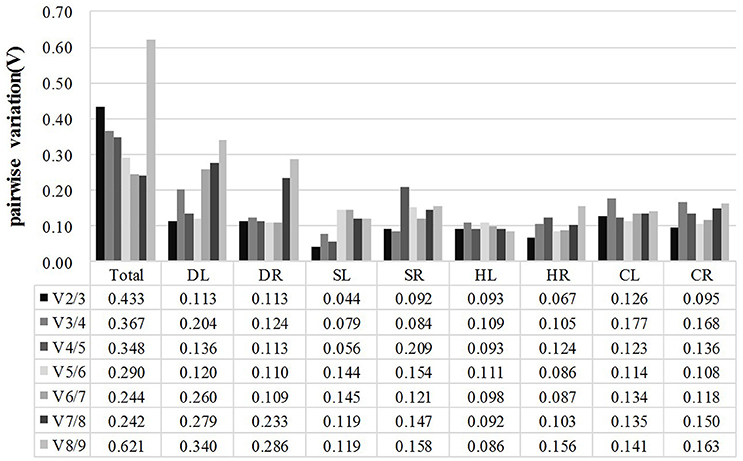
Figure 3. Pairwise variation (V) of candidate reference genes, as calculated by GeNorm software. Vn/Vn+1 values were used to determine the optimal number of reference genes. A cut-off of 0.15 (Vn value) is usually applied. DL and DR: Drought-treated leaves and roots, respectively; SL and SR: Salt-treated leaves and roots, respectively; HL and HR: Heat-treated leaves and roots, respectively; CL and CR: Cold-treated leaves and roots, respectively; Total: Pooled samples from all treatments.
Normfinder Analysis
The stability values of the 9 candidate reference genes were calculated using NormFinder software, with lower values indicating higher stability (Table 3). The three most stable reference genes for all samples (Total) were SAM (0.269), ACT (0.489), and GAPDH (0.499) according to the NormFinder analysis. SAM and GAPDH were the most stable genes in the SL and CL samples, while GAPDH was the lowest stable reference gene in the DL samples. ACT was the most stable reference gene in the DL and SR samples. HR and EF-1a were each ranked first for their stability in the HR or CR samples, respectively, and exhibited lower stability in the other samples. Consistent with the GeNorm data, SAM and TUB were the two most stable genes in the HL samples, and SAM and GAPDH were the most stable genes in the SL and CL samples. However, the stability ranking of the candidate reference genes generated with NormFinder was slightly different from that of GeNorm in most of the samples. For example, ACT and RPL were identified as the most stable reference genes in the SR and HR samples in the NormFinder analysis, while their stability rankings were third and fourth with the GeNorm analysis, respectively.
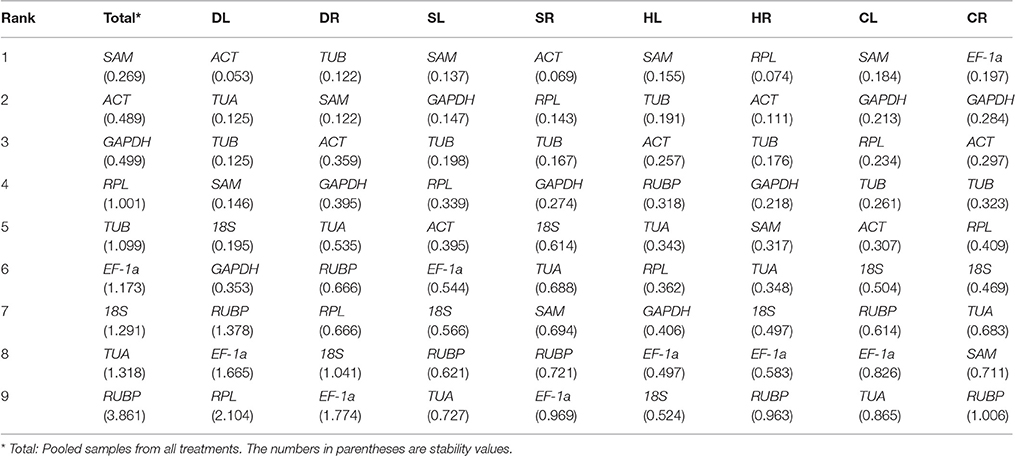
Table 3. Stability analysis of candidate reference genes, as assayed with NormFinder software.
BestKeeper Analysis
The expression stability of the 9 candidate reference genes was also evaluated based on the Cq values using the BestKeeper program. In addition, the coefficient of variation (CV) and standard deviation (SD) of all the candidate reference genes were calculated. Data with a SD < 1 were considered to have acceptable ranges of variation, with lower CV and SD indicating higher stability (Migocka and Papierniak, 2010). Table 4 shows the results of the BestKeeper analysis. In the present study, SAM was the most stable gene for expression normalization in the DL and HR samples, GAPDH was the most stable in the DR and SL samples, TUA was the most stable in the HL and CL samples, and ACT was the most stable gene in CR and all samples (Total). 18S was the most stable gene in the SR samples, but exhibited the lowest ranking for the DR, SL, and CR samples. EF-1a was ranked fourth in the HR and CR samples and showed the lowest stability in the SR samples. RUBP was ranked as the least stably expressed gene in most of the samples, including DL, HL, HR, CL, and Total. Similarly, the stability ranking of the candidate reference genes generated with BestKeeper was different from that of GeNorm and NormFinder for most of the samples.
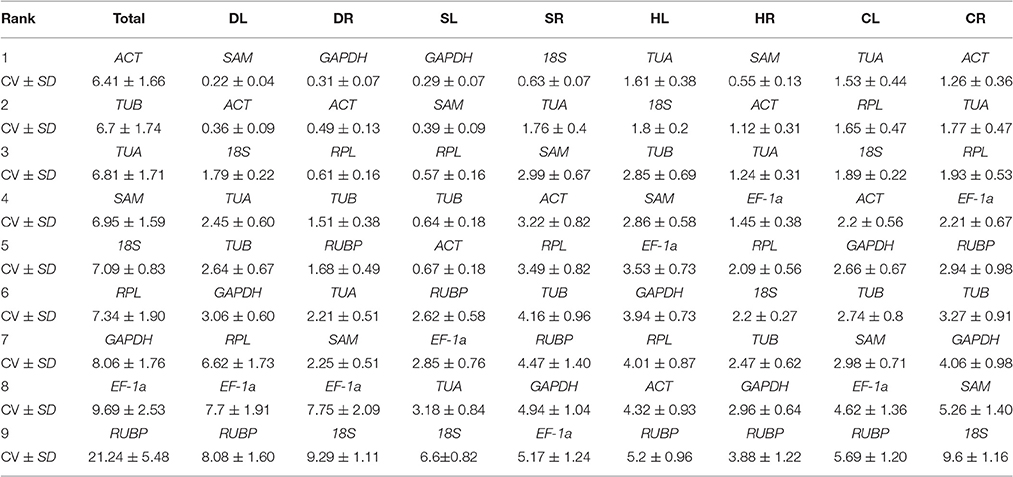
Table 4. Stability analysis of candidate reference genes, as assayed with BestKeeper software.
RefFinder Analysis
The comprehensive rankings of the candidate reference genes shown in Table 5 were determined with the RefFinder program (http://fulxie.0fees.us/?type=reference), which integrates different analysis programs, including GeNorm, NormFinder, BestKeeper and the delta Cq method (Chen et al., 2014, 2015; Yang et al., 2015). SAM, GAPDH, and TUB were found to be the three most stable reference genes in Total samples. SAM and GAPDH were suggested to be the most suitable combination for the SL and CL samples. ACT combined with SAM, GAPDH, TUB, or RPL were the most stable reference genes in the DL, DR, SR, and HR samples. The most suitable combination for the HL and CR samples was TUB together with SAM or GAPDH. EF-1a or RUBP was the least stable reference gene under the majority of the four stress conditions.
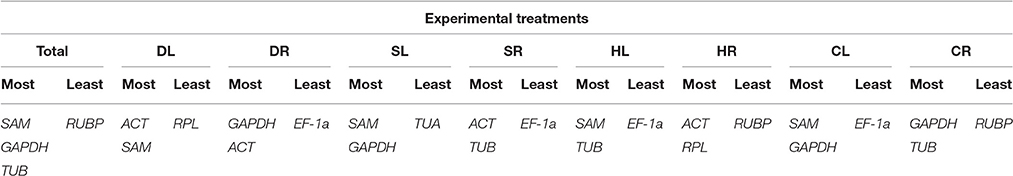
Table 5. The most stable and least stable combinations of reference genes, as determined with RefFinder analysis.
Validation of Selected Reference Genes for the Expression of Target Gene, PpFEH
To confirm the stability of reference genes determined to be most or least stable through the analyses described above, the expression pattern of a target gene, PpFEH, was examined in response to drought and cold stress in DL and CR samples (Figure 4). The two most stable references genes (ACT and SAM for DL samples, GAPDH and SAM for CR samples) and the least stable reference gene (RPL for DL samples, EF-1α for CR samples) were used in the validation test. Using ACT or SAM alone or ACT combined with SAM as the reference gene, PpFEH expression in the leaves of Kentucky bluegrass showed slight fluctuations before 16 h and then significantly increased after 24 h of drought stress, while the maximum expression level occurred at 2 h when RPL was used as a reference during drought stress (Figure 4A). In response to cold stress, PpFEH expression in the roots of Kentucky bluegrass was clearly up-regulated to the highest level at 16 h of treatment and then declined when GAPDH or SAM alone or GAPDH combined with SAM was used as a reference, while the expression of PpFEH continuously increased during drought stress and was markedly higher when TUB was used as a reference for normalization than when the combination of GAPDH and SAM was used as a reference after 4 h (Figure 4B).
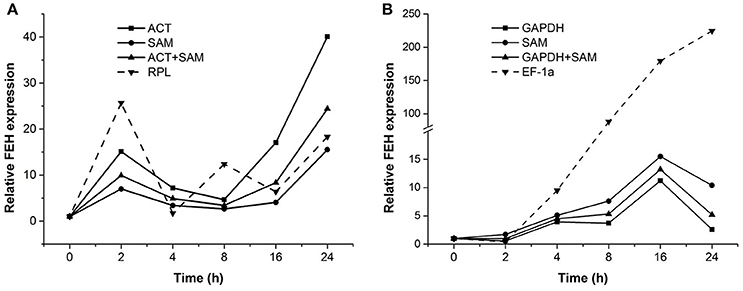
Figure 4. Relative expression of FEH 0, 2, 4, 8, 16, and 24 h following stress treatment using the selected reference genes for normalization. (A) The expression of FEH in drought-treated leaves was normalized using the two most stable genes (ACT and SAM) and the least stable gene (RPL). (B) The expression of FEH in cold-treated roots was normalized using the two most stable genes (GAPDH and SAM) and the least stable gene (EF-1a).
Discussion
It is very convenient to obtain the sequences of reference genes in the EST database with a blast search using the Arabidopsis homology sequence or other species as a query, and this is the main method for selecting reference genes for many plant species (Rapacz et al., 2012; Borowski et al., 2014; Kanakachari et al., 2016; Sgamma et al., 2016). In recent years, studies aimed at identifying suitable reference genes as internal controls for RT-qPCR analysis have been reported in many turfgrass species, such as Lolium perenne (Lee et al., 2010), bermudagrass (Chen et al., 2014), buffalo grass (Li et al., 2014), tall fescue (Yang et al., 2015), and creeping bentgrass (Chen et al., 2015). However, experiments aimed at selecting stable reference genes for Kentucky bluegrass have not yet been conducted, which might be due to the fact that nothing is present to be searched in the Kentucky bluegrass GenBank EST database. For that reason, we cloned 9 frequently used reference genes before this research.
GeNorm, NormFinder, and BestKeeper are three programs based on statistical analysis that are commonly used by researchers (Yuan et al., 2012). The operating principle of NormFinder is similar to that of the GeNorm program, but the latter can select suitable reference gene combinations and the optimal number of reference genes. In contrast to GeNorm and NormFinder, both the stability of reference genes and the stability of target genes can be analyzed by the BestKeeper program. In the present paper, the rankings created by GeNorm and NormFinder were similar, while the ranking obtained by the BestKeeper program was almost always different. A previous report revealed a similar difference between BestKeeper and other methods (Rapacz et al., 2012). RefFinder, which is regarded as a comprehensive evaluation program and provides information using data from GeNorm, NormFinder, and BestKeeper, selects a stable single gene or gene combination as the internal control (Chen et al., 2014). For this reason, four programs (GeNorm, NormFinder, BestKeeper, and RefFinder) were used to select the stable genes for Kentucky bluegrass. In previous studies, similar methods have been used in many species, such as A. stolonifera (Chen et al., 2015), Cichorium intybus (Delporte et al., 2015), and Cynodon dactylon (Chen et al., 2014).
In this study, 9 genes that have been commonly used as the candidate reference gene in many species were evaluated. According to previous studies on the selection of plant reference genes, the expression level of a reference gene might not be constant across various species (Die et al., 2010; Rapacz et al., 2012; Chen et al., 2015; Sgamma et al., 2016). GAPDH exhibited good stability in Kentucky bluegrass roots under drought and cold treatments in this study but was the least stable reference gene for T. aestivum (Long et al., 2010). Our study demonstrated that EF-1a was the least stable reference gene in roots of Kentucky bluegrass exposed to drought and salt stresses, as well as leaves under cold stress. However, EF-1a revealed good stability in soybean (Glycine max) under drought and salt stresses (Ma et al., 2013), in Populus euphratica under cold stress (Wang et al., 2014), and in Caragana korshinskii under heat stress (Yang et al., 2014).
The expression of a reference gene can be different in the same species in response to various treatments. In this study, RPL was the least stable reference gene in Kentucky bluegrass leaves exposed to drought stress but showed good stability in heat-treated roots. In a previous study, ACT was the least stable reference gene in leaves and roots under cold treatment, while good stability was detected in salt-treated leaves of creeping bentgrass (A. stolonifera) (Chen et al., 2015). In addition, the stability of individual members of reference gene families can be diverse, which indicates that the stability of other members cannot be determined based on one member's stability. TUA and TUB of the tubulin gene family (structural proteins in the cytoskeleton) are widely used as reference genes. In our study, the expression stability of TUB expression was commonly higher than TUA in the GeNorm and NormFinder analyses. Genes in the actin family, which includes ACT2/7, ACT8, and ACT11, have also been used as reference genes. Hu et al. found that the expression stability of ACT11 was much higher than that of ACT2/7 in soybean (Hu et al., 2009).
The reliability of reference genes exhibiting the highest or lowest stability was further validated by determining the expression patterns of a target gene, PpFEH, in Kentucky bluegrass in response to drought and cold stress. Our results showed that the expression of PpFEH exhibited a clear pattern in response to drought or cold stress when the combination of ACT and SAM or GAPDH and SAM was used as a reference; therefore, these genes could be suitable for the quantification of target gene expression in cold-stressed roots or drought-stressed leaves of Kentucky bluegrass. PpFEH exhibited variable expression patterns when RPL was used as a reference gene in drought-stressed leaves or when EH-1a was used in cold-stressed roots, suggesting that those genes would be unreliable for RT-qPCR analysis in cold- or drought-stressed Kentucky bluegrass. Similarly, some studies have reported that significant variations in target gene expression levels were detected when unstable reference genes were used as the internal control for RT-qPCR analysis, leading to the misinterpretation of experimental results (Chen et al., 2014, 2015; Wang et al., 2014). Therefore, selecting suitable reference genes is extremely important for the normalization of target gene expression data generated with RT-qPCR.
In summary, in this study, we conducted the first comprehensive analysis of the selection of stable reference genes for RT-qPCR analysis of target gene expression in leaves and roots of Kentucky bluegrass under four different abiotic stresses. The combination of SAM with GAPDH was suitable for gene quantification in leaves of Kentucky bluegrass under salt and cold stress, while TUB combined with ACT or GAPDH were the two most stable reference genes in roots of Kentucky bluegrass under salt or cold stress, respectively. ACT and SAM maintained stable expression in drought-treated leaves, and the combination of GAPDH and ACT served as a stable reference gene in drought-treated roots of Kentucky bluegrass. SAM and TUB were the two most stable reference genes in heat-treated leaves, and the combination of ACT and RPL could be used for heat-treated roots of Kentucky bluegrass. The results acquired in this study will improve the accuracy of quantification of target gene expression with RT-qPCR analysis in Kentucky bluegrass under four common abiotic stresses and will facilitate the identification of stress-responsive genes and the molecular mechanisms conferring stress tolerance in this species.
Author Contributions
KN and HM carried out the experimental design. KN performed the experiments and prepared the manuscript and coordinated its revision. YS read and revised the manuscript. All authors provided helpful discussions and approved its final version.
Funding
The research was supported by National Natural Science Foundation of China (NSFC) (project # 31160482).
Conflict of Interest Statement
The authors declare that the research was conducted in the absence of any commercial or financial relationships that could be construed as a potential conflict of interest.
Acknowledgments
We thank Han Ya, Wang Tao, Zhang Yincui, and Zhu Ruiting for their advice and assistance in conducting these studies.
Supplementary Material
The Supplementary Material for this article can be found online at: http://journal.frontiersin.org/article/10.3389/fpls.2017.00193/full#supplementary-material
Abbreviations
18S, 18S ribosomal RNA; ACT, Actin7; EF-1a, Elongation factor-1a; GAPDH, Glyceraldehyde 3-phosphate dehydrogenase; RPL, Ribosomal protein L2; RUBP, Ribulose 1,5 bisphosphate; SAM, S-Adenosylmethionine decarboxylase; TUA, Tubulin alpha; TUB, Alpha tubulin-2B; PpFEH, Fructan exohydrolase of Poa pratensis.
References
Andersen, C. L., Jensen, J. L., and Ørntoft, T. F. (2004). Normalization of real-time quantitative reverse transcription-PCR data: a model-based variance estimation approach to identify genes suited for normalization, applied to bladder and colon cancer data sets. Cancer Res. 64, 5245–5250. doi: 10.1158/0008-5472.CAN-04-0496
Borowski, J. M., Galli, V., Messias Rda, S., Perin, E. C., Buss, J. H., dos Anjos E Silva, S. D., et al. (2014). Selection of candidate reference genes for real-time PCR studies in lettuce under abiotic stresses. Planta 239, 1187–1200. doi: 10.1007/s00425-014-2041-2
Bushman, B. S., Amundsen, K. L., Warnke, S. E., Robins, J. G., and Johnson, P. G. (2016). Transcriptome profiling of Kentucky bluegrass (Poa pratensis L.) accessions in response to salt stress. BMC Genomics 17:48. doi: 10.1186/s12864-016-2379-x
Bustin, S. A., Benes, V., Garson, J. A., Hellemans, J., Huggett, J., Kubista, M., et al. (2009). The MIQE guidelines: minimum information for publication of quantitative real-time pcr experiments. Clin. Chem. 55, 611–622. doi: 10.1373/clinchem.2008.112797
Bustin, S. A., Benes, V., Nolan, T., and Pfaffl, M. W. (2005). Quantitative real-time RT-PCR–a perspective. J. Mol. Endocrinol. 34, 597–601. doi: 10.1677/jme.1.01755
Chen, Y., Hu, B., Tan, Z., Liu, J., Yang, Z., Li, Z., et al. (2015). Selection of reference genes for quantitative real-time PCR normalization in creeping bentgrass involved in four abiotic stresses. Plant Cell Rep. 34, 1825–1834. doi: 10.1007/s00299-015-1830-9
Chen, Y., Tan, Z., Hu, B., Yang, Z., Xu, B., Zhuang, L., et al. (2014). Selection and validation of reference genes for target gene analysis with quantitative RT-PCR in leaves and roots of bermudagrass under four different abiotic stresses. Physiol. Plant. 155, 138–148. doi: 10.1111/ppl.12302
Delporte, M., Legrand, G., Hilbert, J. L., and Gagneul, D. (2015). Selection and validation of reference genes for quantitative real-time PCR analysis of gene expression in Cichorium intybus. Front. Plant Sci. 6:651. doi: 10.3389/fpls.2015.00651
Die, J. V., Román, B., Nadal, S., and González-Verdejo, C. I. (2010). Evaluation of candidate reference genes for expression studies in Pisum sativum under different experimental conditions. Planta 232, 145–153. doi: 10.1007/s00425-010-1158-1
Gan, L., Di, R., Chao, Y., Han, L., Chen, X., Wu, C., et al. (2016). De novo transcriptome analysis for kentucky bluegrass dwarf mutants induced by space mutation. PLoS ONE 11:e0151768. doi: 10.1371/journal.pone.0151768
Gutierrez, L., Mauriat, M., Guénin, S., Pelloux, J., Lefebvre, J. F., Louvet, R., et al. (2008). The lack of a systematic validation of reference genes: a serious pitfall undervalued in reverse transcription-polymerase chain reaction (RT-PCR) analysis in plants. Plant Biotechnol. J. 6, 609–618. doi: 10.1111/j.1467-7652.2008.00346.x
Hoagland, D. R., and Arnon, D. I. (1950). The water-culture method for growing plants without soil. Calif. Agric. Exp. Stn. Circ. 347, 357–359.
Hong, S. Y., Seo, P. J., Yang, M. S., Xiang, F., and Park, C. M. (2008). Exploring valid reference genes for gene expression studies in Brachypodium distachyon by real-time PCR. BMC Plant Biol. 8:112. doi: 10.1186/1471-2229-8-112
Hu, R., Fan, C., Li, H., Zhang, Q., and Fu, Y. F. (2009). Evaluation of putative reference genes for gene expression normalization in soybean by quantitative real-time RT-PCR. BMC Mol. Biol. 10:93. doi: 10.1186/1471-2199-10-93
Huang, B., DaCosta, M., and Jiang, Y. (2014). Research advances in mechanisms of turfgrass tolerance to abiotic stresses: from physiology to molecular biology. Crit. Rev. Plant Sci. 33, 141–189. doi: 10.1080/07352689.2014.870411
Huggett, J., Dheda, K., Bustin, S., and Zumla, A. (2005). Real-time RT-PCR normalisation; strategies and considerations. Genes Immun. 6, 279–284. doi: 10.1038/sj.gene.6364190
Iskandar, H. M., Simpson, R. S., Casu, R. E., Bonnett, G. D., Maclean, D. J., and Manners, J. M. (2004). Comparison of reference genes for quantitative real-time polymerase chain reaction analysis of gene expression in sugarcane. Plant Mol. Biol. Rep. 22, 325–337. doi: 10.1007/BF02772676
Jain, M. (2009). Genome-wide identification of novel internal control genes for normalization of gene expression during various stages of development in rice. Plant Sci. 176, 702–706. doi: 10.1016/j.plantsci.2009.02.001
Kanakachari, M., Solanke, A. U., Prabhakaran, N., Ahmad, I., Dhandapani, G., Jayabalan, N., et al. (2016). Evaluation of suitable reference genes for normalization of qPCR gene expression studies in brinjal (Solanum melongena L.) during fruit developmental stages. Appl. Biochem. Biotechnol. 178, 433–450. doi: 10.1007/s12010-015-1884-8
Le, D. T., Aldrich, D. L., Valliyodan, B., Watanabe, Y., Ha, C. V., Nishiyama, R., et al. (2012). Evaluation of candidate reference genes for normalization of quantitative RT-PCR in soybean tissues under various abiotic stress conditions. PLoS ONE 7:e46487. doi: 10.1371/journal.pone.0046487
Lee, J. M., Roche, J. R., Donaghy, D. J., Thrush, A., and Sathish, P. (2010). Validation of reference genes for quantitative RT-PCR studies of gene expression in perennial ryegrass (Lolium perenne L.) BMC Mol. Biol. 11:8. doi: 10.1186/1471-2199-11-8
Li, W., Qian, Y. Q., Han, L., Liu, J. X., and Sun, Z. Y. (2014). Identification of suitable reference genes in buffalo grass for accurate transcript normalization under various abiotic stress conditions. Gene 547, 55–62. doi: 10.1016/j.gene.2014.06.015
Long, X. Y., Wang, J. R., Ouellet, T., Rocheleau, H., Wei, Y. M., Pu, Z. E., et al. (2010). Genome-wide identification and evaluation of novel internal control genes for Q-PCR based transcript normalization in wheat. Plant Mol. Biol. 74, 307–311. doi: 10.1007/s11103-010-9666-8
Ma, S., Niu, H., Liu, C., Zhang, J., Hou, C., and Wang, D. (2013). Expression stabilities of candidate reference genes for RT-qPCR under different stress conditions in soybean. PLoS ONE 8:e75271. doi: 10.1371/journal.pone.0075271
Migocka, M., and Papierniak, A. (2010). Identification of suitable reference genes for studying gene expression in cucumber plants subjected to abiotic stress and growth regulators. Mol. Breed. 28, 343–357. doi: 10.1007/s11032-010-9487-0
Paolacci, A. R., Tanzarella, O. A., Porceddu, E., and Ciaffi, M. (2009). Identification and validation of reference genes for quantitative RT-PCR normalization in wheat. BMC Mol. Biol. 10:11. doi: 10.1186/1471-2199-10-11
Pfaffl, M. W., Tichopad, A., Prgomet, C., and Neuvians, T. P. (2004). Determination of stable housekeeping genes, differentially regulated target genes and sample integrity: bestkeeper – excel-based tool using pair-wise correlations. Biotechnol. Lett. 26, 509–515. doi: 10.1023/B:BILE.0000019559.84305.47
Puyang, X., An, M., Han, L., and Zhang, X. (2015). Protective effect of spermidine on salt stress induced oxidative damage in two Kentucky bluegrass (Poa pratensis L.) cultivars. Ecotox. Environ. Safe 117, 96–106. doi: 10.1016/j.ecoenv.2015.03.023
Rao, R. S., Andersen, J. R., Dionisio, G., and Boelt, B. (2011). Fructan accumulation and transcription of candidate genes during cold acclimation in three varieties of Poa pratensis. J. Plant Physiol. 168, 344–351. doi: 10.1016/j.jplph.2010.07.019
Rapacz, M., Stępień, A., and Skorupa, K. (2012). Internal standards for quantitative RT-PCR studies of gene expression under drought treatment in barley (Hordeum vulgare L.): the effects of developmental stage and leaf age. Acta Physiol. Plant 34, 1723–1733. doi: 10.1007/s11738-012-0967-1
Ruijter, J. M., Ramakers, C., Hoogaars, W. M., Karlen, Y., Bakker, O., van den Hoff, M. J., et al. (2009). Amplification efficiency: linking baseline and bias in the analysis of quantitative PCR data. Nucleic Acids Res. 37:e45. doi: 10.1093/nar/gkp045
Sgamma, T., Pape, J., Massiah, A., and Jackson, S. (2016). Selection of reference genes for diurnal and developmental time-course real-time PCR expression analyses in lettuce. Plant Methods 12, 21. doi: 10.1186/s13007-016-0121-y
Silveira, É. D., Alves-Ferreira, M., Guimarães, L. A., and da Silva, F. R. (2009). Selection of reference genes for quantitative real-time PCR expression studies in the apomictic and sexual grass Brachiaria brizantha. BMC Plant Biol. 9:84. doi: 10.1186/1471-2229-9-84
Vandesompele, J., De Preter, K., Pattyn, F., Poppe, B., Van Roy, N., De Paepe, A., et al. (2002). Accurate normalization of real-time quantitative RT-PCR data by geometric averaging of multiple internal control genes. Genome Biol. 3:34. doi: 10.1186/gb-2002-3-7-research0034
Wang, H. L., Chen, J., Tian, Q., Wang, S., Xia, X., and Yin, W. (2014). Identification and validation of reference genes for Populus euphratica gene expression analysis during abiotic stresses by quantitative real-time PCR. Physiol. Plant. 152, 529–545. doi: 10.1111/ppl.12206
Xu, H., Liang, M., Xu, L., Li, H., Zhang, X., Kang, J., et al. (2015). Cloning and functional characterization of two abiotic stress-responsive Jerusalem artichoke (Helianthus tuberosus) fructan 1-exohydrolases (1-FEHs). Plant Mol. Biol. 87, 81–98. doi: 10.1007/s11103-014-0262-1
Yang, Q., Yin, J., Li, G., Qi, L., Yang, F., Wang, R., et al. (2014). Reference gene selection for qRT-PCR in Caragana korshinskii Kom. under different stress conditions. Mol. Biol. Rep. 41, 2325–2334. doi: 10.1007/s11033-014-3086-9
Yang, Z., Chen, Y., Hu, B., Tan, Z., and Huang, B. (2015). Identification and validation of reference genes for quantification of target gene expression with quantitative real-time PCR for tall fescue under four abiotic stresses. PLoS ONE 10:e119569. doi: 10.1371/journal.pone.0119569
Keywords: Kentucky bluegrass, abiotic stress, reference gene, real-time quantitative PCR, gene expression
Citation: Niu K, Shi Y and Ma H (2017) Selection of Candidate Reference Genes for Gene Expression Analysis in Kentucky Bluegrass (Poa pratensis L.) under Abiotic Stress. Front. Plant Sci. 8:193. doi: 10.3389/fpls.2017.00193
Received: 20 September 2016; Accepted: 31 January 2017;
Published: 14 February 2017.
Edited by:
Julie Dickerson, Iowa State University, USAReviewed by:
Gavin Mager George, Stellenbosch University, South AfricaYuhui Chen, Samuel Roberts Noble Foundation, USA
Copyright © 2017 Niu, Shi and Ma. This is an open-access article distributed under the terms of the Creative Commons Attribution License (CC BY). The use, distribution or reproduction in other forums is permitted, provided the original author(s) or licensor are credited and that the original publication in this journal is cited, in accordance with accepted academic practice. No use, distribution or reproduction is permitted which does not comply with these terms.
*Correspondence: Huiling Ma, bWFobEBnc2F1LmVkdS5jbg==
†These authors have contributed equally to this work.