 Shane D. WaltonHarshini ChakravarthyVikram Shettigar
 Andrew J. O’NeilJalal K. SiddiquiBenjamin R. JonesSvetlana B. Tikunova
 Jonathan P. Davis*
- Department of Physiology and Cell Biology, The Ohio State University, Columbus, OH, USA
Plants commonly respond to stressors by modulating the expression of a large family of calcium binding proteins including isoforms of the ubiquitous signaling protein calmodulin (CaM). The various plant CaM isoforms are thought to differentially regulate the activity of specific target proteins to modulate cellular stress responses. The mechanism(s) behind differential target activation by the plant CaMs is unknown. In this study, we used steady-state and stopped-flow fluorescence spectroscopy to investigate the strategy by which two soybean CaMs (sCaM1 and sCaM4) have evolved to differentially regulate NAD kinase (NADK), which is activated by sCaM1 but inhibited by sCaM4. Although the isolated proteins have different cation binding properties, in the presence of Mg2+ and the CaM binding domains from proteins that are differentially regulated, the two plant CaMs respond nearly identically to rapid and slow Ca2+ transients. Our data suggest that the plant CaMs have evolved to bind certain targets with comparable affinities, respond similarly to a particular Ca2+ signature, but achieve different structural states, only one of which can activate the enzyme. Understanding the basis for differential enzyme regulation by the plant CaMs is the first step to engineering a vertebrate CaM that will selectively alter the CaM signaling network.
Introduction
Ca2+ is a universal second messenger that influences nearly every function eukaryotic cells perform (Petersen et al., 2005; Clapham, 2007; Davis et al., 2016). The intensity and frequency of a particular Ca2+ dependent function is in part encoded by the amplitude, duration and frequency of the Ca2+ signal (Berridge and Galione, 1988). Another major influence on the response of the cell to Ca2+ is the Ca2+ sensing ability of the protein machinery that performs the function (Dupont et al., 2003; Dodd et al., 2010; Mehta et al., 2014; Shettigar et al., 2016). Considering the wide assortment of Ca2+ signals and the broad spectrum of Ca2+ dependent functions that can occur within a single cell, let alone different cells, it is not surprising there is a plethora of calcium binding proteins, each tuned to respond to particular Ca2+ patterns (Dodd et al., 2010; Batistič and Kudla, 2012; Davis et al., 2016).
In particular, all eukaryotic cells express the quintessential Ca2+ binding protein calmodulin (CaM) (Klee et al., 1980; Linse et al., 1991; Means et al., 1991). This small acidic protein binds and regulates a vast assortment of proteins that are also involved in nearly every cellular function (Cheung, 1980; Davis et al., 2016). Humans have three genes that encode an identical protein copy of CaM that is nearly invariant across all vertebrates (Toutenhoofd and Strehler, 2000; Friedberg and Rhoads, 2001). CaM’s Ca2+-binding properties are tuned to a wide spectrum of Ca2+ signals depending on its protein binding partner (Linse and Forsén, 1995; Maximciuc et al., 2006; Hoffman et al., 2014). In the human, dysregulation of several CaM-dependent enzymes and ion channels are at the root of several debilitating and devastating diseases such as arrhythmias, Alzheimer’s and hypertension (Xu et al., 2010; He et al., 2011; Nyegaard et al., 2012; O’Day et al., 2015). We are attempting to rewire the CaM signaling network by designing CaMs to correct for the dysregulated protein causing disease (Walton et al., 2016). Clues on how to smartly formulate targeted therapeutic CaMs will come from how the plant has evolved to handle stress (Walton et al., 2016).
Unlike vertebrates, plant species express several unique isoforms of CaM that can vary in sequence identity by as little as a single amino acid to approximately one quarter of the protein (McCormack and Braam, 2003; McCormack et al., 2005). Of the hundreds of unique CaM isoforms found in plantae, the vast majority differ by only a few amino acids. Some of these CaM isoforms are only expressed during times of stress (Al-Quraan, 2008; Park et al., 2009). One of the best characterized stress-induced CaM is found in the soybean, sCaM4. Compared to the “housekeeping” soybean CaM, sCaM1, sCaM4 binds nearly all the same target proteins, competitively inhibiting a select group of enzymes and ion channels that sCaM1 activates (Lee et al., 1995, 2000; Cho et al., 1998; Kondo et al., 1999).
Calmodulin is a versatile protein that can adopt numerous structural states depending on the intracellular concentration of Ca2+ as well as the various proteins and complexes within a cell for CaM to bind and interact (Tidow and Nissen, 2013; Kursula, 2014; Villarroel et al., 2014). CaM contains two globular domains connected by a flexible tether. In the absence of Ca2+, each globular domain is compact and relatively inert (although there are a growing number of proteins that can bind a Ca2+-free domain of CaM) (Putkey et al., 2003; Trybus, 2008). However, intracellular free Ca2+ in a resting or unstimulated cell is generally high enough such that at least one of the domains of CaM remains bound, but does not activate, target proteins (Van Lierop et al., 2002; Davis et al., 2016). Thus, the majority of CaM is pre-bound to its numerous targets and there is very little free CaM in most cells (Persechini et al., 1996; Wu and Bers, 2007). In order for CaM to activate or regulate its targets, Ca2+ levels must rise further to activate both domains of CaM, leading to a new active state structure. Somehow plants have evolved CaMs to be competitive antagonists of specific targets/enzymes (Lee et al., 1995, 2000; Cho et al., 1998; Kondo et al., 1999).
It has recently been suggested that the two soybean CaMs’ different Ca2+ and Mg2+ binding affinities are the reason for their differential target activation (Gifford et al., 2013). In this manuscript, we demonstrate that in the presence of a physiological concentration of Mg2+ and CaM binding domains from proteins that are differentially regulated, the two plant CaMs respond nearly identically to rapid and slow Ca2+ transients. Our data suggest that when bound to a target protein, the plant CaMs have evolved to respond similarly to a particular Ca2+ signature, but achieve different structural states, only one of which can activate the enzyme.
Materials and Methods
Materials
Phenyl-sepharose CL-4B, EDTA and EGTA were purchased from Sigma Chemical Co. (St. Louis, MO, USA). Quin-2 was purchased from Calbiochem (La Jolla, CA, USA). Bis-ANS and IAANS were purchased from Invitrogen (Carlsbad, CA, USA). All other chemicals were of analytical grade.
Ohio Peptide LLC (Powell, OH) synthesized the CaM binding domain of Arabidopsis thaliana NADK2 (IYVHSKEGVWRTSAMVSRWK) (Turner et al., 2004). CelTek Peptides (Franklin, TN, USA) synthesized the CaM binding domain of human myosin light chain kinase (MLCK) (ARRKWQKTGNAVRAIGRLSS) (Garcia et al., 1997).
We used three intact CaM isoforms: vertebrate CaM (CaM (although we used a bacterially codon optimized rat CaM gene, the protein sequence is identical in all vertebrates); soybean CaM isoform 1 (sCaM1); soybean CaM isoform 4 (sCaM4). The DNA constructs for CaMT5C, CaMF19W, sCaM1F19W, and sCaM4F19W were generated from the respective wild type (WT) constructs in the pET17b vector (Studier and Moffatt, 1986; Black et al., 2000). Primer-selected site-directed mutagenesis was performed using the QuikChange Lightning Multi-site kit from Agilent (Santa Clara, CA, USA) following the manufacturer’s PCR protocol. All primers were synthesized by Integrated DNA Technologies (Coralville, IA, USA). Following PCR, the identity of each mutant was confirmed by DNA sequence analysis (GeneWiz). All CaMs were expressed in BL21 DE3 Escherichia coli and purified via phenyl-sepharose chromatography as previously described (Black et al., 2000).
We used several different fluorescent techniques to follow Ca2+ and Mg2+ binding and exchange with the different CaM constructs. Intrinsic tyrosine (Tyr) fluorescence can be used to follow the structural changes that occur within the C-domain of the WT CaMs (Black et al., 2000; Tikunova et al., 2001). We utilized the F19W mutation to exclusively follow the N-domain structural change via tryptophan (Trp) fluorescence, which occurs upon cation binding (Black et al., 2000; Tikunova et al., 2001). In order to observe the N- and C-domain pocket opening upon Ca2+-binding we utilized the fluorescent hydrophobic dyes BIS-ANS and 2,6-ANS (Fink, 1995). In order to directly follow Ca2+ dissociation from the CaM constructs we utilized the fluorescent Ca2+ chelator quin-2 (Davis et al., 2002). In order to follow WT CaM binding to their target peptides, we utilized the intrinsic Trp fluorescence of the peptides. We also utilized extrinsic fluorescent labeling of the native Cys residue in the two plant CaMs and engineered a single Cys mutant (T5C) in the vertebrate CaM and labeled the constructs with the environmentally sensitive fluorophore IAANS. IAANS fluorescence was sensitive to both N- and C-domain Ca2+-binding to the CaM constructs in the presence of the CaM target peptides.
Steady-State Measurements
The steady-state fluorescence measurements were performed using a Perkin-Elmer LS55 spectrofluorimeter at 20°C. The titration buffer consisted of 200 mM MOPS, 150 mM KCl, 2 mM EGTA (pH 7.0) (Tikunova et al., 2002, 2010; Tikunova and Davis, 2004). In order to follow the Ca2+-dependent change in the N-terminal domain of CaM, Trp fluorescence was excited at 295 nm and monitored at 350 nm. In order to follow the Ca2+-dependent change in the C-terminal domain of CaM, Tyr fluorescence was excited at 275 nm and monitored at 305 nm. The free Ca2+ concentration was calculated using the EGCA02 program by Robertson and Potter (1984). The free Mg2+ concentration was calculated using the MaxChelator program (Bers et al., 2010). Each reported Kd represents an average of at least three successive titrations ± standard error and fit with the Hill equation as previously described (George et al., 1996).
To determine the affinity of each CaM for Ca2+ or Mg2+, fluorescence emission intensity was recorded as microliter amounts of CaCl2 or MgCl2 were added to 2 mL of each CaM (1 μM) in titration buffer with constant stirring (Tikunova et al., 2002; Zhang et al., 2011). The Ca2+ titrations in the presence of Mg2+ were performed as described above with the addition of 3 mM Mg2+ to the titration buffer. To determine the affinity of each CaM isoform for NADK, each CaM was titrated into 2 mL of titration buffer containing 1 μM NADK and 100 μM Ca2+ (pCa = 4) (Johnson et al., 1996). The Ca2+ titrations in the presence of NADK or MLCK peptide were performed with 4 μM peptide in the 1 μM CaM solution.
Kinetic Measurements
The kinetic data were collected using an Applied Photophysics Ltd. (Leatherhead, UK) model SX.18 MV stopped-flow instrument with a dead time of 1.4 ms at 20°C. The samples were excited using a 150W xenon arc source (Tikunova et al., 2002; Davis et al., 2004, 2007). The stopped-flow buffer for all experiments consisted of 10 mM MOPS, 150 mM KCl (pH 7.0). Tyr fluorescence was excited at 275 nm and emission was monitored using a UV-transmitting black glass (UG1) filter from Oriel (Stratford, CT) (VanScyoc et al., 2002). Trp fluorescence was excited at 295 nm and also monitored using a UG1 filter (Davis et al., 2004). Bis-ANS fluorescence was excited at 390 nm and emission monitored using a 500 nm long pass interference filter from Newport (Irvine, CA, USA) (Hawe et al., 2008). 2,6-ANS or IAANS fluorescence were excited at 320 or 330 nm, respectively, and emission for both probes was monitored using a 420–470 nm band pass interference filter from Oriel (Stratford, CT, USA) (Tikunova et al., 2010). Quin-2 fluorescence was excited at 330 nm and emission was monitored using a 510 nm broad band pass interference filter from Oriel (Stratford, CT, USA) (Tikunova et al., 2002).
In order to measure rates of Ca2+ dissociation via structural change, stopped-flow buffer with 200 μM Ca2+ and either 1 μM CaMF19W (Trp) or 3 μM CaM (Tyr) was rapidly mixed with 10 mM EGTA in stopped-flow buffer. To measure the Ca2+-dependent rate of hydrophobic pocket closure, stopped-flow buffer with 200 μM Ca2+, 1 μM CaM and 0.5 μM bis-ANS was rapidly mixed with 10 mM EGTA in stopped-flow buffer. For the actual Ca2+ dissociation rate measurements, stopped-flow buffer with 30 μM Ca2+ and 6 μM CaM was rapidly mixed with 150 μM quin-2 in stopped-flow buffer. To directly determine the rate of Ca2+ dissociation in the presence of peptide, stopped-flow buffer with 30 μM Ca2+, 6 μM CaM and 18 μM peptide was rapidly mixed with 150 μM quin-2 in stopped-flow buffer. To determine the rate of Ca2+ dissociation via structural change in the presence of peptide, stopped-flow buffer with 1 μM IAANS-labeled CaM, 200 μM Ca2+, and 3 μM NADK or MLCK peptide was rapidly mixed with 10 mM EGTA in stopped-flow buffer. Labeling of CaMT5C, WT sCaM1, and WT sCaM4 was performed as previously described, taking advantage of the native C26 in the soybean CaMs (Tikunova et al., 2010). To determine rate of Ca2+ dissociation in the presence of peptide via the intrinsic Trp in each peptide, 1 μM CaM, 200 μM Ca2+, and 5 μM NADK or MLCK peptide in stopped-flow buffer was rapidly mixed with 10 mM EGTA in stopped-flow buffer.
For the Mg2+ dissociation experiments, stopped-flow buffer with 3 mM Mg2+, 1 μM CaMF19W and 15 μM EGTA (to chelate contaminating Ca2+) was rapidly mixed with 30 mM EDTA in stopped-flow buffer. The kinetics of Ca2+/Mg2+ competition were determined using F19W fluorescence. Stopped-flow buffer with 1 μM CaMF19W, 3 mM Mg2+, and 15 μM EGTA was rapidly mixed with solution containing 2 mM Ca2+ in stopped-flow buffer. The competition experiments with 2,6-ANS rapidly mixed solution containing stopped-flow buffer, 2 μM CaM, 3 mM Mg2+, 15 μM EGTA and 1 μM 2,6-ANS with solution containing 2 mM Ca2+ in stopped-flow buffer.
Rapid Ca2+ transients were generated by mixing a solution containing stopped-flow buffer, 2 μM of each sCaMF19W mutant and 2 mM EGTA with solution containing stopped-flow buffer, 0, 100 μM, 250 μM or 2 mM Ca2+ in both the presence and absence of 3 mM Mg2+. We followed the binding and subsequent dissociation of Ca2+ at the N-domain of CaM or its isoforms using fluorescence from the engineered Trp residue. The visible percent occupancy was calculated using 0 mM Ca2+ as the baseline and 2 mM Ca2+ as the maximum.
Slow Ca2+ transients were generated by mixing solution containing stopped-flow buffer, 3 μM of each sCaM isoform, 9 μM NADK, and 500 μM EDTA with solution containing stopped-flow buffer, 0, 10, 30, 60, 120, and 250 μM, or 2 mM Ca2+ in the presence of 1 mM Mg2+. As for the rapid transients, the visible percent occupancy was calculated using 0 mM Ca2+ as the baseline and 2 mM Ca2+ as the maximum. We followed the binding and subsequent dissociation of Ca2+ using Trp from the NADK peptide.
Bis-ANS fluorescence was used as described above to follow the structural change as Ca2+ dissociates from the N-domain of sCaM1 or sCaM4. The amplitudes from the Ca2+ dissociation without peptide were set at 100% and the amplitudes in the presence of increasing amounts of NADK (3, 6, and 15 μM) were then expressed as a percentage of this peptide-free amplitude.
All kinetic data were fit with a program (by P. J. King, Applied Photophysics Ltd.) that uses the non-linear Levenberg–Marquardt algorithm (Tikunova et al., 2010). Each koff value represents an average of at least three separate experiments, each averaging at least five traces fit with either a single exponential equation (Trp, Tyr) or a double exponential equation (bis-ANS, quin-2) (Tikunova et al., 2002).
Statistical Analysis
All values are expressed as mean ± SEM. Statistical significance (p < 0.05) was determined by one-way ANOVA followed by post hoc analysis with Tukey’s test using the statistical analysis software MiniTab16 (State College, PA, USA). Statistical significance (p < 0.05) for the rapid and slow transient occupancy experiments was determined by two-way ANOVA.
Results
Ca2+ Binding to the Isolated Plant CaMs
Figure 1 shows the steady-state Ca2+ binding curves from the C-domain of WT CaM isoforms (open squares; Tyr fluorescence) and from the N-domain of F19W CaM (Black et al., 2000; Tikunova et al., 2001) isoforms (solid squares; Trp fluorescence). Consistent with recent NMR data (Gifford et al., 2013), the C-domains for each soybean CaM had approximately fourfold higher Ca2+ affinity than the respective N-domains, which was also true for vertebrate CaM. In addition, both the N- and C-domains of sCaM4 had approximately two–threefold higher Ca2+ affinity than that of sCaM1 (Gifford et al., 2013). Considering steady-state behavior can be modulated by tuning the rate of Ca2+ exchange (Martin et al., 1992; Tikunova et al., 2010), it is important to understand the kinetic parameters of the CaM isoforms. Furthermore in a cell, Ca2+ levels are rarely in steady-state and rise and fall transiently.
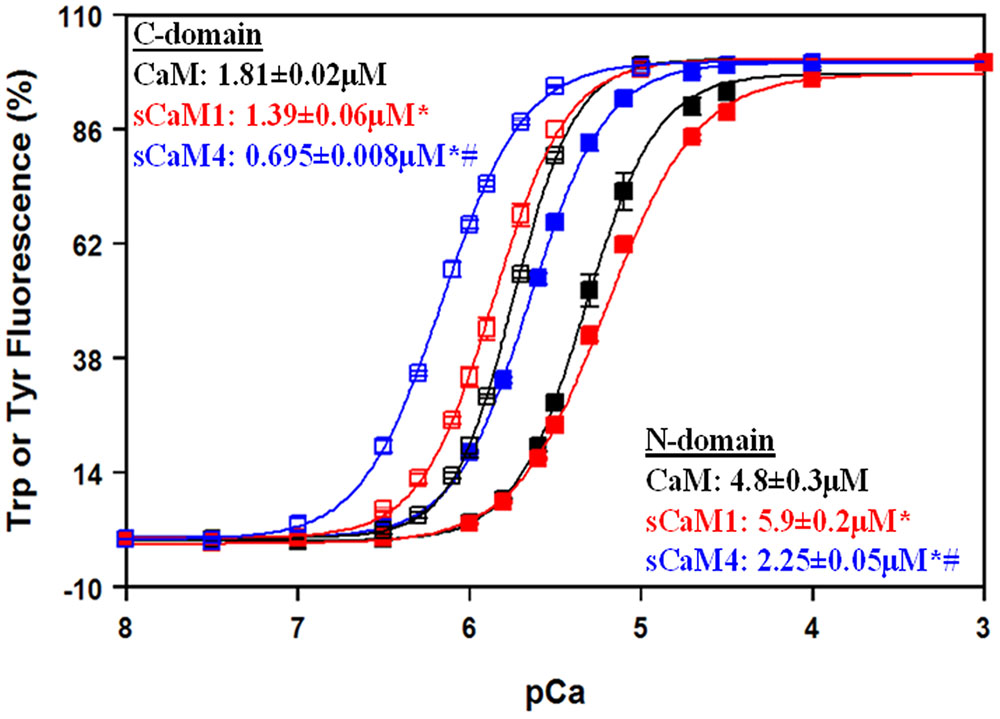
FIGURE 1. Domain-specific Ca2+ sensitivities for isolated CaMs. The Ca2+-dependent increase in Trp (N-domain, closed squares) or Tyr (C-domain, open squares) fluorescence is shown as a function of -log[Ca2+] for CaM (black), sCaM1 (red) and sCaM4 (blue). Increasing amounts of Ca2+ were added to a 2 mL solution containing 1 μM of each protein (F19W for Trp, WT for Tyr) in 200 mM MOPS, 150 mM KCl, 2 mM EGTA, pH 7.0 at 20°C. Significant difference (p < 0.05) of sCaM1 and sCaM4 from CaM is denoted by (∗) and significant difference of sCaM4 from sCaM1 is denoted by (#). The traces were fit and the free [Ca2+] calculated as described in section “Materials and Methods”.
Ca2+ Dissociation from the Isolated Plant CaMs
Steady-state Ca2+ binding is defined by how quickly the domain can associate and dissociate Ca2+. Figure 2A shows the Ca2+ dissociation rates from the N-domain of the F19W CaM isoforms using Trp fluorescence. Consistent with the differences in Ca2+ affinity, the N-domain of sCaM4 had a ∼2.5-fold slower rate of Ca2+ dissociation compared to that of sCaM1 (Table 1). Figure 2B shows the Ca2+ dissociation rates from the C-domain of the WT CaM isoforms using Tyr fluorescence. Ca2+ dissociated from the C-domain of sCaM4 approximately fivefold more slowly than from sCaM1. Thus, Ca2+ dissociates from the N-domain faster than from the C-domain for both plant CaM isoforms, again in agreement with vertebrate CaM behavior and consistent with the higher Ca2+ affinity of the C-domain. Figure 2C shows the actual rate of Ca2+ dissociation from both domains of each F19W CaM using the high-affinity fluorescent Ca2+ chelator quin-2 (Martin et al., 1985; Tikunova et al., 2002). For all the CaMs, the actual Ca2+ dissociation rates were nearly identical to those reported by the local structural change sensed by the intrinsic fluorophores at each individual domain. Figure 2D shows the rate of hydrophobic pocket closure in the CaMs as Ca2+ dissociates, using the hydrophobic fluorescent dye bis-ANS. For all the CaMs, the rate of hydrophobic pocket closure is comparable to the rate of structural change reported by the intrinsic fluorophores at each domain, which occurs at the actual Ca2+ dissociation rate. Although it would appear from the steady-state data (Figure 1) that sCaM1 behaves more similarly to CaM, kinetically this appears to be true only for the N-terminal domain, whereas kinetically the C-terminal domain of sCaM4 appears more similar to CaM (Figure 2; Table 1). Overall, sCaM4 had a higher Ca2+ affinity and slower Ca2+ dissociation rates than sCaM1, suggesting that differences in Ca2+ binding might be one strategy the plants have used to tune CaM function (Gifford et al., 2013).
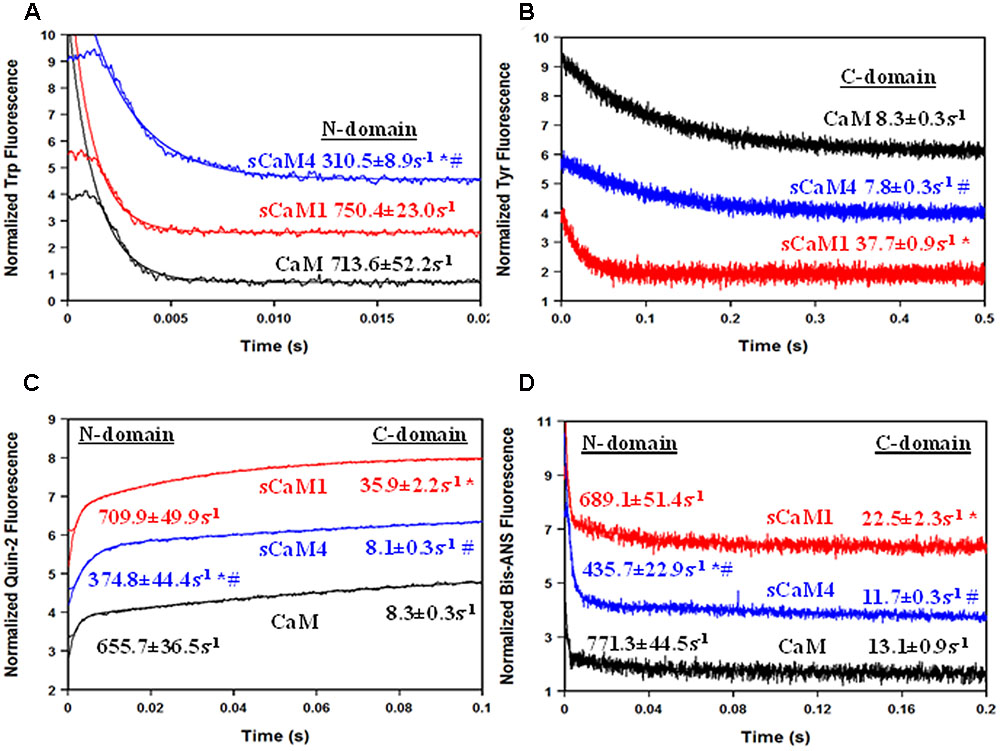
FIGURE 2. Ca2+ Dissociation from CaM, sCaM1, and sCaM4. (A) Time course of the change in Trp fluorescence as Ca2+ is removed from CaM (black), sCaM1 (blue), and sCaM4 (black) by EGTA. Each F19W protein (1 μM) with 200 μM Ca2+ in stopped-flow buffer (10 mM MOPS, 150 mM KCl, pH 7.0) was rapidly mixed with an equal volume of 10 mM EGTA in stopped-flow buffer at 20°C. (B) Time course of the change in Tyr fluorescence as Ca2+ is removed from each CaM by EGTA. Each WT protein (3 μM) with 200 μM Ca2+ in stopped-flow buffer was rapidly mixed with an equal volume of 10 mM EGTA in stopped-flow buffer at 20°C. (C) Time course of the change in quin-2 fluorescence as Ca2+ is removed from each CaM by quin-2. Each F19W protein (6 μM) with 30 μM Ca2+ in stopped-flow buffer was rapidly mixed with an equal volume of 150 μM quin-2 in stopped-flow buffer at 20°C. (D) Time course of the change in bis-ANS fluorescence as Ca2+ is removed from each CaM by EGTA. Each WT protein (1 μM) with 200 μM Ca2+ and 0.5 μM bis-ANS in stopped-flow buffer was rapidly mixed with an equal volume of 10 mM EGTA in stopped-flow buffer at 20°C. Significant difference (p < 0.05) of sCaM1 and sCaM4 from CaM is denoted by (∗) and significant difference of sCaM4 from sCaM1 is denoted by (#). All traces in this figure were normalized and displaced vertically for clarity, and were fit as described in section “Materials and Methods.”
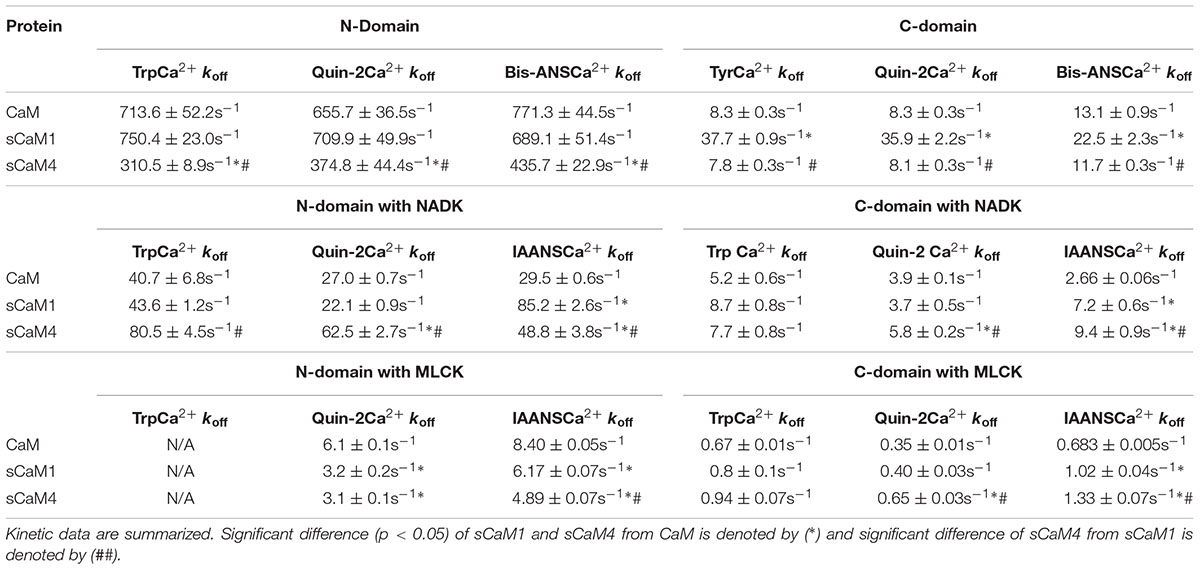
TABLE 1. Ca2+ Dissociation rates for vertebrate and plant CaM isoforms.
Mg2+ Binding to the Isolated Plant CaMs
In addition to Ca2+, CaM is known to bind Mg2+ competitively, competing with up to 1 mM free Mg2+ in the cell (Ohki et al., 1997; Tikunova et al., 2001; Waters, 2011; Gifford et al., 2013). In agreement with previous findings, our data show the N-domain of all the CaMs had a physiologically relevant Mg2+ affinity, whereas the C-domain Mg2+ affinity falls well outside the physiological range (Figure 3A). The Mg2+ affinity of the N-domain of sCaM4F19W was approximately threefold higher compared to sCaM1F19W, but not significantly different at the C-domain. Based on these data, Mg2+should drastically decrease the apparent Ca2+ sensitivity of the N-domain while only slightly affecting the C-domain. Figure 3B shows the effect of 3 mM Mg2+ on Ca2+ binding to the vertebrate and soybean CaMs. As expected, the apparent Ca2+ sensitivity of the N-domain of all the CaMs decreased approximately sixfold in the presence of Mg2+. On the other hand, the apparent C-domain Ca2+ sensitivity for all the CaMs only marginally decreased by ∼1.5-fold. Thus, in a cell the high level of Mg2+ would be expected to exert a greater effect of competing for Ca2+ binding to the N-domain of CaM, with little effect on the C-terminal domain Ca2+ binding.
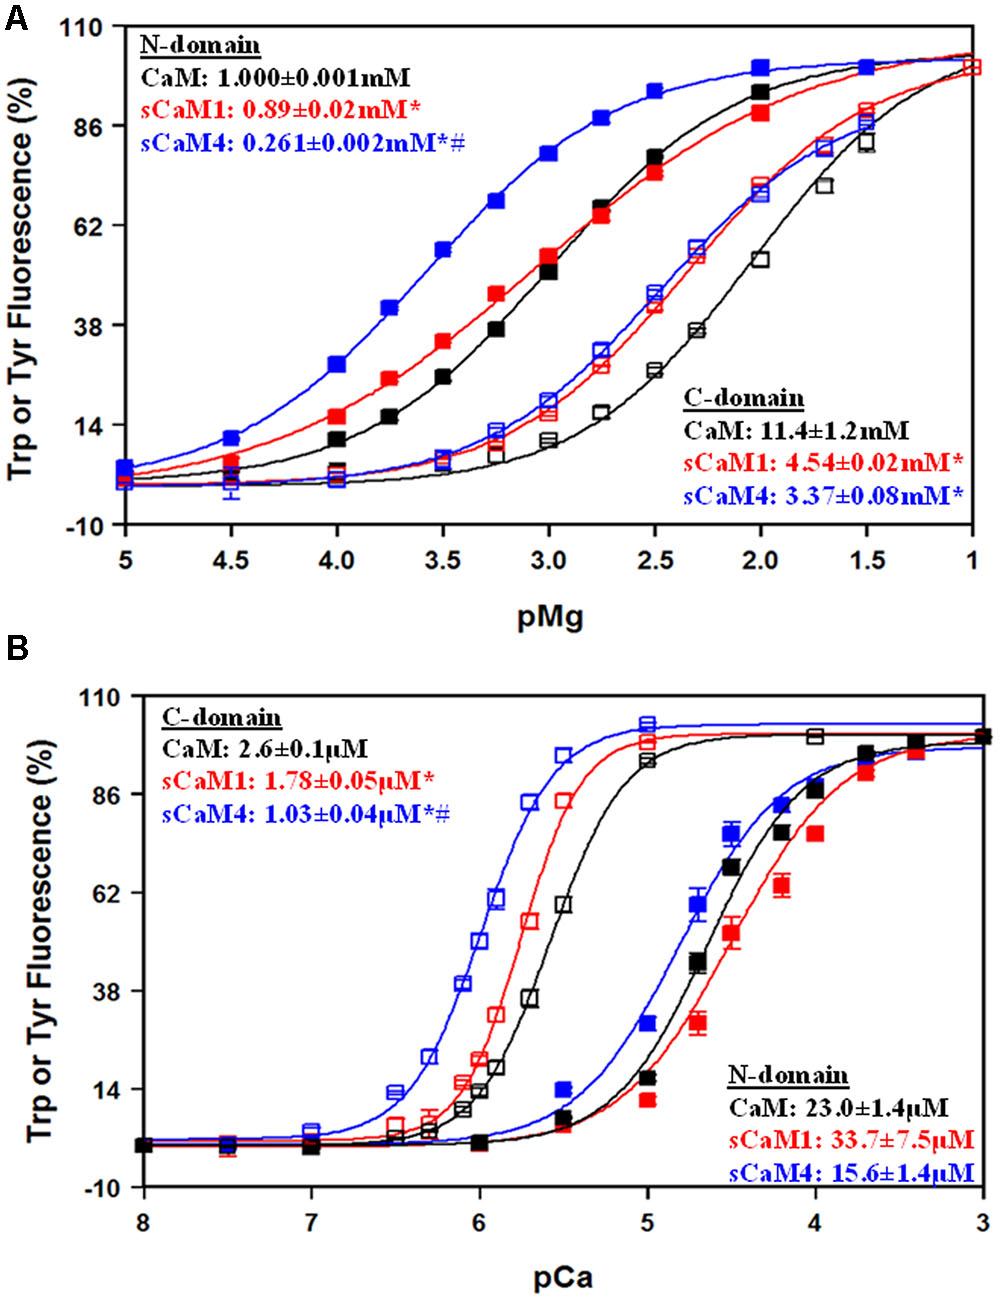
FIGURE 3. Mg2+ Sensitivity for CaM, sCaM1, and sCaM4. (A) Mg2+-dependent change in Trp (N-domain, closed squares) or Tyr (C-domain, open squares) fluorescence as a function of -log[Mg2+] for CaM (black), sCaM1 (red), or sCaM4 (blue). Increasing amounts of Mg2+ were added to 2 mL containing 1 μM of each protein (F19W for Trp, WT for Tyr) in 200 mM MOPS, 150 mM KCl, 2 mM EGTA, pH 7.0 at 20°C. The free [Mg2+] was calculated as described in section “Materials and Methods.” (B) Ca2+-dependent change in Trp (N-domain, closed squares) or Tyr (C-domain, open squares) fluorescence as a function of -log[Ca2+]. Increasing amounts of Ca2+ were added to 2 mL containing 1 μM of each protein (F19W for Trp, WT for Tyr) with 3 mM Mg2+ in the same buffer as (A) at 20°C. Significant difference (p < 0.05) of sCaM1 and sCaM4 from CaM is denoted by (∗) and significant difference of sCaM4 from sCaM1 is denoted by (#). The free [Ca2+] was calculated as described in section “Materials and Methods.” All traces were fit and affinities calculated as described in section “Materials and Methods.”
Mg2+ Dissociation from Isolated CaMs
In order for Ca2+ to bind to the N-domain of CaM in the presence of Mg2+, Mg2+ must first dissociate (Tikunova et al., 2001), adding another layer of regulation for Ca2+ sensing (Davis et al., 2016). Figure 4A shows the rate of Mg2+ dissociation from the N-domain of the F19W CaM isoforms using Trp fluorescence. Despite having distinct N-terminal Mg2+ affinities, the soybean CaMs had nearly identical Mg2+ dissociation rates. Based on these data, Mg2+ should drastically slow the rate of N-domain pocket opening in response to a rise in Ca2+. Figure 4B shows the rate of N-domain pocket opening for the CaMs using 2,6-ANS. As expected, the rate of N-domain pocket opening is now limited by the rate of Mg2+ dissociation. These data suggest that Mg2+ would drastically affect the ability of the N-domain to respond to a rapid Ca2+ transient.
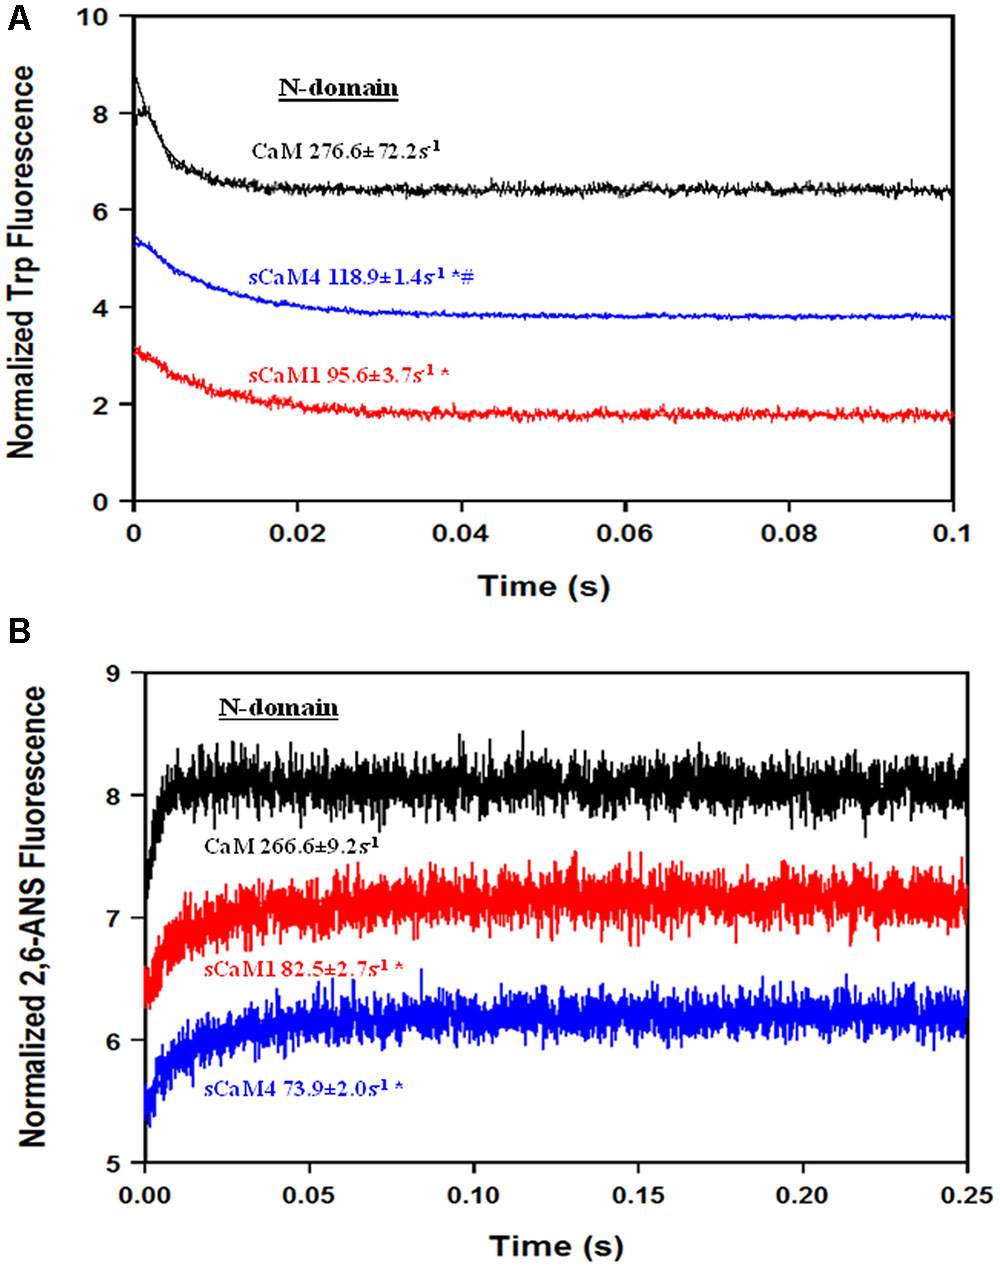
FIGURE 4. Mg2+ dissociation from CaM, sCaM1, and sCaM4. (A) Time course of the change in Trp fluorescence as Mg2+ is removed from CaM (black), sCaM1 (red), and sCaM4 (blue) by EDTA. 1 μM of each F19W protein with 15 μM EGTA and 3 mM Mg2+ in stopped-flow buffer (10 mM MOPS, 150 mM KCl, pH 7.0) was rapidly mixed with an equal volume of 30 mM EDTA in stopped-flow buffer at 20°C. (B) Time course of the change in 2,6-ANS fluorescence as Mg2+ is removed from CaM, sCaM1, and sCaM4 by Ca2+. 2 μM of each WT protein with 1 μM 2,6-ANS, 15 μM EGTA and 3 mM Mg2+ in stopped-flow buffer was rapidly mixed with an equal volume of 2 mM Ca2+ in stopped-flow buffer at 20°C. Significant difference (p < 0.05) of sCaM1 from CaM is denoted by (∗) and significant difference from of sCaM4 from sCaM1 is denoted by (#). All traces in this figure were normalized and displaced vertically for clarity, and were fit as described in section “Materials and Methods.”
Exposure of the Isolated Plant CaMs to Rapid Ca2+ Transients
Figures 5A,B show the response of the N-domain of the plant CaMs to rapid (approximately 0.4 ms half-life) artificial Ca2+ transients (Davis et al., 1999). The percentage of sCaM4 able to bind Ca2+ during the rapid transients was significantly lower than that of sCaM1 (Table 2). Figures 5C,D show the response of the N-domain of the plant CaMs to rapid artificial transients in the presence of Mg2+. Consistent with their similar N-domain Mg2+ dissociation rates, in the presence of Mg2+ the two plant CaMs responded similarly to the rapid artificial Ca2+ transients. Thus, the addition of Mg2+ appears to minimize the differences in the Ca2+ sensing ability between the plant CaMs. Thus, in a cell the rate of Ca2+-binding to the N-domain of CaM will be limited by Mg2+ dissociation.
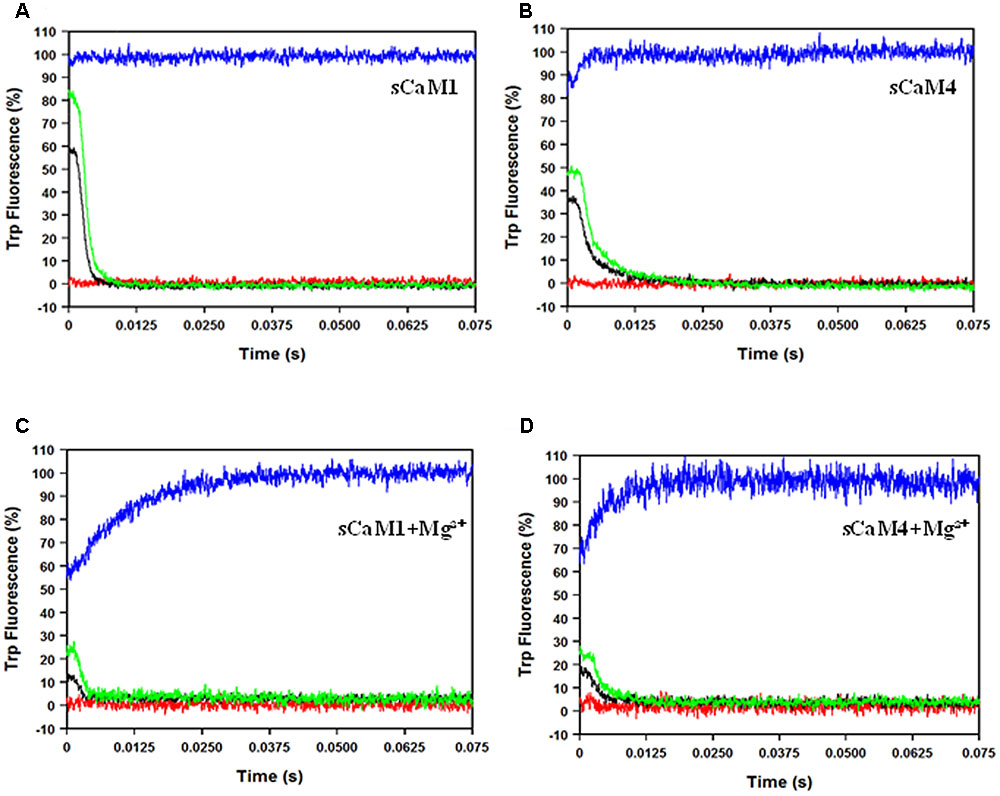
FIGURE 5. sCaM1 and sCaM4 N-terminal response to rapid Ca2+ transients. (A) Time course of the change in Trp fluorescence as sCaM1 is transiently occupied by Ca2+. 2 μM sCaM1F19W with 2 mM EGTA in stopped-flow buffer (10 mM MOPS, 150 mM KCl, pH 7.0) was rapidly mixed with an equal volume of increasing Ca2+ (0 μM (red), 100 μM (black), 250 μM (green), 2.2 mM (blue) in stopped-flow buffer at 20°C. (B) Time course of the change in Trp fluorescence as sCaM4 is transiently occupied by Ca2+. 2μM sCaM4F19W with 2 mM EGTA in stopped-flow buffer was rapidly mixed with an equal volume of increasing Ca2+ (0 μM, 100 μM, 250 μM, 2.2 mM) in stopped-flow buffer at 20°C. (C) Time course of the change in Trp fluorescence as sCaM1 is transiently occupied by Ca2+ in the presence of Mg2+. 2 μM sCaM1F19W with 3 mM Mg2+ and 2 mM EGTA in stopped-flow buffer was rapidly mixed with an equal volume of increasing Ca2+ (0 μM, 100 μM, 250 μM, 2.2 mM) in stopped-flow buffer, plus 3 mM Mg2+ at 20°C. (D) Time course of the change in Trp fluorescence as sCaM4 is transiently occupied by Ca2+ in the presence of Mg2+. 2 μM sCaM4F19W with 3 mM Mg2+ and 2 mM EGTA in stopped-flow buffer was rapidly mixed with an equal volume of increasing Ca2+ (0 μM, 100 μM, 250 μM, 2.2 mM) in stopped-flow buffer plus 3 mM Mg2+ at 20°C. Each trace is an average of at least three separate experiments, each averaging at least five traces, and the visible occupancy for all traces was determined as described in section “Materials and Methods.”
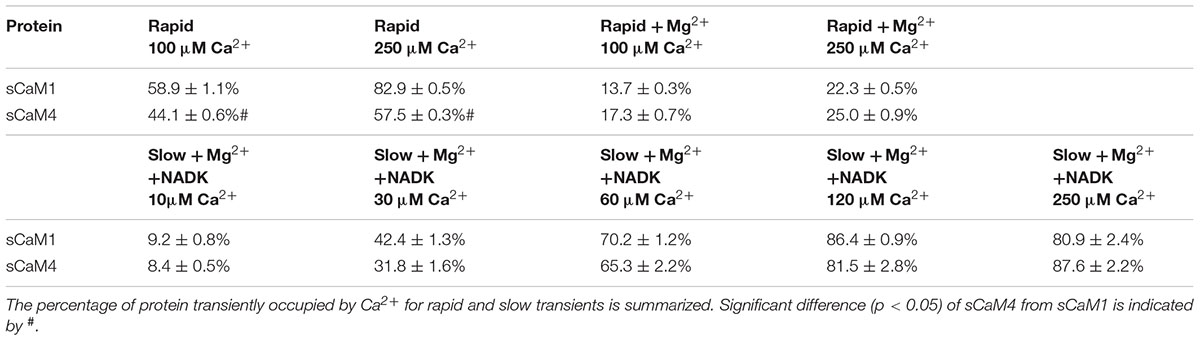
TABLE 2. Summary of sCaM1 and sCaM4 Responses to Ca2+ Transients.
Effects of Target Peptides on the Plant CaMs
Another critical element to understanding the differential regulation of these plant CaMs is their ability to bind targets. We chose to study this phenomenon using two peptides from enzymes known to be competitively inhibited by sCaM4, myosin light chain kinase (MLCK) and NAD kinase (NADK) (Lee et al., 2000). Currently NADK is the only plant enzyme known to be differentially regulated by the soybean CaMs (Lee et al., 1997; Turner et al., 2004). Furthermore, vertebrate CaM is a poor activator of NADK, but a potent activator of MLCK (Roberts et al., 1984). Figure 6 shows the NADK peptide affinity for the Ca2+-saturated CaMs using the intrinsic Trp fluorescence of the peptide. Similar to MLCK (Van Lierop et al., 2002), both plant CaMs bound the NADK peptide with a nearly identical affinity, albeit with a twofold lower affinity than CaM. In agreement with previous work, NADK did not bind the CaMs in the absence of Ca2+ (data not shown) (Turner et al., 2004).
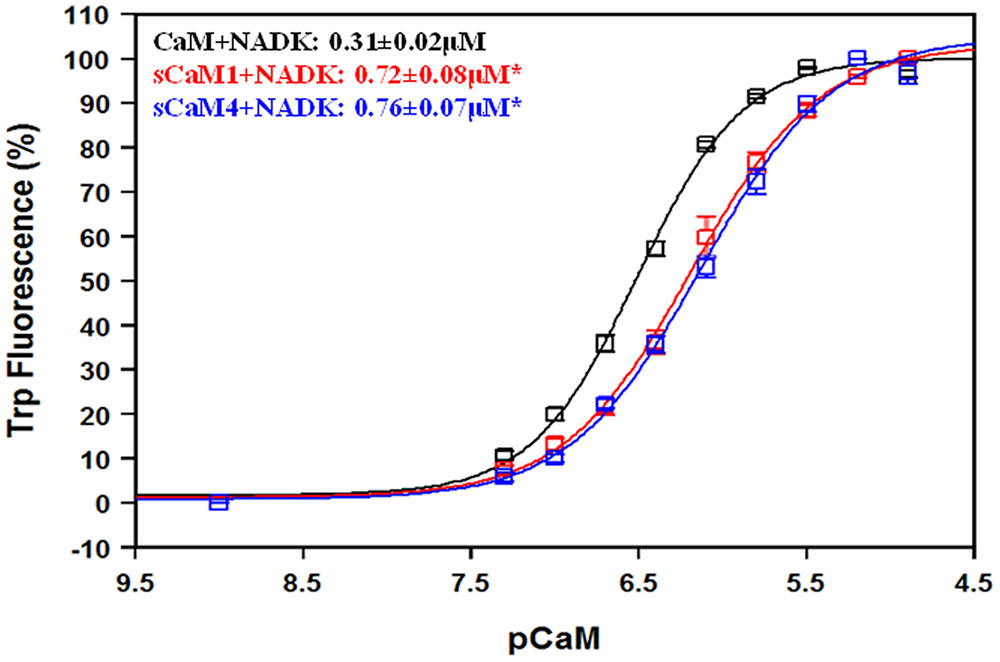
FIGURE 6. NAD kinase affinity for CaM, sCaM1, and sCaM4. The CaM-dependent change in fluorescence for the intrinsic Trp in NADK is shown as a function of -log[CaM] for CaM (black), sCaM1 (red), and sCaM4 (blue). Increasing amounts of each WT protein were added to 2 mL of buffer (200 mM MOPS, 150 mM KCl, 2 mM EGTA, pH 7.0) containing 1 μM NADK with 100 μM Ca2+ (pCa = 4) at 20°C. There was no fluorescence change for any of the CaMs in the absence of Ca2+ (data not shown). Significant difference (p < 0.05) of sCaM1 and sCaM4 from CaM is denoted by (∗). The free [Ca2+] was calculated as described in section “Materials and Methods.” All traces were fit and affinities calculated as described in section “Materials and Methods.”
Figures 7A,B show the apparent Ca2+ sensitivity of the CaMs in the presence of MLCK and NADK peptides using the intrinsic Trp fluorescence of the peptides. In the presence of the MLCK peptide, there was no significant difference in apparent Ca2+ affinity between the CaMs. In the presence of the NADK peptide, the apparent Ca2+ affinity of sCaM4 was only ∼1.5-fold higher than that of sCaM1, but ∼1.5-fold lower than that of CaM. In general, the NADK peptide had a weaker affinity for the Ca2+-saturated CaMs and also had a substantially weaker effect at sensitizing the CaMs to Ca2+ compared to MLCK.
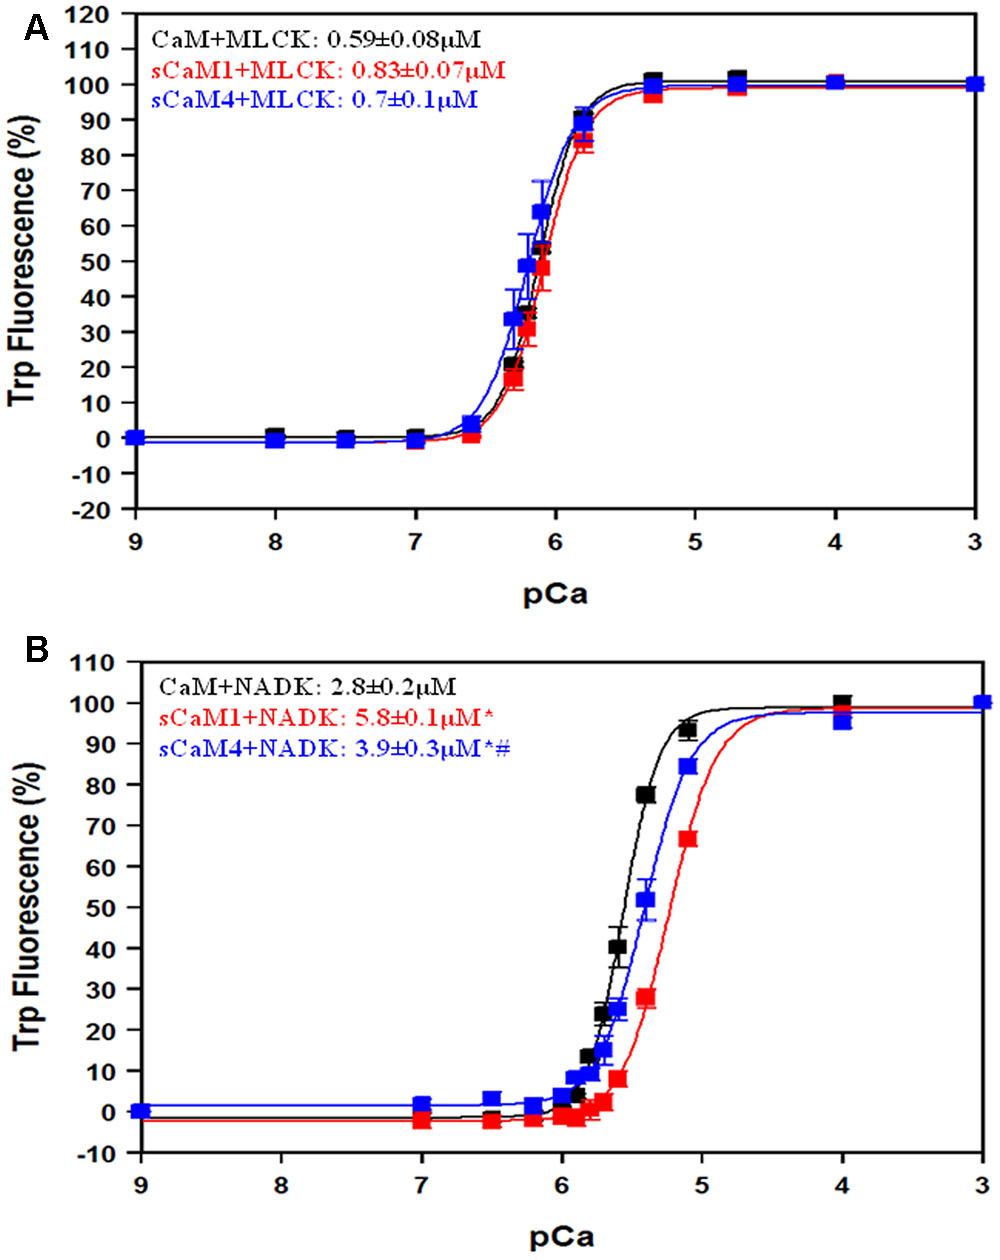
FIGURE 7. Effect of MLCK, NADK peptides on Ca2+ sensitivity for CaM, sCaM1, and sCaM4. (A) Ca2+-dependent change in fluorescence for the intrinsic Trp in MLCK as a function of -log[Ca2+] for CaM (black), sCaM1 (red), and sCaM4 (blue). Increasing amounts of Ca2+ were added to 2 mL buffer (200 mM MOPS, 150 mM KCl, 2 mM EGTA, pH 7.0) containing each WT protein (1 μM) with 4 μM MLCK at 20°C. (B) Ca2+-dependent change in fluorescence for the intrinsic Trp in NADK as a function of -log[Ca2+]. Increasing amounts of Ca2+ were added to 2 mL containing each WT protein (1 μM) with 4 μM NADK in the same buffer as (A) at 20°C. Significant difference (p < 0.05) of sCaM1 and sCaM4 from CaM is denoted by (∗) and significant difference of sCaM4 from sCaM1 is denoted by (#). The free [Ca2+] was calculated as described in section “Materials and Methods.” All traces were fit and affinities calculated as described in section “Materials and Methods.”
Figures 8A,B show the actual Ca2+ dissociation rates from both domains of the CaMs bound to either MLCK or NADK peptides using quin-2 fluorescence. Surprisingly, unlike the MLCK peptide, NADK only marginally slowed the Ca2+ dissociation from the C-terminal domain of sCaM4 and vertebrate CaM (Table 1). This effect was also observed as Ca2+ dissociated from the CaM-peptide complexes by either following the intrinsic Trp fluorescence of the peptides (Figures 8C,D) or the change in fluorescence from IAANS-labeled CaMs (Figures 8E,F). This data suggests that the C-domains of CaM and SCaM4 bind NADK differently than the C-domain of SCaM1. Although there was minimal influence on the C-domain Ca2+ dissociation rate of sCaM4 with NADK, the Ca2+ dissociation rates and structural changes observed were similar to those of sCaM1. Thus, the differences in Ca2+ binding observed in the absence of the peptide are minimized in the presence of a CaM-binding peptide, and cannot explain the differential regulation of the enzyme. Therefore, we expect that the soybean CaMs should respond similarly to a Ca2+ transient in the presence of Mg2+ and NADK.
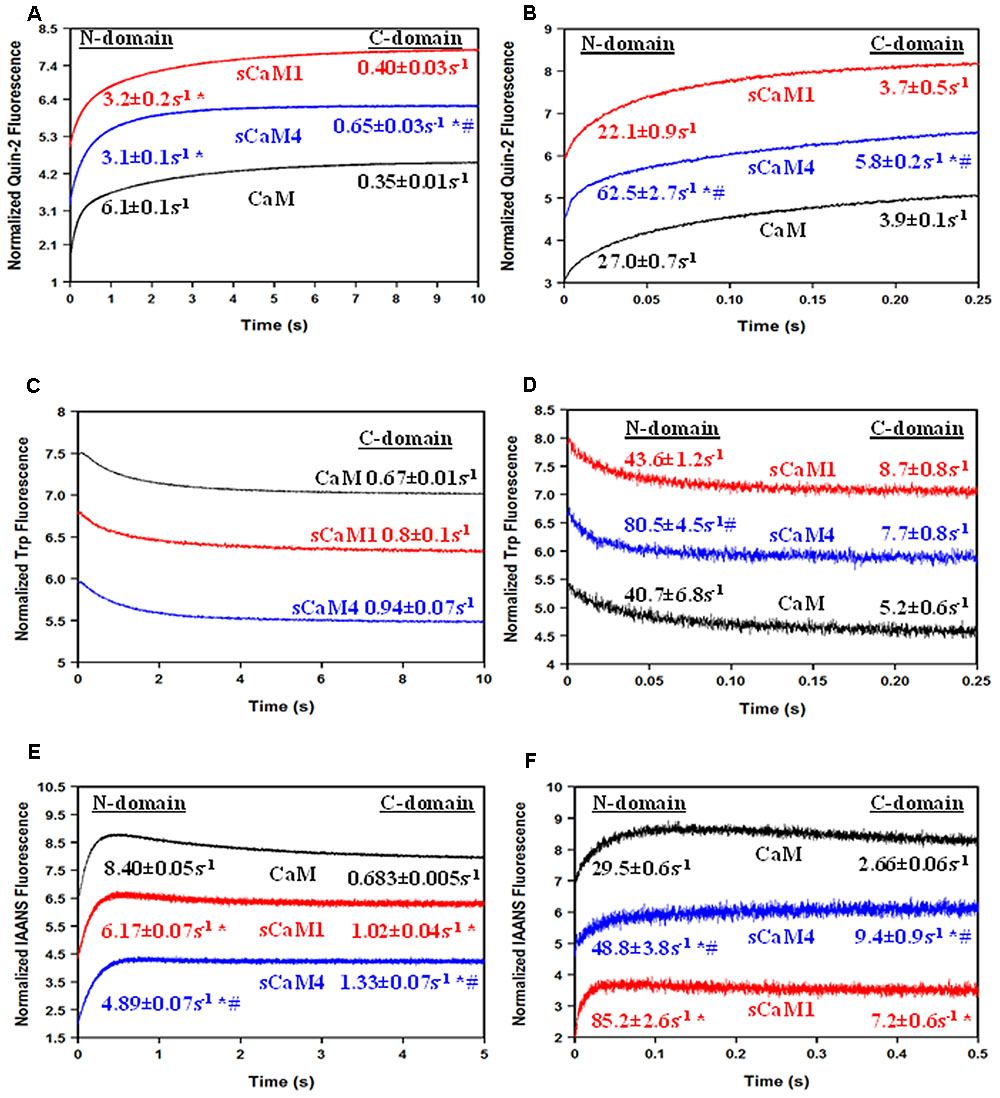
FIGURE 8. Peptide effects on Ca2+ dissociation from CaM, sCaM1, and sCaM4. (A) Time course of the change in quin-2 fluorescence as Ca2+ is removed from the WT CaM+MLCK complex by quin-2. Each protein (6 μM) with 30 μM Ca2+ and 18 μM MLCK in stopped-flow buffer (10 mM MOPS, 150 mM KCl, pH 7.0) was rapidly mixed with an equal volume of 150 μM quin-2 in stopped-flow buffer at 20°C. (B) Time course of the change in quin-2 fluorescence as Ca2+ is removed from the WT CaM+NADK complex by quin-2. Each protein (6 μM) with 30 μM Ca2+ and 18 μM NADK in stopped-flow buffer was rapidly mixed with an equal volume of 150 μM quin-2 in stopped-flow buffer at 20°C. (C) Time course of the change in peptide Trp fluorescence as Ca2+ is removed from the WT CaM+MLCK complex by EGTA. Each protein (1 μM) with 200 μM Ca2+ and 5 μM MLCK in stopped-flow buffer (10 mM MOPS, 150 mM KCl, pH 7.0) was rapidly mixed with an equal volume of 10 mM EGTA in stopped-flow buffer at 20°C. (D) Time course of the change in peptide Trp fluorescence as Ca2+ is removed from the WT CaM+NADK complex by EGTA. Each protein (1 μM) with 200 μM Ca2+ and 5 μM NADK in stopped-flow buffer (10 mM MOPS, 150 mM KCl, pH 7.0) was rapidly mixed with an equal volume of 10 mM EGTA in stopped-flow buffer at 20°C. (E) Time course of the change in IAANS fluorescence as Ca2+ is removed from the WT CaM+MLCK complex by EGTA. Each IAANS-labeled protein (1 μM) with 200 μM Ca2+ and 3 μM MLCK in stopped-flow buffer (10 mM MOPS, 150 mM KCl, pH 7.0) was rapidly mixed with an equal volume of 10 mM EGTA in stopped-flow buffer at 20°C. (F) Time course of the change in IAANS fluorescence as Ca2+ is removed from the WT CaM+NADK complex by EGTA. Each IAANS-labeled protein (1 μM) with 200 μM Ca2+ and 3 μM NADK in stopped-flow buffer (10 mM MOPS, 150 mM KCl, pH 7.0) was rapidly mixed with an equal volume of 10 mM EGTA in stopped-flow buffer at 20°C. Significant difference (p < 0.05) of sCaM1 and sCaM4 from CaM is denoted by (∗) and significant difference from of sCaM4 from sCaM1 is denoted by (#). All traces in this figure were normalized and displaced vertically for clarity, and were fit as described in section “Materials and Methods.”
Exposure of the Plant CaMs to Ca2+ Transients in the Presence of Mg2+ and NADK
Figures 9A,B show the response of the plant CaMs to artificial Ca2+ transients (up to 70 ms half-life) in the presence of physiological Mg2+ and NADK peptide following the change in intrinsic Trp fluorescence from NADK. As we predicted, there was no significant difference in the response of either plant CaM to the Ca2+ transients (Table 2). These data suggest that the plant CaMs may have evolved their differential enzyme regulation without changing their ability to respond to Ca2+ signals.
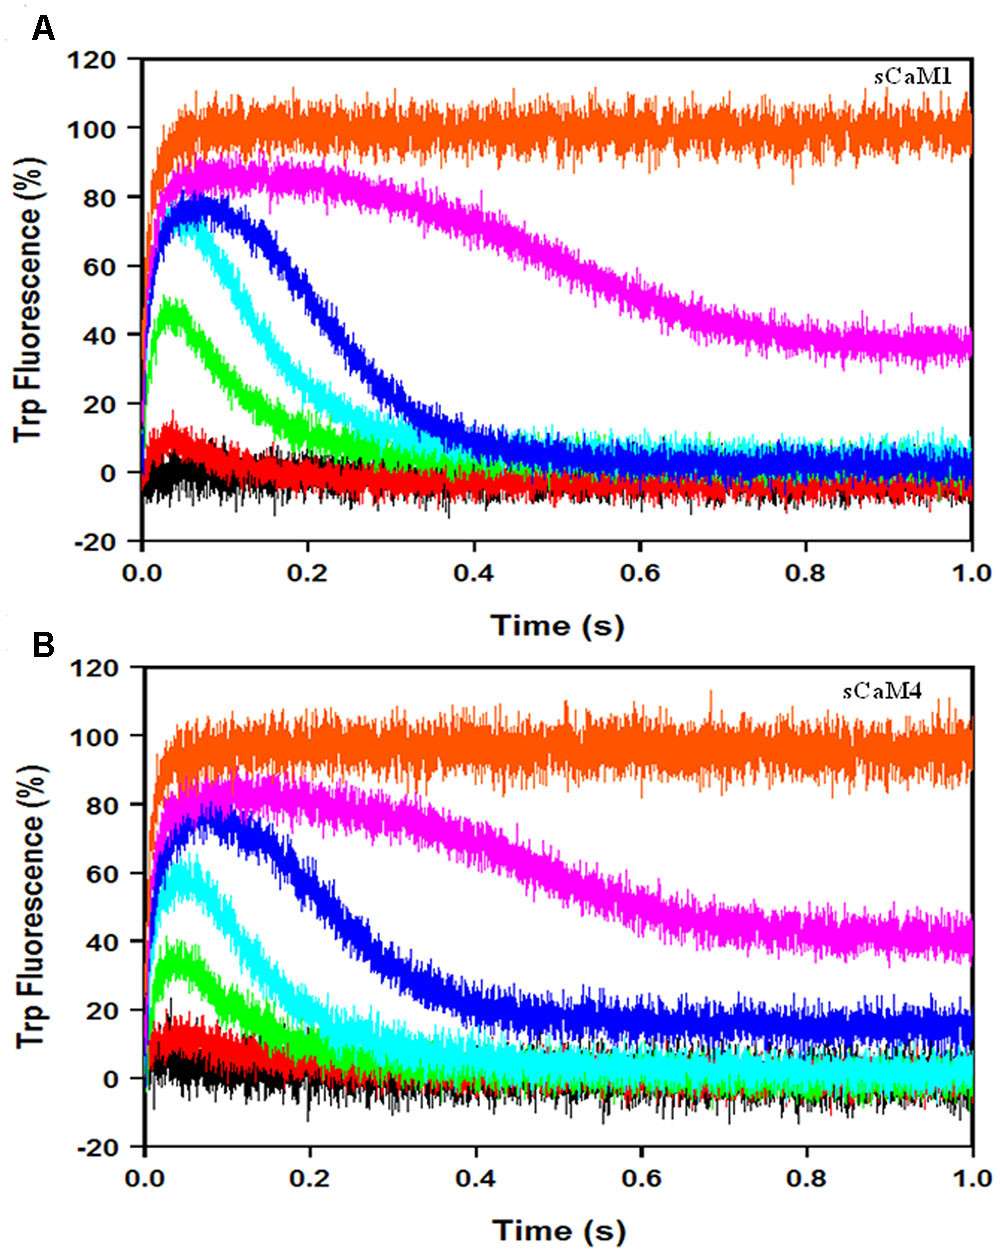
FIGURE 9. sCaM1 and sCaM4 response to slow Ca2+ transients. (A) Time course of change in intrinsic Trp fluorescence in the NADK peptide as sCaM1 is transiently occupied by Ca2+ in the presence of Mg2+. 3 μM WT sCaM1 with 9 μM NADK peptide, 1 mM Mg2+ and 500 μM EDTA in stopped-flow buffer (10 mM MOPS, 150 mM KCl, pH 7.0) plus 1mM Mg2+ was rapidly mixed with an equal volume of increasing Ca2+ [0 μM (black), 10 μM (red), 30 μM (green), 60 μM (cyan), 120 μM (blue), 250 μM (magenta), 2 mM (orange)] in stopped-flow buffer plus 1 mM Mg2+ at 20°C. (B) Time course of change in intrinsic Trp fluorescence in NADK as sCaM4 is transiently occupied by Ca2+ in the presence of Mg2+. 3 μM WT sCaM4 with 9 μM NADK, 1 mM Mg2+ and 500 μM EDTA in stopped-flow buffer plus 1 mM Mg2+ was rapidly mixed with an equal volume of increasing Ca2+ (0, 10, 30, 60, 120, and 250 μM, 2 mM) in stopped-flow buffer plus 1 mM Mg2+ at 20°C. There was no significant difference between sCaM1 and sCaM4 occupancy under these conditions. The visible occupancy for all traces was determined as described in section “Materials and Methods.”
Discussion
Families of CaM genes that encode unique proteins have been found in numerous plant species including A. thaliana, rice, tobacco, and soybean (McCormack and Braam, 2003; Zhao et al., 2013). In the soybean, the sCaM1 and sCaM4 isoforms can differentially activate or inhibit CaM-regulated enzymes from both plants and vertebrates (Lee et al., 1995, 2000). The mechanism by which the various plant CaMs can activate or inhibit select targets is not well understood. There are at least three ways one can envision differential target regulation by CaM: (1) selective target binding (if it doesn’t bind it won’t activate); (2) altered cation binding (either Ca2+ and/or Mg2+); and (3) perturbation of the bound CaM structure (Van Lierop et al., 2002; Karita et al., 2004).
Using a large CaM protein target microarray for the Arabidopsis proteome, the bona fide Arabidopsis CaMs were all shown to cluster into a single hub of protein targets (Popescu et al., 2007). Furthermore, both sCaM1 and sCaM4 bind equally well to the reciprocally regulated enzymes MLCK and neuronal nitric oxide synthase (nNOS) (Cho et al., 1998; Kondo et al., 1999; Van Lierop et al., 2002), suggesting the different CaMs can become competitive antagonists of one another. Although there may be a small subset of CaM protein targets that are unique to a particular plant CaM or have drastically different affinities, the vast majority of targets appear to bind the bona fide plant CaMs. Thus, it would appear that the plant CaMs do not necessarily discriminate in their ability to bind targets to reciprocally activate targets.
Based on the differences in Ca2+ and Mg2+ binding properties of the isolated soybean CaMs (confirmed in this work), it has been proposed that sCaM1 and sCaM4 are tuned to respond to unique Ca2+ signals in order to differentially regulate targets (Gifford et al., 2013). However, our results show that due to their nearly identical Mg2+ dissociation rates, both proteins responded similarly to rapid Ca2+ transients since Ca2+ cannot bind until Mg2+ dissociates. Furthermore, in cells there is little free CaM in the cytoplasm since CaM is mostly pre-bound to its targets (Maier et al., 2006; Yang et al., 2014). In the presence of both physiological Mg2+ and a target peptide, sCaM1 and sCaM4 responded nearly identically to slow Ca2+ transients. Thus, for NADK, the only plant enzyme known to be differentially regulated by the sCaMs, the differential regulation does not appear to be due to an altered response to the Ca2+ signal.
Our current data with the NADK peptide, as well as previous work, suggest the competitive antagonism of sCaM1 and sCaM4 occurs through an altered mode of CaM binding to the enzymes (Van Lierop et al., 2002; Karita et al., 2004). In the case of MLCK, there does not appear to be a difference in how the CaMs bind the target peptide, but in the subsequent structural change required to activate the enzyme. In fact, the residues responsible for the inhibition of MLCK by sCaM4 are found on the outside surface of sCaM4 rather than in the peptide binding interface (Van Lierop et al., 2002). However, our data suggest that sCaM4 binds the NADK peptide differently from sCaM1, at least at the C-terminal domain. This altered structure may prevent the structural change in the enzyme required for activation.
In summary, although the sCaM1 and sCaM4 isoforms had unique cation binding properties in isolation, in the more physiological situation with competition from Mg2+ and the presence of a target peptide, the plant CaMs responded indistinguishably to Ca2+ transients. This suggests that the plant CaMs have conserved their response to Ca2+ signals throughout their evolution. Thus, the CaMs respond to the same Ca2+ signals while only activating certain enzymes through altered modes of binding. This would allow the plant during times of stress to maintain essential CaM activities, activate additional signaling nodes that were not necessary under normal circumstances, and turn off subsets of signaling nodes that might exacerbate the stress. By comparing how naturally occurring CaM isoforms from other species diverge from vertebrate CaM, we can learn more about how changes in the CaM sequence alter downstream target function and cellular responses. In the future, we may be able to smartly engineer CaMs with specific properties that could be used as therapeutics for human disease (Davis et al., 2016; Walton et al., 2016) or better equip plants against biotic or abiotic stressors (Zeng et al., 2015).
Author Contributions
JD and SW designed the experiments and along with ST wrote the manuscript. SW, HC, and VS performed the stopped-flow experiments. HC, AO, and JS performed the steady-state experiments. BJ developed the CaMT5C constructs.
Funding
This work was supported by National Institutes of Health Grants R56 HL091986 and R01 HL132213 (JD).
Conflict of Interest Statement
The authors declare that the research was conducted in the absence of any commercial or financial relationships that could be construed as a potential conflict of interest.
Acknowledgment
We thank Dr. Brandon Biesiadecki for many helpful discussions.
References
Al-Quraan, N. (2008). Role of Arabidopsis thaliana Calmodulin Isoforms in Tolerance to Abiotic Stress. Available at: http://search.proquest.com/docview/304688905
Batistič, O., and Kudla, J. (2012). Analysis of calcium signaling pathways in plants. Biochim. Biophys. Acta 1820, 1283–1293. doi: 10.1016/j.bbagen.2011.10.012
Berridge, M. J., and Galione, A. (1988). Cytosolic calcium oscillators. FASEB J. 2, 3074–3082. doi: 10.1038/27094
Bers, D. M., Patton, C. W., and Nuccitelli, R. (2010). A practical guide to the preparation of Ca2+ buffers. Methods Cell Biol. 99, 1–26. doi: 10.1016/B978-0-12-374841-6.00001-3
Black, D. J., Tikunova, S. B., Johnson, J. D., and Davis, J. P. (2000). Acid pairs increase the N-terminal Ca2+ affinity of CaM by increasing the rate of Ca2+ association. Biochemistry 39, 13831–13837.
Cho, M. J., Vaghy, P. L., Kondo, R., Lee, S. H., Davis, J. P., Rehl, R., et al. (1998). Reciprocal regulation of mammalian nitric oxide synthase and calcineurin by plant calmodulin isoforms. Biochemistry 37, 15593–15597. doi: 10.1021/bi981497g
Davis, J. P., Norman, C., Kobayashi, T., Solaro, R. J., Swartz, D. R., and Tikunova, S. B. (2007). Effects of thin and thick filament proteins on calcium binding and exchange with cardiac troponin C. Biophys. J. 92, 3195–3206. doi: 10.1529/biophysj.106.095406
Davis, J. P., Rall, J. A., Alionte, C., and Tikunova, S. B. (2004). Mutations of hydrophobic residues in the N-terminal domain of troponin C affect calcium binding and exchange with the troponin C- troponin I96-148 complex and muscle force production. J. Biol. Chem. 279, 17348–17360. doi: 10.1074/jbc.M314095200
Davis, J. P., Rall, J. A., Reiser, P. J., Smillie, L. B., and Tikunova, S. B. (2002). Engineering competitive magnesium binding into the first EF-hand of skeletal troponin C. J. Biol. Chem. 277, 49716–49726. doi: 10.1074/jbc.M208488200
Davis, J. P., Shettigar, V., Tikunova, S. B., Little, S. C., Liu, B., Siddiqui, J. K., et al. (2016). Designing proteins to combat disease: cardiac troponin C as an example. Arch. Biochem. Biophys. 601, 4–10. doi: 10.1016/j.abb.2016.02.007
Davis, J. P., Tikunova, S. B., Walsh, M. P., and Johnson, J. D. (1999). Characterizing the response of calcium signal transducers to generated calcium transients. Biochemistry 38, 4235–4244. doi: 10.1021/bi982495z
Dodd, A. N., Kudla, J., and Sanders, D. (2010). The language of calcium signaling. Annu. Rev. Plant Biol. 61, 593–620. doi: 10.1146/annurev-arplant-070109-104628
Dupont, G., Houart, G., and De Koninck, P. (2003). Sensitivity of CaM kinase II to the frequency of Ca2+ oscillations: a simple model. Cell Calcium 34, 485–497. doi: 10.1016/S0143-4160(03)00152-0
Fink, A. L. (1995). Compact intermediate states in protein folding. Annu. Rev. Biophys. Biomol. Struct. 24, 495–522. doi: 10.1146/annurev.bb.24.060195.002431
Friedberg, F., and Rhoads, A. R. (2001). Evolutionary aspects of calmodulin. IUBMB Life 51, 215–221. doi: 10.1080/152165401753311753
Garcia, J. G., Lazar, V., Gilbert-McClain, L. I., Gallagher, P. J., and Verin, A. D. (1997). Myosin light chain kinase in endothelium: molecular cloning and regulation. Am. J. Respir. Cell Mol. Biol. 16, 489–494. doi: 10.1165/ajrcmb.16.5.9160829
George, S. E., Su, Z., Fan, D., Wang, S., and Johnson, J. D. (1996). The fourth EF-hand of calmodulin and its helix-loop-helix components: impact on calcium binding and enzyme activation. Biochemistry 35, 8307–8313. doi: 10.1021/bi960495y
Gifford, J. L., Jamshidiha, M., Mo, J., Ishida, H., and Vogel, H. J. (2013). Comparing the calcium binding abilities of two soybean calmodulins: towards understanding the divergent nature of plant calmodulins. Plant Cell 25, 4512–4524. doi: 10.1105/tpc.113.113183
Hawe, A., Sutter, M., and Jiskoot, W. (2008). Extrinsic fluorescent dyes as tools for protein characterization. Pharm. Res. 25, 1487–1499. doi: 10.1007/s11095-007-9516-9
He, W.-Q., Qiao, Y.-N., Zhang, C., Peng, Y.-J., Chen, C., Wang, P., et al. (2011). Role of myosin light chain kinase in regulation of basal blood pressure and maintenance of salt-induced hypertension. AJP Heart Circ. Physiol. 301, H584–H591. doi: 10.1152/ajpheart.01212.2010
Hoffman, L., Chandrasekar, A., Wang, X., Putkey, J. A., and Waxham, M. N. (2014). Neurogranin alters the structure and calcium binding properties of calmodulin. J. Biol. Chem. 289, 14644–14655. doi: 10.1074/jbc.M114.560656
Johnson, J. D., Snyder, C., Walsh, M., and Flynn, M. (1996). Effects of myosin light chain kinase and peptides on Ca2+ exchange with the N- and C-terminal Ca2+ binding sites of calmodulin. J. Biol. Chem. 271, 761–767. doi: 10.1074/jbc.271.2.761
Karita, E., Yamakawa, H., Mitsuhara, I., Kuchitsu, K., and Ohashi, Y. (2004). Three types of tobacco calmodulins characteristically activate plant NAD kinase at different Ca2+ concentrations and pHs. Plant Cell Physiol. 45, 1371–1379. doi: 10.1093/pcp/pch158
Klee, C. B., Crouch, T. H., and Richman, P. G. (1980). Calmodulin. Annu. Rev. Biochem. 49, 489–515. doi: 10.1146/annurev.bi.49.070180.002421
Kondo, R., Tikunova, S. B., Cho, M. J., and Johnson, J. D. (1999). A point mutation in a plant calmodulin is responsible for its inhibition of nitric-oxide synthase. J. Biol. Chem. 274, 36213–36218.
Kursula, P. (2014). The many structural faces of calmodulin: a multitasking molecular jackknife. Amino Acids 46, 2295–2304. doi: 10.1007/s00726-014-1795-y
Lee, S., Kim, J., Lee, M., Heo, W., Seo, H., Yoon, H., et al. (1995). Identification of a novel divergent calmodulin isoform from soybean which has differential ability to activate calmodulin-dependent enzymes. J. Biol. Chem. 270, 21806–21812. doi: 10.1074/jbc.270.37.21806
Lee, S. H., Johnson, J. D., Walsh, M. P., Van Lierop, J. E., Sutherland, C., Xu, A., et al. (2000). Differential regulation of Ca2+/calmodulin-dependent enzymes by plant calmodulin isoforms and free Ca2+ concentration. Biochem. J. 350, 299–306.
Lee, S. H., Seo, H. Y., Kim, J. C., Heo, W. D., Chung, W. S., Lee, K. J., et al. (1997). Differential activation of NAD kinase by plant calmodulin isoforms: the critical role of domain I. J. Biol. Chem. 272, 9252–9259. doi: 10.1074/jbc.272.14.9252
Linse, S., and Forsén, S. (1995). Determinants that govern high-affinity calcium binding. Adv. Second Messenger Phosphoprotein Res. 30, 89–151.
Linse, S., Helmersson, A., and Forsén, S. (1991). Calcium binding to calmodulin and its globular domains. J. Biol. Chem. 266, 8050–8054.
Maier, L. S., Ziolo, M. T., Bossuyt, J., Persechini, A., Mestril, R., and Bers, D. M. (2006). Dynamic changes in free Ca-calmodulin levels in adult cardiac myocytes. J. Mol. Cell. Cardiol. 41, 451–458. doi: 10.1016/j.yjmcc.2006.04.020
Martin, S. R., Andersson Teleman, A., Bayley, P. M., Drakenberg, T., and Forsen, S. (1985). Kinetics of calcium dissociation from calmodulin and its tryptic fragments. A stopped-flow fluorescence study using Quin 2 reveals a two-domain structure. Eur. J. Biochem. 151, 543–550.
Martin, S. R., Maune, J. F., Beckingham, K., and Bayley, P. M. (1992). Stopped-flow studies of calcium dissociation from calcium-binding-site mutants of Drosophila melanogaster calmodulin. Eur. J. Biochem. 205, 1107–1114.
Maximciuc, A. A., Putkey, J. A., Shamoo, Y., and Mackenzie, K. R. (2006). Complex of calmodulin with a ryanodine receptor target reveals a novel, flexible binding mode. Structure 14, 1547–1556. doi: 10.1016/j.str.2006.08.011
McCormack, E., and Braam, J. (2003). Calmodulins and related potential calcium sensors of Arabidopsis. New Phytol. 159, 585–598. doi: 10.1046/j.1469-8137.2003.00845.x
McCormack, E., Tsai, Y.-C., and Braam, J. (2005). Handling calcium signaling: Arabidopsis CaMs and CMLs. Trends Plant Sci. 10, 383–389. doi: 10.1016/j.tplants.2005.07.001
Means, A. R., VanBerkum, M. F., Bagchi, I., Lu, K. P., and Rasmussen, C. D. (1991). Regulatory functions of calmodulin. Pharmacol. Ther. 50, 255–270.
Mehta, S., Aye-Han, N. N., Ganesan, A., Oldach, L., Gorshkov, K., and Zhang, J. (2014). Calmodulin-controlled spatial decoding of oscillatory Ca2+ signals by calcineurin. Elife 3, 1–22. doi: 10.7554/eLife.03765
Nyegaard, M., Overgaard, M. T., Søndergaard, M. T., Vranas, M., Behr, E. R., Hildebrandt, L. L., et al. (2012). Mutations in calmodulin cause ventricular tachycardia and sudden cardiac death. Am. J. Hum. Genet. 91, 703–712. doi: 10.1016/j.ajhg.2012.08.015
O’Day, D. H., Eshak, K., and Myre, M. A. (2015). Calmodulin binding proteins and Alzheimer’s disease. J. Alzheimers Dis. 46, 553–569. doi: 10.3233/JAD-142772
Ohki, S. Y., Ikura, M., and Zhang, M. (1997). Identification of Mg2+-binding sites and the role of Mg2+ on target recognition by calmodulin. Biochemistry 36, 4309–4316. doi: 10.1021/bi962759m
Park, H. C., Kim, M. L., Kang, Y. H., Jeong, J. C., Cheong, M. S., Choi, W., et al. (2009). Functional analysis of the stress-inducible soybean calmodulin isoform-4 (GmCaM-4) promoter in transgenic tobacco plants. Mol. Cells 27, 475–480. doi: 10.1007/s10059-009-0063-6
Persechini, A., Stemmer, P. M., and Ohashi, I. (1996). Localization of unique functional determinants in the calmodulin lobes to individual EF hands. J. Biol. Chem. 271, 32217–32225.
Petersen, O. H., Michalak, M., and Verkhratsky, A. (2005). Calcium signalling: past, present and future. Cell Calcium 38, 161–169. doi: 10.1016/j.ceca.2005.06.023
Popescu, S. C., Popescu, G. V., Bachan, S., Zhang, Z., Seay, M., Gerstein, M., et al. (2007). Differential binding of calmodulin-related proteins to their targets revealed through high-density Arabidopsis protein microarrays. Proc. Natl. Acad. Sci. U.S.A. 104, 4730–4735. doi: 10.1073/pnas.0611615104
Putkey, J. A., Kleerekoper, Q., Gaertner, T. R., and Waxham, M. N. (2003). A new role for IQ motif proteins in regulating calmodulin function. J. Biol. Chem. 278, 49667–49670. doi: 10.1074/jbc.C300372200
Roberts, D. M., Burgess, W. H., and Watterson, D. M. (1984). Comparison of the NAD kinase and myosin light chain kinase activator properties of vertebrate, higher plant, and algal calmodulins. Plant Physiol. 75, 796–798. doi: 10.1104/pp.75.3.796
Robertson, S., and Potter, J. D. (1984). “The regulation of free Ca2+ ion concentration by metal chelators,” in Myocardial Biology, ed. A. Schwartz (Boston, MA: Springer), 63–75. doi: 10.1007/978-1-4684-4778-1_6
Shettigar, V., Zhang, B., Little, S. C., Salhi, H. E., Hansen, B. J., Li, N., et al. (2016). Rationally engineered Troponin C modulates in vivo cardiac function and performance in health and disease. Nat. Commun. 7:10794. doi: 10.1038/ncomms10794
Studier, F., and Moffatt, B. (1986). Use of bacteriophage T7 RNA polymerase to direct selective high-level expression of cloned genes. J. Mol. Biol. 189, 113–130. doi: 10.1016/0022-2836(86)90385-2
Tidow, H., and Nissen, P. (2013). Structural diversity of calmodulin binding to its target sites. FEBS J. 280, 5551–5565. doi: 10.1111/febs.12296
Tikunova, S. B., Black, D. J., Johnson, J. D., and Davis, J. P. (2001). Modifying Mg2+ binding and exchange with the N-terminal of calmodulin. Biochemistry 40, 3348–3353. doi: 10.1021/bi0021333
Tikunova, S. B., and Davis, J. P. (2004). Designing calcium-sensitizing mutations in the regulatory domain of cardiac troponin C. J. Biol. Chem. 279, 35341–35352. doi: 10.1074/jbc.M405413200
Tikunova, S. B., Liu, B., Swindle, N., Little, S. C., Gomes, A. V., Swartz, D. R., et al. (2010). Effect of calcium-sensitizing mutations on calcium binding and exchange with troponin C in increasingly complex biochemical systems. Biochemistry 49, 1975–1984. doi: 10.1021/bi901867s
Tikunova, S. B., Rall, J. A., and Davis, J. P. (2002). Effect of hydrophobic residue substitutions with glutamine on Ca 2+ binding and exchange with the N-domain of troponin C†. Biochemistry 41, 6697–6705. doi: 10.1021/bi011763h
Toutenhoofd, S. L., and Strehler, E. E. (2000). The calmodulin multigene family as a unique case of genetic redundancy: multiple levels of regulation to provide spatial and temporal control of calmodulin pools? Cell Calcium 28, 83–96. doi: 10.1054/ceca.2000.0136
Trybus, K. M. (2008). Myosin V from head to tail. Cell. Mol. Life Sci. 65, 1378–1389. doi: 10.1007/s00018-008-7507-6
Turner, W., Waller, J., Vanderbeld, B., and Snedden, W. (2004). Cloning and characterization of two NAD kinases from Arabidopsis. Identification of a calmodulin binding isoform. Plant Physiol. 135, 1243–1255. doi: 10.1104/pp.104.040428.1
Van Lierop, J. E., Wilson, D. P., Davis, J. P., Tikunova, S., Sutherland, C., Walsh, M. P., et al. (2002). Activation of smooth muscle myosin light chain kinase by calmodulin. Role of LYS(30) and GLY(40). J. Biol. Chem. 277, 6550–6558. doi: 10.1074/jbc.M111404200
VanScyoc, W. S., Sorensen, B. R., Rusinova, E., Laws, W. R., Ross, J. B. A., and Shea, M. A. (2002). Calcium binding to calmodulin mutants monitored by domain-specific intrinsic phenylalanine and tyrosine fluorescence. Biophys. J. 83, 2767–2780. doi: 10.1016/S0006-3495(02)75286-7
Villarroel, A., Taglialatela, M., Bernardo-Seisdedos, G., Alaimo, A., Agirre, J., Alberdi, A., et al. (2014). The ever changing moods of calmodulin: how structural plasticity entails transductional adaptability. J. Mol. Biol. 426, 2717–2735. doi: 10.1016/j.jmb.2014.05.016
Walton, S. D., Ho, H.-T., Elizaga, N. M., Siddiqui, J. K., O’Neil, A. J., Neilson, N. A., et al. (2016). Engineering an anti-arrhythmic calmodulin. Biophys. J. 110:217a. doi: 10.1016/j.bpj.2015.11.1204
Waters, B. M. (2011). Moving magnesium in plant cells. New Phytol. 190, 510–513. doi: 10.1111/j.1469-8137.2011.03724.x
Wu, X., and Bers, D. M. (2007). Free and bound intracellular calmodulin measurements in cardiac myocytes. Cell Calcium 41, 353–364. doi: 10.1016/j.ceca.2006.07.011
Xu, X., Yano, M., Uchinoumi, H., Hino, A., Suetomi, T., Ono, M., et al. (2010). Defective calmodulin binding to the cardiac ryanodine receptor plays a key role in CPVT-associated channel dysfunction. Biochem. Biophys. Res. Commun. 394, 660–666. doi: 10.1016/j.bbrc.2010.03.046
Yang, Y., Guo, T., Oda, T., Chakraborty, A., Chen, L., Uchinoumi, H., et al. (2014). Cardiac myocyte Z-line calmodulin is mainly RyR2-bound and reduction is arrhythmogenic and occurs in heart failure. Circ. Res. 114, 295–306. doi: 10.1161/CIRCRESAHA.114.302857
Zeng, H., Xu, L., Singh, A., Wang, H., Du, L., and Poovaiah, B. W. (2015). Involvement of calmodulin and calmodulin-like proteins in plant responses to abiotic stresses. Front. Plant Sci. 6:600. doi: 10.3389/fpls.2015.00600
Zhang, J., Shettigar, V., Zhang, G. C., Kindell, D. G., Liu, X., López, J. J., et al. (2011). Engineering parvalbumin for the heart: optimizing the Mg2+ binding properties of rat β-parvalbumin. Front. Physiol. 2:77. doi: 10.3389/fphys.2011.00077
Keywords: calmodulin (CaM), calcium, magnesium, soybean, differential regulation
Citation: Walton SD, Chakravarthy H, Shettigar V, O’Neil AJ, Siddiqui JK, Jones BR, Tikunova SB and Davis JP (2017) Divergent Soybean Calmodulins Respond Similarly to Calcium Transients: Insight into Differential Target Regulation. Front. Plant Sci. 8:208. doi: 10.3389/fpls.2017.00208
Received: 02 December 2016; Accepted: 03 February 2017;
Published: 15 February 2017.
Edited by:
John Love, University of Exeter, UKCopyright © 2017 Walton, Chakravarthy, Shettigar, O’Neil, Siddiqui, Jones, Tikunova and Davis. This is an open-access article distributed under the terms of the Creative Commons Attribution License (CC BY). The use, distribution or reproduction in other forums is permitted, provided the original author(s) or licensor are credited and that the original publication in this journal is cited, in accordance with accepted academic practice. No use, distribution or reproduction is permitted which does not comply with these terms.
*Correspondence: Jonathan P. Davis, ZGF2aXMuODEyQG9zdS5lZHU=