- Institute of Biological, Environmental and Rural Sciences, Aberystwyth University, Aberystwyth, UK
White clover is a short-lived perennial whose persistence is greatly affected by abiotic stresses, particularly drought. The aim of this work was to characterize its molecular response to water deficit and recovery following re-hydration to identify targets for the breeding of tolerant varieties. We created a white clover reference transcriptome of 16,193 contigs by deep sequencing (mean base coverage 387x) four Suppression Subtractive Hybridization (SSH) libraries (a forward and a reverse library for each treatment) constructed from young leaf tissue of white clover at the onset of the response to drought and recovery. Reads from individual libraries were then mapped to the reference transcriptome and processed comparing expression level data. The pipeline generated four robust sets of transcripts induced and repressed in the leaves of plants subjected to water deficit stress (6,937 and 3,142, respectively) and following re-hydration (6,695 and 4,897, respectively). Semi-quantitative polymerase chain reaction was used to verify the expression pattern of 16 genes. The differentially expressed transcripts were functionally annotated and mapped to biological processes and pathways. In agreement with similar studies in other crops, the majority of transcripts up-regulated in response to drought belonged to metabolic processes, such as amino acid, carbohydrate, and lipid metabolism, while transcripts involved in photosynthesis, such as components of the photosystem and the biosynthesis of photosynthetic pigments, were up-regulated during recovery. The data also highlighted the role of raffinose family oligosaccharides (RFOs) and the possible delayed response of the flavonoid pathways in the initial response of white clover to water withdrawal. The work presented in this paper is to our knowledge the first large scale molecular analysis of the white clover response to drought stress and re-hydration. The data generated provide a valuable genomic resource for marker discovery and ultimately for the improvement of white clover.
Introduction
White clover (Trifolium repens L.) is an important component of sustainable agricultural systems, because of its high nutritional value and the ability of fixing atmospheric nitrogen. It is grown in temperate regions, mainly in mixed swards with companion ryegrass. White clover propagates and persists primarily by stolons. As the plant grows, the stolons break generating a large number of smaller plants. At this stage, the plants become more vulnerable to biotic and abiotic stresses (Brock et al., 1988; Fothergill et al., 1997; Sanderson et al., 2003) and the white clover component within a sward can undergo a dramatic decline, the so called “clover crash” (Fothergill et al., 1996). This phenomenon makes the crop performance unreliable and therefore less attractive to farmers, as the crop benefits are of little use, unless coupled with good persistence.
Water deficiency is one of the environmental factors most effecting crop productivity and its negative effects on white clover are well documented. A 30 year study in Australia showed that water availability was the main limiting factor in white clover persistence (Hutchinson et al., 1995), while Belaygue and colleagues observed an 80% decrease in stolon numbers as a result of just a 30% decrease in relative water content in five different genotypes of white clover (Belaygue et al., 1996).
White clover is recognized to be not as adapted to drought conditions as other forage legumes, such as lucerne. This is mainly due to its shallow rooted system and its poor control of stomata closure (Hart, 1987). Additionally, very limited variability in terms of drought tolerance has been found amongst the white clover genotypes available (Abberton and Marshall, 2005), hence the need to develop molecular tools that make the identification of source of variation more efficient than methods based entirely on phenotypic characterization (Prohens, 2011). The development of genomic resources for forage legumes has been slower than for grain legumes and other crops because of the complexity of their genome, heterozygosity and polyploidy (Annicchiarico et al., 2015). However, the number of transcription profiling is steadily growing and is available not only for model species, such as Medicago truncatula, but also for legume crops, such as soybean, chickpea, pigeonpea (Chen et al., 2008; Pandey et al., 2016 and references therein). In particular, transcriptome profiling of red clover under prolonged drought stress has recently become available (Yates et al., 2014). This work has provided useful insights in the response to drought of a crop phylogenetically close to white clover. However, red and white clovers are quite different in their growth habits and there was a need for investigating white clover response at an early stage of droughting, when the crop is most affected (Fothergill et al., 1996).
Several approaches are available for studying transcription profiling from early methods, such as Expressed Sequence Tags (EST) and Suppression Subtractive Hybridization (SSH), through to microarray technology and more recently Next Generation Sequencing (NGS) platforms (Deshmukh et al., 2014). SSH is a powerful technique for the amplification of differentially expressed genes by simultaneous amplification and suppression of target and non-target sequences, respectively (Diatchenko et al., 1996). Despite the advent of next generation sequencing, SSH is still a popular technique because of the relatively low cost, low amount of starting material and the relatively low rate of false positives. It is however quite laborious and costly if the number of sequenced clones is increased to several thousands.
We have revisited four SSH libraries constructed from leaf tissue of white clover plants subjected to and recovering from drought stress (Bisaga, 2013). In this work, only the forward drought and recovery libraries were sequenced, yielding 1,127 and 2,405 unigenes, respectively. By replacing the cloning step with Illumina technology sequencing, we were able to exploit the already available SSH libraries more efficiently by sequencing both forward and reverse libraries at a deep coverage (387x). This allowed us to identify 6,937 and 3,142 transcripts up- and down-regulated, respectively, in response to drought, and 6,695 and 4,897, in response to re-hydration, providing a global picture of transcriptional changes occurring in white clover under the two treatments.
Most published studies analyze the effects of water deprivation on white clover from an agronomic and physiological point of view, but no studies are available in which the effect of water deprivation is characterized at a molecular level. This work is, to our knowledge, the first report of a large scale molecular study on the response of white clover to drought and re-hydration.
Materials and Methods
Plant Material and Growth Conditions
The white clover (T. repens L.) R3R4 genotype, isolated at IBERS for research purposes, was used in this study (Febrer et al., 2007).
Forty eight clonal cuttings of R3R4 were grown in 3.5 inch pots filled with a John Innes #3 potting soil mix (JI#3 Base: sterilized loam: peat: grit: fertilizer = 1:1:1:1 by volume). The plants were grown at 20/10°C (day/night) under daylight with additional illumination provided by high pressure sodium lamps (Philips: 400 watt Son-T Agro) to give a photoperiod of 10 h, under glasshouse condition. After root formation, clones were transferred into 5 inch pots and grown for 5 weeks. Following re-potting into 8 inch pots, the plants were grown for further 6 weeks before applying the stress treatment.
Stress Treatment and Measurements
The plants were organized in four complete blocks. Each experimental block consisted of nine water-stressed and three watered control plants. Before dehydration treatment, plants were watered to full capacity (ca. 500 ml). Under our experimental condition the average water loss was ca. 200 ml/day (estimated by weighing the pots; Image 1 of Supplemental Data). This volume of water was added to the control plants daily to maintain them at a uniform non-stressed water status, while the plants nominated for droughting were subject to 9 days of restricted water regime (decreasing from 100 ml to nil), followed by three recovering days in which they were watered to full capacity again. Leaf material was collected daily between 8.00 am and 9.00 am, immediately frozen in liquid nitrogen and stored at −80°C for RNA extraction.
Two young fully expanded leaves were used for relative water content (RWC) measurement. Leaves were weighed immediately after collection (fresh weight–FW), placed in water to hydrate to full turgidity and weighed again (turgid weight–TW). Samples were then dried overnight at 80°C and weighed (dry weight–DW). The RWC was calculated according to Smart and Bingham equation (Smart and Bingham, 1974): RWC = [(FW–DW)/(RW–DW)] × 100.
RNA Extraction, cDNA Synthesis and sqRT-PCR
Total RNA was extracted from 0.2 grams of leaf tissue from day1, 4, and 10 using an RNeasy® Plant Mini Kit (Qiagen) according to the manufacturer's instructions. cDNA was synthesized from 1 μg of total RNA using Oligo (dT)25 primer (0.5 mM final) and 200 U of RevertAid™ H Minus M-MuLV Reverse Transcriptase (Fermentas) in 20 μl reaction, according to manufacturer's instructions.
All primers used for sqRT-PCR were designed using Roche Universal Probe Library Assay Design Software (https://lifescience.roche.com/webapp/wcs/stores/servlet/CategoryDisplay?tab=Assay+Design+Center&identifier=Universal+Probe+Library&langId=-1) and are listed in Table S1.
The NCED gene was amplified from T. repens using a pair of degenerate primers (NCED5 and NCED3) designed on publicly available nucleotide sequences (Acc. No.: FF391502.1, FF393344.1, BB931293.1, BB929043.1, 5g025250.1, 5g025270.1, and 5g025290.1).
Primers NCEDmb2F and NCEDmb2R suitable for sqRT-PCR were designed on the newly sequenced T. repens NCED gene. The housekeeping actin gene used as a control was amplified using primers TrACT5 and TrACT3 designed on the publicly available T. repens gene (Acc. No. AM419900.1).
sqRT-PCR was performed in triplicate using Power SYBR® Green PCR Master Mix (Applied Biosystems) on a LightCycler® 480 Real-Time Instrument (Roche) according to manufacturer's instruction. A 10 μl reaction containing 100 ng of cDNA template and 100 nM of each gene-specific primer was subject to 40 cycles of 15 s at 95°C, 1 min at 57°C and 40 s at 72°C. PCR products were subjected to dissociation curve analysis by incubating at 15 s at 95°C, 15 s at 60°C, 15 s at (60°–5°C) and data were analyzed using the the 2−ΔΔCT method to quantify relative transcript abundance (Livak and Schmittgen, 2001). For internal control, the housekeeping actin gene was amplified from cDNA of control, drought and recovery and samples.
Construction of Subtractive Libraries
Four Suppression Subtractive Hybridisation (SSH) libraries were generated using the SMARTer™ PCR cDNA Synthesis Kit (Clontech) and the PCR-Select cDNA Subtraction Kit (Clontech) according to manufacturer's instructions. Two libraries were constructed by subtracting driver RNA sampled from plants at day 0 of the experiment from tester RNA sampled from stressed plants at day 4 of the drought treatment (Drought Forward library–DF) and vice-versa (Drought Reverse library–DR). The other two libraries were constructed by subtracting the same driver RNA at day 0 from tester RNA sampled from plants at day 1 of the rehydration process (Recovery Forward library - RF) and vice-versa (Recovery Reverse library–RR). Products of the secondary hybridisations were re-amplified using Nested PCR primer 1 and R2 (from PCR-Select cDNA Subtraction Kit; Clontech), purified using QIAquick PCR Purification Kit (Qiagen) and digested with RsaI to remove the adaptors prior to the library preparation for sequencing.
Sequencing and Data Analysis
RsaI digested samples were purified with AMpure XP beads (Agencourt) according to manufacturer's instructions and used for the construction of indexed sequencing libraries using the Illumina Nextera XT sample preparation kit as per the manufacturer's instructions. Libraries were pooled and diluted to a final concentration of 6 pM prior to sequencing on two independent runs using the Illumina MiSeq platform.
De novo assembly and read mappings were carried out using CLC Genomics Workbench 5.5.2 (CLC bio A/S, Aarhus, Denmark).
Statistical comparison of libraries was carried out using SAGEstat V4.2 (Ruijter et al., 2002) and q-value for false discovery rate was estimated using the R package q-value V1.0 (Storey, 2002).
Functional annotation was carried out using Blast2GO 2.8.0 (Conesa et al., 2005). Statistical analysis of KEGG pathways was carried out using EC2KEGG (Porollo, 2014) and full results are shown in Table S5.
MapMan analysis was carried out using MapMan 3.5.1R2 (Thimm et al., 2004) and Mercator (Lohse et al., 2014).
Data Availability
Next Generation Sequencing (NGS) runs have been deposited at National Centre for Biotechnology Information (NCBI) in the Short Read Archive (SRA) database under accessions numbers SRR3621208, SRR3621729, SRR3621829 and SRR3621860. Contig sequences have been deposited in the Transcriptome Shotgun Assembly (TSA) database GEST00000000. The version described in this paper is the first version, GEST01000000. Since TSA does not accept sequences shorter than 200 bp and containing a stretch of “N” > 14 nucleotides, the complete set of assembled sequences is provided as Data Sheet 1 of Supplemental Data.
Results and Discussion
Fast Drought Experiment
To identify genes showing changes in expression in response to water deficit and subsequent re-hydration, 48 plants of T. repens (genotype R3R4; Febrer et al., 2007) were subjected to a fast drought experiment as described in Material and Methods. The conditions were chosen following a number of pilot studies that tested pot size, soil volume, watering regime, and sampling technique/timing. The amount of water applied during the experiment decreased daily as shown in Figure 1. The leaf relative water content (RWC) was measured every day of the experiment to monitor the stress status of the plants. Plants whose RWC consistently declined every day and showed a rapid response to re-watering were selected for the RNA extraction. Figure 2 shows the RWC of the stressed plants in comparison to the control. The first significant decline in RWC is observed at day 4 (9.5% drop compared to un-stressed plants) and it reverted back to the same level as the control plants within 24 h of restoring normal watering (day 1 of recovery treatment).
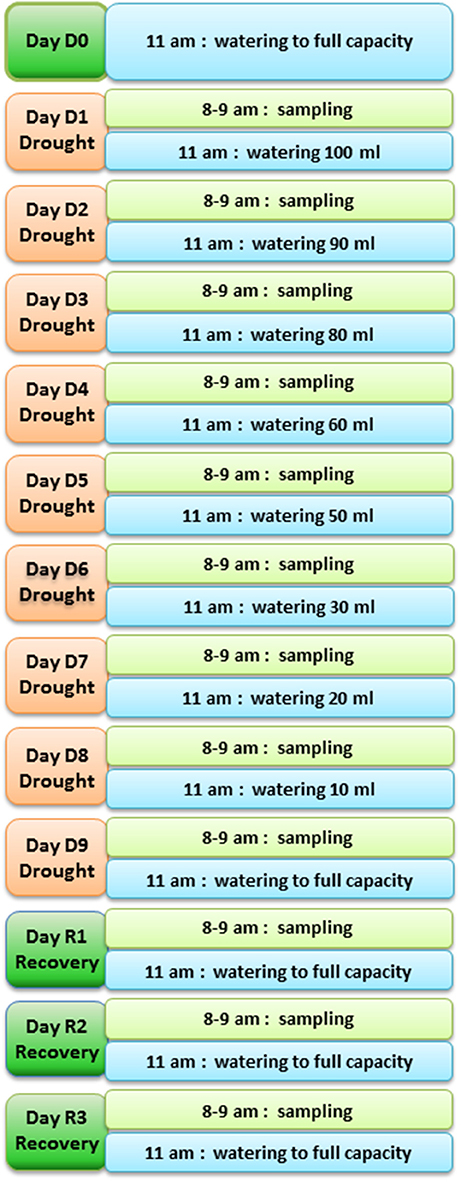
Figure 1. Diagram of the fast drought experiment set up. Time of sampling and time and volume of watering are shown for each day of the experiment.
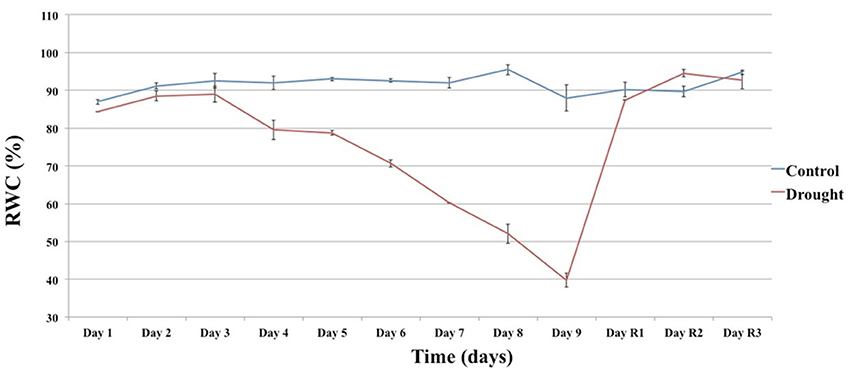
Figure 2. The effect of the drought (Day 1 to Day 9) and recovery (Day R1 to R3) treatment on RWC. Each value is the mean of two technical replicates. Error bars denote standard error.
The stress status of the experimental plants was also monitored at molecular level in semi-quantitative Real Time PCR (sqRT-PCR) using the 9-cis-epoxycarotenoid dioxygenase (NCED) gene and the actin gene as internal control. The product of NCED gene catalyzes the first step of ABA biosynthesis from carotenoids in chloroplasts and it is therefore activated very quickly in response water deficit stress, making it a useful marker for monitoring the onset of drought response (Iuchi et al., 2000).
Figure 3 shows the expression profile of the NCED transcript during the course of the experiment. The level of expression increases sharply between day 3 and 4 (~6.4-folds). The expression starts decreasing after day 5 and, after a brief increase on day 9, returns to basal level following re-watering (day 9). This expression profile seems to be typical of NCED, as also observed in M. truncatula under drought stress (probe Mtr.35044.1.S1_at of the microarray experiment by Zhang et al. unpublished at http://mtgea.noble.org/v3/probeset.php?id=Mtr.35044.1.S1_at).
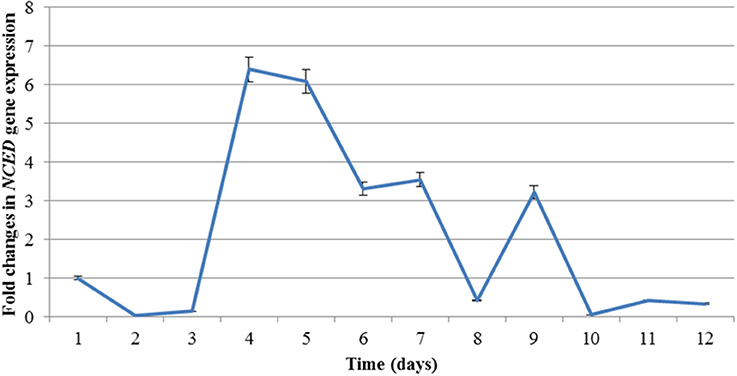
Figure 3. Expression profile of NCED during drought (Day 1 to Day 9) and recovery (Day R1 to R3) treatment analysed by RT-PCR. Error bars denote standard deviation.
The concomitant decrease in RWC and increase in NCED expression was a good indication of the beginning of the stress response.
Construction and Sequencing of SSH Libraries
Based on the RWC monitoring and the NCED expression time course, plant material from day 4 (Tester D4) and day 10 (Tester R1–day 1 of the recovery treatment) were chosen for the library preparation. In both cases, the plant material from day 1 was used as control (Driver D1).
Four SSH libraries were constructed. For the drought treatment a forward library (DF) was constructed by using the RNA from D4 plant material as tester and the one from D1 as driver and a reverse library (DR) using D1 RNA as tester and D4 as driver. Similarly, for the recovery treatment, a forward (RF) library was constructed subtracting D1 RNA from R1 RNA and a reverse (RR) subtracting R1 RNA from D1 RNA.
The libraries were constructed according to the Diatchenko‘s method (Diatchenko et al., 1996). In the original method, the libraries were cloned into E. coli and the individual clones are then Sanger sequenced. This laborious procedure was originally employed to sequence the drought forward library (Bisaga, 2013). The availability of next generation sequencing technology can however speed up the procedure and generate a much greater amount of data at a fraction of the cost per clone. We therefore omitted the cloning step and sequenced the products of the secondary amplification of the four libraries directly using the Illumina MiSeq platform.
De novo and Reference-Based Assembly of a Reference Transcriptome
The T. repens genome is not yet available, however, at the time this work was carried out, a transcriptome sequence (Nagy et al., 2013) and the genome of the closely related M. truncatula were publicly available (http://www.jcvi.org/medicago/display.php?pageName=General§ion=Download). Neither resource was on its own optimal as a reference sequence to aid the reads assembly. The published transcriptome of 71,545 sequences was generated by de novo assembly of 454-pyrosequencing reads. It was obtained from a mixture of above ground tissues of white clover grown under un-stressed conditions, while ours was generated from stressed plants and, like all transcriptomes, could contain mis-assembled and chimeric transcripts. For M. truncatula, the whole transcript set is available from the genome annotation and the average similarity between T. repens and M. truncatula at transcript level is around 90%. However, when the white clover transcriptome is BLASTed against the Medicago CDS library (Mt4.0v1), using a cutoff E-value of 10−20, only 60% of the sequences had hits. We therefore decided to use a combination of de novo and reference-based assembly.
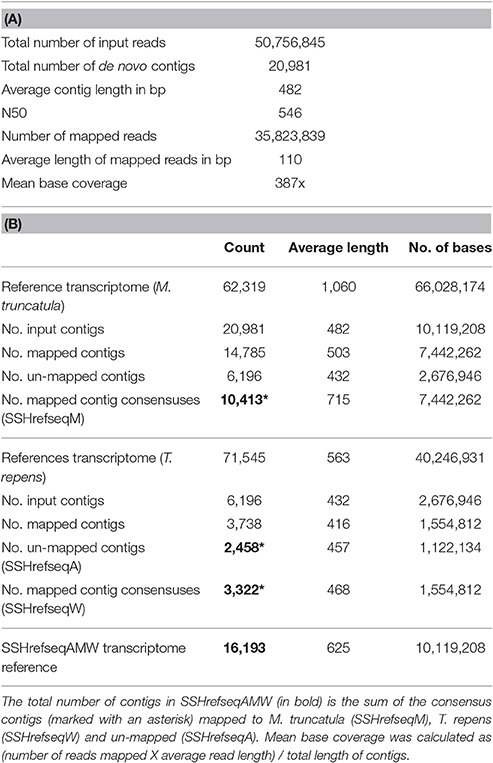
Table 1 shows the number of reads generated for each library before and after quality checks. DR and RF libraries generated a larger number of reads because they were run with an updated MiSeq system. Reads were trimmed for quality (quality limit = 0.01), length (≥36 bp) and for Nextera and SSH adaptors using CLC Genome Workbench 5.5.2. Reads from all four libraries (50,756,845 in total) were de novo assembled into 20,981 contigs of an average length of 482 bp (word size = 24; bubble size 111; minimum contig length = 200; mismatch cost = 2; insertion cost = 3; length fraction = 0.5; similarity fraction = 0.9).
Given the highly fragmented nature of the SSH library, most genes are represented by multiple non-overlapping contigs, which makes a comparative quantitative analysis of expression levels problematic. To reduce redundancy, the de novo assembled contigs were therefore further assembled by mapping to reference sequences.
The contigs were first mapped to the M. truncatula CDSs (Mt4.0v1_GenesCDSSeq_20130731_1800.fasta). Consensus sequences were extracted inserting “N” for ambiguity symbols and IUPAC ambiguity codes to resolve conflicts. This generated a set of 10,413 contigs named SSHrefseqM. The un-mapped contigs were then mapped to the white clover transcriptome (Nagy et al., 2013) and consensus sequences extracted in the same way to generate a set of 3,322 contigs named SSHrefseqW. The remaining un-mapped contigs (2,458) were named SSHrefseqA. The reference-based assembly was carried out using a mismatch cost of 2, insertion and deletion costs of 3, length fraction of 0.5 and similarity fraction of 0.8. The three sets were combined in a single reference transcriptome of 16,193 contigs of average length 625 bp named SSHrefseqAMW (Data Sheet 1 of Supplemental Data). A summary of the de novo and reference-based assembly is shown in Tables 2A,B, respectively.
The SSHrefseqAMW transcriptome was functionally annotated using Blast2GO (Conesa et al., 2005) (Table S2). In total 78% of the contigs had BLASTx hits in the NCBI database and 65% could be annotated. The great majority of the top BLAST hits were from M. truncatula and Cicer arietinum (43%), followed by Glycine max and Phaseolus vulgaris (6 and 3%, respectively).
Mapping of the Four SSH Libraries to SSHrefseqAMW
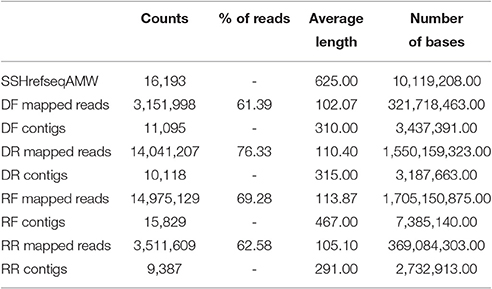
The reads from the four SSH libraries DF, DR, RF, and RR were independently mapped to the newly generated reference transcriptome SSHrefseqAMW using the same parameters as above, except for the similarity fraction, which was increased to 0.9. Table 3 shows a summary of the results from this mapping.
A considerable overlapping between the four libraries was found (Figure 4). The SSH procedure is known to produce a number of false positives. The SSH procedure is based on two rounds of hybridisation and PCR amplification, with the rate of hybridization depending heavily on the transcript abundance, the degree of differential expression and the transcript length. Most genes are differentially regulated from a basal level, rather than being switched on and off, with the majority displaying limited differential expression. With a mathematical model (Gadgil et al., 2002), showed that under recommended conditions the SSH procedure is biased toward transcripts differentially regulated to a large degree and that most false-positives are contributed by rare sequences that are not differentially expressed. Furthermore, Bui et al. (2005) showed experimentally that abundant transcript may escape both subtraction and normalization. A major source of contamination may also come from the non-specific hybridisation between strands of partially homologous genes (Gadgil et al., 2002). While the effect of these factors could be trivial when the sequencing is carried out on a limited number of bacterial clones, it becomes significant if the SSH procedure is followed by deep sequencing, which in this case yielded a base coverage of nearly 400x (Table 2A). To resolve this contamination, expression levels in RPKM (Reads Per Kilobase per Million; Mortazavi et al., 2008) were analyzed. First contigs shorter than 50 bp were filtered out. Contigs shared between forward and reverse drought libraries were also discarded if the difference in RPKM was not significant (cut off of q = 0.05). The remaining contigs were assigned to the forward library if the log2 fold change ≥ 2 or to the reverse if ≥ −2. The DF library built up in this way was then subtracted in silico from the RF library and the remaining contigs were compared to the RR library in the same way as DF/DR comparison.
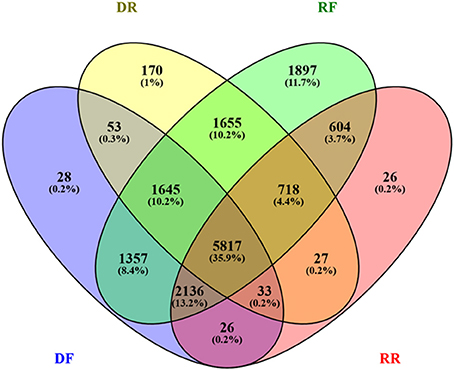
Figure 4. Venn diagram showing the extent of redundancy between libraries. The number of contigs in each library is expressed as absolute value and percent (in brackets).
Three sets of putative differentially expressed genes were generated. The first set comprises all contigs mapped in each library (non-Subtracted set, nS); the second set comprises only contigs unique to forward or reverse library (Subtracted and non-Enriched set, SnE); the third set comprises the subtracted contigs enriched for contigs with log2 fold change ≥ ±2 (Subtracted and Enriched set, SE). Results are summarized in Table 4 and full data set can be found in Table S3.
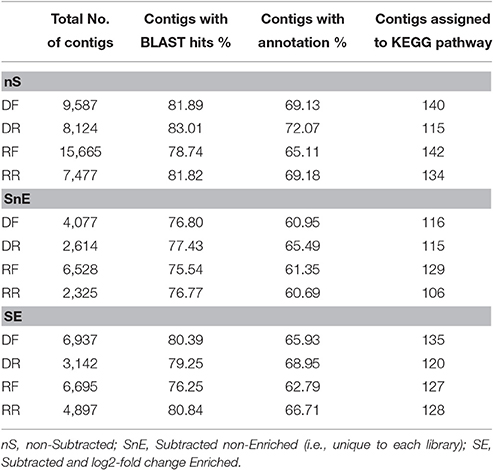
Table 4. Total number of contigs ≥50 bp in each library set and results of the functional annotation of individual libraries.
Functional Annotation by Go Terms and KEGG Pathways
Contigs in each sets were compared for their enrichment in GO (Gene Ontology) terms and KEGG (Kyoto Encyclopedia of Genes and Genomes) pathways representation using Blast2GO.
In each library BLASTx hits were found for 75–83% of the contigs and functional annotations could be assigned to 61–72% of the contigs (Table 4).
Go terms associated with each library in the Biological Process category where compared in the three sets. Figure 5 shows the results for level 3 using a node score filter of 10% (full data available in Table S4). In the nS set all libraries appear to be similarly enriched in the GO term of this category. With the exception of the “response to chemical,” “cellular component organization” and “single-organism localization” that are not represented in the RF library, all other terms appear to be over-represented and following the same pattern. When the in silico subtraction and/or enrichment are applied (SnE and SE sets) some GO terms appear to be more specific to some libraries. In particular the “response to stress” term (marked with a red asterisk), which is expected to be over-represented in a library of material subjected to drought, shows the expected pattern only in the SE set: present in DF (up-regulated under drought) and in RR (down-regulated during recovery).
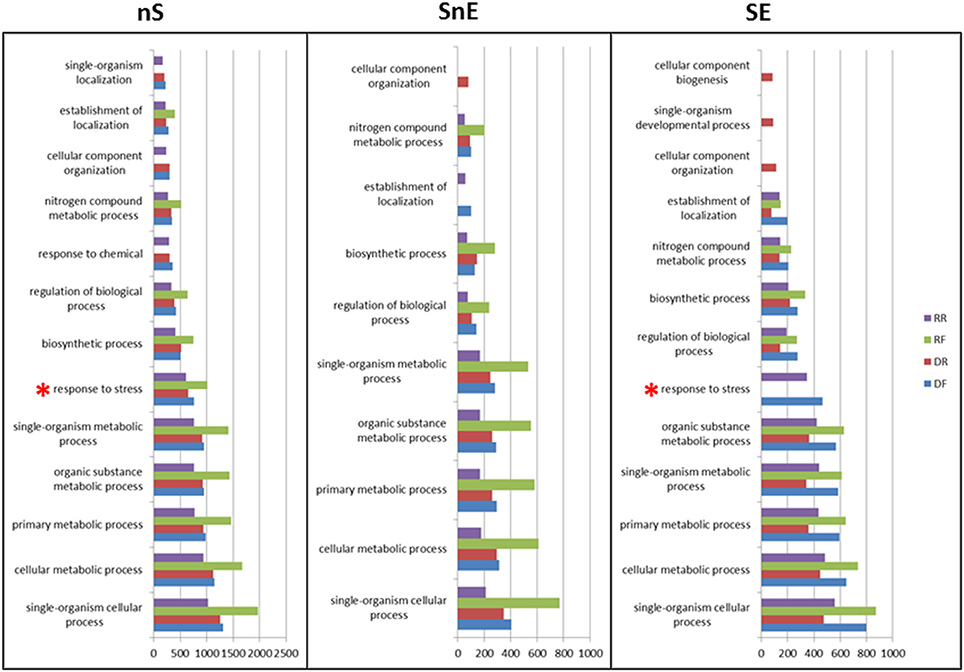
Figure 5. GO term assignment in the biological process category. Go terms at levels 2 and 3 are shown in the non-Subtracted (nS), Subtracted non-Enriched (SnE), and Subtracted Enriched (SE) sets. Values on the x axis are scores computed by Blast2GO as per Conesa et al. (2005).
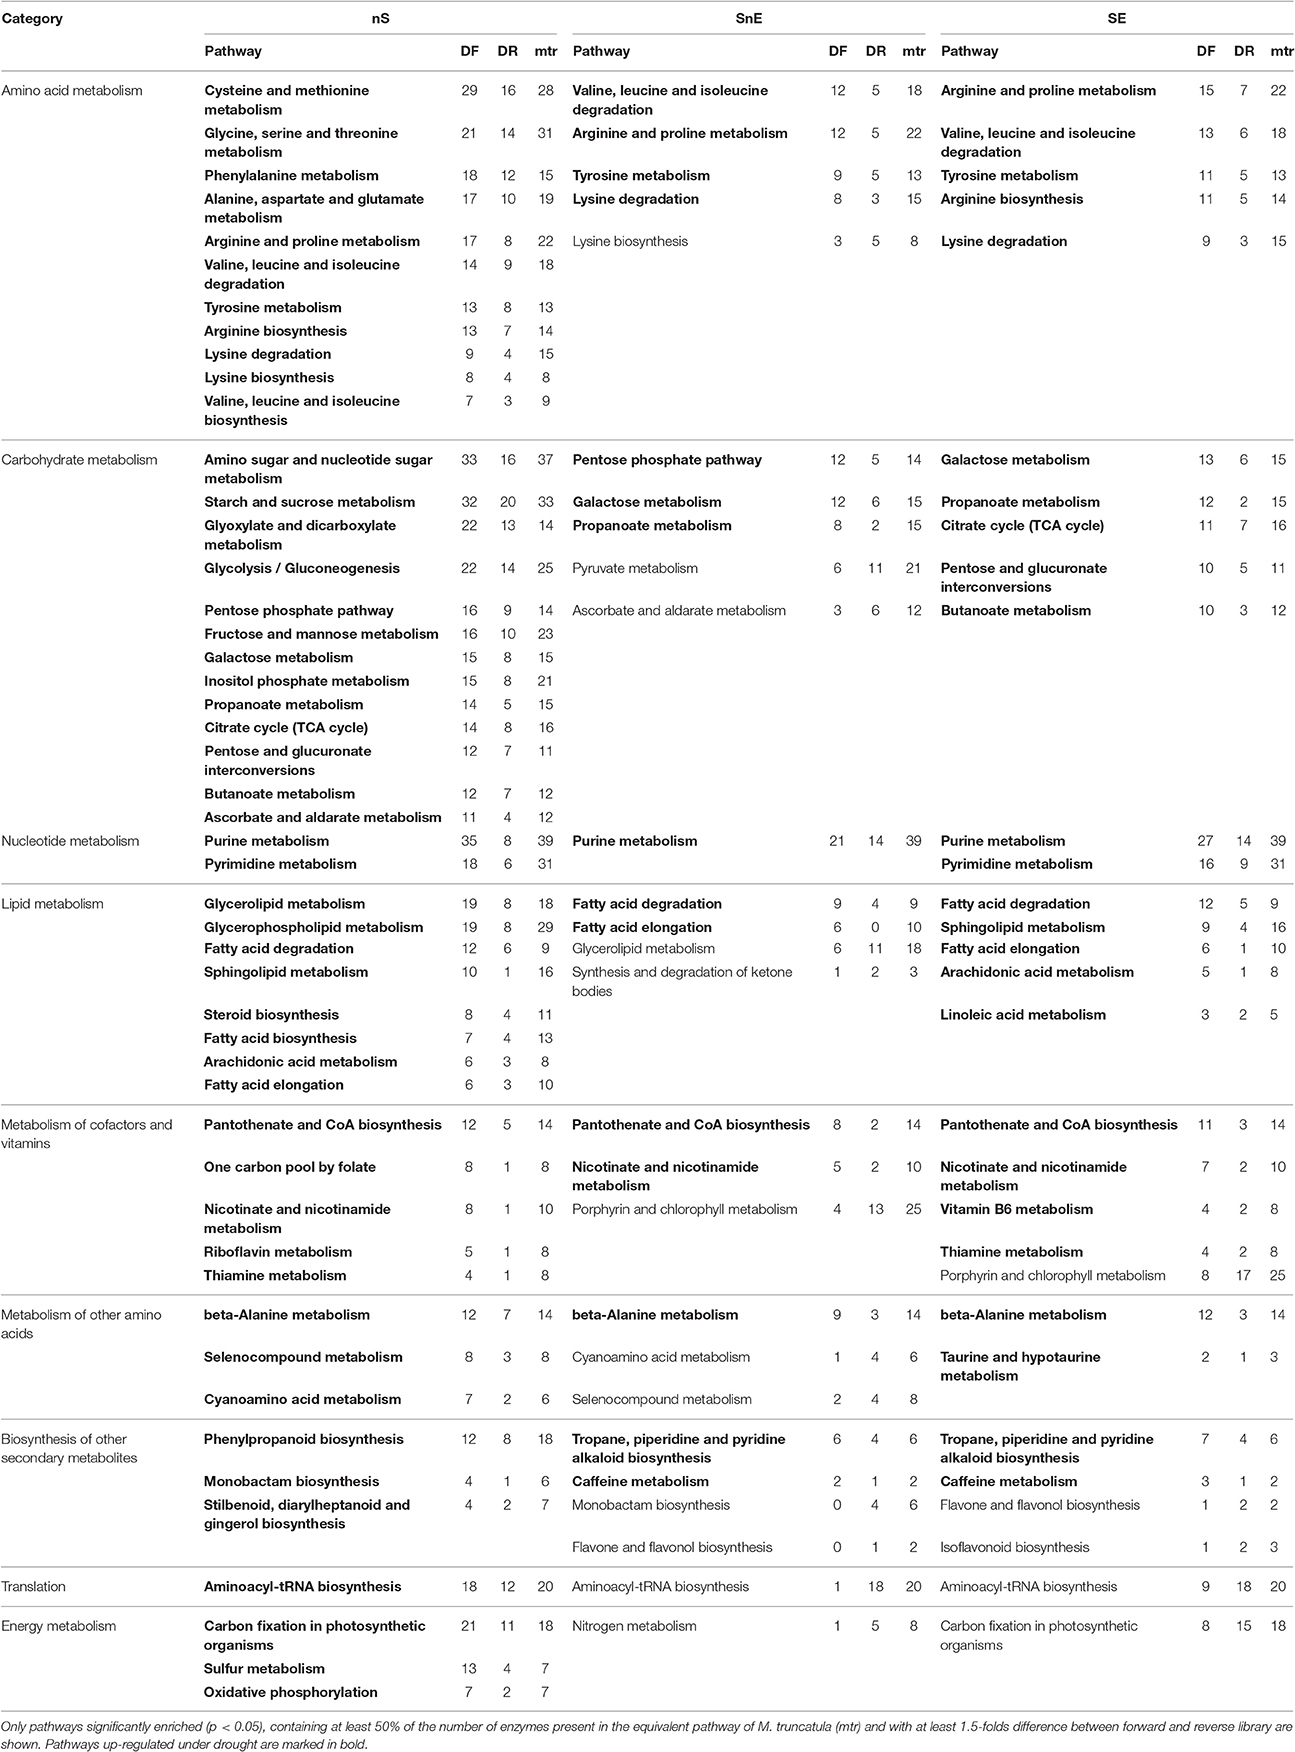
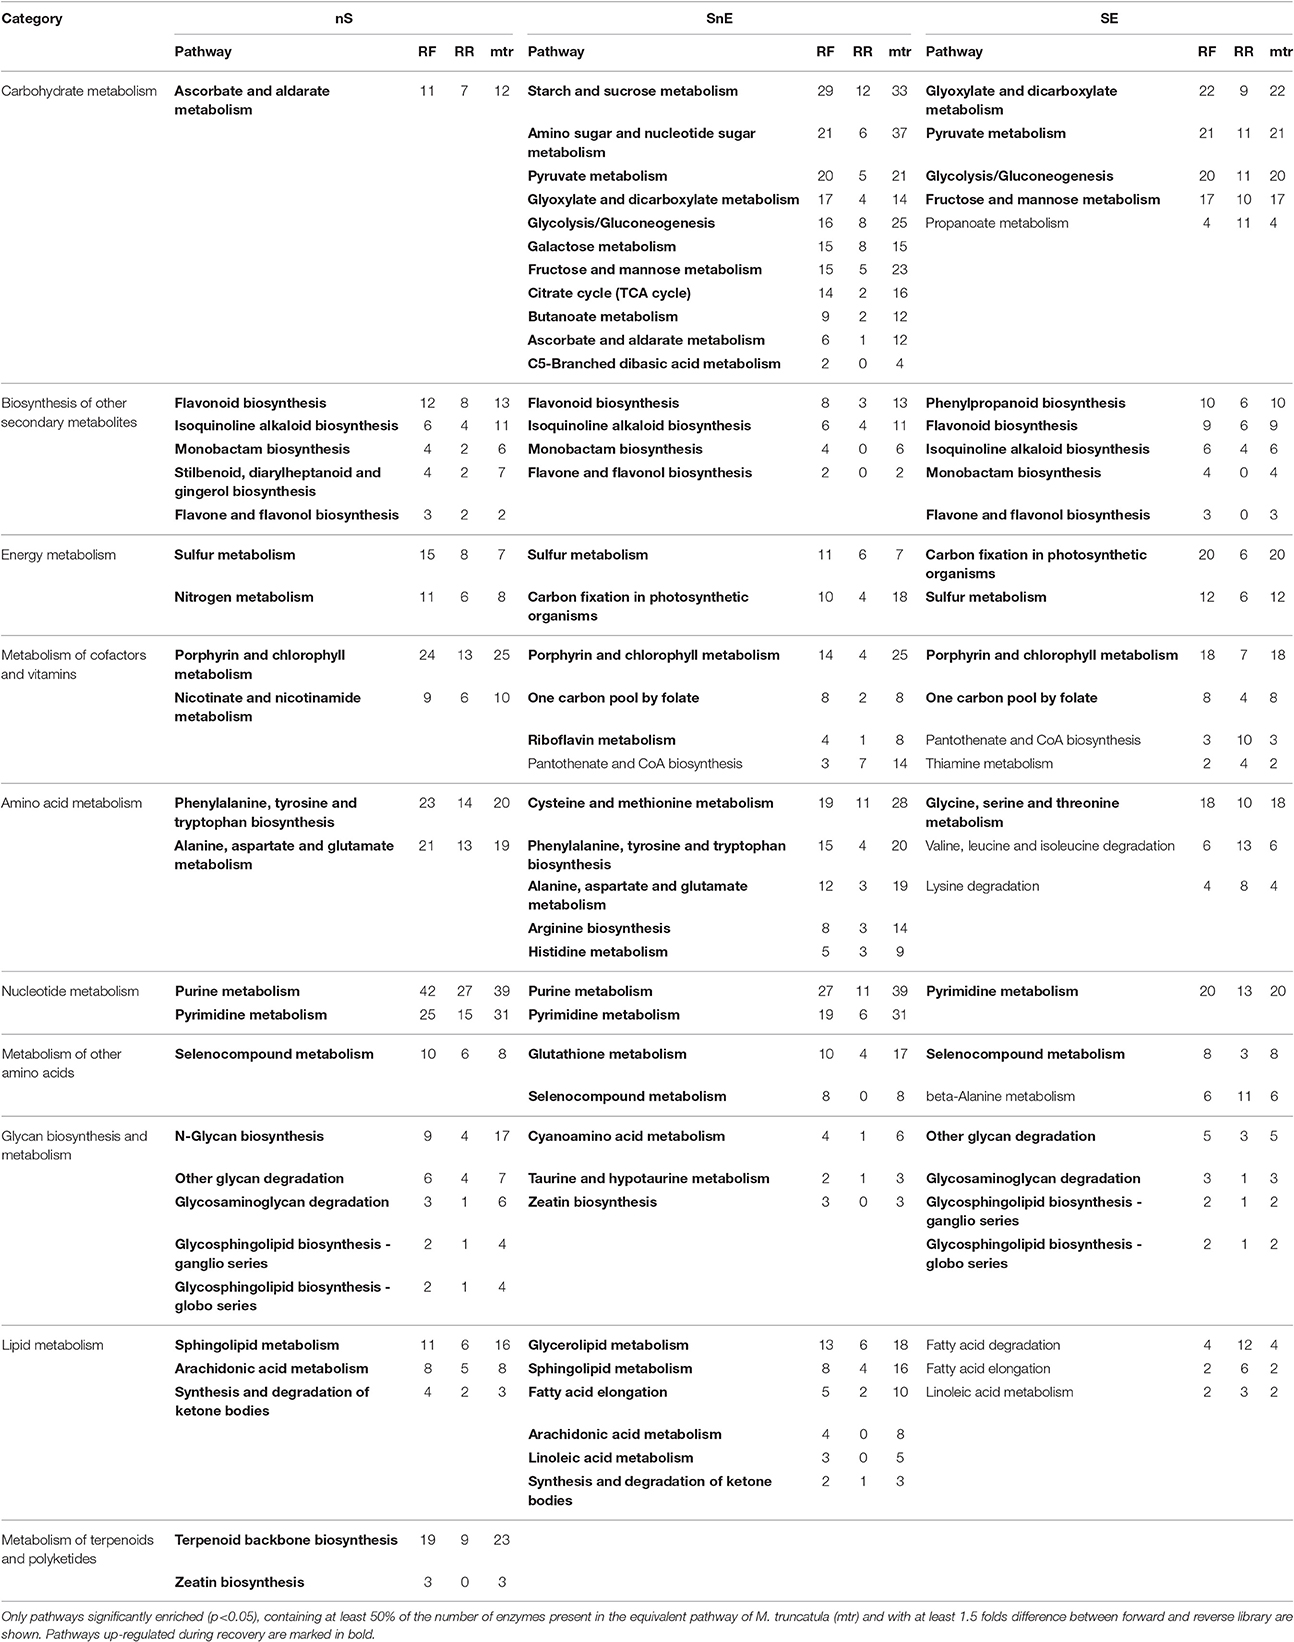
As part of the Blast2GO analysis contigs in each library were assigned with an EC (Enzyme Code) number and mapped to the relevant KEGG pathway. Contigs were assigned to 106–142 pathways depending on the size of the library (Table 4). Tables 5, 6 summarize the results of the KEGG analysis for the drought and recovery library, respectively. Only pathways significantly enriched (p < 0.05), showing at least 50% of the number of enzymes present in the equivalent pathway of M. truncatula (mtr) and at least 1.5 folds difference between forward and reverse library are shown (full set of data available in Table S5). As expected, the largest number of differentially expressed contigs was associated with metabolic processes, such as amino acid, carbohydrate, nucleotide and lipid metabolism. All pathways appear to be over-represented in both drought and recovery forward libraries of the non-subtracted set (marked in bold), including pathways that are well-known to be downregulated under drought, such as those related to translation and energy metabolism. Those pathways are indeed under-represented in both SnE and SE sets from the drought treatment (Table 5) and over-represented in all sets (energy metabolism) or just in the SnE and SE sets (translation) from the recovery treatment (Table 6).
In plants, such as white clover, that employ drought tolerance as the main strategy for coping with stress, the response is primarily focused on maintaining the cell water potential. This is achieved by the accumulation of soluble small molecular weight osmoprotectants, such as amino acids (proline, asparagine, serine), polyamines (putrescine, spermidine, spermine), glycine betaine and γ-amino-N-butyric acid (GABA) (Bartels and Sunkar, 2005). This is in agreement with the “arginine and proline metabolism” pathway, involved in the biosynthesis of proline, putrescine, spermidine and spermine, being one of the most represented in the DF library. It is also in line with the work of Li et al. (2015a,b), which showed the positive effect of both exogenous and endogenous polyamines on white clover tolerance to water deficit. Also significantly over-represented in the DF library is the “butanoate metabolism” pathway, which is the main route of GABA biosynthesis via decarboxylation of L-glutamate.
Regulation of osmotic adjustment can also be achieved via carbohydrates, which are accumulated to varying degrees in different plants (Singh et al., 2015). Glucose, sucrose and fructose are the most common sugars to be accumulated under stress, however raffinose family oligosaccharides (RFOs), such as raffinose, stachyose, and verbascose, have also been shown to play a role in a variety of stress responses (Castonguay and Nadeau, 1998; Taji et al., 2002; Peters et al., 2007; Nishizawa et al., 2008; Egert et al., 2015). The first report of RFOs involvement in the response to drought came from the observed increased tolerance of Arabidopsis plants over-producing galactinol synthase, which catalyzes the first step in the synthesis of RFOs (Taji et al., 2002). An increased concentration of RFOs has also been associated with drought tolerance in alfalfa (Kang et al., 2011) and in various resurrection plants (Peters et al., 2007; Egert et al., 2015). It has been suggested that RFOs not only act as osmoprotectants, but also as ROS (Reactive Oxygen Species) scavenger providing protection from oxidative damage (Nishizawa et al., 2008). White clover is known to increase the concentration of soluble sugars under water deficit (Turner, 1990; Lee et al., 2008; Li et al., 2013) but their composition is not known. The over-representation of the “galactose metabolism” pathway (87 and 80% of the enzymes in the equivalent of M. truncatula in SnE and SE, respectively) suggests that RFOs play an important role at the onset of white clover response to drought. It has to be noted that other pathways in the “carbohydrate metabolism” category that are related to the accumulation of sugars, such as “starch and sucrose metabolism,” are also significantly over-represented in the DF library (see Table S5), but the difference between DF and DR is <1.5 folds and therefore have not been shown in Table 5. However, it is quite possible these pathways will appear more enriched at later stages of the drought treatment. The “fructose and mannose metabolism” pathway, on the other hand, is non-significantly over-represented in DR compared to DF, but significantly over-represented in RF compared to RR in the SnE and SE sets. It could be extrapolated that, following a delayed activation at a later stage of drought, the expression of the related genes is still elevated at day 1 of recovery (Table 6 and Table S5).
It is well-known that inhibition of photosynthesis is among the early effects of drought stress. This is reflected in the down-regulation of genes encoding enzymes related to the “carbon fixation in photosynthetic organisms” and “porphyrin and chlorophyll metabolism” pathways (83 and 68% of the enzymes in the equivalent pathways of M. truncatula, respectively, in the SE set). As expected, these pathways are enriched in the RF library compared to DR in both SnE and SE set (Table 7). Also downregulated under drought treatment are 90% of the genes encoding enzymes related to the “aminoacyl-tRNA biosynthesis” pathways. This trend has been observed in other plants (Yamakawa and Hakata, 2010; Merewitz et al., 2011; Mohanty et al., 2016) and it has been related to the aminoacyl-tRNA molecules being associated with other processes in addition to protein synthesis, such as synthesis of porphyrin ring structure (Mocibob et al., 2010), and to the accumulation of osmolytes in the form of free amino acids (Yamakawa and Hakata, 2010).
It was however unexpected to find a higher representation of the “flavone and flavonol biosynthesis” and “isoflavonoid biosynthesis” pathways in the DR library, and non-significant difference between the DF and DR libraries in the enrichment of the “flavonoid biosynthesis” pathway (Table S5). Flavonoids are secondary metabolites with strong antioxidant activity that are involved in plant protection against biotic and abiotic stresses, including drought (Tattini et al., 2004; Mouradov and Spangenberg, 2014). Flavonoids are classified in several sub-groups, one of which, isoflavonoids, is predominantly found in leguminous plants. (Iso) flavonoids have been shown to accumulate in shoots of alfalfa and leaves of Lotus japonicus (Kang et al., 2011; Garcia-Calderon et al., 2015). Ballizany et al. (2012b) showed an increase of flavonol glycosides of quercetin in white clover subject to water deficit and its positive association with retention of higher level of dry matter production under stress. In our study the pathways related to flavonoid biosynthesis are all significantly over-represented in the DF library (Table S5), but not compared to the DR library. In Ballizany et al. (2012b), the water deficit imposed was much harsher then in our experiment (9, 13, and 17 weeks above wilting point). Our library was constructed from material at the onset of the drought response and it is therefore conceivable that the biosynthesis of flavonoid is also at an early stage. In agreement with this hypothesis is the enrichment of these pathways in all three sets of the recovery treatment (Table 6). As hypothesized above for the “fructose and mannose metabolism,” transcripts associated with the synthesis of flavonoids could still be abundant following activation during advanced stages of drought stress. A time course of the expression of the genes involved in the different branches of the phenolic biosynthetic pathway in white clover under drought stress will help characterizing the stress response in more details and will clarify the potential of flavonoids as a target for improving drought tolerance (Kang et al., 2011; Ballizany et al., 2012a,b).
Mapman Functional Annotation
The differentially expressed contigs were also functionally annotated using MapMan (Thimm et al., 2004). Unlike GO, MapMan has the advantage of being developed for plant-specific pathways and of not separating different functional categories, allowing a global overview of high-throughput data in the context of pathways and processes. MapMan uses a different approach from GO in that it assigns genes to functional categories (BINs), rather than to a GO terms, that are represented in a hierarchically structured tree. For this analysis MapMan bins were assigned to the SSHrefseqAMW reference transcriptome using the Mercator pipeline (Lohse et al., 2014), so that it could be used as a mapping file. The data files were generated by calculating the log2 fold change of expression levels (in RPKM) in forward and reverse libraries. A metabolic overview of nS, SnE, and SE set is shown in Figure 6.
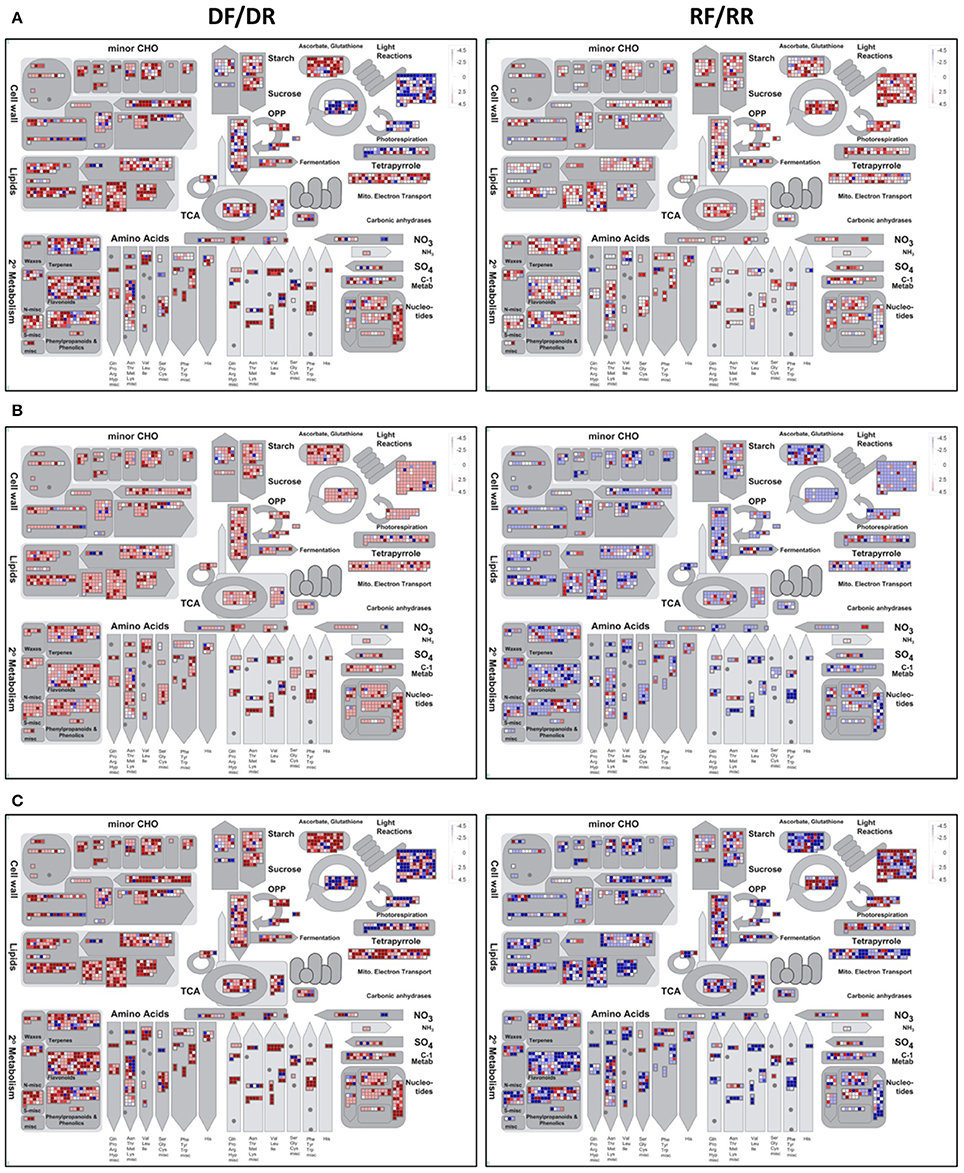
Figure 6. MapMan metabolic overview of white clover gene expression at the onset of drought (DF/DR) and recovery (RF/RR) in the nS (A), SnE (B), and SE (C) sets. Each square represents a transcript whose expression can be the same (white square), up-regulated (red squares) or down-regulated (blue squares) in the forward as compared to the reverse libraries.
The effect of the in silico subtraction and/or enrichment is clearly shown by the different patterns of expression in the nS (Figure 6A), SnE (Figure 6B), and SE (Figure 6C) sets. The nS set shows an elevated number of transcripts whose level does not significantly (p ≥ 0.05) change between forward and reverse library (white squares), especially in the recovery samples. In the SnE set almost all transcripts appear to be up-regulated (red squares) under drought and down-regulated (blue squares) during recovery. On the other end, the SE set shows a biologically meaningful pattern in which processes related to photosynthesis, such as components of the photosystem (“Light reaction”) and the biosynthesis of photosynthetic pigments (“Tetrapyrrole”) are mostly down-regulated under drought and up-regulated during recovery (Figure 6C). As the rate of photosynthesis slows down the cellular energy is provided by glycolysis and TCA cycle (Fernie et al., 2004) which appear to be up-regulated and down-regulated in drought and recovery, respectively. As discussed in the previous section, carbohydrate and amino acids metabolism are also oppositely regulated under the two treatments. Notably, the flavonoids and phenylpropanoids pathways show an overall up-regulation under water deficit, suggesting that the hierarchical bin system strategy adopted by MapMan is more likely to provide a more accurate representation. Also significantly up- and down-regulated under drought and recovery, respectively, are the transcripts related to the ascorbate-glutathione pathway, involved in ROS scavenging, to cell wall metabolism and to lipids biosynthesis and degradation. Lipids are important components of biological membranes, the initial site of cellular perception of the signals and major targets of environmental stresses. The change in lipids composition in response to stress is well documented (Gigon et al., 2004; Torres-Franklin et al., 2007; Toumi et al., 2008) and plays a primary role not only in the sensing and triggering of the signaling cascade (Wang, 2004) but also in maintaining membrane integrity and preserve cell compartmentalisation.
Validation of Expression Profiles by sqRT-PCR
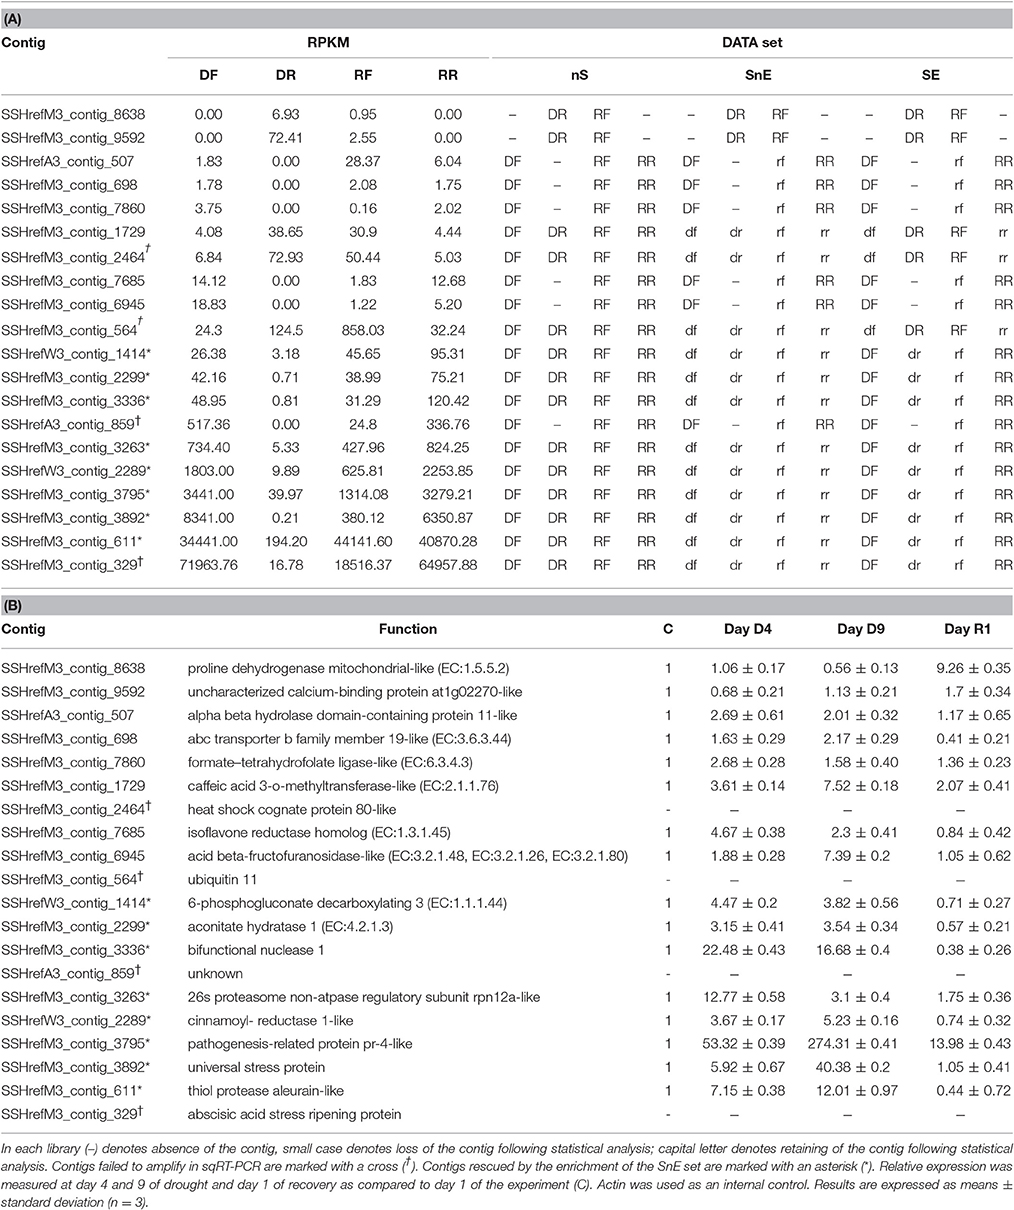
To validate the data obtained from the statistical analysis of the SSH libraries, we carried out a sqRT-PCR. Twenty contigs were semi-randomly chosen to cover low, medium, and high level of expression (in RPKM) in the DF library. The sqRT-PCR data from 16 of the contigs that were successfully amplified validated the expression data obtained from the SSH libraries (Table 7). With the exception of SSHrefM3_contig_1729, whose RT-PCR fit only the nS data set, all the other results fit the dataset SE best. This means that when the sqRT-PCR values are higher or lower than the internal control C on Day D4 (Table 7B), the contig is included in the DF or DR libraries of the SE set, respectively (Table 7A). The same results are observed with the values of Day R1 and the RF or RR libraries. In particular, half of the contigs (marked with an asterisk) with RPKM values ranging from medium to high, would have been lost if the enrichment of the subtracted libraries had not been carried out.
Incidentally, the “false negative” contig, SSHrefM3_contig_1729, is an enzyme from the “Flavone and flavonol biosynthesis” pathway and its expression appears to increase at day 9 of the stress treatment, as hypothesized above.
Conclusions
In this work we generated the first large scale molecular data related to white clover early response to drought and re-hydration by deep sequencing of SSH libraries. In a previous study only the forward libraries were sequenced using the standard protocol, generating 1,127 and 2,405 sequences for drought and recovery, respectively (Bisaga, 2013). By replacing the cloning step with a MiSeq sequencing run we were able to increase the number of transcripts to 9,587 and 15,665, respectively (Table 4; nS set). Reverse libraries were also sequenced, generating 8,124 and 7,477 transcripts down-regulated during drought and recovery, respectively (Table 4; nS set). These sequences were further processed using a procedure involving in silico subtraction of forward and reverse libraries, followed by enrichment with transcripts whose expression level is significantly different in the two libraries. When the three sets of data, non-subtracted (nS), subtracted non-enriched (SnE) and subtracted enriched (SE), were compared by functional annotation only the latter fit all three mapping approaches used, GO term, KEGG pathways and MapMan BINs assignment.
The DF and DR libraries of the SE set, however, are not only quantitatively, but also qualitatively different from the sets of transcripts identified in the original study. About 25% of the transcripts sequenced in the original drought library were not found in the DF library of the SE set. A good example is a set of transcripts associated with the GO term “photosynthesis” (GO:0015979; GO:0019684), which in our study were recovered in every library, and after SE processing, in the DR and RF libraries. This type of artifact has been observed in similar studies, where the same transcript was recovered in both forward and reverse library (Bui et al., 2005; Norelli et al., 2009; Hall et al., 2011). It is believed to be associated with abundant transcript (such as photosynthetic genes), which appear to escape both subtraction and normalization (Bui et al., 2005).
The original recovery forward library was found to be more similar to the one in this study, with only 10% of the transcripts being recovered in libraries different from SE-RF. One example is a set of genes associated with the GO term “response to osmotic stress” (GO:0006970), which in our study was found, as it would be expected, in the DF and RR libraries. In this case, however, only few transcripts appeared to have a high level of expression. The cause of this artifact is therefore different from the one observed for the photosynthetic genes recovered in the drought library, but it is difficult interpret without suitable kinetic studies.
Overall the newly generated sets of data provide a biologically meaningful overview of the changes in gene expression associated with the early response of white clover to drought and rehydration. It provides a valuable resource for candidate genes and molecular markers discovery for improving the crop performance and persistence during the short intermittent drought spells most likely to affect cultivated white clover.
Author Contributions
MB participated in planning the study, carried out the fast drought experiment, the SSH procedure and the libraries construction. ML helped with the fast drought experiment. MH carried out the sequencing and helped with the analysis. MA participated in planning the study. AR conceived and planned the study, directed the work, carried out the analyses and carried out the writing of the manuscript.
Funding
This work was funded by BBSRC as part of the Institute Strategic Programme Grant.
Conflict of Interest Statement
The authors declare that the research was conducted in the absence of any commercial or financial relationships that could be construed as a potential conflict of interest.
Supplementary Material
The Supplementary Material for this article can be found online at: http://journal.frontiersin.org/article/10.3389/fpls.2017.00213/full#supplementary-material
Image 1. Pot weight changes during water withdrawal for drought and control plants.
Table S1. List of primers used in this study.
Table S2. Blast2Go annotation table for the reference transcriptome SSHrefseqAMW.
Table S3. List of contigs included in libraries DF, DR, RF, and RR for each data set (nS, SnE, and SE).
Table S4. Blast2Go GO term assignment to libraries DF, DR, RF, and RR for each data set (nS, SnE, and SE).
Table S5. EC2KEGG table of KEGG pathways associated with enzyme codes in libraries DF, DR, RF, and RR for each data set (nS, SnE, and SE). Total(EC_All) = number of ECs associated with the KEGG pathway; Total(EC_Ref(mtr)) = number of ECs in reference genome mtr (M. truncatula) associated with the KEGG pathway; Total(EC_Given) = number of tested ECs found to be associated with the KEGG pathway; Total(EC_Shared) = number of tested ECs that are shared with reference genome; Total(EC_Unique_Ref) = number of ECs that are unique to the reference genome; Total(EC_Unique_Given) = number of ECs that are unique to the tested genome.
References
Abberton, M. T., and Marshall, A. T. (2005). Progress in breeding perennial clovers for temperate agriculture. J. Agric. Sci. 143, 117–135. doi: 10.1017/S0021859605005101
Annicchiarico, P., Barrett, B., Brummer, E. C., Julier, B., and Marshall, A. H. (2015). Achievements and challenges in improving temperate perennial gorage legumes. Crit. Rev. Plant Sci. 34, 327–380. doi: 10.1080/07352689.2014.898462
Ballizany, W. L., Hofmann, R. W., Jahufer, M. Z. Z., and Barrett, B. A. (2012a). Genotype x environment analysis of flavonoid accumulation and morphology in white clover under contrasting field conditions. Field Crops Res. 128, 156–166. doi: 10.1016/j.fcr.2011.12.006
Ballizany, W. L., Hofmann, R. W., Jahufer, M. Z. Z., and Barrett, B. A. (2012b). Multivariate associations of flavonoid and biomass accumulation in white clover (Trifolium repens) under drought. Funct. Plant Biol. 39, 167–177. doi: 10.1071/FP11193
Bartels, D., and Sunkar, R. (2005). Drought and salt tolerance in plants. Crit. Rev. Plant Sci. 24, 23–58. doi: 10.1080/07352680590910410
Belaygue, C., Wery, J., Cowan, A. A., and Tardieu, F. (1996). Contribution of leaf expansion, rate of leaf appearance, and stolon branching to growth of plant leaf area under water deficit in white clover. Crop Sci. 36, 1240–1246. doi: 10.2135/cropsci1996.0011183X003600050028x
Bisaga, M. (2013). Molecular Characterisation of Response to Drought in White Clover. PhD Thesis, Aberystwyth University.
Brock, J. L., Hay, M. J. M., Thomas, V. J., and Sedcole, J. R. (1988). Morphology of white clover (Trifolium repens L) plants in pastures under intensive sheep grazing. J. Agric. Sci. 111, 273–283. doi: 10.1017/S0021859600083210
Bui, L. C., Leandri, R. D., Renard, J. P., and Duranthon, V. (2005). SSH adequacy to preimplantation mammalian development: scarce specific transcripts cloning despite irregular normalisation. BMC Genomics 6:155. doi: 10.1186/1471-2164-6-155
Castonguay, Y., and Nadeau, P. (1998). Enzymatic control of soluble carbohydrate accumulation in cold-acclimated crowns of alfalfa. Crop Sci. 38, 1183–1189. doi: 10.2135/cropsci1998.0011183X003800050012x
Chen, D., Liang, M. X., DeWald, D., Weimer, B., Peel, M. D., Bugbee, B., et al. (2008). Identification of dehydration responsive genes from two non-nodulated alfalfa cultivars using Medicago truncatula microarrays. Acta Physiol. Plant. 30, 183–199. doi: 10.1007/s11738-007-0107-5
Conesa, A., Gotz, S., Garcia-Gomez, J. M., Terol, J., Talon, M., and Robles, M. (2005). Blast2GO: a universal tool for annotation, visualization and analysis in functional genomics research. Bioinformatics 21, 3674–3676. doi: 10.1093/bioinformatics/bti610
Deshmukh, R., Sonah, H., Patil, G., Chen, W., Prince, S., Mutava, R., et al. (2014). Integrating omic approaches for abiotic stress tolerance in soybean. Front. Plant Sci. 5:244. doi: 10.3389/fpls.2014.00244
Diatchenko, L., Lau, Y. F. C., Campbell, A. P., Chenchik, A., Moqadam, F., Huang, B., et al. (1996). Suppression subtractive hybridization: a method for generating differentially regulated or tissue-specific cDNA probes and libraries. Proc. Natl. Acad. Sci. U.S.A. 93, 6025–6030. doi: 10.1073/pnas.93.12.6025
Egert, A., Eicher, B., Keller, F., and Peters, S. (2015). Evidence for water deficit-induced mass increases of raffinose family oligosaccharides (RFOs) in the leaves of three Craterostigma resurrection plant species. Front. Physiol. 6:206. doi: 10.3389/fphys.2015.00206
Febrer, M., Cheung, F., Town, C. D., Cannon, S. B., Young, N. D., Abberton, M. T., et al. (2007). Construction, characterization, and preliminary BAC-end sequencing analysis of a bacterial artificial chromosome library of white clover (Trifolium repens L.). Genome 50, 412–421. doi: 10.1139/G07-013
Fernie, A. R., Carrari, F., and Sweetlove, L. J. (2004). Respiratory metabolism: glycolysis, the TCA cycle and mitochondrial electron transport. Curr. Opin. Plant Biol. 7, 254–261. doi: 10.1016/j.pbi.2004.03.007
Fothergill, M., Davies, D. A., and Daniel, G. J. (1997). Morphological dynamics and seedling recruitment in young swards of three contrasting cultivars of white clover (Trifolium repens) under continuous stocking with sheep. J. Agric. Sci. 128, 163–172. doi: 10.1017/S0021859696004030
Fothergill, M., Davies, D. A., Morgan, C. T., and Jones, J. R. (1996). “White clover crashes,” in Legumes in Sustainable Farming Systems, ed D. Younie (Aberdeen: Occasional Symposium of the British Grassland Society), 172–176.
Gadgil, C., Rink, A., Beattie, C., and Hu, W. S. (2002). A mathematical model for suppression subtractive hybridization. Comp. Funct. Genomics 3, 405–422. doi: 10.1002/cfg.206
Garcia-Calderon, M., Pons-Ferrer, T., Mrazova, A., Pal'ove-Balang, P., Vilkova, M., Perez-Delgado, C. M., et al. (2015). Modulation of phenolic metabolism under stress conditions in a Lotus japonicus mutant lacking plastidic glutamine synthetase. Front. Plant Sci. 6:760. doi: 10.3389/fpls.2015.00760
Gigon, A., Matos, A. R., Laffray, D., Zuily-Fodil, Y., and Pham-Thi, A. T. (2004). Effect of drought stress on lipid metabolism in the leaves of Arabidopsis thaliana (ecotype Columbia). Ann. Bot. 94, 345–351. doi: 10.1093/aob/mch150
Hall, J. R., Clow, K. A., Rise, M. L., and Driedzic, W. R. (2011). Identification and validation of differentially expressed transcripts in a hepatocyte model of cold-induced glycerol production in rainbow smelt (Osmerus mordax). Am. J. Physiol. Regul. Integr. Comp. Physiol. 301, 995–1010 doi: 10.1152/ajpregu.00210.2011
Hart, A. L. (1987). “Physiology,” in White Clover, eds M. J. Baker and W. M. Williams (Wallingford:CAB International), 125–151.
Hutchinson, K. J., King, K. L., and Wilkinson, D. R. (1995). Effects of rainfall, moisture stress, and stocking rate on the persistence of white clover over 30 years. Aust. J. Exp. Agric. 35, 1039–1047. doi: 10.1071/EA9951039
Iuchi, S., Kobayashi, M., Yamaguchi-Shinozaki, K., and Shinozaki, K. (2000). A stress-inducible gene for 9-cis-epoxycarotenoid dioxygenase involved in abscisic acid biosynthesis under water stress in drought-tolerant cowpea. Plant physiol. 123, 553–562. doi: 10.1104/pp.123.2.553
Kang, Y., Han, Y., Torres-Jerez, I., Wang, M., Tang, Y., Monteros, M., et al. (2011). System responses to long-term drought and re-watering of two contrasting alfalfa varieties. Plant J. 68, 871–889. doi: 10.1111/j.1365-313X.2011.04738.x
Lee, B. R., Jin, Y. L., Jung, W. J., Avice, J. C., Morvan-Bertrand, A., Ourry, A., et al. (2008). Water-deficit accumulates sugars by starch degradation-not by de novo synthesis-in white clover leaves (Trifolium repens). Physiol. Plant 134, 403–411. doi: 10.1111/j.1399-3054.2008.01156.x
Li, Z., Jing, W., Peng, Y., Zhang, X. Q., Ma, X., Huang, L. K., et al. (2015a). Spermine alleviates drought stress in white clover with different resistance by influencing carbohydrate metabolism and dehydrins synthesis. PLoS ONE 10:e0120708. doi: 10.1371/journal.pone.0120708
Li, Z., Shi, P., and Peng, Y. (2013). Improved drought tolerance through drought preconditioning associated with changes in antioxidant enzyme activities, gene expression and osmoregulatory solutes accumulation in white clover (Trifolium repens L.). Plant Omics 6, 481–489.
Li, Z., Zhang, Y., Peng, D. D., Wang, X. J., Peng, Y., He, X. S., et al. (2015b). Polyamine regulates tolerance to water stress in leaves of white clover associated with antioxidant defense and dehydrin genes via involvement in calcium messenger system and hydrogen peroxide signaling. Front. Physiol. 6:280. doi: 10.3389/fphys.2015.00280
Livak, K. J., and Schmittgen, T. D. (2001). Analysis of relative gene expression data using real-time quantitative PCR and the 2−ΔΔCT method. Methods 25, 402–408. doi: 10.1006/meth.2001.1262
Lohse, M., Nagel, A., Herter, T., May, P., Schroda, M., Zrenner, R., et al. (2014). Mercator: a fast and simple web server for genome scale functional annotation of plant sequence data. Plant Cell Environ. 37, 1250–1258. doi: 10.1111/pce.12231
Merewitz, E. B., Gianfagna, T., and Huang, B. R. (2011). Protein accumulation in leaves and roots associated with improved drought tolerance in creeping bentgrass expressing an ipt gene for cytokinin synthesis. J. Exp. Bot. 62, 5311–5333. doi: 10.1093/jxb/err166
Mocibob, M., Ivic, N., Bilokapic, S., Maier, T., Luic, M., Ban, N., et al. (2010). Homologs of aminoacyl-tRNA synthetases acylate carrier proteins and provide a link between ribosomal and nonribosomal peptide synthesis. Proc. Natl. Acad. Sci. U.S.A. 107, 14585–14590. doi: 10.1073/pnas.1007470107
Mohanty, B., Kitazumi, A., Cheung, C. Y. M., Lakshmanan, M., De Los Reyes, B. G., Jang, I. C., et al. (2016). Identification of candidate network hubs involved in metabolic adjustments of rice under drought stress by integrating transcriptome data and genome-scale metabolic network. Plant Sci. 242, 224–239. doi: 10.1016/j.plantsci.2015.09.018
Mortazavi, A., Williams, B. A., Mccue, K., Schaeffer, L., and Wold, B. (2008). Mapping and quantifying mammalian transcriptomes by RNA-Seq. Nat. Methods 5, 621–628. doi: 10.1038/nmeth.1226
Mouradov, A., and Spangenberg, G. (2014). Flavonoids: a metabolic network mediating plants adaptation to their real estate. Front. Plant Sci. 5:620. doi: 10.3389/fpls.2014.00620
Nagy, I., Barth, S., Mehenni-Ciz, J., Abberton, M. T., and Milbourne, D. (2013). A hybrid next generation transcript sequencing-based approach to identify allelic and homeolog-specific single nucleotide polymorphisms in allotetraploid white clover. BMC Genomics 14:100. doi: 10.1186/1471-2164-14-100
Nishizawa, A., Yabuta, Y., and Shigeoka, S. (2008). Galactinol and raffinose constitute a novel function to protect plants from oxidative damage. Plant physiol. 147, 1251–1263. doi: 10.1104/pp.108.122465
Norelli, J. L., Farrell, R. E., Bassett, C. L., Baldo, A. M., Lalli, D. A., Aldwinckle, H. S., et al. (2009). Rapid transcriptional response of apple to fire blight disease revealed by cDNA suppression subtractive hybridization analysis. Tree Genet. Genomes 5, 27–40. doi: 10.1007/s11295-008-0164-y
Pandey, M. K., Roorkiwal, M., Singh, V. K., Ramalingam, A., Kudapa, H., Thudi, M., et al. (2016). Emerging genomic tools for legume breeding: current status and future prospects. Front. Plant Sci. 7:455. doi: 10.3389/fpls.2016.00455
Peters, S., Mundree, S. G., Thomson, J. A., Farrant, J. M., and Keller, F. (2007). Protection mechanisms in the resurrection plant Xerophyta viscosa (Baker): both sucrose and raffinose family oligosaccharides (RFOs) accumulate in leaves in response to water deficit. J. Exp. Bot. 58, 1947–1956. doi: 10.1093/jxb/erm056
Porollo, A. (2014). EC2KEGG: a command line tool for comparison of metabolic pathways. Source Code Biol. Med. 9:19. doi: 10.1186/1751-0473-9-19
Prohens, J. (2011). Plant breeding: a success story to be continued thanks to the advances in genomics. Front. Plant Sci. 2:51. doi: 10.3389/fpls.2011.00051
Ruijter, J. M., Van Kampen, A. H. C., and Baas, F. (2002). Statistical evaluation of SAGE libraries: consequences for experimental design. Physiol. Genomics 11, 37–44. doi: 10.1152/physiolgenomics.00042.2002
Sanderson, M. A., Byers, R. A., Skinner, R. H., and Elwinger, G. F. (2003). Growth and complexity of white clover stolons in response to biotic and abiotic stress. Crop Sci. 43, 2197–2205. doi: 10.2135/cropsci2003.2197
Singh, M., Kumar, J., Singh, S., Singh, V. P., and Prasad, S. M. (2015). Roles of osmoprotectants in improving salinity and drought tolerance in plants: a review. Rev. Environ. Sci. BioTechnol. 14, 407–426. doi: 10.1007/s11157-015-9372-8
Smart, R. E., and Bingham, G. E. (1974). Rapid estimates of relative water-content. Plant Physiol. 53, 258–260. doi: 10.1104/pp.53.2.258
Storey, J. D. (2002). A direct approach to false discovery rates. J. R. Stat. Soc. B Stat. Methodol. 64, 479–498. doi: 10.1111/1467-9868.00346
Taji, T., Ohsumi, C., Iuchi, S., Seki, M., Kasuga, M., Kobayashi, M., et al. (2002). Important roles of drought- and cold-inducible genes for galactinol synthase in stress tolerance in Arabidopsis thaliana. Plant J. 29, 417–426. doi: 10.1046/j.0960-7412.2001.01227.x
Tattini, M., Galardi, C., Pinelli, P., Massai, R., Remorini, D., and Agati, G. (2004). Differential accumulation of flavonoids and hydroxycinnamates in leaves of Ligustrum vulgare under excess light and drought stress. New Phytol. 163, 547–561. doi: 10.1111/j.1469-8137.2004.01126.x
Thimm, O., Blasing, O., Gibon, Y., Nagel, A., Meyer, S., Kruger, P., et al. (2004). MAPMAN: a user-driven tool to display genomics data sets onto diagrams of metabolic pathways and other biological processes. Plant J. 37, 914–939. doi: 10.1111/j.1365-313X.2004.02016.x
Torres-Franklin, M. L., Gigon, A., De Melo, D. F., Zuily-Fodil, Y., and Pham-Thi, A. T. (2007). Drought stress and rehydration affect the balance between MGDG and DGDG synthesis in cowpea leaves. Physiol. Plant. 131, 201–210. doi: 10.1111/j.1399-3054.2007.00943.x
Toumi, I., Gargouri, M., Nouairi, I., Moschou, P. N., Ben Salem-Fnayou, A., Mliki, A., et al. (2008). Water stress induced changes in the leaf lipid composition of four grapevine genotypes with different drought tolerance. Biol. Plant. 52, 161–164. doi: 10.1007/s10535-008-0035-2
Turner, L. B. (1990). The extent and pattern of osmotic adjustment in white clover (Trifolium repens L.) during the development of water-stress. Ann. Bot. 66, 721–727.
Wang, X. (2004). Lipid signaling. Curr. Opin. Plant Biol. 7, 329–336. doi: 10.1016/j.pbi.2004.03.012
Yamakawa, H., and Hakata, M. (2010). Atlas of rice grain filling-related metabolism under high temperature: joint analysis of metabolome and transcriptome demonstrated inhibition of starch accumulation and induction of amino acid accumulation. Plant Cell Physiol. 51, 1599–1599. doi: 10.1093/pcp/pcq122
Keywords: white clover, drought, recovery, SSH libraries, MiSeq
Citation: Bisaga M, Lowe M, Hegarty M, Abberton M and Ravagnani A (2017) Deep Sequencing of Suppression Subtractive Hybridisation Drought and Recovery Libraries of the Non-model Crop Trifolium repens L. Front. Plant Sci. 8:213. doi: 10.3389/fpls.2017.00213
Received: 04 November 2016; Accepted: 03 February 2017;
Published: 23 February 2017.
Edited by:
Viswanathan Chinnusamy, Indian Agricultural Research Institute, IndiaReviewed by:
Gunvant Baliram Patil, University of Missouri, USAYajun Wu, South Dakota State University, USA
Copyright © 2017 Bisaga, Lowe, Hegarty, Abberton and Ravagnani. This is an open-access article distributed under the terms of the Creative Commons Attribution License (CC BY). The use, distribution or reproduction in other forums is permitted, provided the original author(s) or licensor are credited and that the original publication in this journal is cited, in accordance with accepted academic practice. No use, distribution or reproduction is permitted which does not comply with these terms.
*Correspondence: Adriana Ravagnani, YWRyQGFiZXIuYWMudWs=
†Present Address: Michael Abberton, International Institute of Tropical Agriculture, Ibadan, Nigeria
 Maciej Bisaga
 Matthew Lowe
 Matthew Hegarty
 Michael Abberton
 Adriana Ravagnani
