 Chao Yan1†
 Ying Li
 Xilin Hou
- 1State Key Laboratory of Crop Genetics and Germplasm Enhancement, Key Laboratory of Biology and Germplasm Enhancement of Horticultural Crops in East China, Ministry of Agriculture, Nanjing Agricultural University, Nanjing, China
- 2School of Life Science and Food Engineering, Huaiyin Institute of Technology, Huaian, China
ATP-binding cassette (ABC) proteins can act as transporters of different substrates across biological membranes by hydrolyzing ATP. However, little information is available about ABC transporters in Brassica rapa, an important leafy vegetable. In the present study, we carried out genome-wide identification, characterization and molecular evolution analyses of ABC gene family in B. rapa and 9 other plant species. A total of 179 B. rapa ABC genes (BraABCs) were identified. Among them, 173 BraABCs were identified on 10 chromosomes. Based on phylogenetic analysis and domain organization, the BraABC family could be grouped into eight subfamilies. BraABCs in the same subfamily showed similar motif composition and exon-intron organization. Common and unique cis-elements involved in the transcriptional regulation were also identified in the promoter regions of BraABCs. Tissue-expression analysis of BraABCs demonstrated their diverse spatiotemporal expression profiles. Influences of the whole genome triplication (WGT) on the evolution of BraABCs were studied in detail. BraABCs were preferentially retained compared with their neighboring genes during diploidization after WGT. Synteny analysis identified 76 pairs of syntenic BraABC paralogs among the three subgenomes of B. rapa, and 10 paralog pairs underwent positive selection with ω (= Ka/Ks) ratios greater than 1. Analyses of the expression patterns of syntenic BraABC paralogs pairs across five tissues and under stress treatments revealed their functional conservation, sub-functionalization, neo-functionalization and pseudogenization during evolution. Our study presents a comprehensive overview of the ABC gene family in B. rapa and will be helpful for the further functional study of BraABCs in plant growth, development, and stress responses.
Introduction
ATP-binding cassette (ABC) transporters constitute one of the largest gene families that are ubiquitously present in all living organisms, from prokaryotes to humans (Dassa and Bouige, 2001). The majority of ABC proteins that have been characterized are ATP-dependent, and membrane-bound transporters are able to translocate a wide range of molecules through intra- and extracellular membranes (Higgins, 1992). Plant genomes are characterized by a large number of ABC genes (ABCs) encoding for more than 100 ABC transporters, which is more than most other organisms, that are involved in a broad range of biological functions (Kang et al., 2011).
The possession of a nucleotide-binding domain (NBD) is usually used to define ABC proteins (Verrier et al., 2008). There are several highly conserved motifs within the NBD domain, including the Walker A and Walker B sequences, the ABC signature motif, the H loop and the Q loop (Higgins and Linton, 2004). Apart from the NBD domain, ABC proteins also contain hydrophobic transmembrane domains (TMDs). Several transmembrane α-helices are generally present in TMDs. NBDs usually act as energy providers for substrate translocation or non-transport processes by ATP-binding and ATP- hydrolyzing. TMDs function as recognizers and channels for substrates to translocate the lipid bilayer (Sánchez-Fernández et al., 2001). In eukaryotes, there are two common arrangements for ABC transporters: full-sized transporters and half-sized transporters. The structure of canonical ABC transporters (full-sized ABCs) contains four domains: two NBDs and two TMDs in a single polypeptide. Half-sized transporters consist of only two domains (1 TMD and 1 NBD). Half-sized ABCs have to form homo- or heterodimers to conduct the function of the substrate pump. ABC proteins lacking a TMD are usually not involved in transmembrane transport.
Several categorization methods have been proposed to classify ABC proteins, of which the Human Genome Organization (HUGO) scheme has currently been widely adopted to classify human and plant ABC proteins (Dean et al., 2001; Verrier et al., 2008). According to the HUGO scheme, eukaryotic ABC proteins are divided into eight subfamilies based on the NBD phylogenetic relationship, homologous relationship and domains organization: from ABC subfamily A (ABCA) to ABC subfamily H (ABCH). ABCH was identified in arthropod genomes, but is absent in fungi, mammals and plants (Annilo et al., 2006; Dermauw and Van Leeuwen, 2014). Recently, ABC subfamily I (ABCI) containing the “prokaryotic”-type ABCs was found in plants but is absent in most animal genomes (Verrier et al., 2008). In total, nine subfamilies (ABCA-ABCI) have been identified, and eight of them (ABCA-ABCG and ABCI) are present in plant genomes (Kang et al., 2011). Proteins of the ABCA-ABCD subfamilies have a forward direction for domains organization (TMD-NBD). Relatively, the proteins of the ABCG and ABCH subfamilies contain the reverse domain organization (NBD-TMD). While ABCE and ABCF proteins consist of only two NBDs, these proteins are characterized as soluble proteins. ABCI proteins usually possess only one single domain, mainly NBD or TMD. The genetic evidence indicates that some of these single domains encoded by ABCI proteins can assemble into functional multi-subunit ABC transporters (Verrier et al., 2008).
The functions of ABC proteins in humans have been extensively studied. In addition to acting as active transporters, some ABCs function as ion channels, receptors or are even involved in mRNA translation and ribosome biogenesis. In humans, ABCs are also identified as having multidrug resistances in cancer cells; for example, proteins within the ABCB and ABCG subfamilies can protect cells from hydrophobic xenobiotics (Sarkadi et al., 2006). In plants, ABCs were initially identified as transporters participating in detoxification processes (Martinoia et al., 1993). Subsequently, an increasing number of plant ABCs have been functionally characterized as far away from detoxification functions. Plant ABCs participate in many important physiological and developmental processes; furthermore, the transport substrates of plant ABCs are divergent and include conjugated compounds, phytohormones, primary products, lipids and lipophilic compounds (Kang et al., 2011).
The evolution of the angiosperm genome is characterized by polyploidization through whole-genome duplication (WGD), followed by diploidization, which is typically accompanied by considerable homoeologous gene loss (Stebbins, 1950). A number of polyploidy events have been identified along different lineages of flowering plants. After polyploidy, duplicated genes experience different fates over evolutionary time. Most likely, one copy of paralogous genes loses or becomes pseudogenes (Lynch and Conery, 2000, 2003). However, numerous functional importance duplicated gene pairs can survive by undergoing tens of millions of years of natural selection (Schnable et al., 2009; Schmutz et al., 2010). Gene categories whose products include transcription factors, ribosomal proteins or protein kinases are preferentially retained (Blanc and Wolfe, 2004; Maere et al., 2005). This can be explained by the gene dosage hypothesis, positing that genes whose products interact with one another or in networks tend to be dosage sensitive and would be over-retained (Thomas et al., 2006; Birchler and Veitia, 2007). In sum, duplicated genes undergo one of the following evolutionary fates: functional conservation (in which both copies maintain the same function), sub-functionalization (the ancestral function is subdivided between copies), neo-functionalization (one copy acquires a new function) or pseudogenization (one copy becomes unexpressed or functionless) (Lynch and Conery, 2000).
Brassicaceae is a large plant family containing ~338 genera and 3,700 species (Bailey et al., 2006). Owing to its remarkable species, genetic and physiological diversity, as well as significant economic potential, Brassicaceae has become a model for polyploidy and evolutionary studies. In Brassicaceae, Arabidopsis underwent three WGD events after its lineage diverged from the monocot lineage: the paleo-hexaploidy (γ) duplication shared with most dicots and two subsequent genome duplications (α and β) since its divergence from Carica papaya (Bowers et al., 2003). B. rapa, a diploid Brassica species, not only shared the three paleo-polyploidy events with Arabidopsis but also underwent a further whole genome triplication (WGT) since its divergence from Arabidopsis 13 to 17 million years ago (Town et al., 2006). After the WGT, B. rapa has undergone considerable fractionation: the 41,174 genes in the B. rapa genome are considerably fewer than would be expected from a simple WGT of the ~27,000 genes in the Arabidopsis genome (Wang et al., 2011). The extent of gene loss varies among the three subgenomes. The LF (least fractionated) subgenome retains ~70% of the genes found in Arabidopsis, whereas the MF1 (medium fractionated) and MF2 (most fractionated) subgenomes retain ~46 and 36%, respectively (Wang et al., 2011). B. rapa, because of its close relationship with Arabidopsis and representative WGT event, has thus become an excellent model for studying the evolution of genome structure and gene fate after WGD.
As a superfamily, ~22 out of 130 Arabidopsis ABCs (AtABCs) have been functionally characterized in the model plant. B. rapa is an important leafy vegetable in the Brassicaceae family; however, little information about the ABC gene family is available in B. rapa. The objective of the present study was to conduct a genome-wide identification and characterization of the ABC gene family in B. rapa. We carried out comprehensive studies of the ABC gene family in B. rapa for the first time, including the phylogenetic relationships, chromosomal locations, gene structures, cis-elements, and expression profiles of BraABCs in different tissues. Influences of WGT on the evolution of BraABCs were also analyzed, including the retention and conservation of BraABCs after WGT and syntenic BraABC paralog pairs among three subgenomes of B. rapa. Expression patterns of syntenic paralog BraABCs in different tissues and under various abiotic stresses were also determined to investigate their molecular evolutionary fates. Our findings provide a basis for better understanding of the function and evolutionary history of BraABCs and will help to further investigate the detailed molecular and biological functions of BraABCs.
Materials and Methods
Data Sources and ABC Sequences Retrieval
The B. rapa annotated genome sequences were downloaded from the Brassica database (BRAD; http://brassicadb.org/brad/; Cheng et al., 2011). Several datasets and multiple steps were used to conduct a whole-genome search. Hmmsearch from the HMMER program (3.0) (Eddy, 1998) was used to search the Brassica rapa genome to identify putative ABCs containing the ABC-transporter domain (PF00005), the ABC-2 transporter domain (PF01061), the ABC transporter transmembrane region domain (PF00664), the CYT domain (PF01458) or the mce related protein domain (PF02470) at a threshold of E < 1E−4. The Hidden Markov Model (HMM) profiles of these domains were downloaded from the Pfam 27.0 database (http://Pfam.sanger.ac.uk/; Finn et al., 2013). Then, we manually verified the candidate ABCs using the SMART database (http://smart.embl-heidelberg.de/; Letunic et al., 2012), and sequences with obvious errors and/or lengths of less than 100 amino acids were manually removed.
Multiple Alignment and Phylogenetic Analysis of the ABC Gene Family
Amino acid sequences of the ABC-transporter domain (PF00005) were extracted according to their locations in ABC proteins. Multiple alignments of ATPase domain sequences were conducted using ClustalW (Thompson et al., 1997) of the MEGA6 (Tamura et al., 2013) software with the default options. The phylogenetic trees were constructed using the maximum likelihood (ML) method in MEGA6 with the Jones, Taylor, and Thornton (JTT) amino acid substitution model. One thousand bootstrap replications were performed in each analysis. The remaining parameters were set to the defaults.
Conserved Motifs Identification and Exon-Intron Structure Analysis
Conserved motifs of ABC proteins were identified using the local MEME software version 4.9.0 (Bailey et al., 2009), with the following parameter settings: maximum number of motifs = 15, and optimum motif width = 10–200 residues; the other parameters were the defaults. The coding sequences (CDSs) and the DNA sequences were used to predict the exon-intron structure of ABCs using the Gene Structure Display Server 2.0 (GSDS 2.0) (http://gsds.cbi.pku.edu.cn; Hu et al., 2015).
Cis-Elements Analysis and Proteins Interaction Network Prediction
All of the promoter sequences (2,000 bp upstream of initiation codon “ATG”) of BraABCs were extracted from the B. rapa genome according to the Generic File Format (GFF) file. Then, the cis-regulatory elements of promoters for each gene were identified by PLACE Web Signal Scan-PLACE (https://sogo.dna.affrc.go.jp/cgi-bin/sogo.cgi?lang=en&pj=640&action=page&page=newplace). The interaction network of BraABC proteins was constructed by applying STRING software (Search Tool for the Retrieval of Interacting Genes/Proteins, http://string-db.org/).
Gene Chromosomal Location, Gene Synteny Analysis, and Syntenic BraABCs Paralogs Pair Identification
Chromosomal locations of BraABCs were drawn from top to bottom on B. rapa chromosomes according to their positions in genome annotation. The Perl in-house program was used to draw the location images of BraABCs on chromosomes. Syntenic relationships of ABCs between Arabidopsis and B. rapa were identified by searching “syntenic gene” in the Brassica database (BRAD) (Cheng et al., 2011). Then, the Circos program (Krzywinski et al., 2009) was applied to present the syntenic relationships on their chromosomes.
After the identification of the BraABCs, syntenic BraABCs paralogs pairs among the three B. rapa subgenomes were identified by searching “syntenic gene” in BRAD (Cheng et al., 2011). The non-synonymous substitution rate (Ka), the synonymous substitution rate (Ks) and the ω (= Ka/Ks) of paralog pairs were estimated by KaKs_Calculator 2.0 (Wang et al., 2010). The duplication date of paralog pairs was estimated according to formula T = Ks/2λ, assuming a clock-like rate (λ) of 1.5 synonymous substitutions per 108 years for B. rapa (Koch et al., 2000).
Expression Pattern Analysis
To analyze the expression patterns of BraABCs in different tissues, we used the reported Illumina RNA-seq data by Tong et al. (2013). Of the dataset, five tissues, including the roots, stems, leaves, flowers and siliques of B. rapa accession Chiifu-401-42 were analyzed. Gene expression levels were quantified by FPKM (Fragments Per Kilobase of transcript per Million fragments mapped) values. An expression cluster of BraABCs in the five tissues was generated by Cluster 3.0 (http://bonsai.hgc.jp/~mdehoon/software/cluster/software.htm), and the cluster results were shown using Tree View software (http://jtreeview.sourceforge.net/). The RNA-seq dataset was also used to analyze the expression profiles of syntenic paralog pairs in different tissues.
To investigate the expression patterns of syntenic BraABC paralog pairs under normal and abiotic stress conditions, the cultivar Chiifu-401-42 was cultivated in potting soil at 24/16°C, with a photoperiod of 14/10 h for day/night in a growth chamber. Five-leaf-stage plants were used to conduct different abiotic stress treatments under continuous time (6, 12, and 24 h). Hormone treatment was performed with 100 μM ABA; for drought stress treatment, the pots were irrigated with 15% (w/v) polyethylene glycol PEG and kept standing in the irrigation solution for 30 min under normal growth conditions; salt treatment was performed with 250 mM NaCl. After the treatments, the total RNAs were isolated from young leaves using an RNA kit (TaKaRa, Dalian, China). The RNAs were reverse transcribed into cDNA with a PrimeScript RT reagent Kit (TaKaRa, Dalian, China). Six pairs of syntenic paralogs were randomly selected to conduct qRT-PCR. The B. rapa actin gene Bra028615 was used as an internal control. Primers for qRT-PCR were designed using Beacon Designer 7. The qRT-PCR experiments were performed with three biological and technical replicates. The SYBR Premix Ex Taq kit® (TaKaRa, Dalian, China) was used to detect gene expression according to the manufacturer's recommendations on the One-step Real-Time PCR System Time PCR Detection System (Applied Biosystems, Foster City, CA, USA). The cycling profile was as follows: 94°C for 30 s, 94°C for 10 s for 40 cycles, and 58°C for 30 s, followed by a melting curve analysis at 65°C for 10 s for 61 cycles. The relative gene expression levels were analyzed using the comparative Ct value method (Heid et al., 1996).
Results
Genome-Wide Identification, Phylogenetic Analysis, and Classification of ABC Genes in B. rapa
To explore all of the putative ABCs in the B. rapa genome, the HMM profiles of the ABC-transporter domain, the ABC-2 transporters domain, the ABC transporter transmembrane region domain, the CYT domain and the mce related protein domain were employed as queries to search against the protein database of B. rapa using the Hmmsearch program. A total of 179 BraABCs, which contained at least one of the above domains, were identified (Table 1). Among the 179 BraABC proteins, 162 proteins contained one or more NBD domains, and an additional 17 proteins without NBD domains were assigned to ABCI, based on the domain composition of the ABC proteins (Verrier et al., 2008).
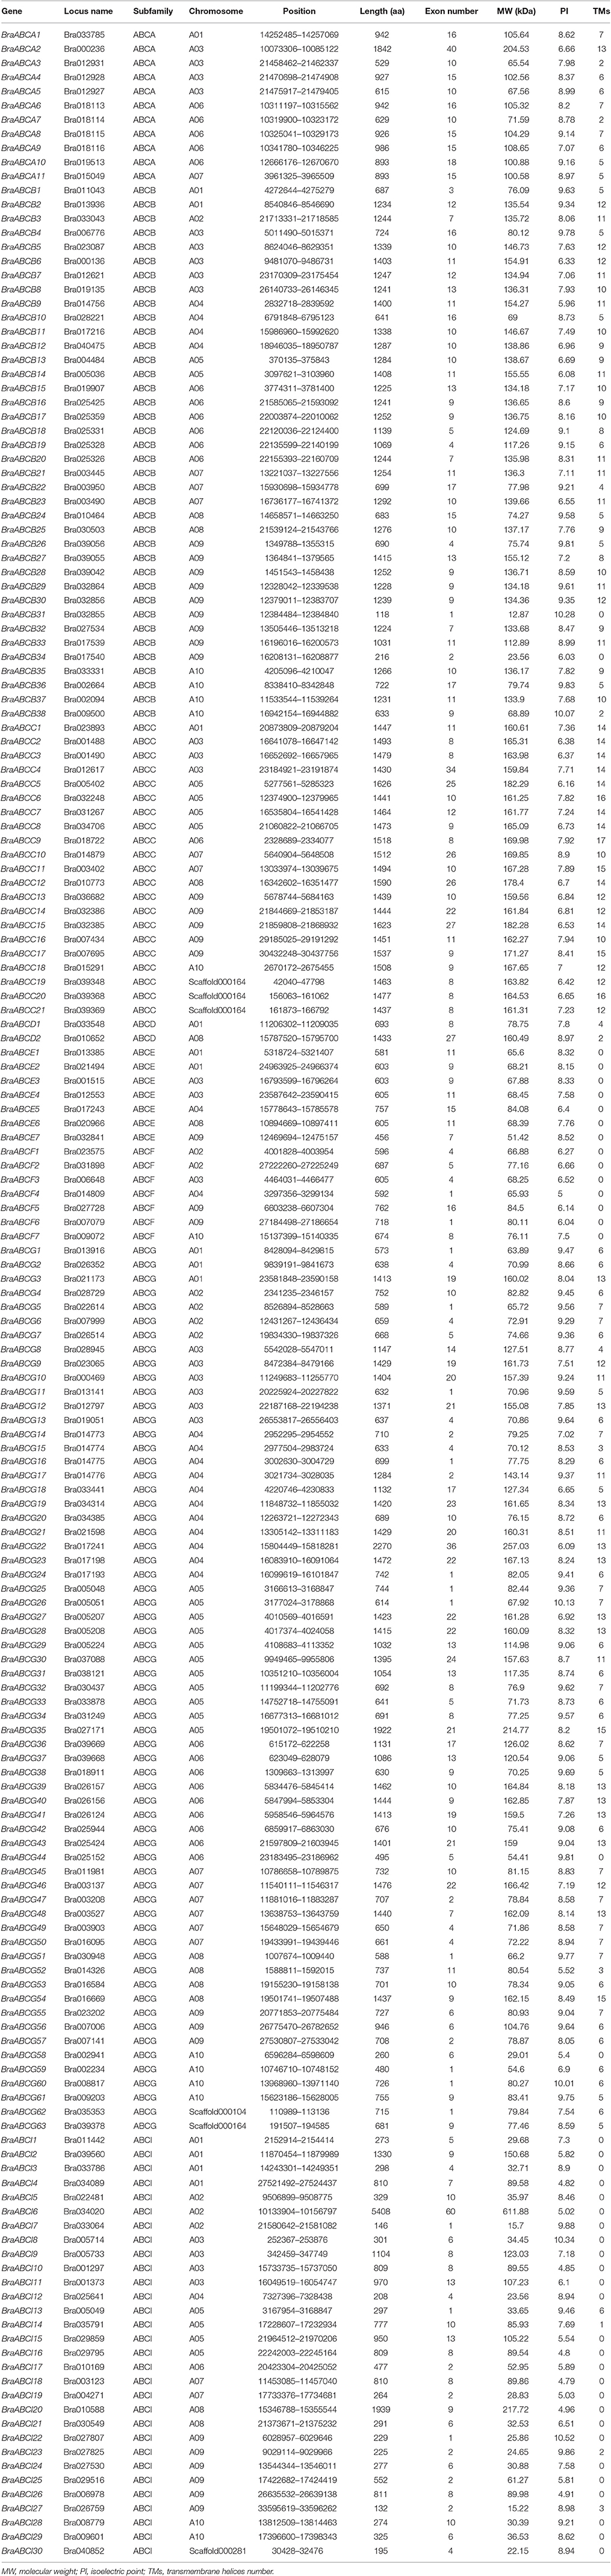
Table 1. Basic information about the ABC transporter gene family in B. rapa.
Understanding the evolutionary relationship between BraABC proteins and AtABC proteins could contribute to classifying and assessing the potential functions of BraABCs. The NBD domains of the 162 BraABC proteins and 117 AtABC proteins (117 AtABC proteins contained the NBD domain) were aligned, and an unrooted phylogenetic tree was constructed by MEGA6 using the Maximum Likelihood (ML) method with 1,000 bootstraps. The AtABC proteins of each subfamily were grouped together, whereas the proteins of ABCI were dispersive in the phylogenetic tree. Overall, BraABC proteins followed the phylogenetic pattern of Arabidopsis (Supplementary Figure 1). Based on the phylogenetic relationship with AtABCs, BraABCs were also divided into eight subfamilies: ABCA, ABCB, ABCC, ABCD, ABCE, ABCF, ABCG and ABCI. ABCG, ABCB, ABCI, and ABCC were the largest subfamilies containing 63, 38, 30, and 21 members, respectively. ABCA, ABCE, and ABCF included 11, 7, and 7 members, respectively. Only 2 members were identified in ABCD (Table 1). The protein domain organizations of BraABCs in each subfamily were consistent with that of Arabidopsis (Verrier et al., 2008).
Similarly, Hmmsearch searches were also conducted in the selected angiosperms: P. trichocarpa, G. max, A. lyrate, C. papaya, V. vinifera, B. distachyon, O. sativa, and A. trichopoda. The number of identified ABCs in these species ranged from 113 to 271 (Figure 1). There were 271 ABCs existing in the G. max genome, while the members in other species ranged from 113 in C. papaya, 130 in Arabidopsis, 132 in A. lyrate, 137 in A. trichopoda, 138 in B. distachyon, 141 in O. sativa, 179 in B. rapa, 181 in V. vinifera and 204 in P. trichocarpa. The identified ABCs in these species are listed in Supplementary Table 1.
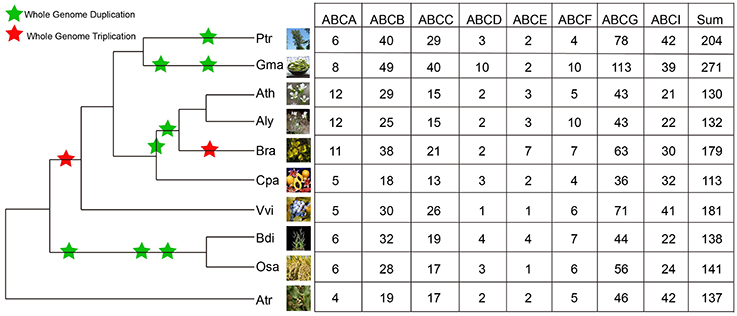
Figure 1. Distribution of ABCs in different plant species and subfamilies. Information regarding genome duplication or triplication was obtained from the Plant Genome Duplication Database. The phenotypic picture of each species was obtained from Phytozome 10. Ptr, Gma, Ath, Aly, Bra, Cpa, Vvi, Bdi, Osa, and Atr are the abbreviations of P. trichocarpa, G. max, A. thaliana, A. lyrate, B. rapa, C. papaya, V. vinifera, B. distachyon, O. sativa, and A. trichopoda, respectively.
To gain insight into the evolutionary history and relationship of ABCs in plants, we constructed a phylogenetic tree using ABCs of six representative species, including Arabidopsis (Verrier et al., 2008), B. rapa, C. papaya, V. vinifera, O. sativa, and A. trichopoda. In contrast with the ABCA-ABCG members, some ABCI proteins lacked the NBD domain, and some ABCI members were scattered in the phylogenetic tree, although they contained the NBD domain. Therefore, our phylogenetic tree was constructed using the NBD domains of ABCA-ABCG members from these species. As shown in Figure 2, seven distinct clades were clearly distinguished based on the tree topology, namely ABCA, ABCB, ABCC, ABCD, ABCE, ABCF, and ABCG, suggesting that these groups have diverged prior to the divergence of angiosperm. Next, the copy number of ABCs in each subfamily of these species was quantified (Figure 1). In each studied species, the copy numbers of different subfamilies varied greatly. For the copy numbers of subfamilies in all of the studied species, we found that ABCB, ABCC, ABCG, and ABCI were the larger subfamilies. ABCA, ABCD, ABCE, and ABCF contained a small number of members, and the copy numbers of ABCD, ABCE, and ABCF were relatively constant. B. rapa has undergone a further WGT since its divergence from Arabidopsis. Compared with Arabidopsis, the expansion of the ABC gene family in B. rapa was largely the result of the expansion of ABCs in ABCB, ABCC, ABCG, and ABCI (Figure 1).
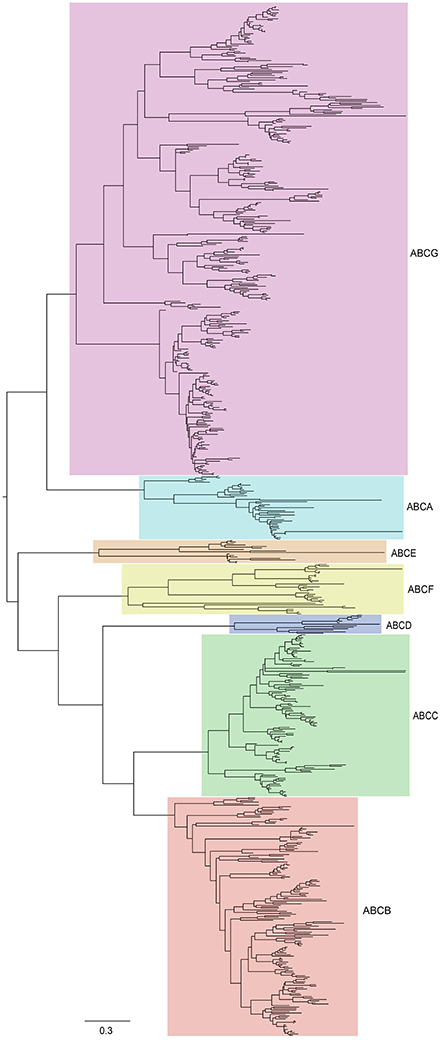
Figure 2. Phylogenetic relationships among ABCs in six plant species, including Arabidopsis, B. rapa, C. papaya, V. vinifera, O. sativa, and A. trichopoda. The unrooted tree was constructed by MEGA6 using the maximum-likelihood (ML) procedure with 1,000 bootstrap replicates. The tree can be divided into seven major clades (ABCA-ABCG). All subfamilies have been labeled by different colors.
The 179 BraABCs were designated as BraABCA1 through BraABCI30 according to their respective subfamily and their location on the chromosome (Table 1). The comprehensive information of BraABCs, including the locus name, gene location, predicted protein length, exon number, molecular weight (MW), isoelectric point (PI) and transmembrane helices number (TMs), is listed in Table 1. The size of the BraABC proteins varied from 118 (BraABCB31) to 5,408 (BraABCI6) amino acids, with an average of ~984 amino acids. There were few differences in the protein lengths of ABCC, ABCE and ABCF, whereas the protein lengths of ABCB, ABCG and ABCI changed greatly. The MWs of the BraABC proteins ranged from 12.87 kDa (BraABCB31) to 611.88 kDa (BraABCI6). The variation range of PI was from 4.79 (BraABCI18) to 10.52 (BraABCI22), indicating that these BraABC proteins might exist and function in different parts of the cells. Most of the BraABC proteins (162 out of 179, 90.5%) presented multiple exons and sixty proteins (33.5%) that contained more than 10 exons. The majority of the BraABC proteins contained transmembrane helices (TMs), except for all of the ABCE and ABCF proteins as well as parts of the ABCI proteins. The ubiquity of TMs was in accordance with the transmembrane transport functions of ABCs. Pairwise comparisons of the full-length BraABC protein sequences within each subfamily were conducted. The protein sequences within ABCA, ABCB, and ABCI exhibited higher identities than other subfamilies (Supplementary Figure 2). In contrast, the sequence identities of ABCD and ABCG were lower, indicating that the degree of sequence divergence of the two subfamilies was higher than other subfamilies. The other families, such as ABCC, ABCE, and ABCF exhibited medium sequence identities.
Chromosomal Locations and Tandem Array of BraABCs
A total of 173 BraABCs were located on the ten chromosomes (96.7%), and the other 6 genes were located on unanchored scaffolds (Figure 3). The BraABCs were unevenly distributed on the ten chromosomes. The largest number of BraABCs was found on chromosome A09 (26 genes), followed by A03 (25 genes). Chromosomes A06 and A05 also contained more than 20 BraABCs (22 and 21, respectively). In contrast, chromosomes A04, A01, A07, A10, A08, and A02 contained 18, 14, 14, 12, 11, and 10 BraABCs, respectively. Our results indicated that BraABCs within each subfamily were also unevenly distributed on the ten chromosomes.
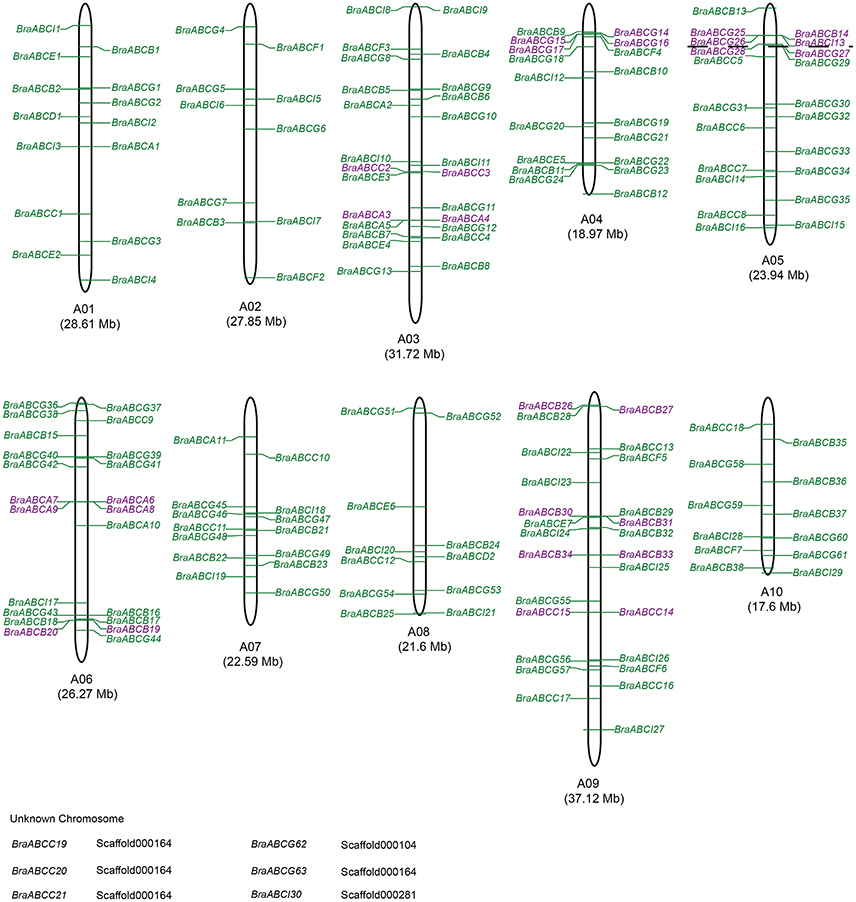
Figure 3. Chromosomal locations of BraABCs. Chromosome numbers and lengths are represented at the bottom of each chromosome. Tandem arrays of BraABCs are marked in purple. Six BraABCs could not be anchored onto a specific chromosome.
Simultaneously, we further identified tandem arrays of BraABCs along the 10 B. rapa chromosomes. A tandem array was defined as multiple members of BraABCs occurring within the same or neighboring intergenic regions. As shown in Figure 3, 11 BraABCs clusters (genes marked in purple) containing 28 tandemly duplicated genes were identified on chromosomes A03, A04, A05, A06, and A09.
Motif Composition and Exon-Intron Organization of BraABC Proteins
To better understand the conservation and diversity of motif compositions and gene structures of BraABCs, the conserved motifs and exon-intron organization of BraABCs were analyzed.
The conserved motifs of BraABC proteins in ABCA-ABCG were analyzed using MEME software, and we identified 15 conserved motifs (Figure 4). The lengths of the conserved motifs were between 26 and 154 amino acids. The number of the conserved motifs in each BraABC protein varied from 1 to 8. Several motifs were widely spread among BraABC proteins; for instance, motifs 1 and 3 were present in the most proteins of ABCA-ABCG. In contrast, other motifs were specific to only one or two subfamilies. For example, motifs 4, 5, 8, and 12 were specific to ABCB and ABCC, motifs 10 and 15 were specific to ABCB, and motif 14 was specific to ABCA. ABCG contained the specific motifs 2, 6, 7, 9, 11, and 13, and these motifs were probably required for specific protein functions. The varieties of motif compositions in different subfamilies suggested sources of functional differentiation in BraABCs during the evolutionary process. BraABC proteins grouped into the same subfamily exhibited similar motif characteristics, suggesting functional similarities for members in the same subfamily. Logos of the 15 identified motifs are shown in Supplementary Figure 3.
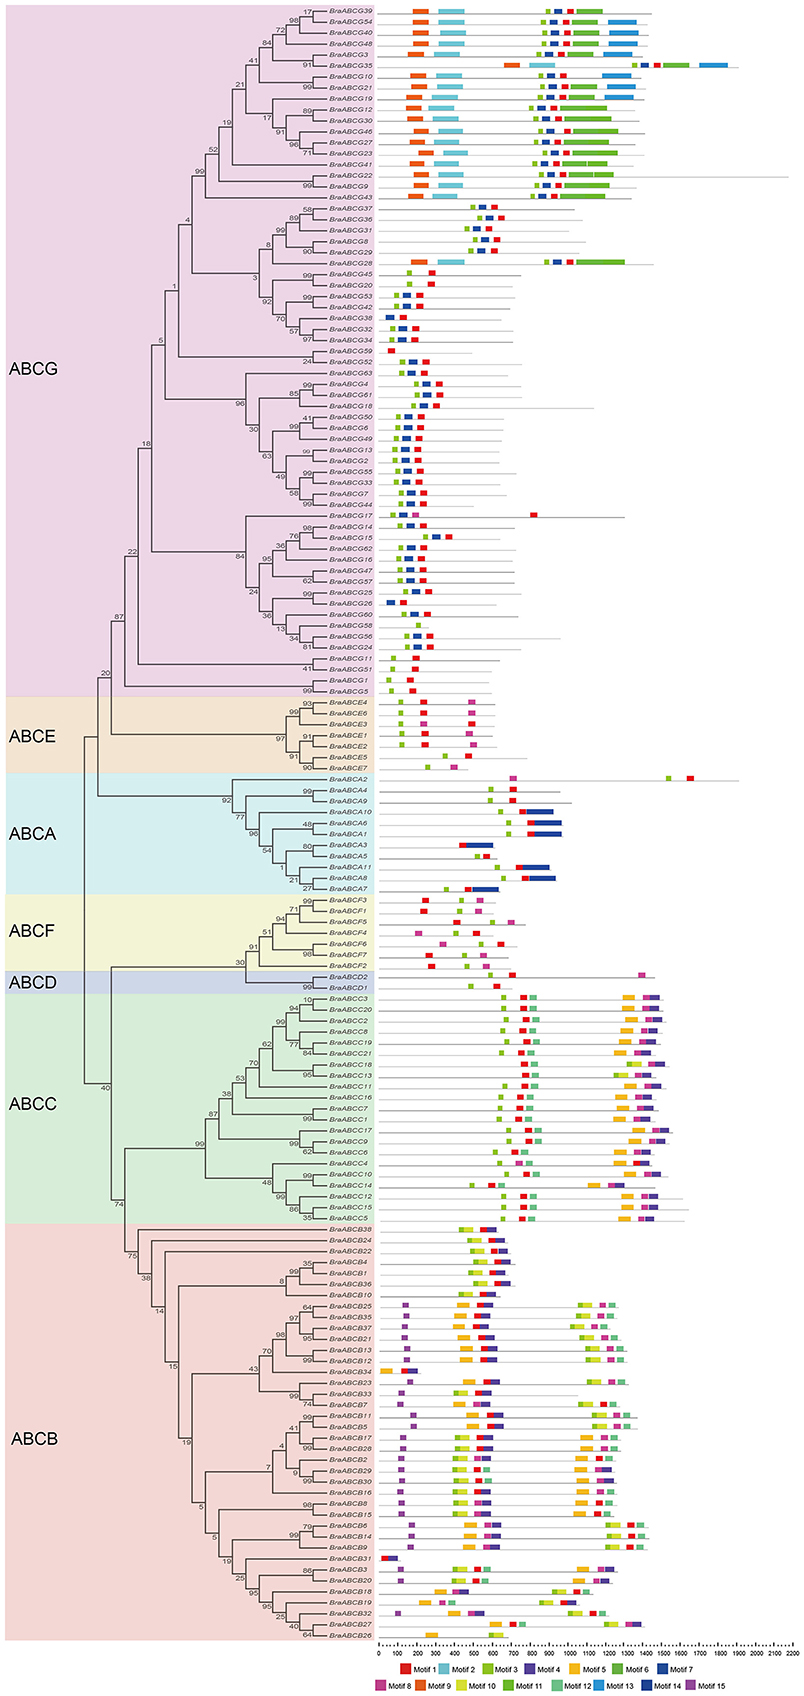
Figure 4. Conserved motifs of BraABCs according to the evolutionary relationship. The conserved motifs were elucidated using MEME with complete protein sequences. Different motifs are represented by different colors, numbered 1–15 at the bottom. The black lines represent the non-conserved sequences.
We also analyzed the exon-intron organizations of BraABCs using GSDS 2.0. Similar to the motif composition, most of the BraABCs within the same subfamily generally exhibited similar gene structure in terms of the numbers and lengths of introns and exons. Moreover, BraABCs that had a closely phylogenetic relationship and shared a more similar gene structure (Supplementary Figure 4).
Conservation of BraABCs following the Whole Genome Triplication Event
To explore the influences of WGT on the evolution of BraABCs, we studied the conservation of BraABCs after WGT. After diverging from Arabidopsis, the gene number of the B. rapa genome was ~42,000, which is considerably lower than the simple triplication of the ~30,000 genes in the Arabidopsis genome. Therefore, substantial genes must have been lost (fractionation) in B. rapa after triploidization (Wang et al., 2011). To evaluate the fractionation extent of BraABCs, we compared the retention of BraABCs relative to the set of 3,580 neighboring genes (10 on either side), flanking the 179 BraABCs (Supplementary Table 2). In comparison, 47.2% of BraABCs were retained in one copy, which was greater than the retention of neighboring genes (38.7%). A similar percent (33.7 and 30.6%, respectively) of BraABCs and neighboring genes were retained in the two copies. And more BraABCs (19.1%) were retained in the three copies than their neighboring genes (9.2%) (Figure 5A).
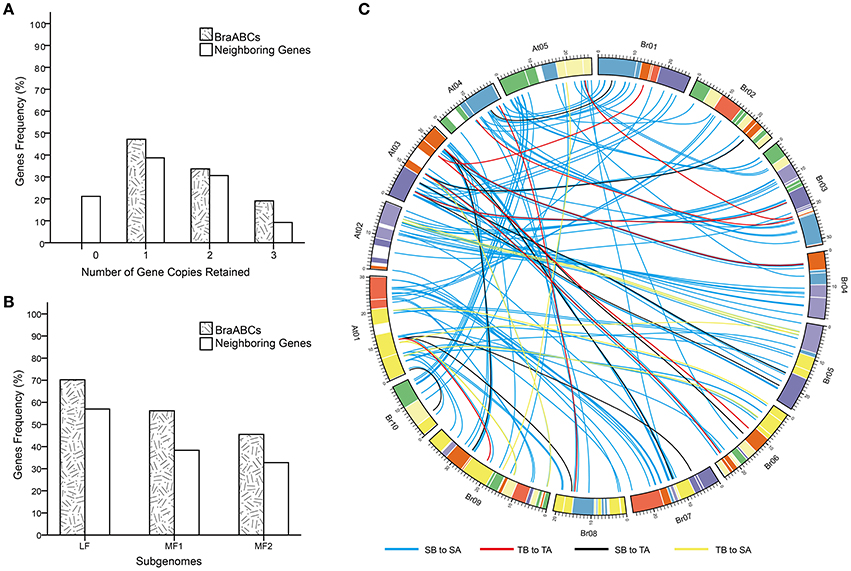
Figure 5. Retention of BraABCs and their neighboring genes (10 flanking genes on either side of BraABCs) in B. rapa. (A) Retention by the number of homologous copies in the syntenic region. (B) Retention of homologs among the three subgenomes of B. rapa. (C) Collinear correlations of ABCs between Arabidopsis and B. rapa. The B. rapa and Arabidopsis chromosomes are colored according to the inferred ancestral chromosomes following an established convention. SA, SB, TA, and TB are the abbreviations of a single copy of Arabidopsis, a single copy of BraABC, a tandem array of Arabidopsis and a tandem array of BraABCs, respectively. The four collinear correlations of SB to SA, TB to TA, SB to TA, and TB to SA are represented by blue, red, black, and yellow lines, respectively.
The triplicated B. rapa genome can be divided into three subgenomes: LF, MF1, and MF2. The subgenomes were grouped based on the level of gene loss relative to Arabidopsis since the WGT 13–17 MYA. Compared with their neighboring genes, more BraABCs were significantly retained in all three subgenomes. Consistent with the whole genome level, BraABCs distributed in the LF subgenome were more than two other subgenomes (Figure 5B). Given the well-conserved synteny between Arabidopsis and B. rapa (Cheng et al., 2012), in our study, there were four collinear relations for ABCs between B. rapa and Arabidopsis: a single copy of BraABC to a single copy of Arabidopsis (SB to SA); a tandem array of BraABCs to a tandem array of Arabidopsis (TB to TA); a single copy of BraABC to a tandem array of Arabidopsis (SB to TA); and a tandem array of BraABCs to a single copy of Arabidopsis (TB to SA). The four syntenic relations were presented using the Circos program (Figure 5C). On the whole, BraABCs were preferentially retained, consistent with the gene balance hypothesis and demonstrating the significance of ABCs in B. rapa.
Cis-Elements of BraABCs Involved in Transcriptional Regulation
To identify cis-elements related to transcriptional regulation, 2 kb promoter regions for each of the 179 BraABCs were identified. Gaps existed in the promoter regions of 13 BraABCs after assembling the B. rapa genome. Therefore, these BraABCs were excluded in the following study. Next, we applied the Plant Cis-acting Regulatory DNA Elements (PLACE) website to analyze the cis-elements and identified a total of 291 different cis-elements in all of the studied BraABCs.
A total of 13 common cis-regulatory elements were identified in all of the promoter regions of the BraABCs, which were highly conserved among all of the studied BraABCs (Table 2). Two common cis-regulatory elements, WRKY71OS and GT1CONSENSUS were responsive to plant hormones, including ABA, GA, and SA, suggesting that ABA, GA, and SA could affect the expression levels of BraABCs. Some common cis-regulatory elements were responsive to stresses, such as pathogens (WRKY71OS) and wounds (WBOXNTERF3). Of the 13 common cis-regulatory elements, GATABOX, IBOXCORE, and GT1CONSENSUS were required for transcriptional regulation by light. DOFCOREZM participated in carbon metabolism, and GATABOX played a role in molecular light switching; therefore, we speculated that BraABCs were likely to participate in energy metabolism. Two common cis-elements, POLLEN1LELAT52 and GTGANTG10, were required for transcriptional regulation in pollen, suggesting that BraABCs might be involved in the reproductive process.
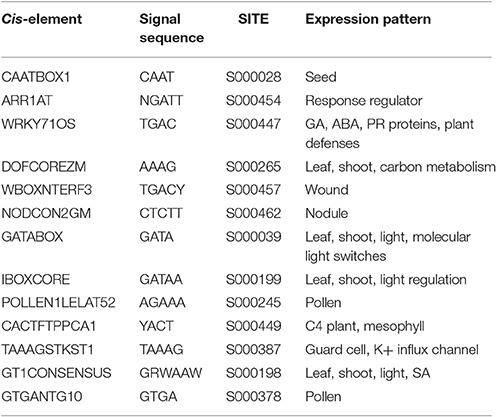
Table 2. Common putative cis-elements identified in the promoter sequences of BraABCs.
We also identified unique cis-element sequences that are present in the promoter regions of unique BraABCs. In total, 40 unique cis-elements were identified in the promoter regions of the 36 BraABCs (Supplementary Table 3). Interestingly, 3 unique cis-elements (ACGTSEED3, ABREMOTIFIOSRAB16B, and VOZATVPP) were presented in only BraABCF3. BraABCG18 and BraABCB10 both contained two unique cis-elements. There was only one unique cis-element present in the other 33 BraABCs. The unique cis-element of these genes indicated their expression specificity.
Gene Expression of BraABCs in Different Tissues
To characterize the expression patterns of individual BraABCs in different tissues, we used publicly available RNA-Seq data of different tissues as a resource (Tong et al., 2013). A heat map displaying the expression profiles of BraABCs in roots, stems, leaves, flowers and siliques was generated, and the BraABCs were clustered by their expression patterns. As shown in Figure 6A, the majority of BraABCs presented different expression patterns, whereas a few of them exhibited similar expression patterns. A total of 165 BraABCs (92.2%) were determined as being expressed in at least one tissue, and 117 BraABCs (65.4%) expressed in all tissues, including 3 ABCA genes, 26 ABCB genes, 19 ABCC genes, 2 ABCD genes, 5 ABCE genes, 6 ABCF genes, 37 ABCG genes and 19 ABCI genes. Relatively, the expression of 14 BraABCs was not detected in any of the five tissues. Some BraABCs also exhibited tissue-specific expression, and there were 8, 4, 4, 5, and 1 tissue-specific BraABCs in the roots, stems, leaves, flowers and siliques, respectively (Figure 6B), suggesting that these genes may play specific roles in the relevant tissues. As shown in Figure 6A, some genes of ABCA, ABCB, and ABCG exhibited variable expression profiles throughout the five tissues, such as BraABCA10, BraABCB13, and BraABCG25. In contrast, the majority of genes in ABCC, ABCD, ABCE, ABCF, and ABCI presented relatively consistent expression levels across the five tissues, such as BraABCC18, BraABCD2, BraABCE6, BraABCF1, and BraABCI14. As shown in Figure 6A, we found the expression profiles of BraABCs in the roots exhibited large differences compared with the other four tissues, whereas similar expression patterns of BraABCs were observed for the stems and leaves, and the flowers and siliques.
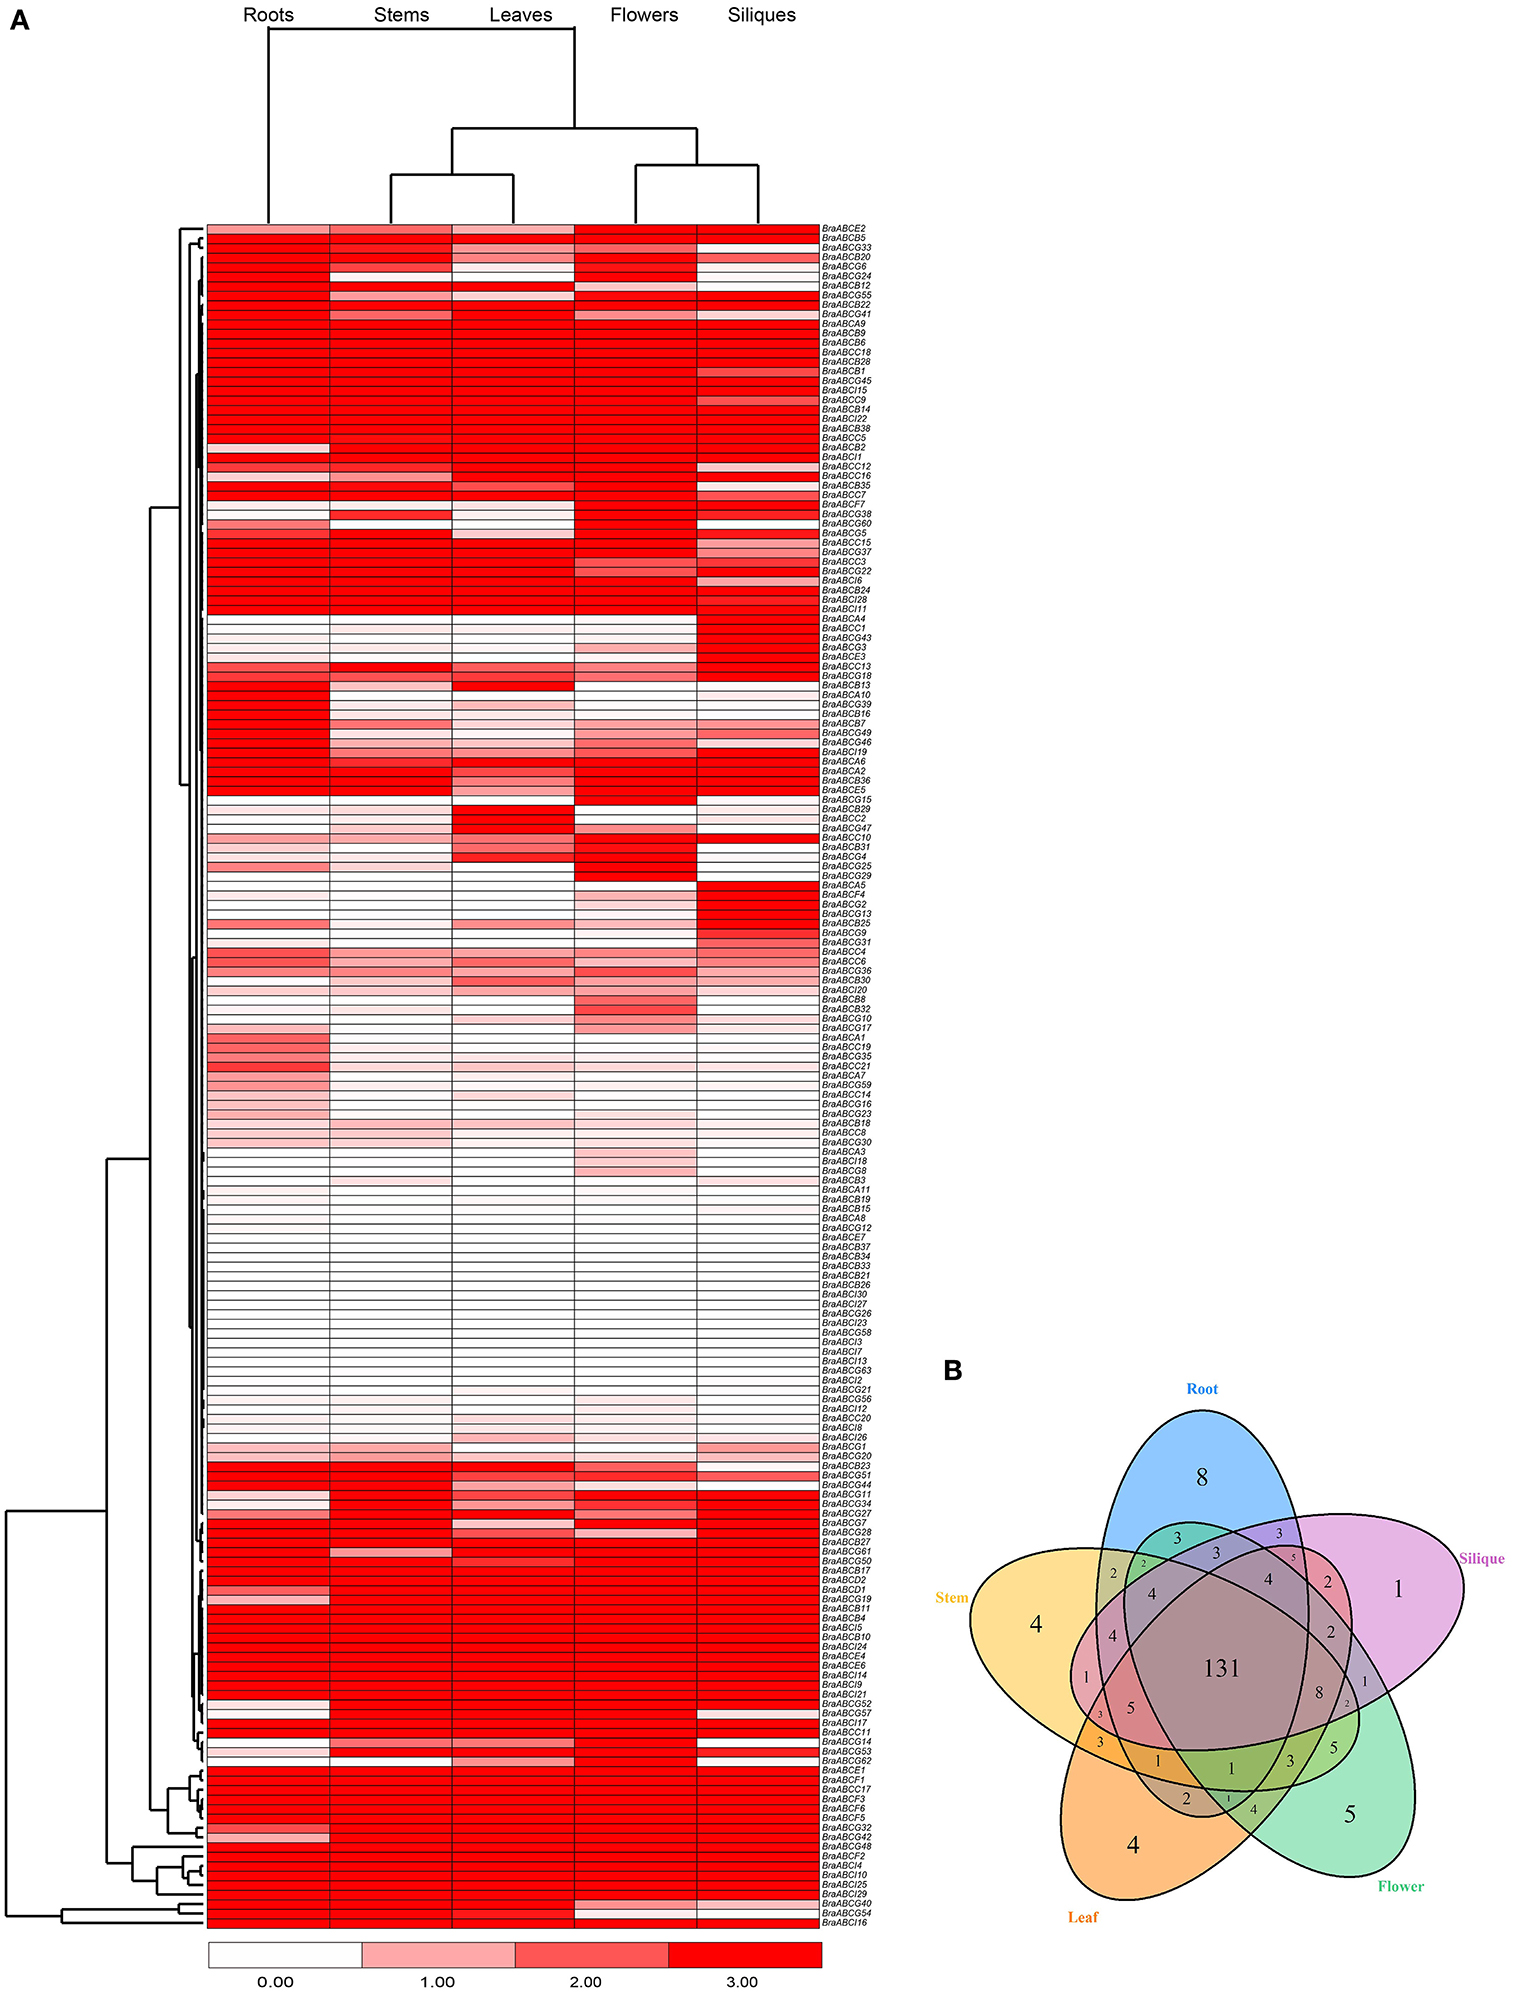
Figure 6. Expression patterns of BraABCs in five tissues. (A) Heat map of expression profiles (in log2-based FPKM) for BraABCs in the five tissues of roots, stems, leaves, flowers, and siliques. The expression levels are represented by the color bar. (B) Venn diagram analysis of the tissue-expression of BraABCs.
Syntenic BraABC Paralog Pairs among the Three Subgenomes of B. rapa
The three subgenomes of B. rapa are the evolutionary products of WGT and a lot of synteny blocks among them. Syntenic paralogs are genes that are located in the syntenic fragments. Syntenic BraABC paralog pairs among LF, MF1, and MF2 were identified by searching “syntenic gene” in the BRAD (Cheng et al., 2011). In total, 76 pairs of BraABC syntenic paralogs were identified among the three subgenomes (Table 3). Synonymous (Ks) and non-synonymous (Ka) values were calculated to explore the selective pressures on these paralog pairs. We found that the ω (= Ka/Ks) ratios of 10 syntenic paralogs (13.16%) were more than 1, indicating positive selection on these BraABC paralogs. The ABCC21_ABCC3 pair had the highest ω ratios, with a ratio of 1.9264. The rest of the paralogs were under purifying selection, with ω ratios lower than 1. Among them, the ω ratios of 22 paralog pairs were lower than 0.1, suggesting that these gene pairs underwent strong purifying selection stress, making the functions of these paralog pairs trend toward relative similarity. Furthermore, the duplication time of these paralogs pairs were estimated by using a relative Ks measure as a proxy for time. The estimated duplication time of BraABC paralog pairs indicated that it spanned from 3.45 to 42.2 MYA, with an average duplication time of ~15.13 MYA, which was consistent with the recent WGT time of B. rapa (13–17 MYA) (Wang et al., 2011).
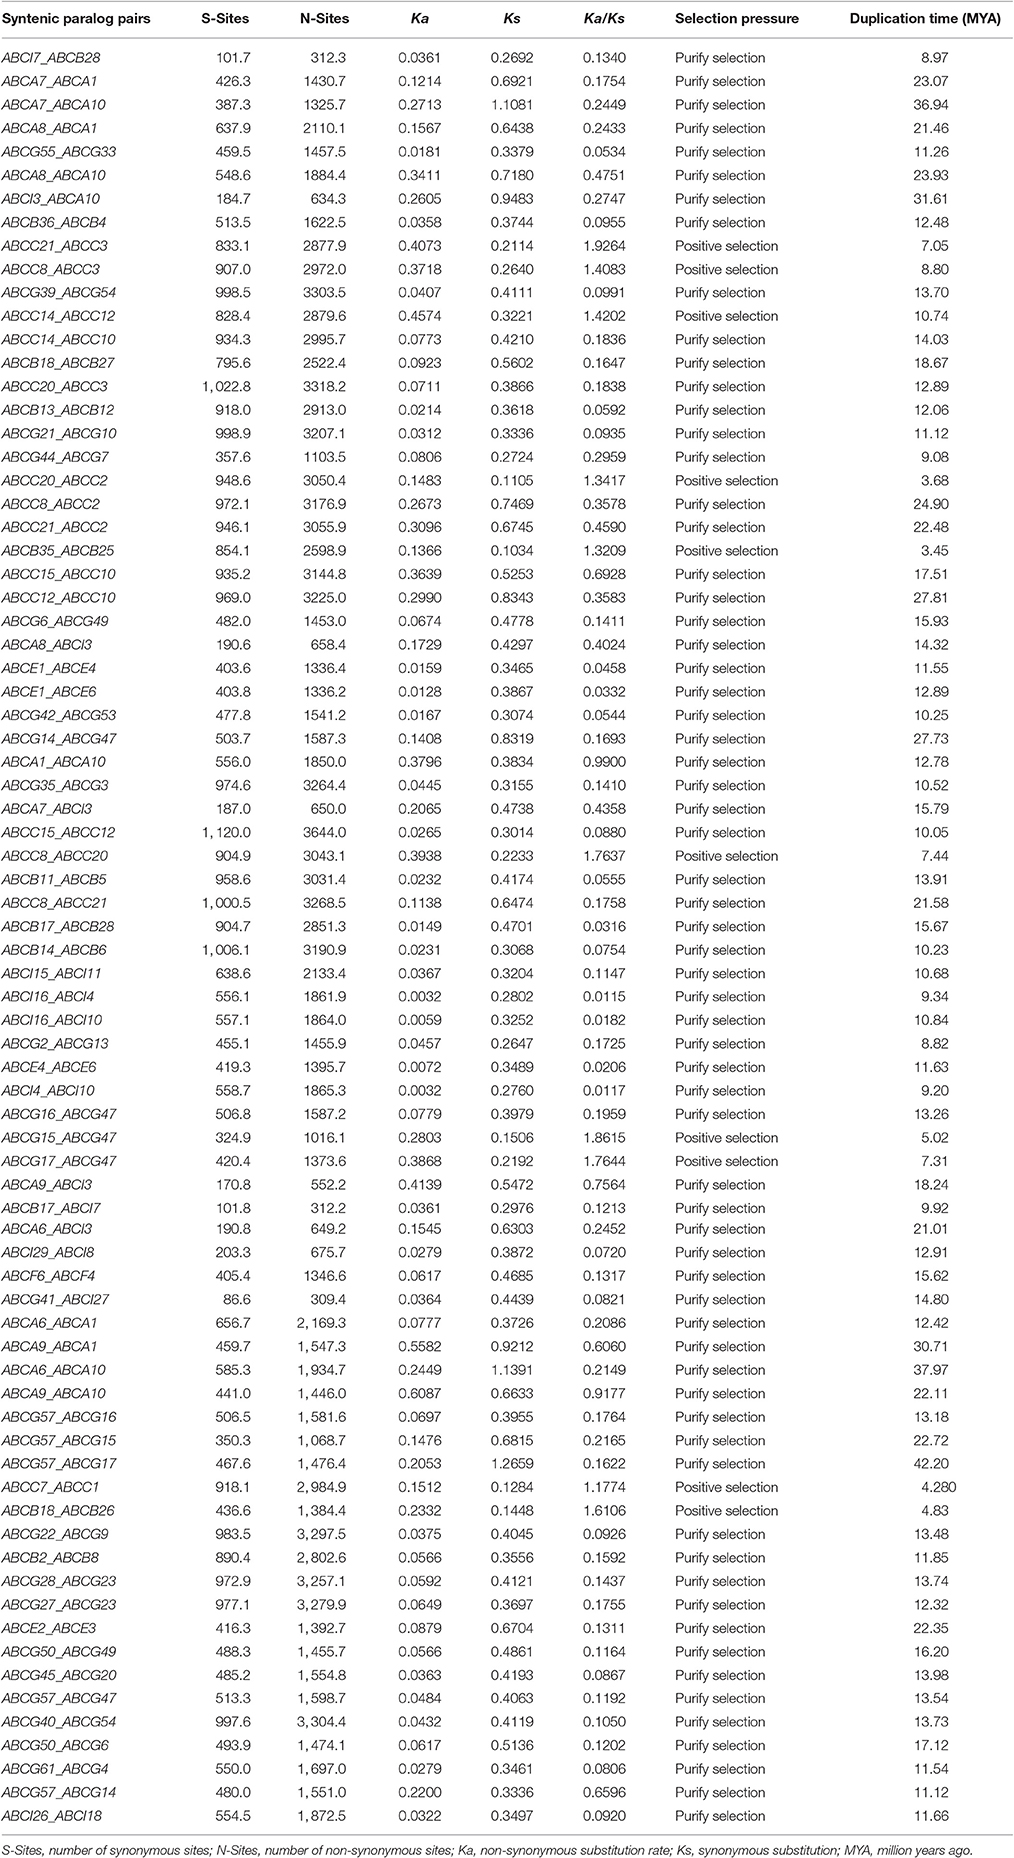
Table 3. Ka/Ks calculation of each pair of syntenic BraABC paralogs among three subgenomes.
Evolutionary Fates Prediction of Syntenic BraABC Paralog Pairs
Profiling gene expression may provide an ample amount of information about the mode and tempo of duplicated genes. To predict the evolutionary fates of syntenic BraABC paralog pairs, we took advantage of the deep RNA-Seq data of B. rapa to investigate their expression profiles in different tissues, including roots, stems, leaves, flowers and siliques (Tong et al., 2013). Generally, if a Pearson correlation coefficient (PCC) of the two factors is greater than 0.6, we can infer that they have a close positive correlation. Among the 76 pairs of paralogs, 27 pairs had positive expression correlations across the five tissues, which were greater than 0.6 measured by the PCCs (Figure 7). Such high positive correlations among these paralog pairs probably indicated functional conservation or sub-functionalization for these paralog pairs after duplication. Simultaneously, 40 pairs of syntenic paralogs were negatively correlated with negative PCC values or exhibited little correlation with small positive PCC values in gene expression, suggesting neo-functionalization for these paralog pairs. Furthermore, there were 9 pairs of paralogs in which one copy of each pair did not express in any of the 5 tissues. Therefore, there were no available (NA) results of PCCs for these paralog pairs. Among the 9 paralog pairs, 8 pairs were composed of genes from two different subfamilies, and one copy of each of these paralog pairs was the ABCI gene. Interestingly, all of these ABCI genes were not expressed in any of the studied tissues, indicating that they probably became pseudogenes. Therefore, pseudogenization of these 9 pairs of paralogs may occur during evolution.
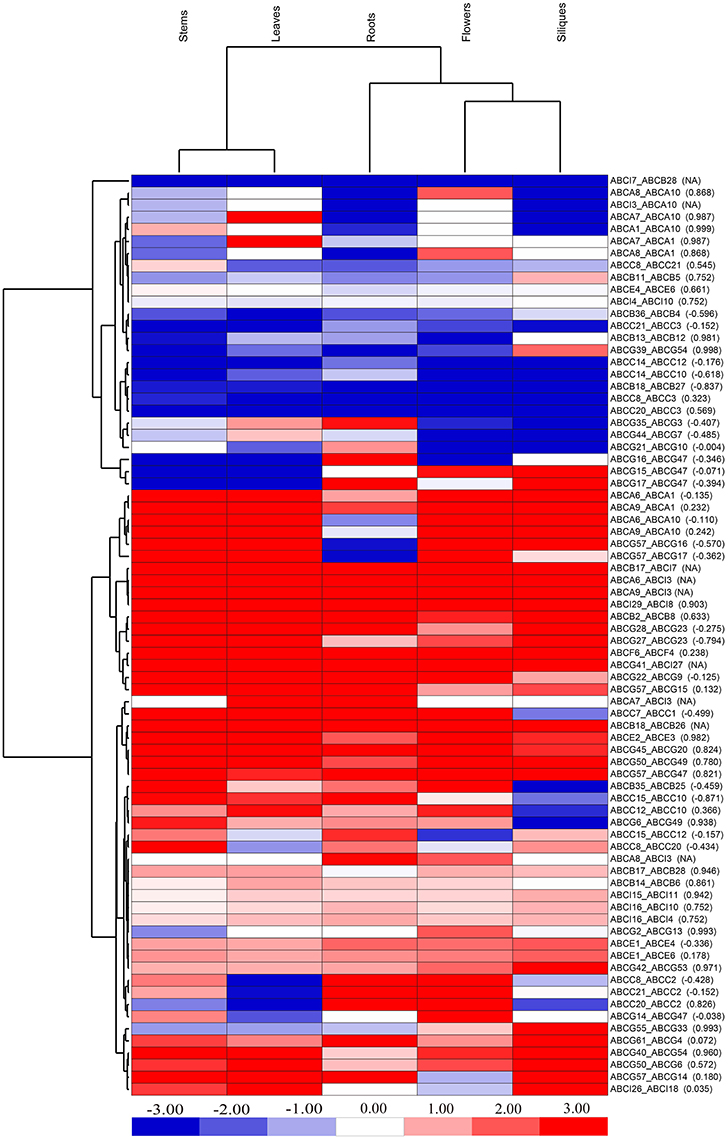
Figure 7. Expression profiles of syntenic BraABC paralog pairs in the five tissues of roots, stems, leaves, flowers, and siliques. The color bar on the bottom represents the log2-based ratio of FPKM values of the two genes in each paralog pair. The values in the bracket are Pearson correlation coefficients (PCCs) of paralog pairs measured by their expressions. NA stands for no available results for PCCs.
From the cluster of different tissues, the leaves clustered with the stems and the flowers clustered with the siliques in the heat map of BraABC paralog pairs indicated a similar expression profile (Figure 7). Taking an overall view of the cluster for BraABC paralog pairs, paralog pairs with similar evolutionary fates tended to further cluster together, confirming that the expression patterns of paralog pairs were related to their evolutionary fates after duplication. Approximately 42.1% (32 out of 76) of the paralog pairs presented no less than a two-fold expression difference (absolute value of log2 FPKM ratio ≥ 1) in all of the studied tissues. In brief, the expression correlation analysis of syntenic paralog pairs showed their functional roles in functional conservation, sub-functionalization, neo-functionalization and pseudogenization in the BraABC gene family.
We also investigated the expression patterns of syntenic BraABC paralog pairs under ABA, drought and salt stresses with qRT-PCR. Three pairs of conserved or sub-functional paralogs and three pairs of neo-functional paralogs were randomly selected to study their expression patterns. Primers for qRT-PCR are listed in Supplementary Table 4. As shown in Figure 8, a range of expression profiles of the selected BraABCs were observed after exposure to ABA, drought and salt stress. Some paralog pairs exhibited similar expression patterns, whereas others presented different expression profiles. The paralog pairs with positive expression correlations measured by PCCs across the five tissues also had positive correlations under the stress treatments (Figures 8A–C), which also indicated the functional conservation or sub-functionalization in these paralog pairs. Similarly, paralog pairs which exhibited negative correlations across the studied tissues also presented negative correlations under the stress treatments (Figures 8D–F), suggesting that these paralog pairs were neo-functional. On the whole, the expression correlations of the selected syntenic BraABC paralog pairs across the five tissues were consistent with those under the stress treatments.

Figure 8. Comparisons of the expression profiles of six pairs of syntenic BraABC paralogs across nine time points (in hours) after ABA, drought and salt stress treatments. (A–F) Are the expression profiles of the selected six pairs of syntenic paralogs under different stress treatments at different time points, respectively. Each column represents the mean of three independent experiments, each with three replicates. The RT and RS are the Pearson correlation coefficients (PCCs) of paralog pairs measured by their expressions across different tissues and under different stress treatments, respectively.
Interaction Network Analysis among BraABC Proteins
The interaction network of BraABC proteins, including the functional and physical interactions, were examined using STRING software and the corresponding database to retrieve the protein interactions. As shown in Figure 9, a dense interaction network formed among the BraABC proteins. Most of the BraABC proteins were involved in interaction relations with other proteins, except for BraABCA4, BraABCA9, BraABCG18, and several ABCI proteins. Interaction relations not only existed among proteins within the same subfamily but also among proteins from different subfamilies. Though interacting frequently with proteins in other subfamilies, some ABCB proteins did not interact with proteins of ABCB, shown as being surrounded by the yellow curve in Figure 9. The majority of proteins located in the center of the network were ABCG proteins, indicating that these proteins had more complex interaction relations with other BraABC proteins. The gene dosage hypothesis predicts that genes will be preferentially retained if their products are dose sensitive, interacting either with other proteins or in networks (Thomas et al., 2006; Birchler and Veitia, 2007). Consequently, ABCG genes were probably more preferentially retained compared with genes of other subfamilies during evolution. Indeed, ABCG had the largest number of genes among all of the BraABC subfamilies.
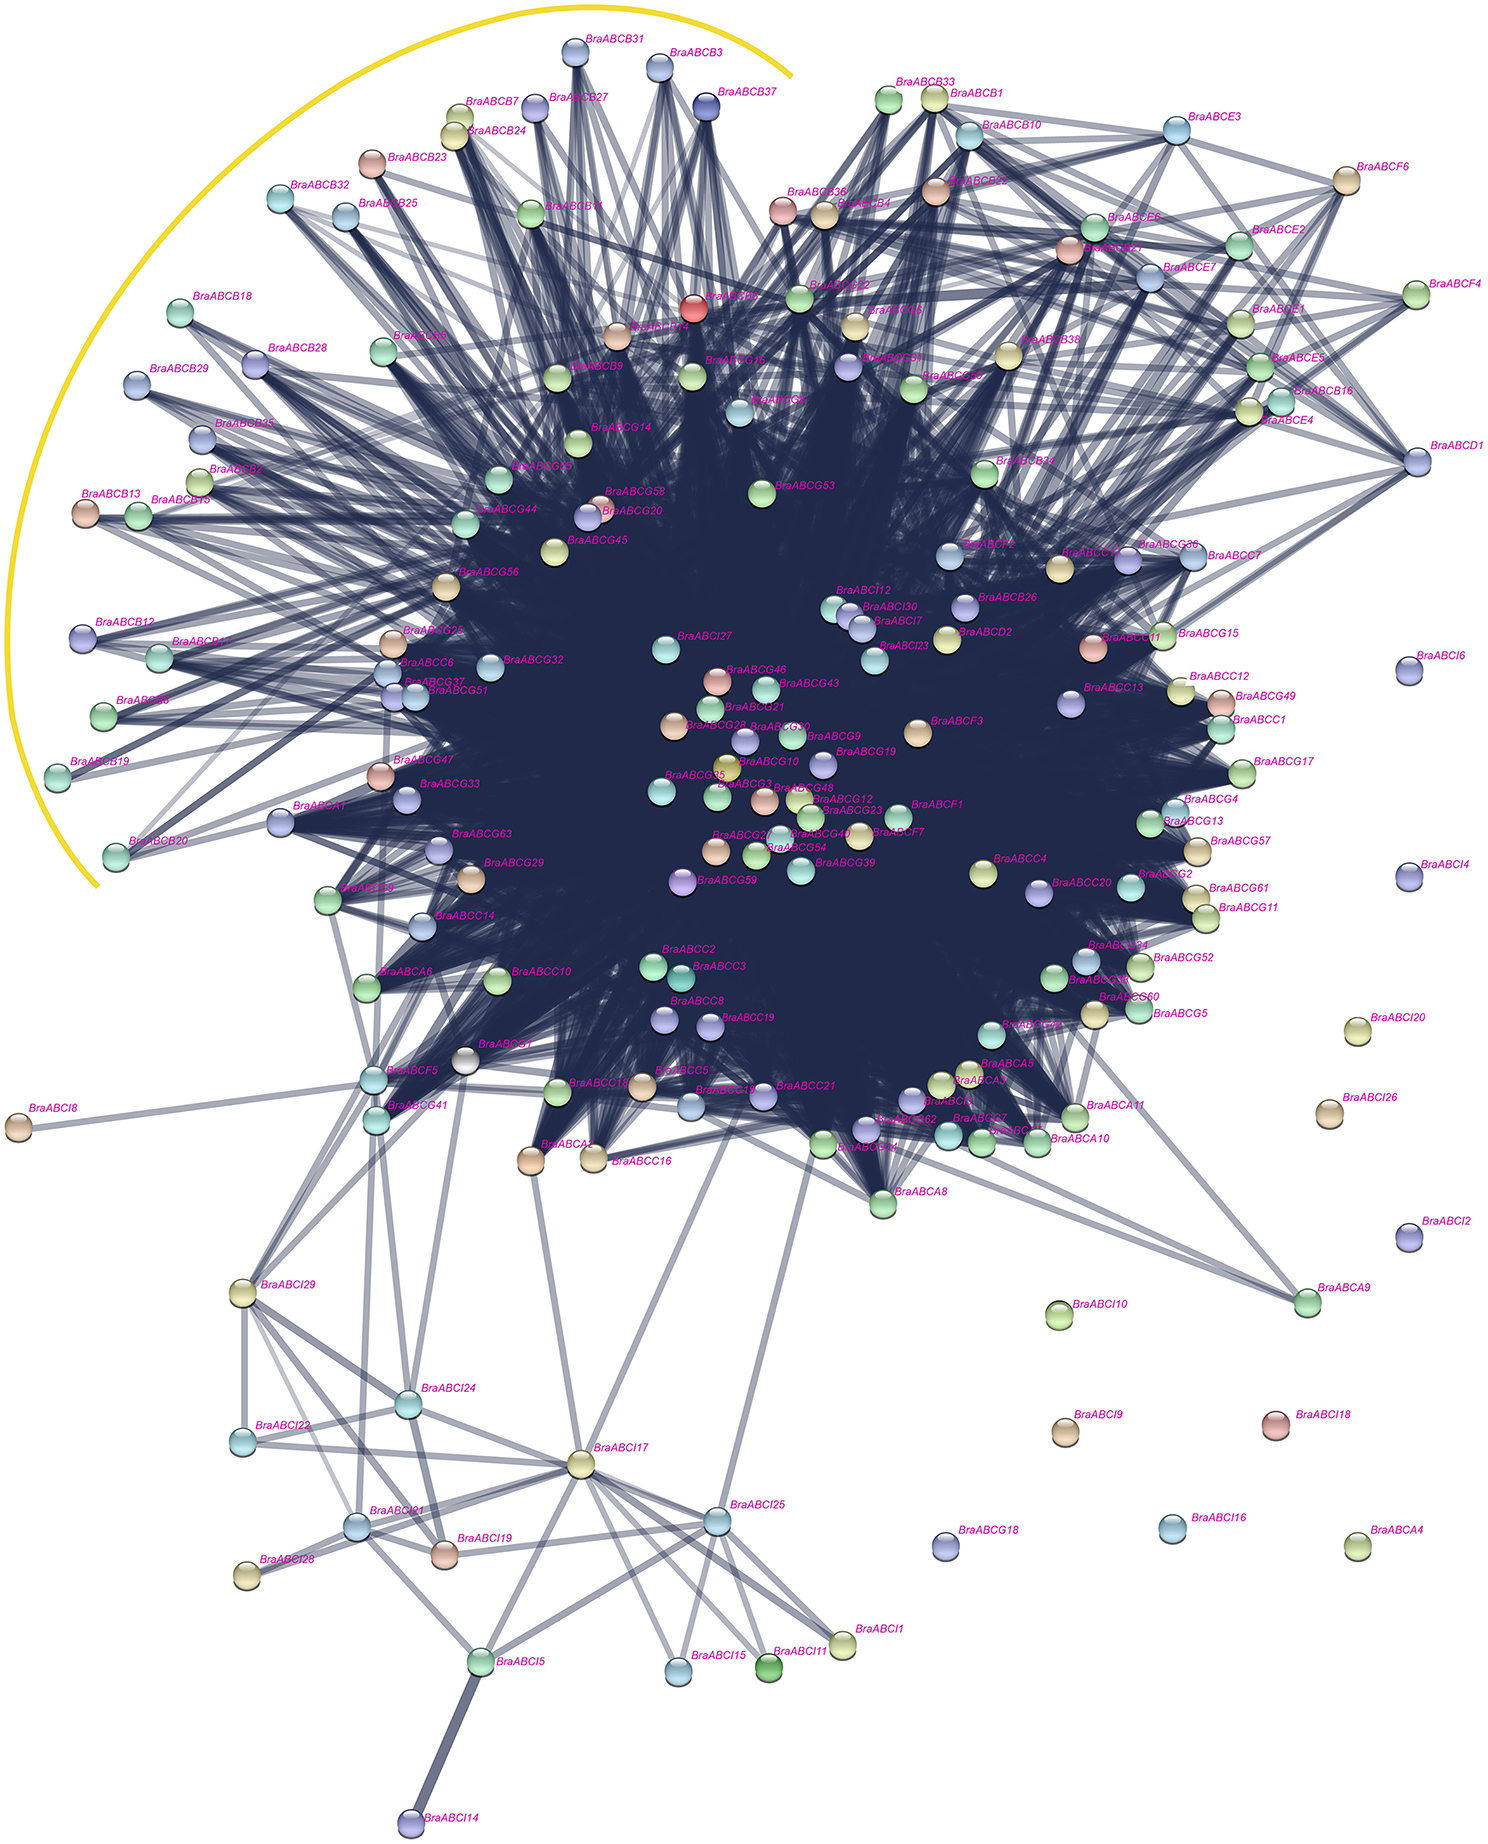
Figure 9. Interaction network of BraABC proteins constructed using STRING software.
Discussion
Due to their sessile nature, plants have evolved complex movement systems to establish steep concentration gradients of solutes across cellular membranes to adapt to the variable environment. The particularly large complement of ABC proteins play a major role (George and Jones, 2012). ABC proteins are involved in various biological processes and are ubiquitous in all living organisms. To date, most research into the functions of ABCs has focused on Arabidopsis and rice, whereas studies are limited in terms of other non-model plants like B. rapa (Kang et al., 2011). In our research, we conducted comprehensive studies of ABCs in B. rapa, including whole genome-wide identification, evolutionary relationships, chromosomal locations, structural investigation, conservation after WGT and expression patterns in different tissues and under different stress treatments.
In this study, we systematically identified 179 BraABCs, representing 0.43% of the annotated protein coding genes in B. rapa (Wang et al., 2011). Gene duplication events are important to the rapid expansion and evolution of gene families. Furthermore, segmental duplication and tandem duplication are known to be major duplication modes for gene family expansion (Cannon et al., 2004). Previous studies revealed that B. rapa not only shared three paleo-polyploidy events with Arabidopsis but also underwent a further WGT event since its divergence from Arabidopsis 13 to 17 MYA (Town et al., 2006). In our study, the average duplication time of syntenic BraABC paralog pairs was 15.13 MYA, which was close to the recent WGT date of B. rapa. A total of 87 BraABCs were contained in the 76 pairs of BraABC syntenic paralogs among three subgenomes stemming from WGT. Simultaneously, 28 BraABCs were found to be located as 11 tandem arrays on chromosomes (Figure 3). Taken together, syntenic paralog analysis and chromosomal distribution revealed that the expansion of the ABC gene family in B. rapa could be attributed to the recent WGT and tandem duplication. Similarly, the expansion of other gene families in plants, such as the PG of Populus, the bZIP of apple and the ST of pear are also associated with WGD/segmental and tandem duplications (Yang et al., 2013; Li et al., 2015; Zhao et al., 2016).
The phylogenetic tree demonstrated that BraABCs can be divided into eight subfamilies (ABCA-ABCG and ABCI) (Supplementary Figure 1). All subfamilies, except ABCI, were clustered together in the phylogenetic tree constructed from ABCs of B. rapa and Arabidopsis, whereas the ABCI genes containing the NBD domain were scattered in the phylogenetic tree. This topology is similar to that of the phylogenetic tree constructed from the ABCs of maize (Pang et al., 2013). The dispersed distribution in the phylogenetic tree and non-uniform domain organization of ABCI genes indicated that the functions of ABCI are more divergent than other subfamilies. The subfamily classification was further supported by the results of domain organization, exon-intron structure and motif composition.
The evolution complexity of angiosperm genomes has been characterized by polyploidization through WGD followed by diploidization. Studies of Arabidopsis and its close relative B. rapa can provide fundamental insights into the evolutionary patterns of plant genomes. After triploidization, there is considerable gene loss (fractionation) in B. rapa, and is consistent with the widespread gene loss after WGD events in other eukaryotes (Sankoff et al., 2010). In theory, the number of ABCs in the newly formed hexaploid B. rapa genome would be three-fold as in Arabidopsis, whereas only 179 BraABCs were identified, indicating that some BraABCs were lost following WGT. The gene balance hypothesis predicts that genes whose products participate in macromolecular complexes, signaling networks or transcription, are more likely to be retained, avoiding network imbalances associated with the loss of one member (Thomas et al., 2006; Birchler and Veitia, 2007). In B. rapa, the ABCs were biased and preferentially retained. The preferential retentions of BraABCs were consistent with the gene balance hypothesis and demonstrate that BraABCs play key roles in the adaptation of B. rapa. In the interaction network of BraABC proteins (Figure 9), the ABCG proteins were highly connected with other BraABC proteins. Simultaneously, ABCG had the largest number of genes among all subfamilies, suggesting that ABCG genes were probably more preferentially retained during evolution. In turn, the preferential retention of ABCG genes supports the reliability of the gene balance hypothesis.
Evidence has demonstrated that ABC genes are involved in plant growth, development and stress tolerance. AtABCB1, a member of AtABC, can participate in auxin transport, and AtABCB1 overexpressing plants develop longer hypocotyls (Sidler et al., 1998; Noh et al., 2001). AtABCG25 is involved in abscisic acid transport and response (Kuromori et al., 2010). OsABCC1, a rice transporter, is involved in detoxification and reduce arsenic in rice grains (Song et al., 2014). Overexpression of AtABCG36 improves drought and salt stress resistance in Arabidopsis (Kim et al., 2010). Gene expression patterns provide important clues for gene functions. Thus, we conducted expression analysis for all BraABCs in the roots, stems, leaves, flowers and siliques tissues using public RNA-seq data (Tong et al., 2013). Most of the BraABCs (92.2%) were expressed in at least one of the five tissues. Some BraABCs exhibited tissue-specific expression patterns (Figure 6B), indicating that they might play specific roles in the relevant tissues. Cis-elements in the promoters of genes can be bound by transcription factors and involved in gene expression regulation. To further understand the possible transcriptional regulation mechanisms of BraABCs, we scanned the common cis-regulatory elements, which were conserved in the promoter regions of all of the studied BraABCs. Among the identified 13 common cis-elements, WRKY71OS was responsive to ABA. However, in our qRT-PCR experiments, the expression profiles of some BraABCs and the presence of WRKY71OS in their promoters were not in good agreement under ABA treatment. Some BraABCs was down-regulated under ABA treatment or nearly unresponsive to ABA at some time points, such as BrABCB13, BrABCB12, BrABCB11, BrABCB5, and BrABCG45 (Figure 8). This suggests that the induction of these BraABCs might result from the functions of a complex array of cis-elements, and some unidentified cis-elements might play a vital role in regulating the expression of these BraABCs under ABA treatment. Furthermore, this indicates that BraABCs have both shared, as well as distinct regulatory modules in response to ABA treatment. Moreover, of the identified common cis-elements, DOFCOREZM and GATABOX were related to carbon metabolism and molecular light switching, respectively, indicating that BraABCs probably participated in energy metabolism. Combining gene expression results with common cis-elements of BraABCs, we further confirmed the important roles of BraABCs during growth, development and stress response.
Altogether, 76 pairs of BraABC syntenic paralogs were identified among the three subgenomes. The average duplication time of the 76 pairs of paralogs was 15.13 MYA, which was consistent with the generated time of the three subgenomes (Wang et al., 2011). According to the ratio of non-synonymous to synonymous substitutions ω (= Ka/Ks), the selection type acting on the coding sequences can be measured. Ka/Ks ratios of 22 paralogs pairs were < 0.1, indicating that these paralog pairs were under strong purifying selection pressures. Furthermore, their functions were potentially more constrained with limited functional divergence occurring after duplication. It is worth noting that the ω ratios of 10 pairs of paralogs were > 1, representing positive selection and fast evolutionary rates in these BraABC paralogs at the protein level. This is different from other gene families in plants, such as PG of Populus, BURP of Medicago and ACD of tomato, which contain a few or even no paralog pairs undergoing positive selection (Yang et al., 2013; Li et al., 2016; Paul et al., 2016), and a relatively large percentage of BraABC paralogs pairs underwent positive selection in our study. We deduced genes of these paralog pairs might evolve some new functions to adjust to their living environment.
Four possible fates have been suggested for the evolution of gene duplication: functional conservation, sub-functionalization, neo-functionalization and pseudogenization (Lynch and Conery, 2000). Expression correlation analysis of syntenic BraABC paralog pairs across different tissues and under stress treatments could help reveal their functional roles in evolutionary fates. Our results indicate that all four fates turned up among the 76 pairs of paralogs. The high positive correlations of the 27 paralog pairs suggest the conservation of ancestral gene functions or sub-functionalization through the division of labor by retaining different parts of their ancestral functions. In contrast, 40 pairs of paralogs had small positive PCCs or negative PCCs, indicating that neo-functionalization and added functional diversity were likely to occur for the BraABC gene family. In particular, among the 9 pairs of paralogs undergoing pseudogenization, 8 pairs were composed of genes from two different subfamilies. Furthermore, ABCI genes were contained in each of these 8 pairs of paralogs. Interestingly, all of these ABCI genes had probably already become pseudogenes. Genes of ABCA-ABCG included multi-domains, whereas the ABCI genes generally contained only one domain, mainly NBD or TMD. We speculated that the ABCI genes in these eight paralog pairs were generated from the domain loss of genes in ABCA-ABCG. In short, the functions of genes in the BraABC gene family were enhanced and expanded through gene duplications. However, further functional analyses of BraABCs are still needed to determine which evolutionary fate the syntenic paralogs pairs undergo during the process of sequence and functional evolution.
In conclusion, we performed the first genome-wide analysis of the ABC gene family in B. rapa, and a total of 179 BraABCs were identified. Phylogenetic relationships, gene structures and cis-regulatory elements of BraABCs were studied in detail. Expression patterns of BraABCs were also characterized in different tissues and under different stresses. Furthermore, the conservation of BraABCs and the evolutionary fates of syntenic BraABC paralog pairs following WGT were studied. Our results could help to further investigate the biological functions of BraABCs in plant growth, development, and stress response.
Author Contributions
CY, WD, and XH conceived and designed the experiments. CY and SL performed the experiments. CY, WD, YL, and XH analyzed data. CY and XH wrote the manuscript. All authors read and approved the manuscript.
Conflict of Interest Statement
The authors declare that the research was conducted in the absence of any commercial or financial relationships that could be construed as a potential conflict of interest.
Acknowledgments
This work was supported by Science and Technology Pillar Program of Jiangsu Province (BE2013429), the Agricultural science and technology independent innovation funds of Jiangsu Province [CX(13)2006] and Science and Technology Pillar Program of Jiangsu Province (BE2012325).
Supplementary Material
The Supplementary Material for this article can be found online at: http://journal.frontiersin.org/article/10.3389/fpls.2017.00349/full#supplementary-material
Abbreviations
ABC, ATP-binding cassette; ABCA, ABC subfamily A; ABCB, ABC subfamily B; ABCC, ABC subfamily C; ABCD, ABC subfamily D; ABCE, ABC subfamily E; ABCF, ABC subfamily F; ABCG, ABC subfamily G; ABCH, ABC subfamily H; ABCI, ABC subfamily I; ABCs, ABC genes; AtABC, Arabidopsis ABC; AtABCs, Arabidopsis ABC genes; BraABC, Brassica rapa ABC; BraABCs, Brassica rapa ABC genes; ML, maximum-likelihood; MYA, million years ago; NBD, nucleotide-binding domain; PCCs, Pearson correlation coefficients; PEG, polyethylene glycol; qRT-PCR, quantitative real-time PCR; TMD, transmembrane domains; WGD, whole genome duplication; WGT, whole genome triplication.
References
Annilo, T., Chen, Z.-Q., Shulenin, S., Costantino, J., Thomas, L., Lou, H., et al. (2006). Evolution of the vertebrate ABC gene family: analysis of gene birth and death. Genomics 88, 1–11. doi: 10.1016/j.ygeno.2006.03.001
Bailey, C. D., Koch, M. A., Mayer, M., Mummenhoff, K., O'Kane, S. L., Warwick, S. I., et al. (2006). Toward a global phylogeny of the Brassicaceae. Mol. Biol. Evol. 23, 2142–2160. doi: 10.1093/molbev/msl087
Bailey, T. L., Boden, M., Buske, F. A., Frith, M., Grant, C. E., Clementi, L., et al. (2009). MEME SUITE: tools for motif discovery and searching. Nucleic Acids Res. 37, W202–W208. doi: 10.1093/nar/gkp335
Birchler, J. A., and Veitia, R. A. (2007). The gene balance hypothesis: from classical genetics to modern genomics. Plant Cell 19, 395–402. doi: 10.1105/tpc.106.049338
Blanc, G., and Wolfe, K. H. (2004). Functional divergence of duplicated genes formed by polyploidy during Arabidopsis evolution. Plant Cell 16, 1679–1691. doi: 10.1105/tpc.021410
Bowers, J. E., Chapman, B. A., Rong, J., and Paterson, A. H. (2003). Unravelling angiosperm genome evolution by phylogenetic analysis of chromosomal duplication events. Nature 422, 433–438. doi: 10.1038/nature01521
Cannon, S. B., Mitra, A., Baumgarten, A., Young, N. D., and May, G. (2004). The roles of segmental and tandem gene duplication in the evolution of large gene families in Arabidopsis thaliana. BMC Plant Biol. 4:10. doi: 10.1186/1471-2229-4-10
Cheng, F., Liu, S., Wu, J., Fang, L., Sun, S., Liu, B., et al. (2011). BRAD, the genetics and genomics database for Brassica plants. BMC Plant Biol. 11:136. doi: 10.1186/1471-2229-11-136
Cheng, F., Wu, J., Fang, L., and Wang, X. (2012). Syntenic gene analysis between Brassica rapa and other Brassicaceae species. Front. Plant Sci. 3:198. doi: 10.3389/fpls.2012.00198
Dassa, E., and Bouige, P. (2001). The ABC of ABCs: a phylogenetic and functional classification of ABC systems in living organisms. Res. Microbiol. 152, 211–229. doi: 10.1016/S0923-2508(01)01194-9
Dean, M., Hamon, Y., and Chimini, G. (2001). The human ATP-binding cassette (ABC) transporter superfamily. J. Lipid Res. 42, 1007–1017. doi: 10.1101/gr.gr-1649r
Dermauw, W., and Van Leeuwen, T. (2014). The ABC gene family in arthropods: comparative genomics and role in insecticide transport and resistance. Insect Biochem. Mol. Biol. 45, 89–110. doi: 10.1016/j.ibmb.2013.11.001
Eddy, S. R. (1998). Profile hidden Markov models. Bioinformatics 14, 755–763. doi: 10.1093/bioinformatics/14.9.755
Finn, R. D., Bateman, A., Clements, J., Coggill, P., Eberhardt, R. Y., Eddy, S. R., et al. (2013). Pfam: the protein families database. Nucleic Acids Res. 42, D222–D230. doi: 10.1093/nar/gkt1223
George, A. M., and Jones, P. M. (2012). Perspectives on the structure–function of ABC transporters: the switch and constant contact models. Prog. Biophys. Mol. Biol. 109, 95–107. doi: 10.1016/j.pbiomolbio.2012.06.003
Heid, C. A., Stevens, J., Livak, K. J., and Williams, P. M. (1996). Real time quantitative PCR. Genome Res. 6, 986–994. doi: 10.1101/gr.6.10.986
Higgins, C. F. (1992). ABC transporters: from microorganisms to man. Ann. Rev. Cell Biol. 8, 67–113. doi: 10.1146/annurev.cb.08.110192.000435
Higgins, C. F., and Linton, K. J. (2004). The ATP switch model for ABC transporters. Nat. Struct. Mol. Biol. 11, 918–926. doi: 10.1038/nsmb836
Hu, B., Jin, J., Guo, A. Y., Zhang, H., Luo, J., and Gao, G. (2015). GSDS 2.0: an upgraded gene feature visualization server. Bioinformatics 31, 1296–1297. doi: 10.1093/bioinformatics/btu817
Kang, J., Park, J., Choi, H., Burla, B., Kretzschmar, T., Lee, Y., et al. (2011). Plant ABC transporters. Arabidopsis Book 9:e0153. doi: 10.1199/tab.0153
Kim, D. Y., Jin, J. Y., Alejandro, S., Martinoia, E., and Lee, Y. (2010). Overexpression of AtABCG36 improves drought and salt stress resistance in Arabidopsis. Physiol. Plant 139, 170–180. doi: 10.1111/j.1399-3054.2010.01353.x
Koch, M. A., Haubold, B., and Mitchell-Olds, T. (2000). Comparative evolutionary analysis of chalcone synthase and alcohol dehydrogenase loci in Arabidopsis, Arabis, and Related Genera (Brassicaceae). Mol. Biol. Evol. 17, 1483–1498. doi: 10.1093/oxfordjournals.molbev.a026248
Krzywinski, M., Schein, J., Birol, I., Connors, J., Gascoyne, R., Horsman, D., et al. (2009). Circos: an information aesthetic for comparative genomics. Genome Res. 19, 1639–1645. doi: 10.1101/gr.092759.109
Kuromori, T., Miyaji, T., Yabuuchi, H., Shimizu, H., Sugimoto, E., Kamiya, A., et al. (2010). ABC transporter AtABCG25 is involved in abscisic acid transport and responses. Proc. Natl. Acad. Sci. U.S.A. 107, 2361–2366. doi: 10.1073/pnas.0912516107
Letunic, I., Doerks, T., and Bork, P. (2012). SMART 7: recent updates to the protein domain annotation resource. Nucleic Acids Res. 40, D302–D305. doi: 10.1093/nar/gkr931
Li, Q., Zhang, N., Zhang, L., and Ma, H. (2015). Differential evolution of members of the rhomboid gene family with conservative and divergent patterns. New Phytol. 206, 368–380. doi: 10.1111/nph.13174
Li, Y., Chen, X., Chen, Z., Cai, R., Zhang, H., and Xiang, Y. (2016). Identification and expression analysis of BURP domain-containing genes in Medicago truncatula. Front. Plant Sci. 7:485. doi: 10.3389/fpls.2016.00485
Lynch, M., and Conery, J. S. (2000). The evolutionary fate and consequences of duplicate genes. Science 290, 1151–1155. doi: 10.1126/science.290.5494.1151
Lynch, M., and Conery, J. S. (2003). The evolutionary demography of duplicate genes. J. Struct. Funct. Genomics 3, 35–44. doi: 10.1023/A:1022696612931
Maere, S., De Bodt, S., Raes, J., Casneuf, T., Van Montagu, M., Kuiper, M., et al. (2005). Modeling gene and genome duplications in eukaryotes. Proc. Natl. Acad. Sci. U.S.A. 102, 5454–5459. doi: 10.1073/pnas.0501102102
Martinoia, E., Grill, E., Tommasini, R., Kreuz, K., and Amrhein, N. (1993). ATP-dependent glutathione S-conjugate'export'pump in the vacuolar membrane of plants. Nature 364, 247–249. doi: 10.1038/364247a0
Noh, B., Murphy, A. S., and Spalding, E. P. (2001). Multidrug resistance–like genes of arabidopsis required for auxin transport and auxin-mediated development. Plant Cell 13, 2441–2454. doi: 10.1105/tpc.13.11.2441
Pang, K., Li, Y., Liu, M., Meng, Z., and Yu, Y. (2013). Inventory and general analysis of the ATP-binding cassette (ABC) gene superfamily in maize (Zea mays L.). Gene 526, 411–428. doi: 10.1016/j.gene.2013.05.051
Paul, A., Rao, S., and Mathur, S. (2016). The α-crystallin domain containing genes: identification, phylogeny and expression profiling in abiotic stress, phytohormone response and development in tomato (Solanum lycopersicum). Front. Plant Sci. 7:426. doi: 10.3389/fpls.2016.00426
Sánchez-Fernández, R. O., Davies, T. E., Coleman, J. O., and Rea, P. A. (2001). The Arabidopsis thaliana ABC protein superfamily, a complete inventory. J. Biol. Chem. 276, 30231–30244. doi: 10.1074/jbc.M103104200
Sankoff, D., Zheng, C., and Zhu, Q. (2010). The collapse of gene complement following whole genome duplication. BMC Genomics 11:313. doi: 10.1186/1471-2164-11-313
Sarkadi, B., Homolya, L., Szakács, G., and Váradi, A. (2006). Human multidrug resistance ABCB and ABCG transporters: participation in a chemoimmunity defense system. Physiol. Rev. 86, 1179–1236. doi: 10.1152/physrev.00037.2005
Schmutz, J., Cannon, S. B., Schlueter, J., Ma, J., Mitros, T., Nelson, W., et al. (2010). Genome sequence of the palaeopolyploid soybean. Nature 463, 178–183. doi: 10.1038/nature08670
Schnable, P. S., Ware, D., Fulton, R. S., Stein, J. C., Wei, F., Pasternak, S., et al. (2009). The B73 maize genome: complexity, diversity, and dynamics. Science 326, 1112–1115. doi: 10.1126/science.1178534
Sidler, M., Hassa, P., Hasan, S., Ringli, C., and Dudler, R. (1998). Involvement of an ABC transporter in a developmental pathway regulating hypocotyl cell elongation in the light. Plant Cell 10, 1623–1636. doi: 10.1105/tpc.10.10.1623
Song, W. Y., Yamaki, T., Yamaji, N., Ko, D., Jung, K. H., Fujii-Kashino, M., et al. (2014). A rice ABC transporter, OsABCC1, reduces arsenic accumulation in the grain. Proc. Natl. Acad. Sci. U.S.A. 111, 15699–15704. doi: 10.1073/pnas.1414968111
Tamura, K., Stecher, G., Peterson, D., Filipski, A., and Kumar, S. (2013). MEGA6: molecular evolutionary genetics analysis version 6.0. Mol. Biol. Evol. 30, 2725–2729. doi: 10.1093/molbev/mst197
Thomas, B. C., Pedersen, B., and Freeling, M. (2006). Following tetraploidy in an Arabidopsis ancestor, genes were removed preferentially from one homeolog leaving clusters enriched in dose-sensitive genes. Genome Res. 16, 934–946. doi: 10.1101/gr.4708406
Thompson, J. D., Gibson, T. J., Plewniak, F., Jeanmougin, F., and Higgins, D. G. (1997). The CLUSTAL_X windows interface: flexible strategies for multiple sequence alignment aided by quality analysis tools. Nucleic Acids Res. 25, 4876–4882. doi: 10.1093/nar/25.24.4876
Tong, C., Wang, X., Yu, J., Wu, J., Li, W., Huang, J., et al. (2013). Comprehensive analysis of RNA-seq data reveals the complexity of the transcriptome in Brassica rapa. BMC Genomics 14:689. doi: 10.1186/1471-2164-14-689
Town, C. D., Cheung, F., Maiti, R., Crabtree, J., Haas, B. J., Wortman, J. R., et al. (2006). Comparative genomics of Brassica oleracea and Arabidopsis thaliana reveal gene loss, fragmentation, and dispersal after polyploidy. Plant Cell 18, 1348–1359. doi: 10.1105/tpc.106.041665
Verrier, P. J., Bird, D., Burla, B., Dassa, E., Forestier, C., Geisler, M., et al. (2008). Plant ABC proteins–a unified nomenclature and updated inventory. Trends Plant Sci. 13, 151–159. doi: 10.1016/j.tplants.2008.02.001
Wang, D., Zhang, Y., Zhang, Z., Zhu, J., and Yu, J. (2010). KaKs_Calculator 2.0: a toolkit incorporating gamma-series methods and sliding window strategies. Genomics Proteomics Bioinformatics 8, 77–80. doi: 10.1016/S1672-0229(10)60008-3
Wang, X., Wang, H., Wang, J., Sun, R., Wu, J., Liu, S., et al. (2011). The genome of the mesopolyploid crop species Brassica rapa. Nat. Genet. 43, 1035–1039. doi: 10.1038/ng.919
Yang, Z. L., Liu, H. J., Wang, X. R., and Zeng, Q. Y. (2013). Molecular evolution and expression divergence of the Populus polygalacturonase supergene family shed light on the evolution of increasingly complex organs in plants. New Phytol. 197, 1353–1365. doi: 10.1111/nph.12107
Keywords: Brassica rapa, ATP-binding cassette transporter, phylogenetic analysis, whole genome triplication, gene expression, evolutionary fate
Citation: Yan C, Duan W, Lyu S, Li Y and Hou X (2017) Genome-Wide Identification, Evolution, and Expression Analysis of the ATP-Binding Cassette Transporter Gene Family in Brassica rapa. Front. Plant Sci. 8:349. doi: 10.3389/fpls.2017.00349
Received: 26 August 2016; Accepted: 28 February 2017;
Published: 17 March 2017.
Edited by:
Jun Yu, Beijing Institute of Genomics, ChinaReviewed by:
Yong Xu, National Engineering Research Center for Vegetables, ChinaYongqing Li, South China Botanical Garden, Chinese Academy of Sciences, China
Copyright © 2017 Yan, Duan, Lyu, Li and Hou. This is an open-access article distributed under the terms of the Creative Commons Attribution License (CC BY). The use, distribution or reproduction in other forums is permitted, provided the original author(s) or licensor are credited and that the original publication in this journal is cited, in accordance with accepted academic practice. No use, distribution or reproduction is permitted which does not comply with these terms.
*Correspondence: Xilin Hou, aHhsQG5qYXUuZWR1LmNu
†These authors have contributed equally to this work.