 Hao-Chun Hsu
 Chun-Neng Wang
 Chia-Hao Liang
 Cheng-Chun Wang
 Yan-Fu Kuo
- 1Department of Bio-Industrial Mechatronics Engineering, National Taiwan University, Taipei, Taiwan
- 2Institute of Ecology and Evolutionary Biology, National Taiwan University, Taipei, Taiwan
- 3Department of Life Science, National Taiwan University, Taipei, Taiwan
This study used three-dimensional (3D) micro-computed tomography (μCT) imaging to examine petal form variation in a hybrid cross of Sinningia speciosa between a cultivar with actinomorphic flowers and a variety with zygomorphic flowers. The major objectives were to determine the genotype–phenotype associations between the petal form variation and CYCLOIDEA2-like alleles in S. speciosa (SsCYC) and to morphologically investigate the differences in petal types between actinomorphic and zygomorphic flowers. In this study, μCT was used to accurately acquire 3D floral images. Landmark-based geometric morphometrics (GM) was applied to evaluate the major form variations of the petals. Nine morphological traits of the petals were defined according to the form variations quantified through the GM analysis. The results indicated that the outward curvature of dorsal petals, the midrib asymmetry of lateral petals, and the dilation of ventral region of the tube were closely associated with the SsCYC genotype. Multiple analyses of form similarity between the petals suggested that the dorsal and ventral petals of actinomorphic plants resembled the ventral petals of zygomorphic plants. This observation indicated that the transition from zygomorphic to actinomorphic flowers in S. speciosa might be caused by the ventralization of the dorsal petals. We demonstrated that the 3D-GM approach can be used to determine genotype–phenotype associations and to provide morphological evidence for the transition of petal types between actinomorphic and zygomorphic flowers in S. speciosa.
Introduction
Sinningia speciosa (Lodd.) Hiern is a species of ornamental plants with high diversity in floral form. The peloric form of the species, also known as peloric Gloxinia, has a floral form distinct from that of the wild progenitor variety (Citerne and Cronk, 1999; Zaitlin, 2012). Typically, the wild variety displays flowers with two internally asymmetric dorsal and lateral petals. The ventral petal is internally bilaterally symmetric; thus, the flower presents zygomorphic corollas. By contrast, the peloric Gloxinia displays flowers with all internally bilaterally symmetric petals. The transition between floral zygomorphy and actinomorphy is considered to result from the single gene effect of a homolog of the CYCLOIDEA2-like gene (SsCYC; Citerne et al., 2000; Hsu et al., 2015). Petal form is an important aspect in ornamental plant breeding. In this study, a wild variety and a peloric Gloxinia were crossed to breed a second-generation (F2) population. Three-dimensional (3D) micro-computed tomography (μCT) imaging and geometric morphometrics (GM; Lawing and Polly, 2010; Zelditch et al., 2012) techniques were applied to the F2 hybrid population to quantify the petal form variation. The associations between the petal form variation and the SsCYC allele were also evaluated.
The associations between the petal form variation and gene alleles have been investigated previously. Brock et al. (2012) used the natural populations of the model plant Arabidopsis thaliana to examine the association between petal form and genotypic variations. In addition, some studies in non-model plants, such as Rhytidophyllum (Alexandre et al., 2015), Mimulus (Fishman et al., 2015), and Penstemon (Wessinger et al., 2014), the quantitative trait loci (QTL) analysis was performed to determine the gene alleles that affect petal forms. In addition to the petal form variation in nature, the changes in petal form during floricultural domestication exhibited a strong link with a single gene (Chapman et al., 2012). In these studies, the petal form variation was evaluated through conventional morphometrics or were quantified using 2D images. Flowers, however, are 3D objects with complex geometries. The application of authentic 3D imaging to flowers is required to capture the form information implicit in the petals.
Modern imaging techniques have made the acquisition of 3D images of floral forms feasible and affordable. With the development and improvement of 3D imaging, X-ray μCT has been applied to plant materials in the last two decades (Stuppy et al., 2003; Fiorani and Schurr, 2013; Karahara et al., 2015). Recent studies combining 3D imaging with GM have analyzed form using the Cartesian coordinates of landmarks; this analysis method represents a powerful strategy to comprehensively capture the structural information of flowers and to precisely quantify floral form variations (van der Niet et al., 2010). Our previous work (Wang et al., 2015) proposed a procedure to capture floral images in 3D using μCT and to implement GM to quantify the floral shape variations. In the present study, we applied the 3D-GM approach to further examine floral form variations at the petal level for determining genotype–phenotype association and for testing the petal form similarity.
The petal form similarity between petal types in floral symmetry transition is an intriguing topic. Although floral symmetry changes across species or varieties, the transformation of petal type can be categorized into dorsalization and ventralization (Cronk, 2006). Dorsalization, in which the ventral petals resemble the dorsal petals, is observed in Mohavea (Hileman et al., 2003) and Cadia (Citerne et al., 2006). By contrast, ventralization, in which the dorsal petals resemble the ventral petals, is observed in Primulina (Yang et al., 2012) and Lotus (Feng et al., 2006). However, these studies determined the transformation of petal type by using naked eye examination and the coincidence with the expression patterns of CYCLOIDEA2-like genes. It is worth to note that the loss-of-function mutation of only one CYCLOIDEA2-like gene in S. speciosa might closely associate with floral symmetry transition (Citerne et al., 2000; Hsu et al., 2015). Taking advantage of the floral symmetry in peloric Gloxinia and the wild varieties, we aimed to observe and determine the transformation of petal type for S. speciosa geometrically by using the 3D-GM approach.
In this study, we aim to determine the association between 3D petal form variation and SsCYC genotypes, and to test the petal form similarity in a hybrid line with actinomorphic and zygomorphic flowers in S. speciosa. The specific objectives were to (1) define and quantify petal traits in the F2 population, (2) evaluate the association between the SsCYC genotype and petal traits, and (3) geometrically determine whether dorsalization or ventralization occurred in the F2 flowers.
Materials and Methods
Plant Materials and SsCYC Genotyping
The S. speciosa ‘Carangola’ with zygomorphic flowers and the S. speciosa ‘Peridots Darth Vaders’ with actinomorphic flowers were obtained from the Dr. Cecilia Koo Botanic Conservation and Environmental Protection Center (Pingtung, Taiwan). The ‘Peridots Darth Vaders’ was crossed by ‘Carangola’ to breed the first-generation (F1) plants in June, 2007. A single F1 plant was then selfed to cultivate the F2 populations in May, 2008. A total of 320 F2 plants were established. In the F2 population, one plant had four-lobe flowers, two plants had six- or seven-lobe flowers. The rest F2 plants had five-lobe flowers. The flowers of F2 plants that are not five-lobe were excluded because they were incomparable in form (Adams et al., 2004). In this study, 72 F2 plants were randomly selected for the experiment. The plants were grown in greenhouses under 22–28°C with 70–80% humidity and natural lighting with 20% shade.
The SsCYC nucleotide sequences of the two parental accessions and the F2 individuals were identified. See Hsu et al. (2015) for the details of the SsCYC genotyping. The SsCYC alleles of the zygomorphic and actinomorphic parents were denoted as C and c, respectively. The SsCYC genotypes of the hybrid line were then identified and denoted as C/C, C/c, and c/c for the homozygous zygomorphic alleles, heterozygous zygomorphic and actinomorphic alleles, and homozygous actinomorphic alleles, respectively. Among the 72 F2 plants, the ratio of SsCYC genotypic combinations (16, 43, and 13 individuals of genotypes C/C, C/c, and c/c, respectively) were tested under the null hypothesis with C/C:C/c:c/c = 1:2:1 at a significance level of 0.05.
Image Acquisition and Landmark Selection
The flower images of the 72 plants were acquired during August 2012 and September 2015. See Wang et al. (2015) for details of the scanning process and image processing procedure. The strategy of landmark selection in the present study was different from the strategy in Wang et al. (2015). We added landmarks in petal boundary to describe the flower tube form more comprehensively (Figure 1). The landmark selection procedure was described as the follows. The primary landmarks were defined as the intersections of adjacent lobe contours, endpoints of the petal midrib, endpoints of the petal boundary, and joints of the tube and lobe on the midrib (black dots in Figure 1). The secondary landmarks were equally distributed between two primary landmarks (hollow dots in Figure 1). In the selection process, the petal features (e.g., lobe contours, petal midribs, and petal boundaries) and the primary landmarks were identified using an open source software program (Landmark; Wiley et al., 2005). The secondary landmarks were then determined using a program developed in MATLAB (The MathWorks, Natick, MA, USA). See Wang et al. (2015) for the details of the landmark selection. A total of 32 landmarks, comprising 7 primary and 25 secondary landmarks, were collected for each petal.
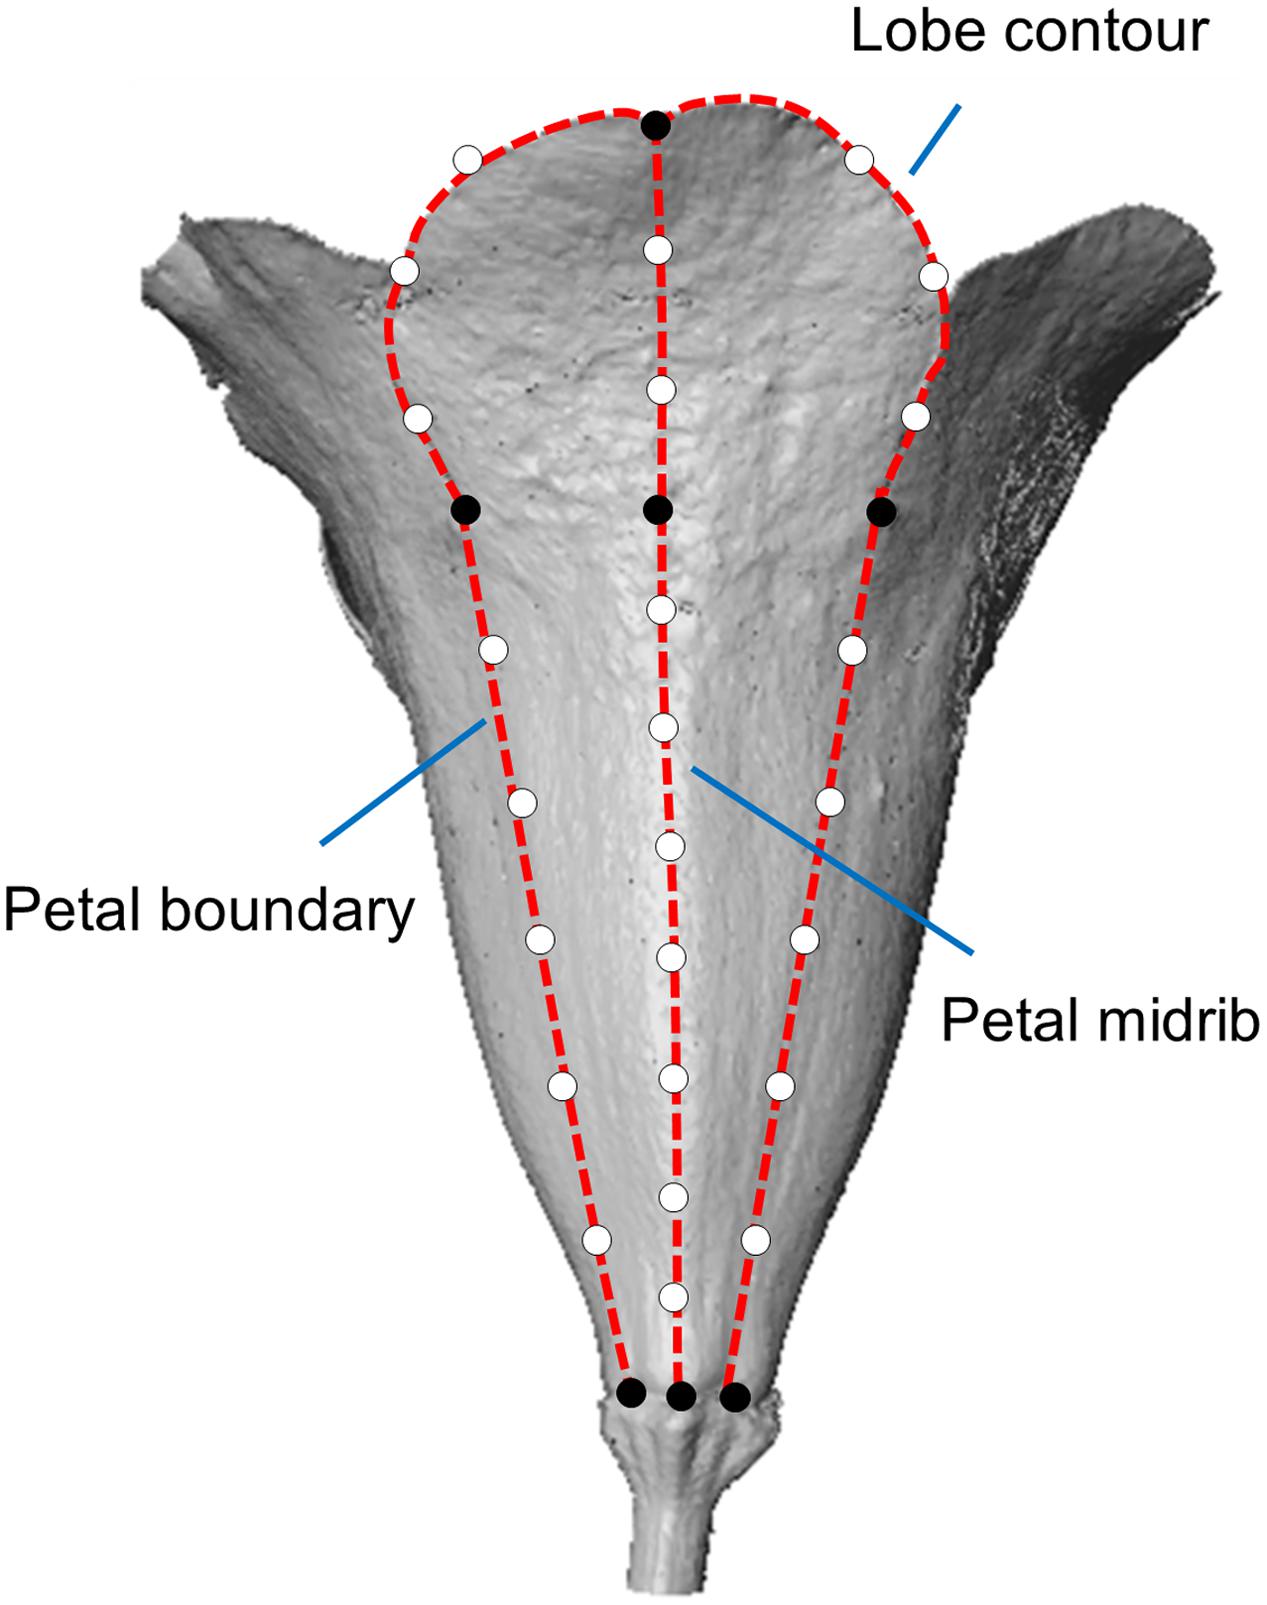
FIGURE 1. The landmarks in a petal. The black and hollow dots represent the primary and secondary landmarks, respectively. The dashed lines represent the lobe contour, petal boundaries, and petal midrib.
Identification and Visualization of the Major Form Variations of the Petals
Geometric morphometrics was applied to the landmarks of the dorsal, lateral, and ventral petals to evaluate the between-flower form variations of the petals. See Wang et al. (2015) for details of the GM analysis. Thereafter, the major form variations of the petals were visualized. See Wang et al. (2015) for the details of the visualization.
Morphological Traits of the Petals
The morphological traits of the dorsal, lateral, and ventral petals were defined and quantified according to the principal form variations discovered using the GM analysis. The selection of these morphological traits were referenced from the description of floral morphologies in previous studies (Endress, 2001; Waites and Hudson, 2001; Nii and Kawabata, 2011; Mitteroecker et al., 2013; Hsu et al., 2015; Ding et al., 2016). The traits included petal outward curvature, petal width, left–right asymmetry, midrib asymmetry, petal size, lobe size, and tube dilation (Figure 2). The traits corresponding to these variations were then geometrically defined and directly quantified in the 3D flower images by using image-processing algorithms.
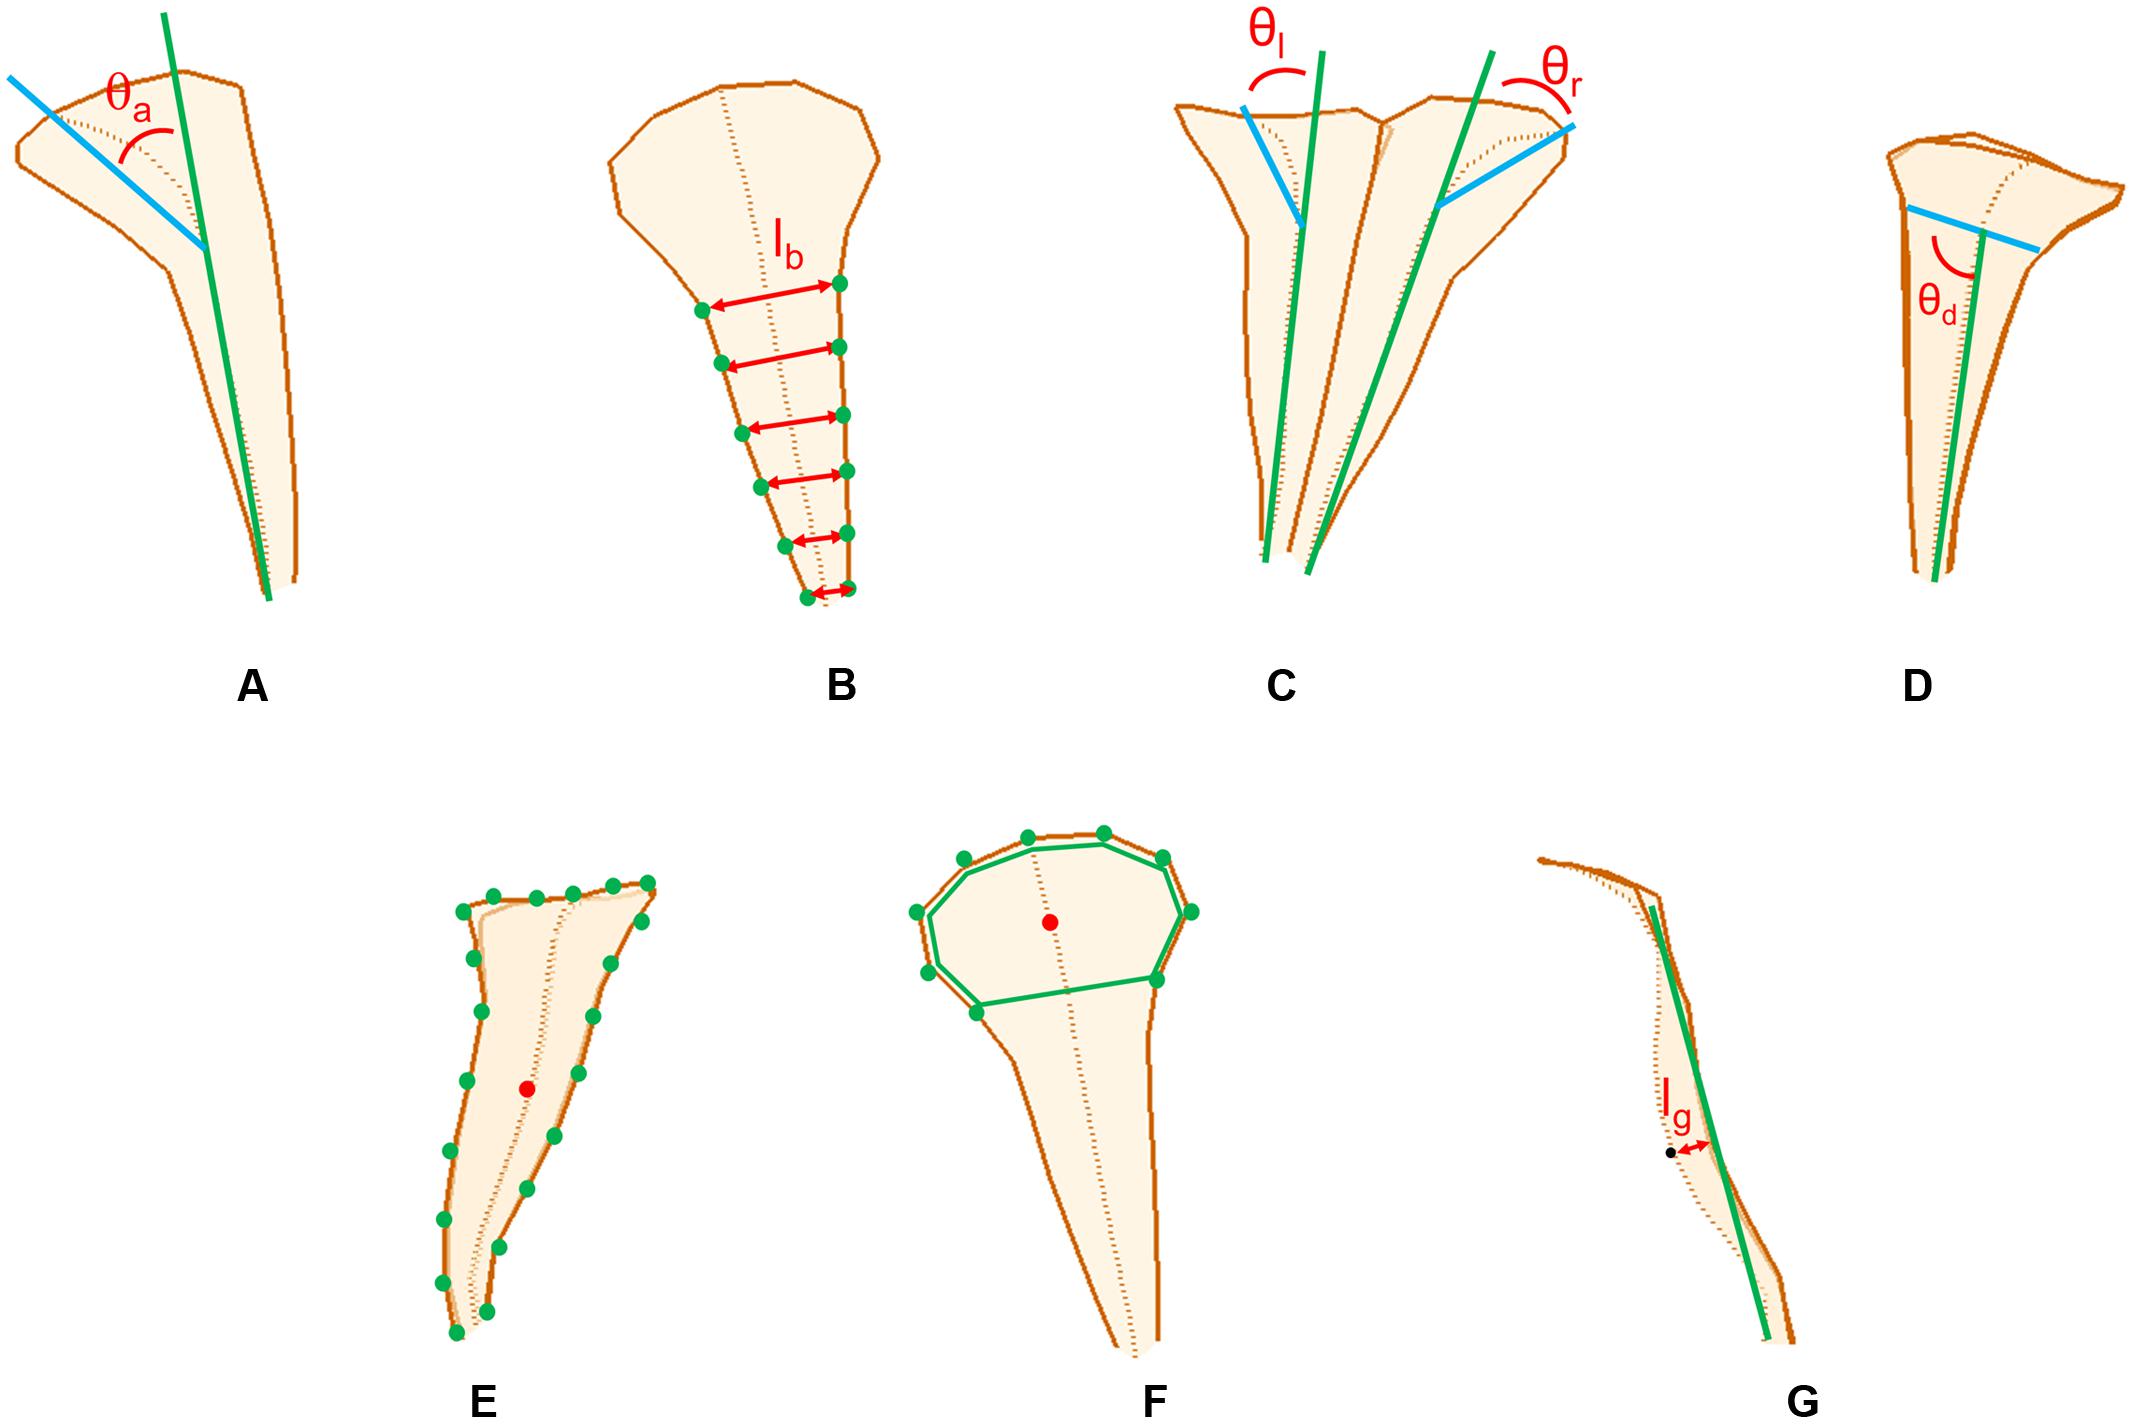
FIGURE 2. The petal traits: (A) petal outward curvature, (B) petal width, (C) left–right asymmetry, (D) midrib asymmetry, (E) petal size, (F) lobe size, and (G) tube dilation.
Petal outward curvature was defined as the angle (𝜃a in Figure 2A) between the tube-growth line (the green line in Figure 2A) and lobe-bending line (the blue line in Figure 2A). The tube-growth line was defined as the line connecting the landmarks M4 and M12 in Figures 3–5. The lobe-bending line was defined as the line connecting the landmarks M1 and M4 in Figures 3–5. Petal outward curvature was quantified for the dorsal, lateral, and ventral petals. Petal width was defined as the mean of the distance (lb in Figure 2B) between the corresponding landmarks on the petal boundaries (the green dots in Figure 2B). Petal width was quantified for the dorsal petals. Left–right asymmetry was defined as the difference between the outward curvature angles of the petals with the same petal type (𝜃l and 𝜃r, respectively, in Figure 2C). Left–right asymmetry was quantified for the dorsal petals. Midrib asymmetry was defined as the angle (𝜃d in Figure 2D) between the lobe–tube boundary (the blue line in Figure 2D) and tube-growth line (the green line in Figure 2D). The lobe–tube boundary was defined as the line connecting the landmarks L1 and L9 in Figure 4. Midrib asymmetry was quantified for the lateral petals. Petal size was defined as the centroid size of the petal (Figure 2E). The centroid size was the squared root of the summed squared distances between all landmarks (the green dots in Figure 2E) and their centroid (the red dot in Figure 2E). Petal size was quantified for the lateral petals. Lobe size was defined as the centroid size of the lobe (the green polygon in Figure 2F). Lobe size was quantified for the ventral petals. Tube dilation was defined as the distance (lg in Figure 2G) from the midpoint of the tube midrib (the black dot in Figure 2G; landmark M8 in Figure 5) to the tube-growth line (the green line in Figure 2G). Tube dilation was quantified for the ventral petals. It was also referred to as ventral tube dilation. When a trait was quantified for the dorsal or lateral petals, each of which was composed of two petals, the mean value of the two petals was used.
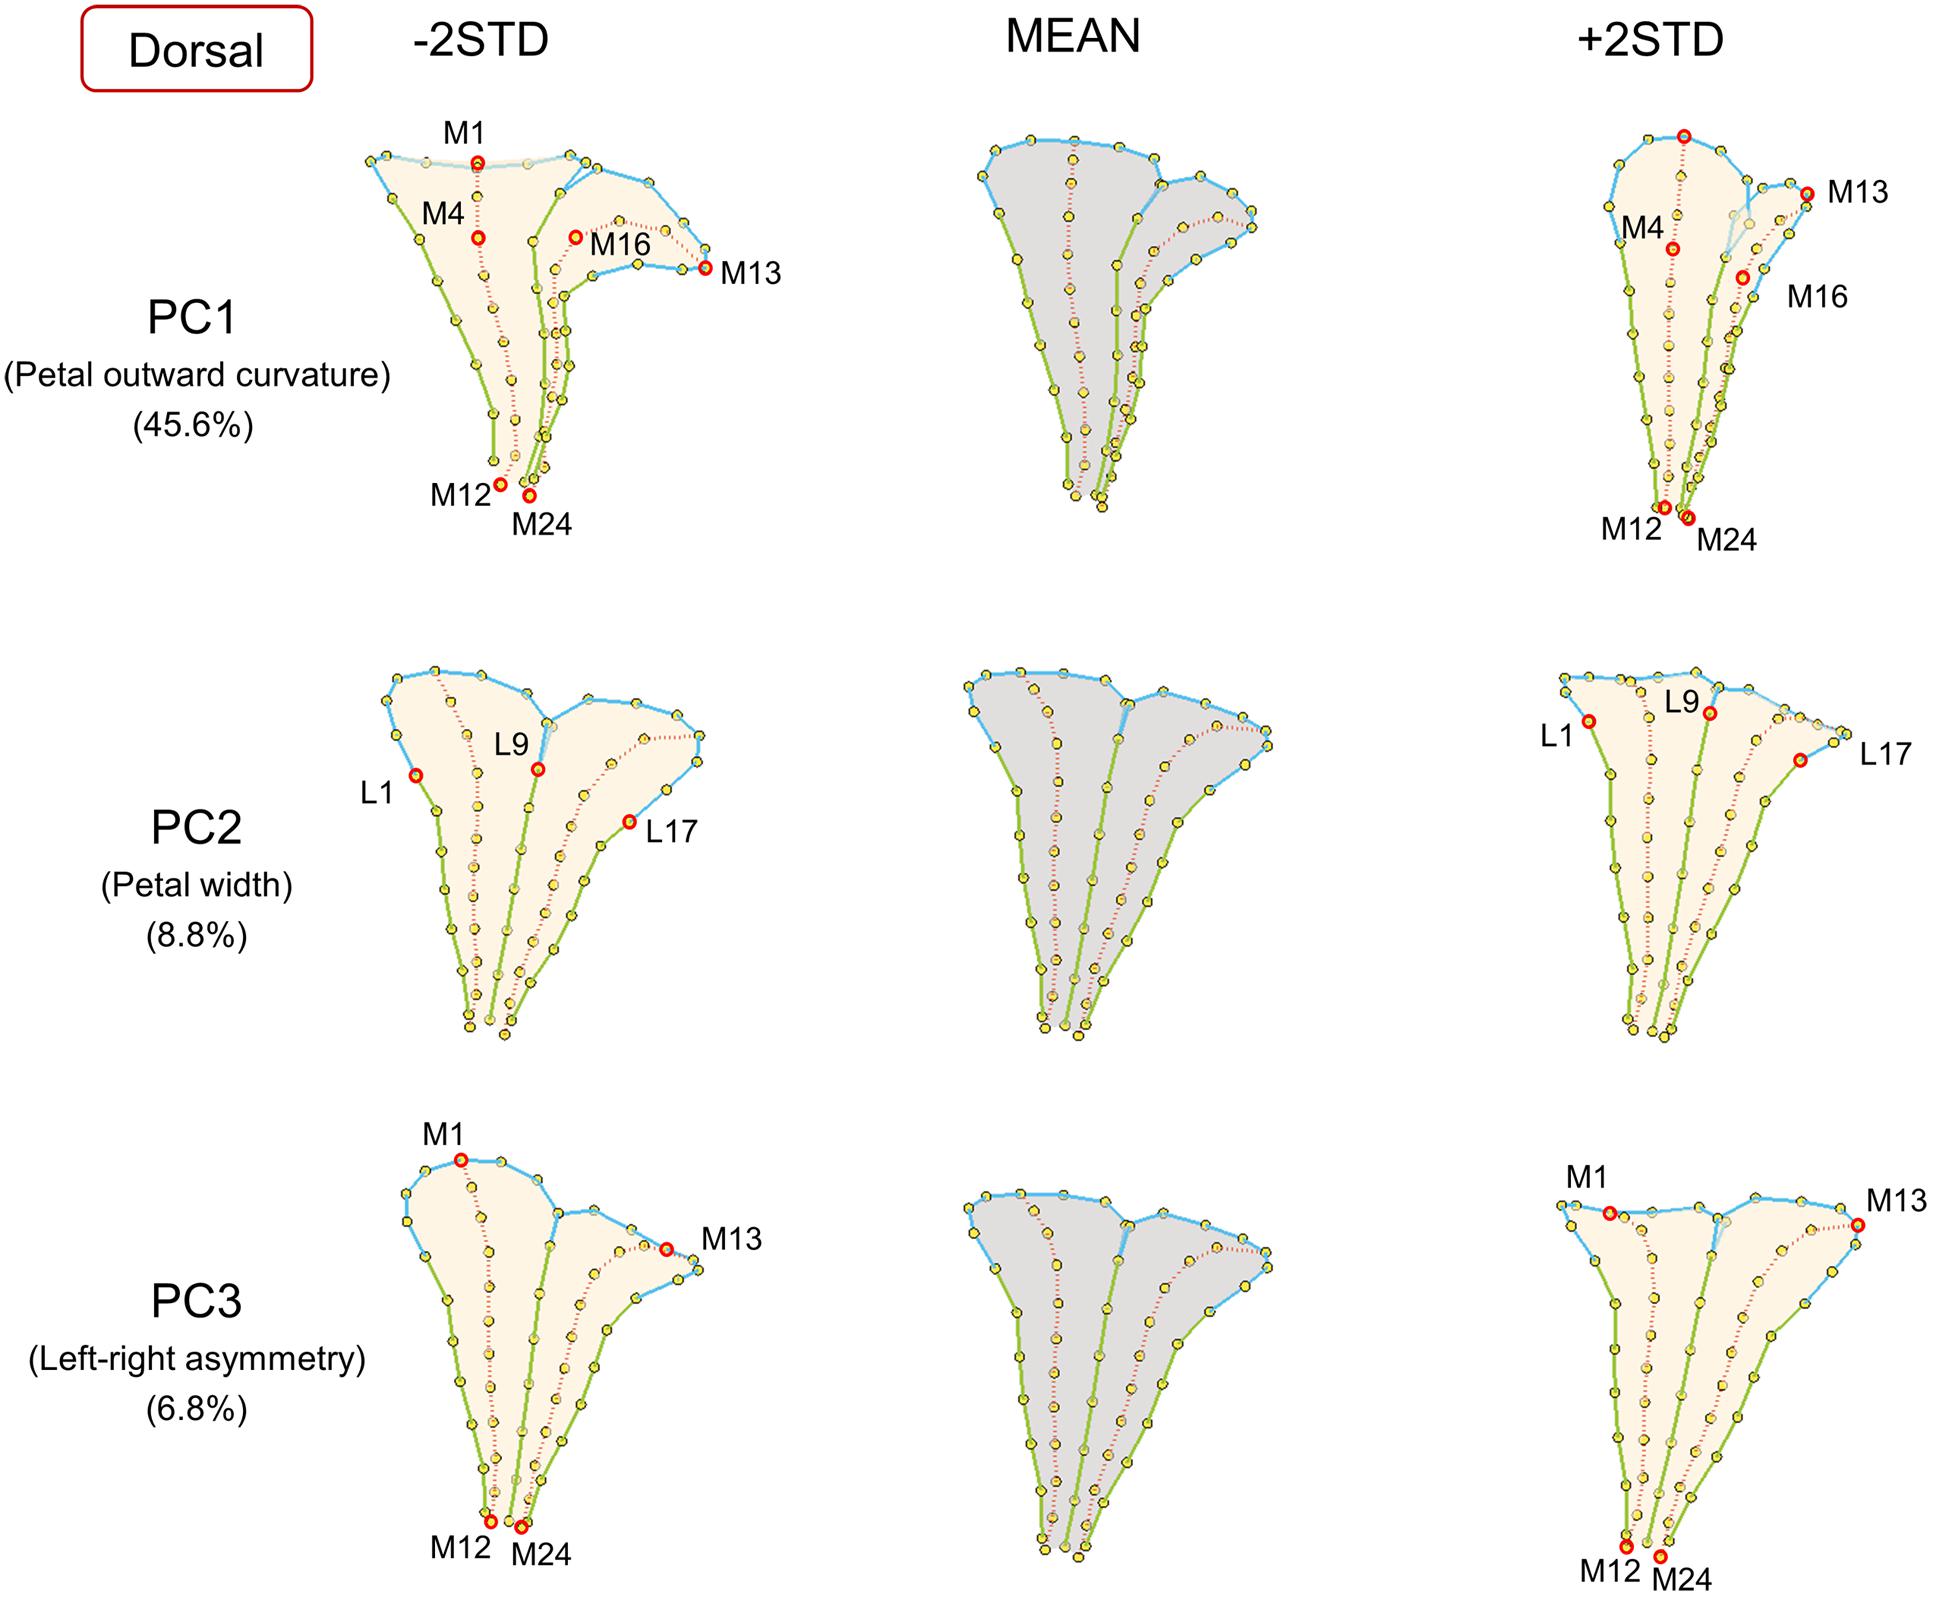
FIGURE 3. The major shape variations of the dorsal petals. The PC1, PC2, and PC3 scores accounted for 45.6, 8.8, and 6.8% of the total shape variation of dorsal petals, respectively. Yellow dots represent landmarks. Red circles represent labeled landmarks. Cyan, green, and red lines represent the lobe contours, tube boundaries, and petal midribs, respectively. The petal forms with mean PC values are illustrated in gray; the petal forms with PC values of mean ± 2 standard deviations are illustrated in beige.
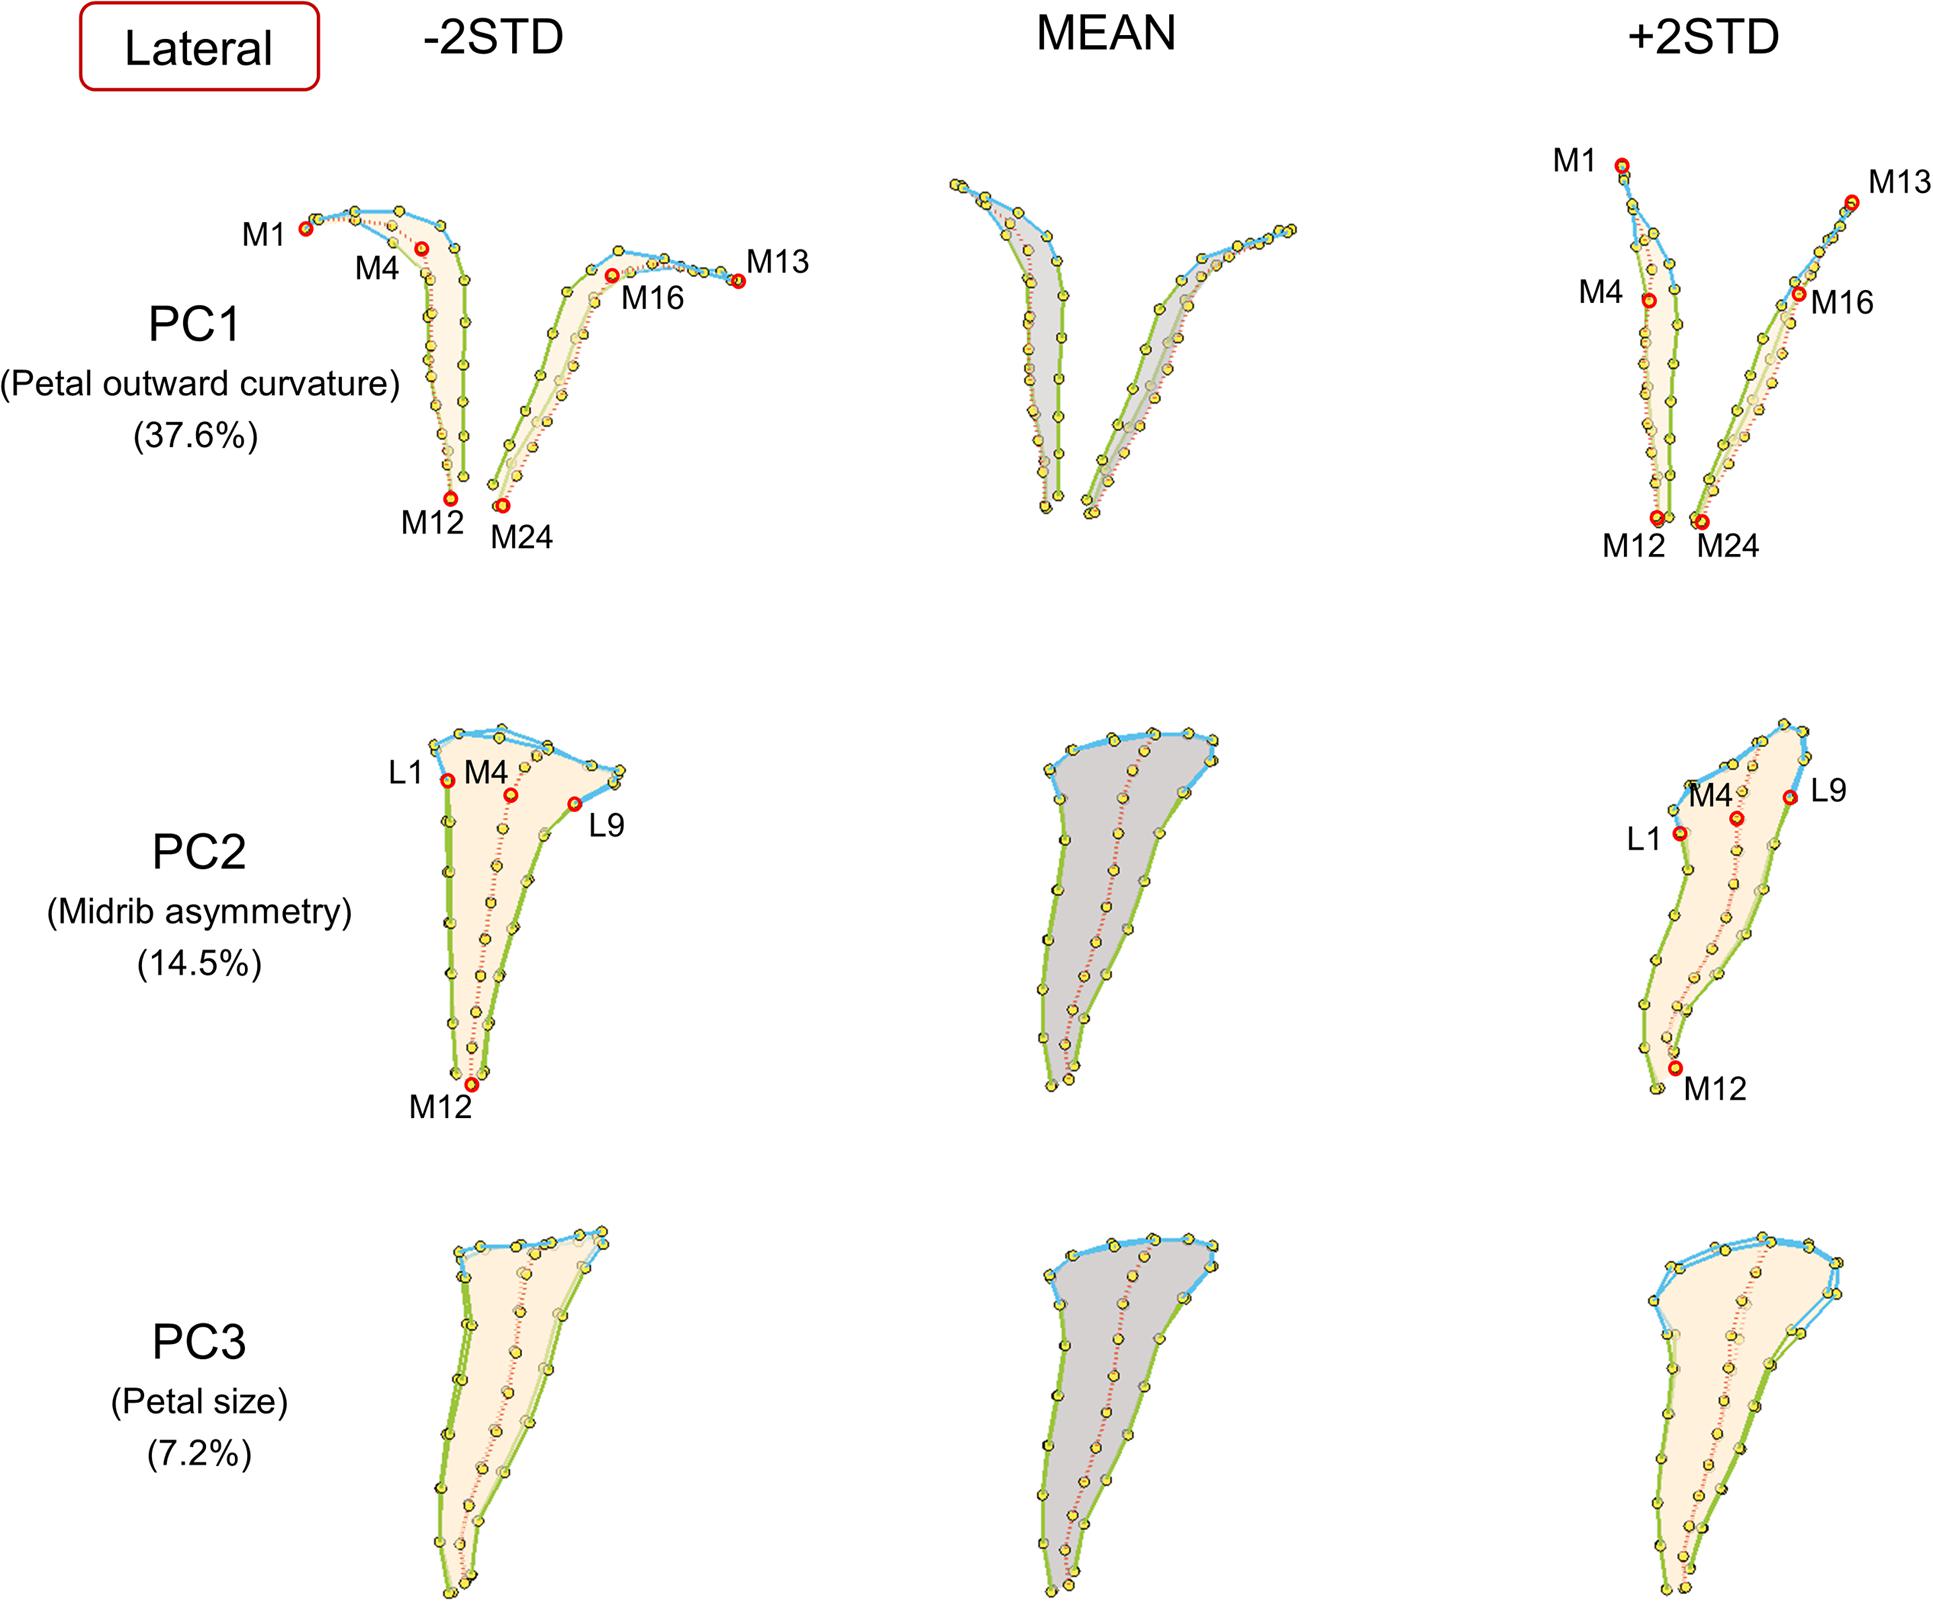
FIGURE 4. The major shape variations of the lateral petals. The PC1, PC2, and PC3 scores accounted for 37.6, 14.5, and 7.2% of the total shape variation of lateral petals, respectively. Yellow dots represent landmarks. Red circles represent labeled landmarks. Cyan, green, and red lines represent the lobe contours, tube boundaries, and petal midribs, respectively. The lateral petals are illustrated from top-view (PC1) or side-view (PC2 and PC3) to exhibit the shape variations. The petal forms with mean PC values are illustrated in gray; the petal forms with PC values of mean ± 2 standard deviations are illustrated in beige.
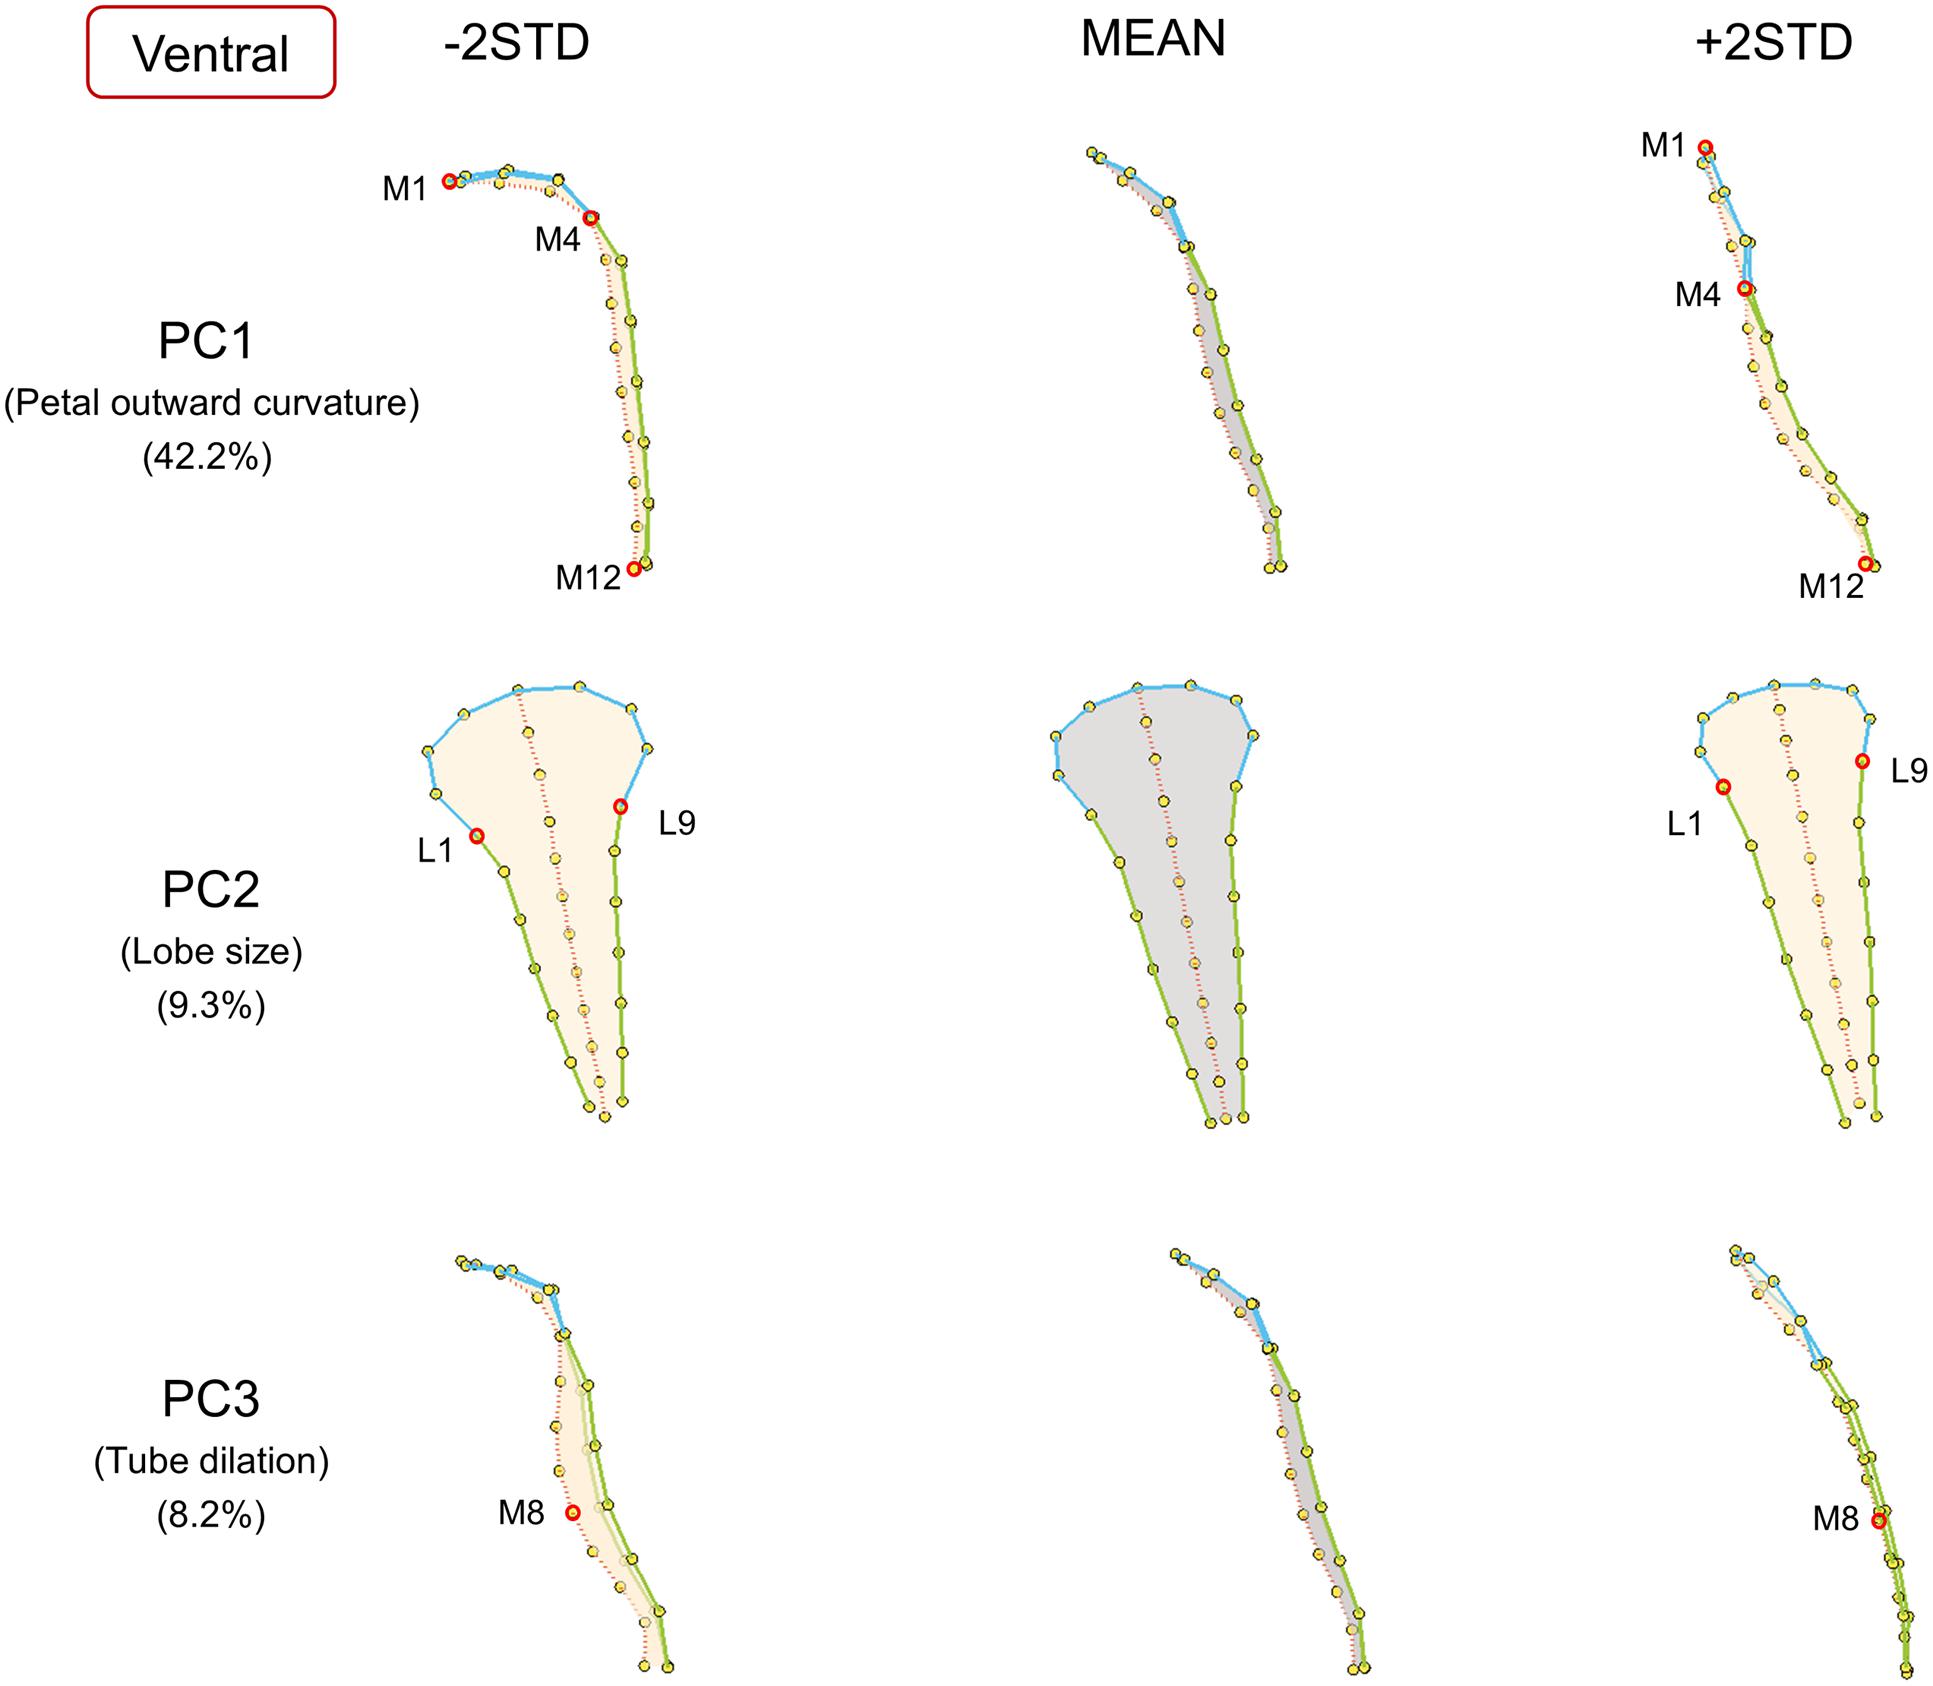
FIGURE 5. The major shape variations of the ventral petals. The PC1, PC2, and PC3 scores accounted for 42.2, 9.3, and 8.2% of the total shape variation of ventral petals, respectively. Yellow dots represent landmarks. Red circles represent labeled landmarks. Cyan, green, and red lines represent the lobe contours, tube boundaries, and petal midribs, respectively. The ventral petals are illustrated from side-view (PC1 and PC3) or front-view (PC2) to exhibit the shape variations. The petal forms with mean PC values are illustrated in gray; the petal forms with PC values of mean ± 2 standard deviations are illustrated in beige.
Correlations between the defined traits and their corresponding principal form variations were examined. The purpose of the examination was to confirm whether the defined traits adequately represent the major form variations. The correlations among the defined traits were also investigated using correlation analysis. The trait difference between different SsCYC genotypes were tested using ANOVA and Scheffé’s multiple comparison test (Scheffé, 1953).
Association between the SsCYC Genotypes and Traits
The logarithm of odds (LOD; Broman and Sen, 2009) scores between the SsCYC genotypes and the defined traits were calculated to provide evidence for the genotype–phenotype association. Permutation tests (Churchill and Doerge, 1994) were also performed to evaluate the levels of significance for the association. The null hypothesis of the permutation tests was that the SsCYC genotype was not associated with the traits. In the permutation tests, the statistic was the LOD scores. The null distribution was generated by reshuffling the phenotypes relative to the genotypes for 10,000 replicates. The P-value of a test was then determined as the frequency of the LOD scores that were equal to or greater than the original LOD score. The percentage of variance explained (PVE) was also calculated to determine the contribution of the SsCYC genotypes.
Test of Petal Form Similarity
We morphologically examined (1) whether the dorsal petals of actinomorphic plants resemble the ventral petals of zygomorphic plants, rather than the dorsal petals of zygomorphic plants and (2) whether the ventral petals of actinomorphic plants resemble the dorsal petals of zygomorphic plants, rather than the ventral petals of zygomorphic plants. The examination was conducted by evaluating form similarity between two petals, each of which was selected from a petal set. The two-petal set pairs for comparison were (I) the dorsal and ventral petals of actinomorphic plants, (II) the dorsal and ventral petals of zygomorphic plants, (III) the ventral petals of actinomorphic and zygomorphic plants, (IV) the dorsal petals of actinomorphic and zygomorphic plants, (V) the dorsal petals of actinomorphic plants and ventral petals of zygomorphic plants, and (VI) the ventral petals of actinomorphic plants and dorsal petals of zygomorphic plants (Figure 6). Form similarities for all the combinations of the two-petal set pairs were examined, and their means were presented. Actinomorphic plants were assumed to have ventralized phenotypes if set pairs I, III, and V (red double arrows in Figure 6) had larger degrees of form similarities than did set IV. By contrast, actinomorphic plants were assumed to have dorsalized phenotypes if set pairs I, IV, and VI (green double arrows in Figure 6) had larger degrees of form similarities than did set III. Form similarity was evaluated using the Hausdorff distance (Huttenlocher et al., 1993) between the landmarks of the two petals. A small Hausdorff distance indicates a high degree of similarity between the two petals. After the Hausdorff distances were obtained, one-way ANOVA was performed to determine the difference in the Hausdorff distance among the petal sets. A Scheffé multiple comparison test was also conducted to determine which petal set tended to differ from the others. Because the plants of genotype C/c showed wide floral form variation, the individuals of genotype C/c were excluded from this examination.
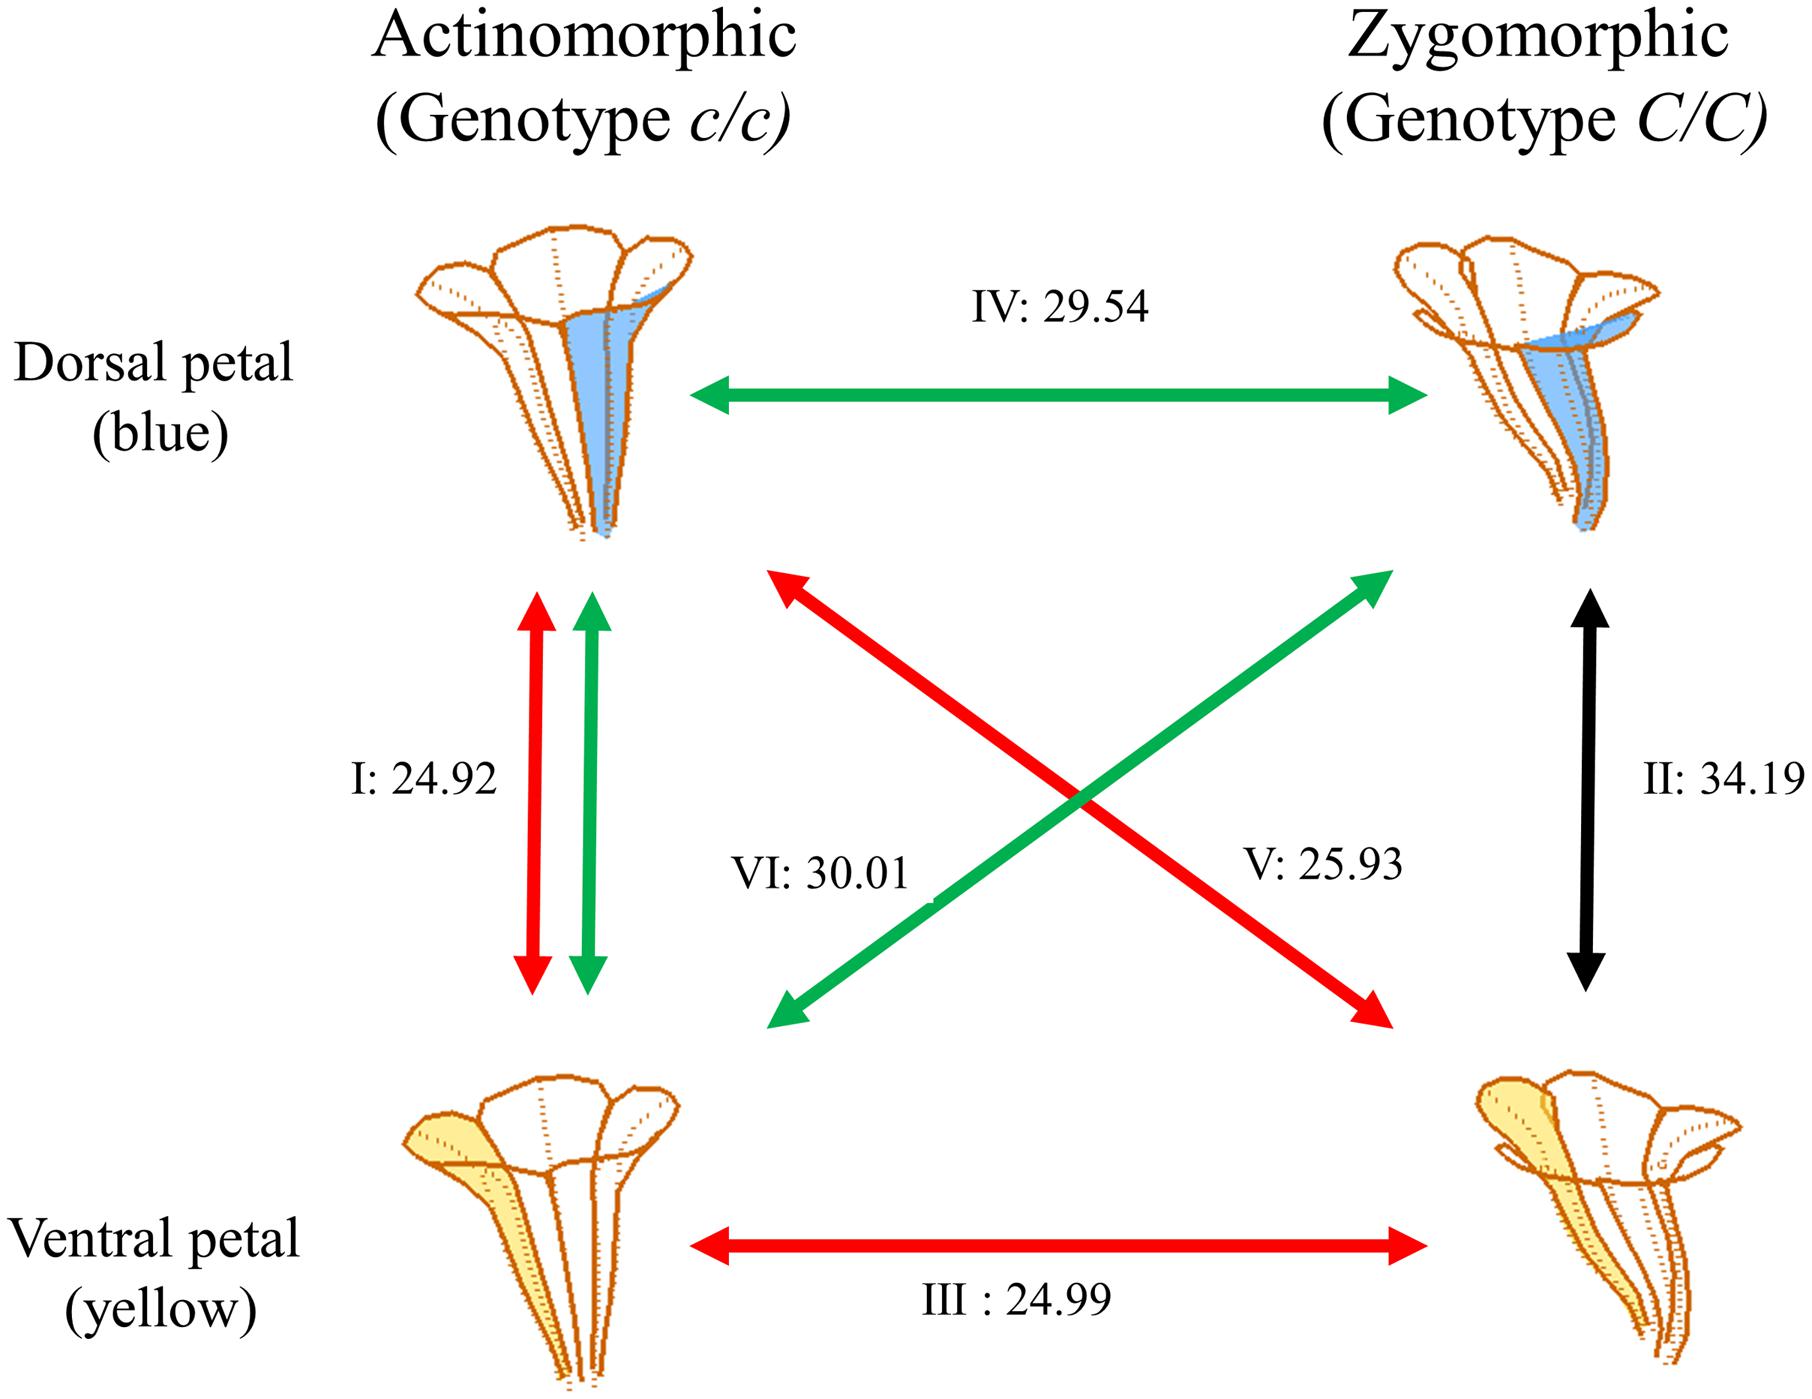
FIGURE 6. Shape similarities between petals. The dorsal and ventral petals are illustrated in blue and yellow, respectively. The numbers alongside the lines indicate the mean Hausdorff distances between the petal sets. The Roman numerals indicate the comparison of two-petal set pairs: (I) the dorsal and ventral petals of actinomorphic plants, (II) the dorsal and ventral petals of zygomorphic plants, (III) the ventral petals of actinomorphic and zygomorphic plants, (IV) the dorsal petals of actinomorphic and zygomorphic plants, (V) the dorsal petals of actinomorphic plants and the ventral petals of zygomorphic plants, and (VI) the ventral petals of actinomorphic plants and the dorsal petals of zygomorphic plants.
Results
Major Form Variations of the Petals
Major petal form variation was identified using the proposed procedure. The first three principal components (PCs) accumulatively accounted for 61.2, 59.3, and 59.7% of the total form variations for the dorsal, lateral, and ventral petals, respectively. Each of the remaining PCs accounted for <5% of the total form variation. Thus, only the petal form variation corresponding to the first three PCs were presented. The PC scores were normally distributed (the right histograms in Figure 7). Figures 3–5 visualize the major form variations of the dorsal, lateral, and ventral petals, respectively.
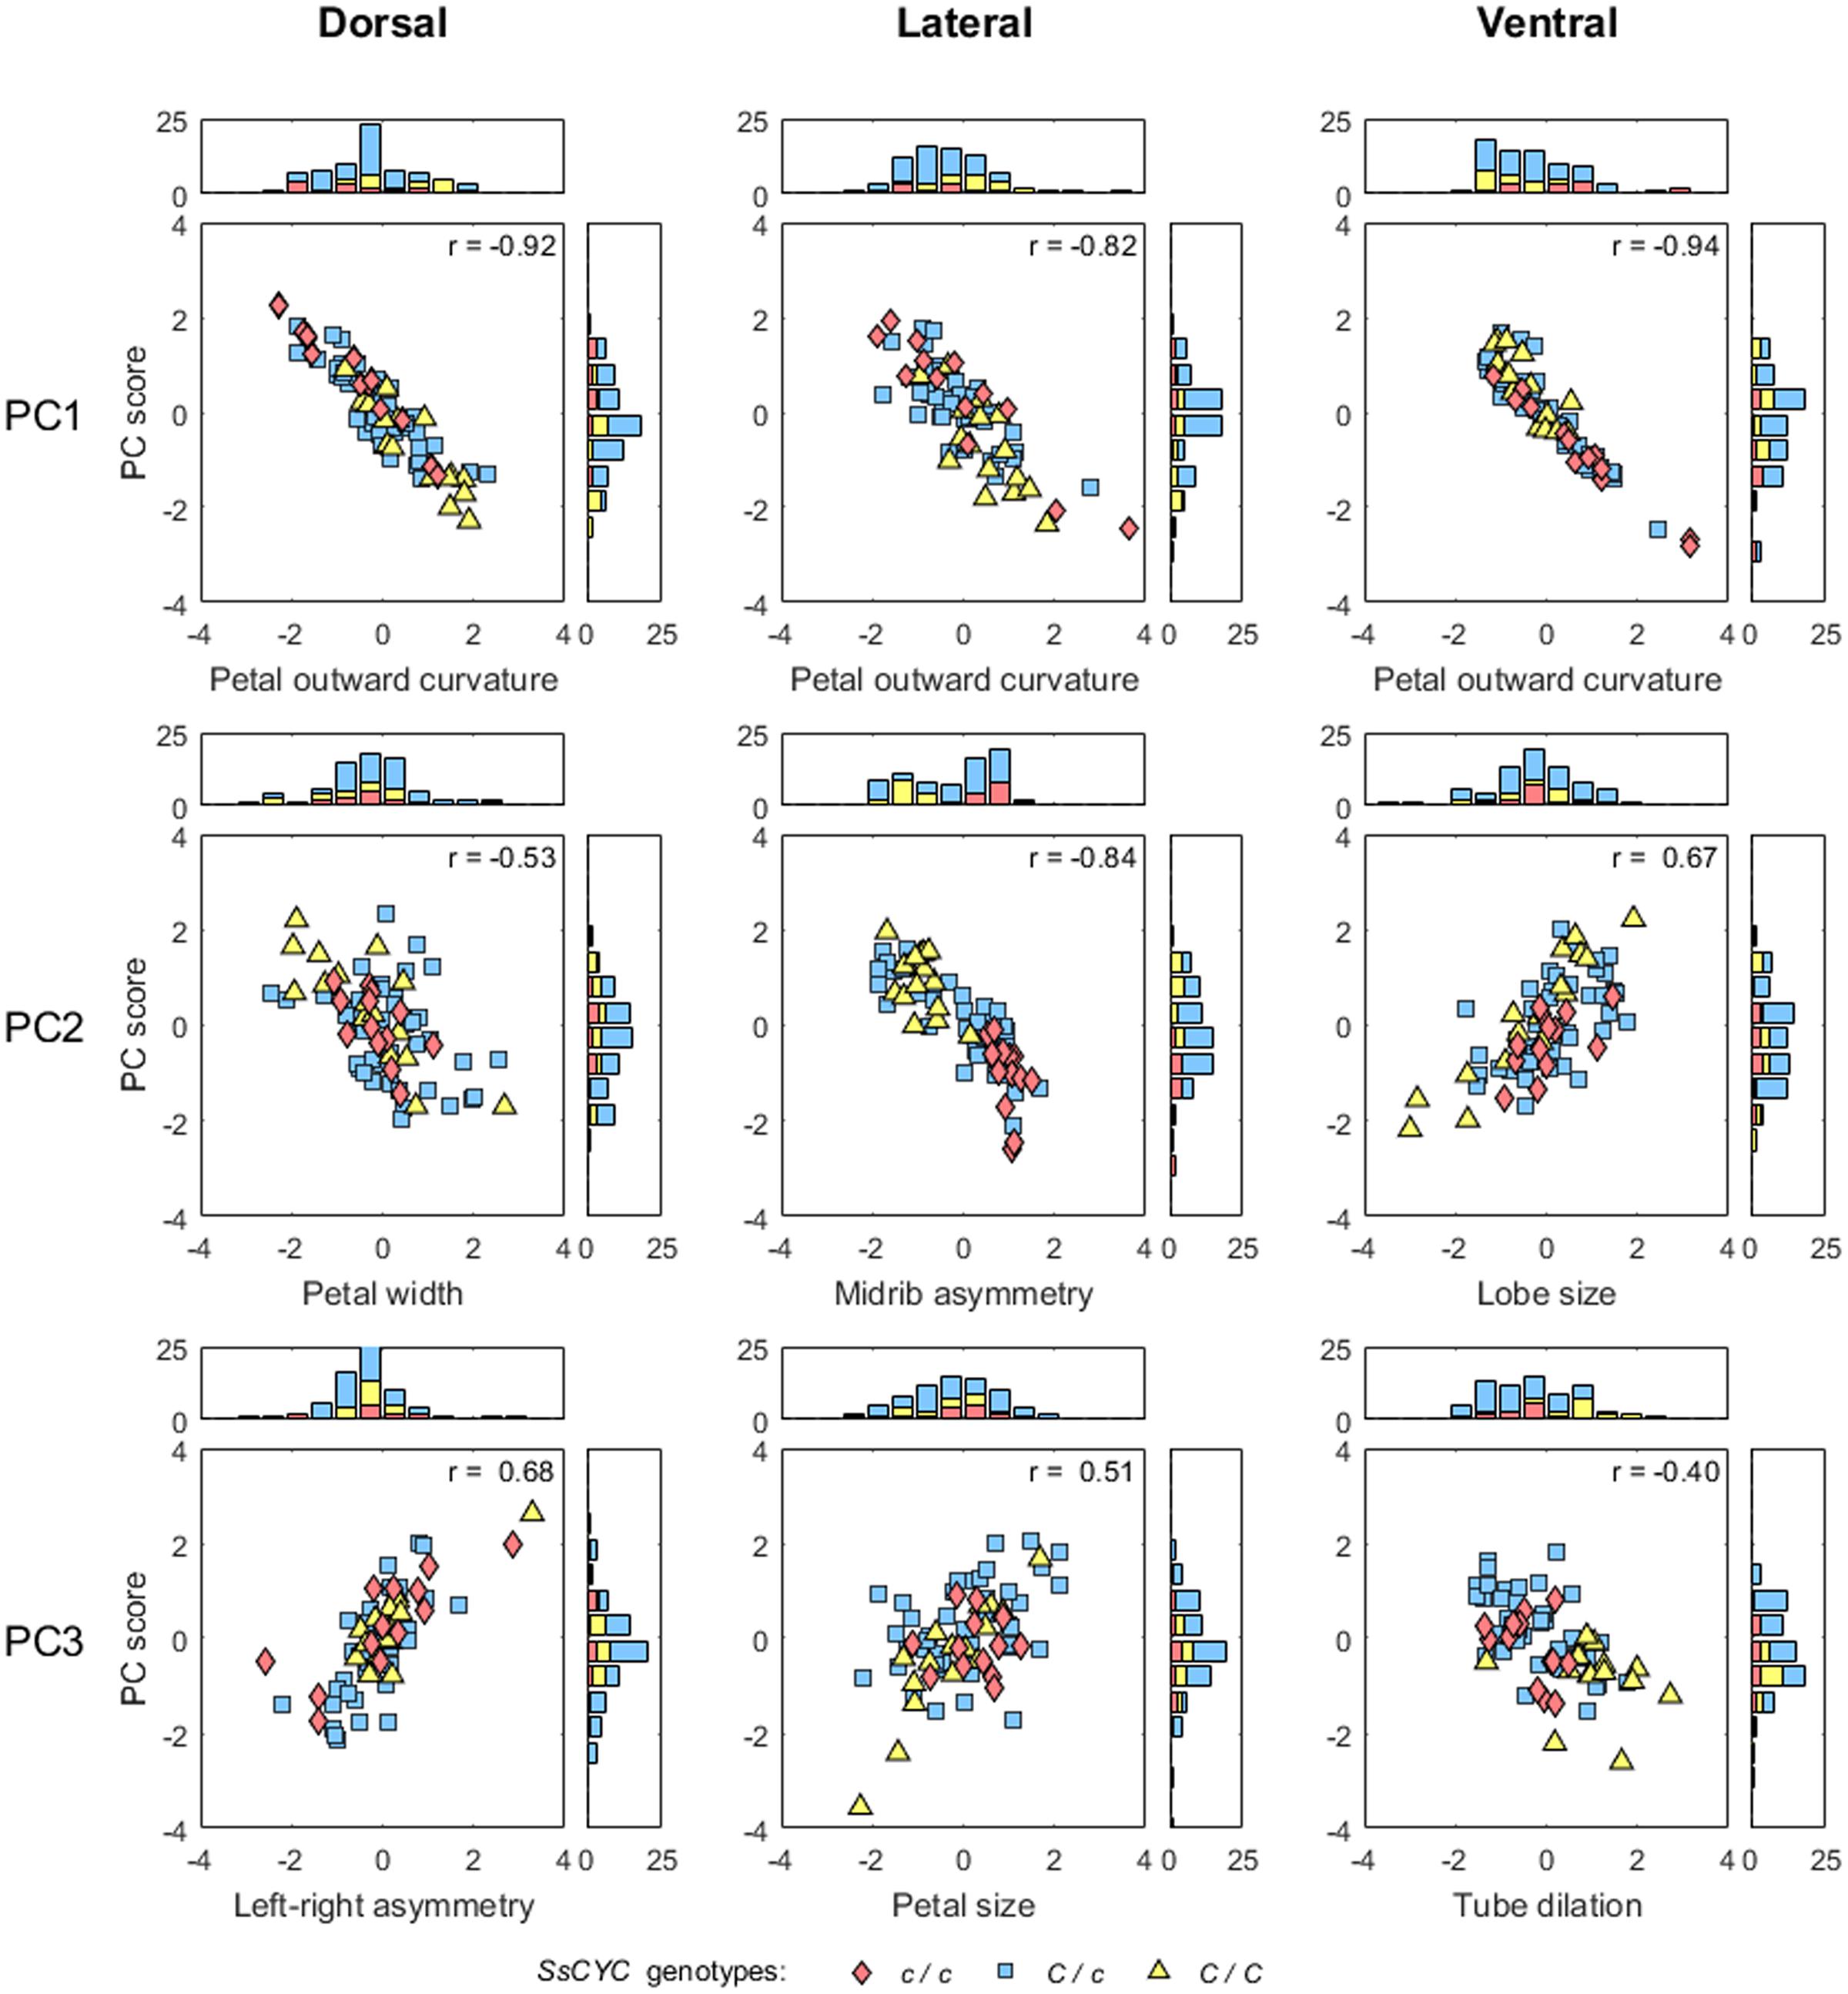
FIGURE 7. Scatter plots and histograms of the PC scores and defined traits. The PC scores and trait values are standardized. The correlation coefficients of the PC scores and trait values are provided at the upper right corners of the scatter plots.
The major form variations of the dorsal, lateral, and ventral petals were examined. For the dorsal petals (Figure 3), we observed that PC1 was primarily associated with petal outward curvature. The lobes (the curves connecting landmarks M1–M4 and M13–M16) of the petals with small PC1 values bent outward at a considerable degree. By contrast, the lobes of the petals with large PC1 values were relatively straight. PC2 principally corresponded to the petal width. The widths (the distances between landmarks L1 and L9) of the petals with small PC2 values were greater than those of the petals with large PC2 values. PC3 was particularly related to left–right petal asymmetry. Among the petals with small PC3 values, the petal at one side remained straight, whereas the petal at the other side (the curves connecting landmarks M1–M12 and M13–M24) curved outward, and vice versa.
Among the lateral petals (Figure 4), PC1 principally corresponded to petal outward curvature. The lobes (the curves connecting landmarks M1–M4 and landmarks M13–M16) of the petals with small PC1 values bent outward at a substantial degree compared with those of the petals with large PC1 values. PC2 was primarily related to midrib asymmetry. The tube midribs (the curves connecting landmarks M4–M12) of the petals with large PC2 values were curved. By contrast, the tube midribs of the petals with small PC2 values were relatively straight. PC3 was particularly associated with petal size. Regarding size, the petals with small PC3 values were smaller than the petals with large PC3 values.
Among the ventral petals (Figure 5), PC1 primarily corresponded to petal outward curvature. The lobes (the curves connecting landmarks M1–M4) of the petals with small PC1 values bent outward at a significant degree, whereas the lobes of the petals with large PC1 values were relatively straight. PC2 was mainly related to lobe size. The lobe sizes (the area surrounded by landmarks L1–L9) of the petals with small PC2 values were larger than those of the petals with large PC2 values. PC3 was particularly associated with tube dilation. The tube centers (landmark M8) of the petals with small PC3 values protruded at a substantial degree. By contrast, the tubes of the petals with large PC3 values were relatively flat.
Morphological Traits of the Petals
A correlation analysis was performed to determine whether the defined morphological traits adequately describe the form variations identified through GM analysis. The results revealed that the variation of the nine morphological traits was moderately or strongly correlated with their corresponding PC scores (Figure 7; absolute correlation coefficients = 0.40–0.94). The scores for these morphological traits were continuously distributed.
The correlations among the morphological traits were also examined. Two additional traits, flower opening and corolla asymmetry, proposed by Wang et al. (2015) were included in the analysis. These two traits describe the form variation of the whole corolla versus the nine morphological traits defined in the present study, which were quantified specifically for individual petals. Figure 8 shows the results of the pairwise correlation in a correlation matrix. The results revealed that the outward curvature of the dorsal and lateral petals were strongly correlated with each other (r = 0.66) and were also moderately correlated with flower opening (r = 0.42 and 0.43, respectively). This finding indicated that corollas with large degrees of flower opening led to large degrees of outward curvature of the dorsal and lateral petals. The petal size of the lateral petals, petal width of the dorsal petals, and lobe size of the ventral petals were moderately or strongly correlated with each other (r = 0.55, 0.70, and 0.80, respectively). Left–right asymmetry of the dorsal petals was not specifically correlated with any other trait (r < 0.20). Corolla asymmetry was strongly correlated with the midrib asymmetry of the lateral petals and the dilation of ventral region of the tube (r = -0.91 and 0.63, respectively). This observation indicated that a strong dorsoventral asymmetry was associated with the asymmetric midribs of the lateral petals and large ventral tube dilation.
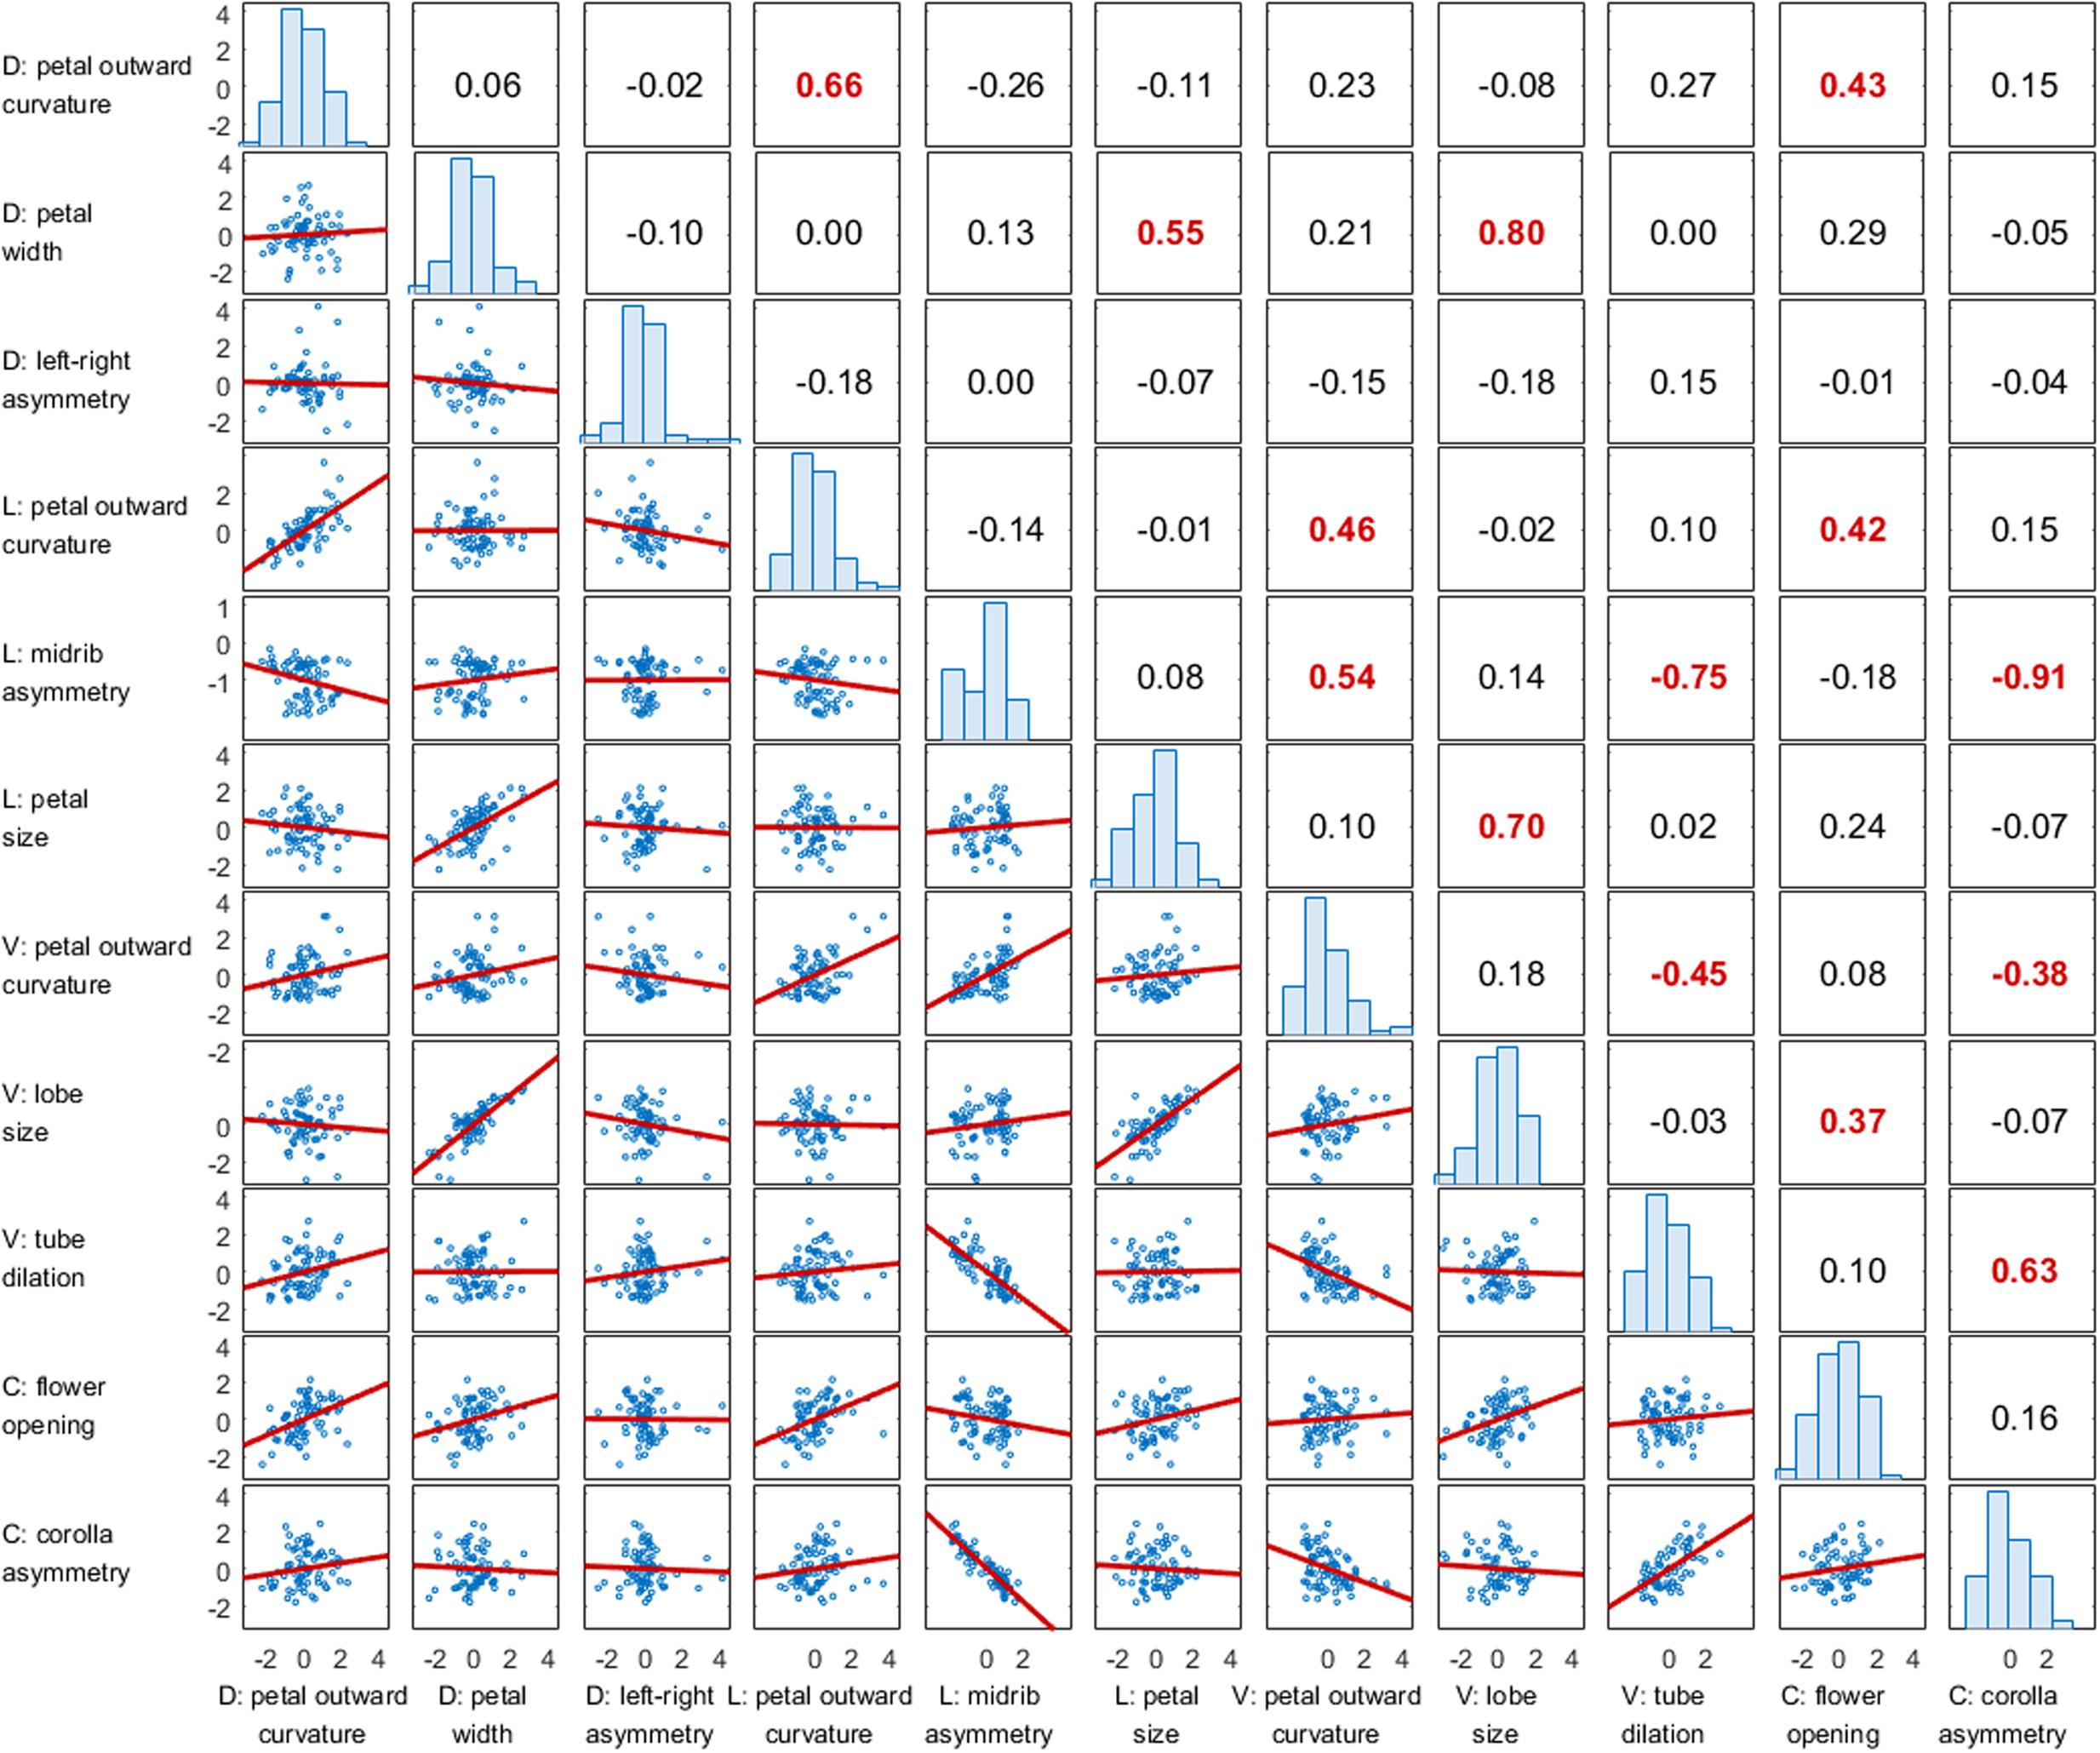
FIGURE 8. Correlation matrix of the defined traits. The numbers at the upper triangle indicate the correlation coefficients, and the P-values less than 0.005 are highlighted in red. The figures at the lower triangle indicate the correlation plots. The figures at the diagonal indicate the distributions of the defined traits. D, V, and L denote the dorsal, ventral, and lateral petals, respectively. C denotes the corolla.
Table 1 summarizes the results of one-way ANOVA and multiple comparison analysis of the scores of defined traits versus SsCYC genotypes. One-way ANOVA revealed significant differences in the means of dorsal petal outward curvature, lateral midrib asymmetry, ventral petal outward curvature, and ventral tube dilation among the three genotypes (F > 5, P < 0.01). Results presented in Figure 9 show that the scores of dorsal petal outward curvature and ventral tube dilation increased with the c allele replacing by the C allele. By contrast, the scores of lateral midrib asymmetry and ventral petal outward curvature decreased with the c allele replacing by the C allele. This observation implies that the SsCYC genotype may be associated with dorsal petal outward curvature, lateral midrib asymmetry, ventral petal outward curvature, and ventral tube dilation.
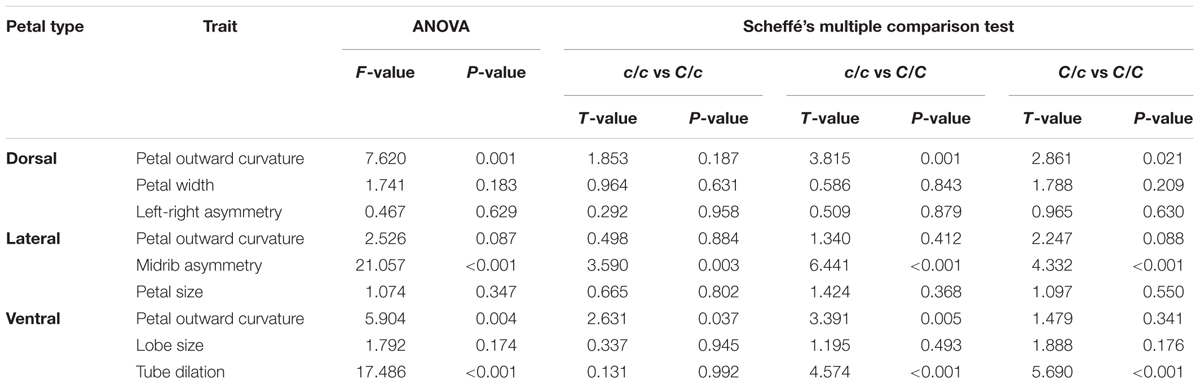
TABLE 1. ANOVA and Scheffé’s multiple comparison test of the petal traits.
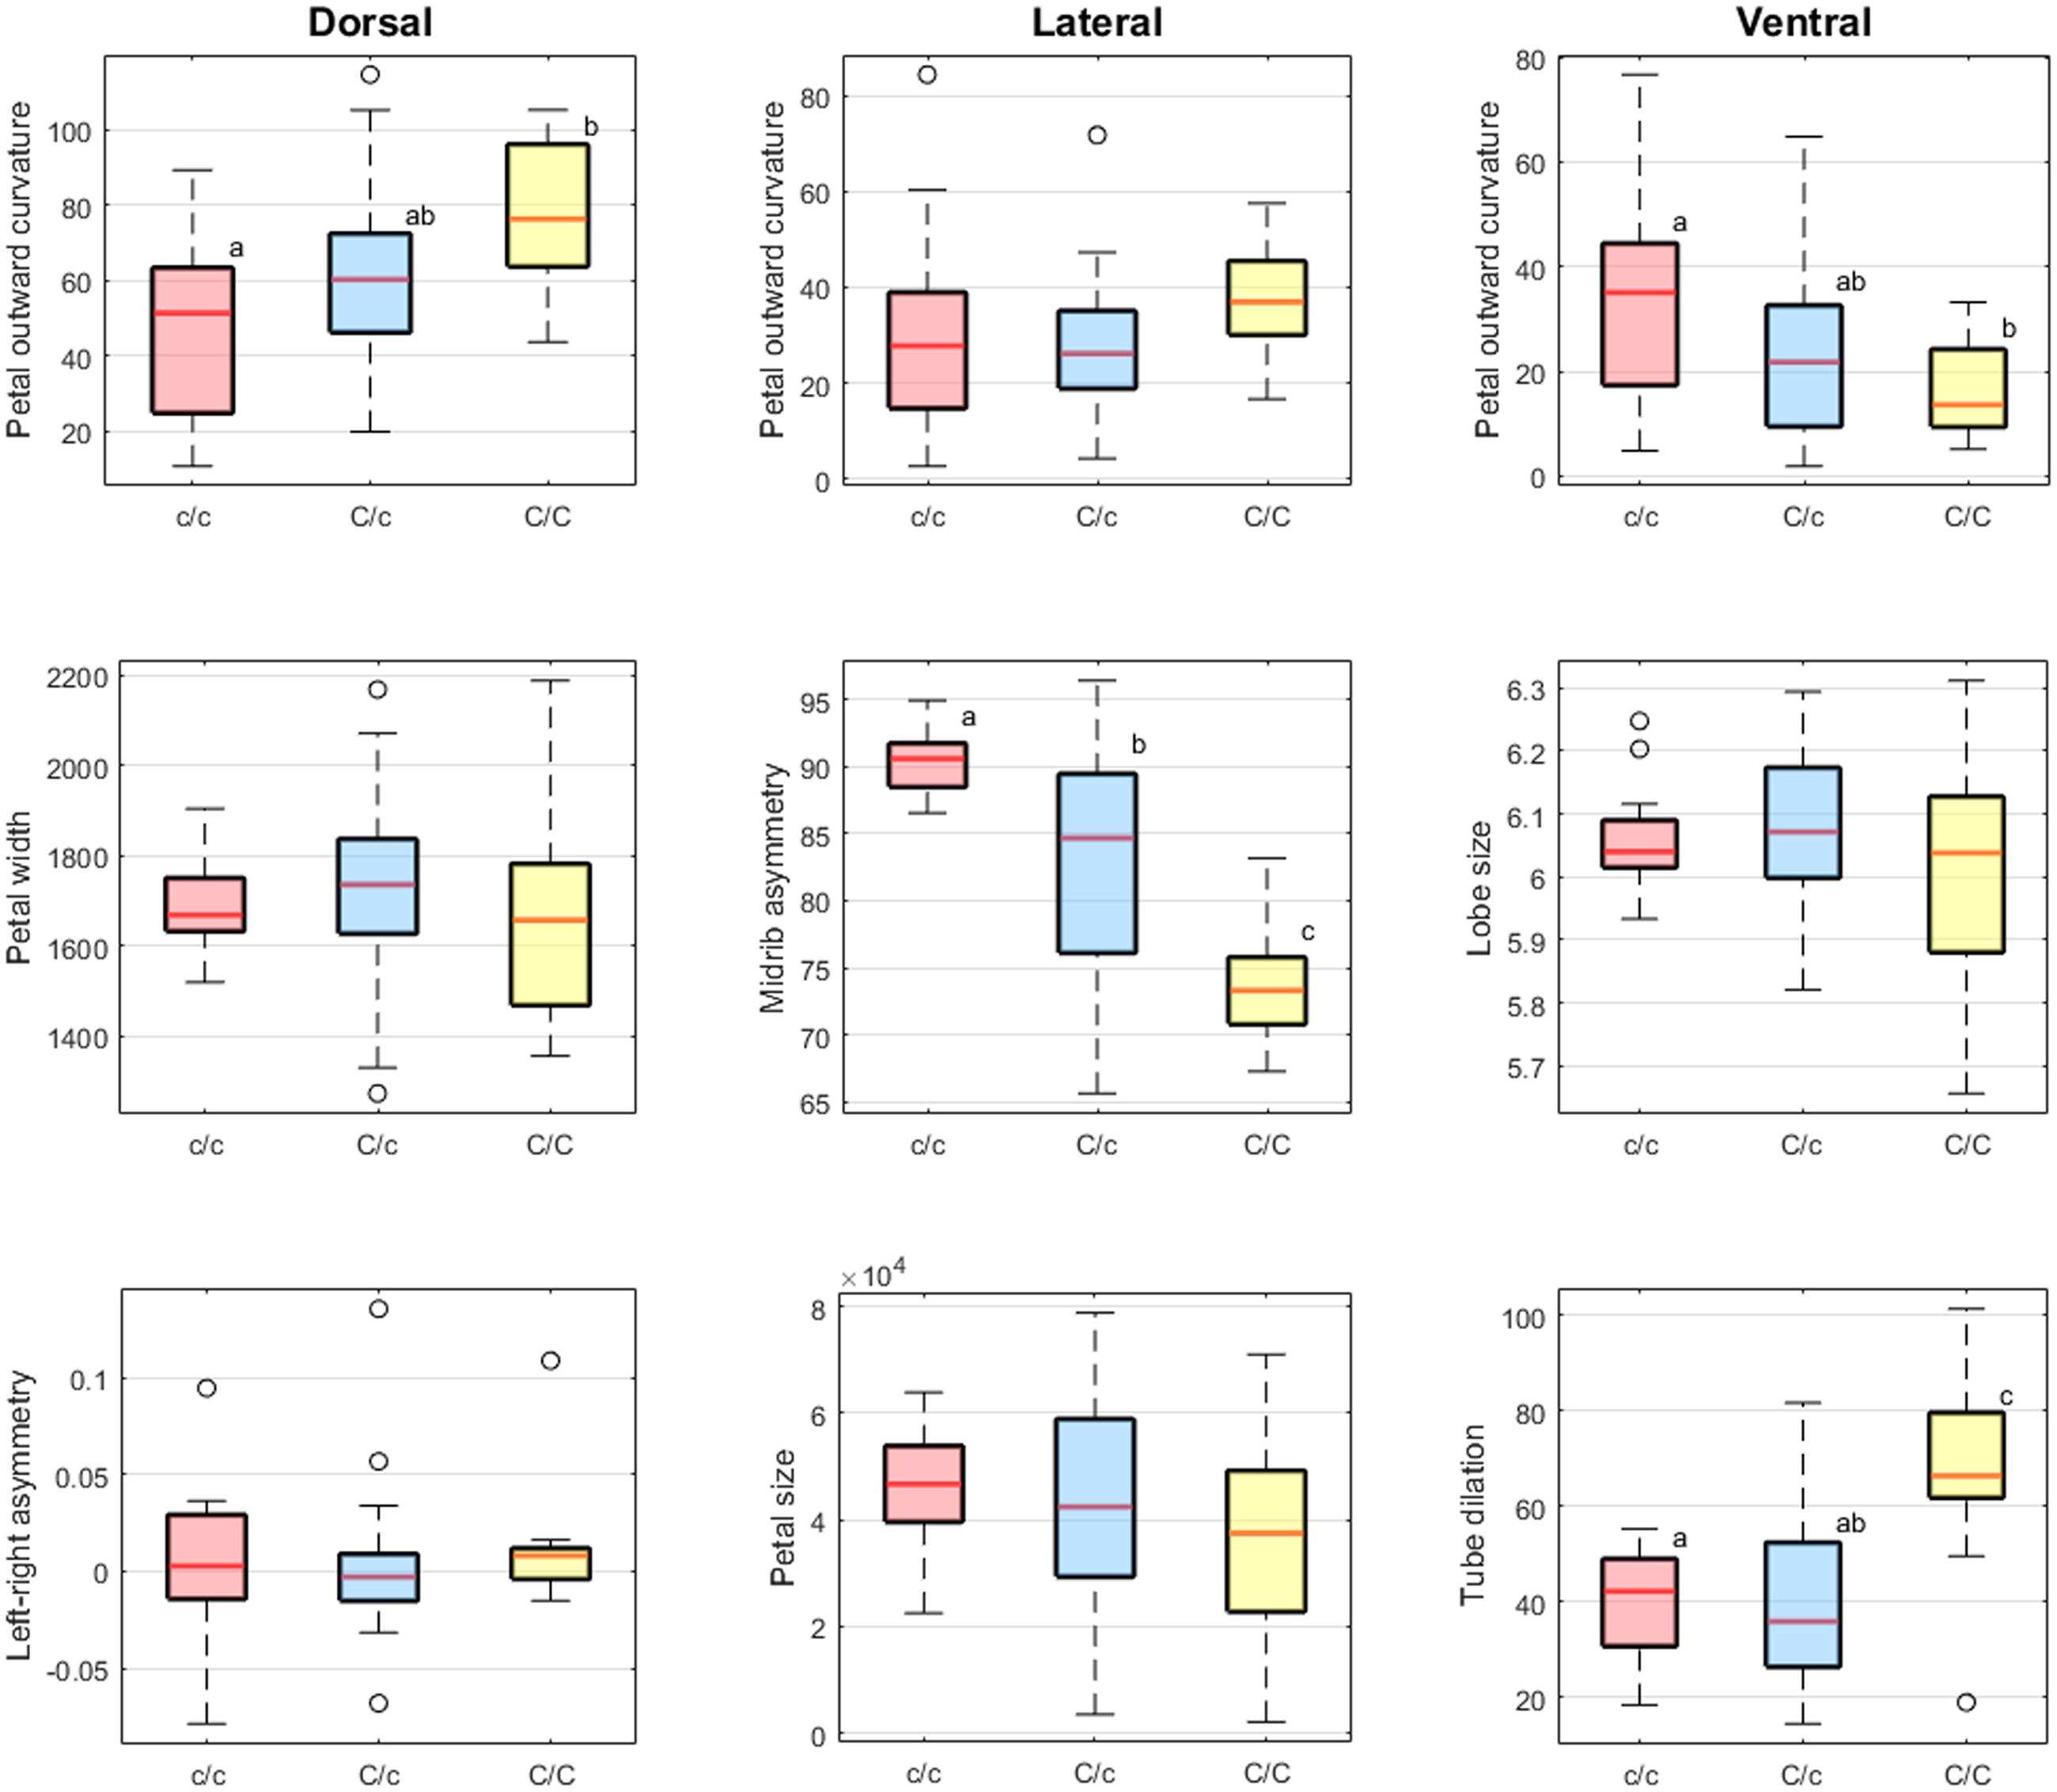
FIGURE 9. Boxplots of the defined traits. The lowercase alphabet near the box presenting the grouping result of Scheffé’s multiple comparison test.
Association between the SsCYC Genotypes and Defined Traits
Table 2 summarizes the LOD scores, P-values from the permutation tests, and PVE. The genotype–phenotype association analysis revealed that the dorsal petal outward curvature, the lateral petal midrib asymmetry, and the ventral tube dilation were closely associated with the SsCYC genotypes (LOD > 3; P < 0.001; PVE > 15%). In addition, the SsCYC genotypes were strongly associated with corolla asymmetry (LOD = 6.22; P < 0.001; PVE = 32.8%).
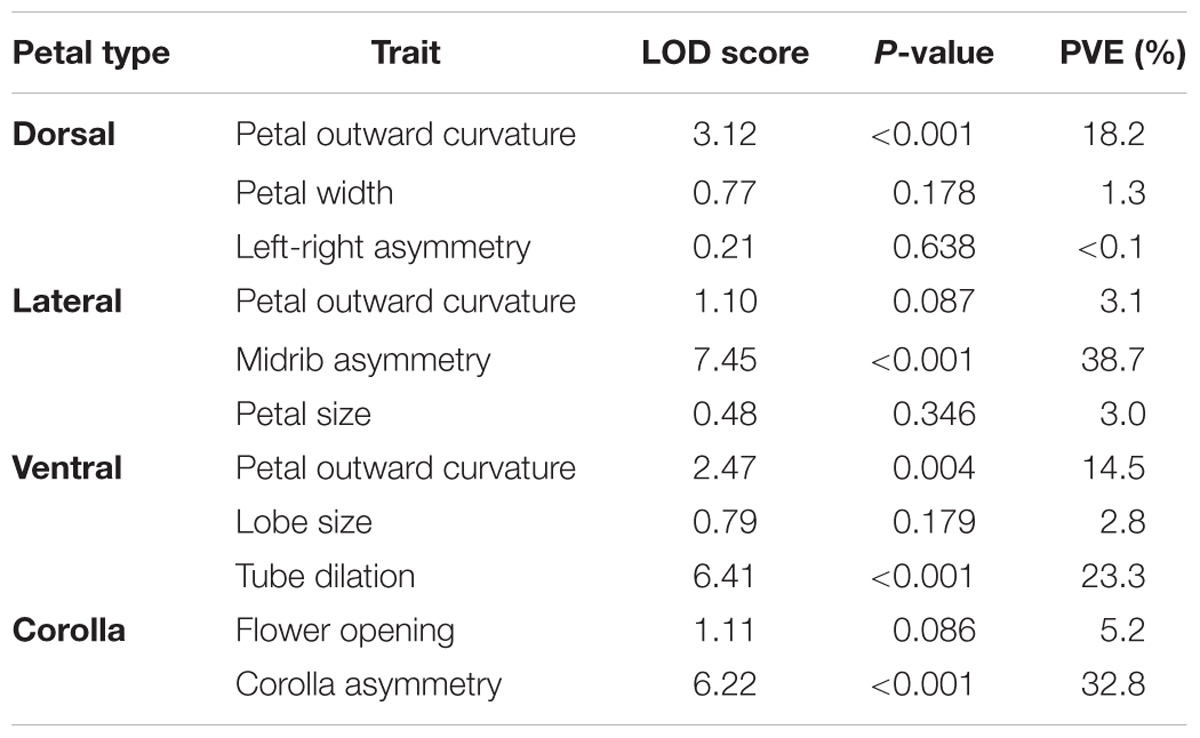
TABLE 2. Logarithm of odds scores of the petal and corolla traits.
Ventralization of the Dorsal Petals on the Actinomorphic Plants
Form similarities between the petal sets were evaluated. The mean Hausdorff distances between the dorsal and ventral petals of actinomorphic plants (set pair I), dorsal and ventral petals of zygomorphic plants (set pair II), ventral petals of actinomorphic and zygomorphic plants (set pair III), dorsal petals of actinomorphic and zygomorphic plants (set pair IV), dorsal petals of actinomorphic plants and ventral petals of zygomorphic plants (set pair V), and ventral petals of actinomorphic plants and dorsal petals of zygomorphic plants (set pair VI) were 24.92, 34.19, 24.99, 29.54, 25.93, and 30.01, respectively (Figure 6). One-way ANOVA revealed significant differences in the mean Hausdorff distances among the six set pairs (F = 20.03, P < 0.001). In the multiple comparison test, no significant difference was observed in the means of the Hausdorff distances of the set pairs I, III, and V (Group A in Figure 10). By contrast, the Hausdorff distances of these three set pairs were significantly lower than those of the set pairs II, IV, and VI (Groups B and C in Figure 10). The results indicated that the petals in the set pairs I, III, and V (red double arrows in Figure 6) resembled each other more closely than the petals in the set pairs IV and VI (green double arrows in Figure 6). This evidence may support the implication that the change of SsCYC allele combinations from C/C to c/c, which reflects the transition from zygomorphic to actinomorphic flowers, resulted in the ventralization of the dorsal petals.
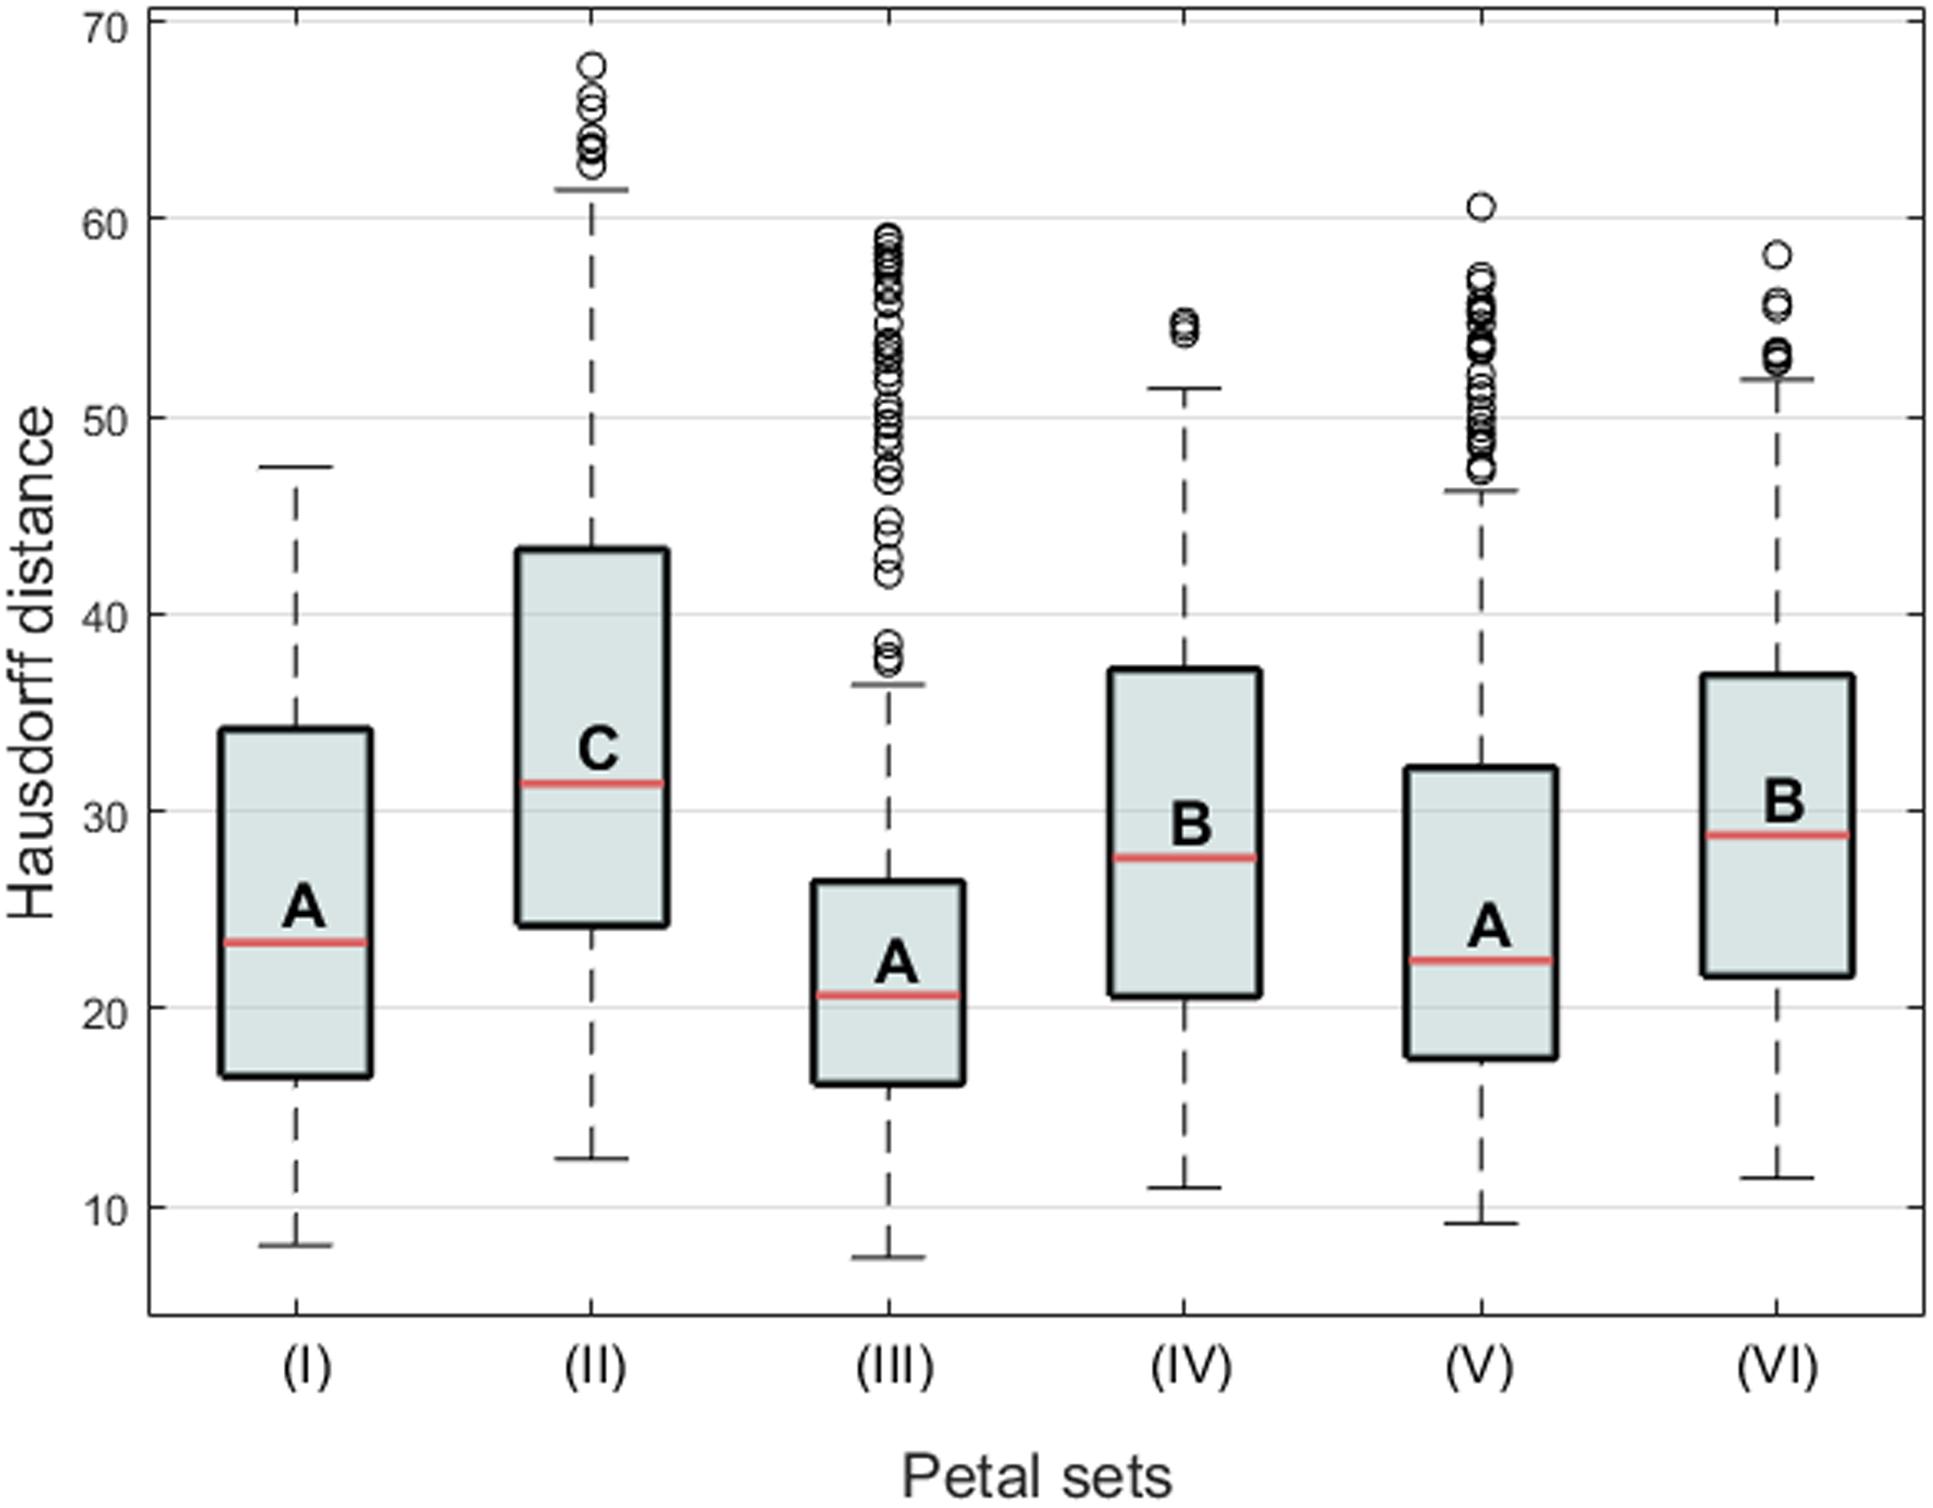
FIGURE 10. Boxplot of the Hausdorff distances between the petal sets. The letters A, B, and C indicate the groups of the petals. The Roman numerals indicate the comparison of two-petal set pairs, (I) the dorsal and ventral petals of actinomorphic plants, (II) the dorsal and ventral petals of zygomorphic plants, (III) the ventral petals of actinomorphic and zygomorphic plants, (IV) the dorsal petals of actinomorphic and zygomorphic plants, (V) the dorsal petals of actinomorphic plants and the ventral petals of zygomorphic plants, and (VI) the ventral petals of actinomorphic plants and the dorsal petals of zygomorphic plants.
Discussion
In this study, 3D-GM was applied to S. speciosa to determine the petal form variation. The petal traits were then defined according to the analysis of the form variations of each petal. We evaluated the association of the variation of the defined traits with the SsCYC genotypes. We also provided morphological evidence suggesting that ventralization contributes to the development of the dorsal petals in peloric Gloxinia.
3D Technology Improving the Phenotyping of Petal Forms
Defining appropriate traits is a crucial challenge for plant phenotyping and genotype–phenotype association analysis (Fiorani and Schurr, 2013). In this study, the petal traits were defined by observing the 3D visualized petal form variation and were justified by conducting correlation analyses between the traits and form variations. The moderate-to-high correlation coefficients suggested that these defined petal traits accurately and sufficiently described the major form variations of the petals. In GM analysis, only one trait was defined from each PC. Taking PC1 of the dorsal petal as an example, the petal outward curvature accounted for the most significant change in the visualized form variation (Figure 3). A high correlation coefficient was observed between the variation of dorsal petal PC1 and the variation of petal outward curvature (r = -0.92). Nevertheless, some minor variations may exist, such as the lobe size variation observed in the visualized form variations for PC1 of the dorsal petal. The correlation analysis was sufficient to support that the defined petal traits were valid for describing the petal form variation for genotype–phenotype association analysis.
Association between the SsCYC Genotypes and Defined Traits
The petal outward curvature of the dorsal petals, midrib asymmetry of the lateral petals, and the ventral tube dilation were associated with the SsCYC genotypes. This finding suggested that SsCYC is globally involved in floral form variation. The CYCLOIDEA2-like homolog genes play a role in determining the development of floral zygomorphy in many flowering plant lineages (Citerne et al., 2010; Hileman, 2014). According to most floral symmetry studies, CYCLOIDEA2-like genes mainly affect the development of the dorsal petals. However, our genotype–phenotype association analysis provided evidence that the phenotypical effects of the SsCYC alleles differ across the dorsal, lateral, and ventral petals. Particularly, the SsCYC genotypes were closely associated with the midrib asymmetry of the lateral petals and the ventral tube dilation (Figure 9 and Table 2). Thus, the SsCYC in S. speciosa may have different effects in the shaping of different petals.
The SsCYC allele C may have different genetic effects on the petal traits. Based on the results presented in Figure 9, the SsCYC allele C seems to have additive genetic effect in the petal outward curvature of the dorsal petals and midrib asymmetry of the lateral petals. Although the LOD score of ventral petal outward curvature does not reach the significant criteria, it is worth to note that the SsCYC allele C has opposite effects in petal outward curvature of the dorsal and ventral petals. Particularly, the SsCYC allele C presents recessive genetic effect in the ventral tube dilation. These evidence might suggest that the SsCYC allele C leads the individuals of genotype C/C to have a specific floral form.
CYC regulates downstream genes, such as RADIALIS (RAD) and DIVARICATA (DIV), for shaping the morphology of the lateral and ventral petals in Antirrhinum majus (Almeida et al., 1997; Galego and Almeida, 2002). CYC and these downstream genes form an exclusive signaling network for establishing floral zygomorphy (Corley et al., 2005; Raimundo et al., 2013). Therefore, the effects of RAD and DIV on flower forms in S. speciosa should be investigated. However, only few studies have reported RAD–DIV interactions across certain Lamiales, Gesneriaceae, and Dipsacales species, and whether this interaction is conserved in S. speciosa remains to be further confirmed (Zhou et al., 2008; Preston et al., 2009; Boyden et al., 2012). Because CYC is epistatic to RAD, the CYC phenotypic changes may be included in the phenotypic effect of these downstream genes on floral symmetry. Thus, our analysis based on CYC captured the major form changes along the floral symmetry transitions. Additional studies validating the association between these genes and petal traits may extend our understanding regarding whether these genes contribute greatly to petal forms changes.
Ventralization of the Dorsal Petals in Peloric Gloxinia
The evolution of floral symmetry has long been an intriguing topic for plant evolutionary-developmental (evo-devo) biologists. In flowering plant phylogeny, floral zygomorphy has been independently derived from actinomorphic ancestors many times (Citerne et al., 2010; Reyes et al., 2016). To elucidate the origin of floral zygomorphy, the concepts of dorsalization and ventralization were proposed for summarizing the petal type transition (Almeida et al., 1997; Cronk, 2006). Our petal form similarity analysis provided morphological evidence that the floral actinomorphy of peloric Gloxinia may result from the ventralization of the dorsal petals. This transition was also strongly associated with the genotype c/c in the SsCYC gene. According to floral symmetry studies in Antirrhinum (Luo et al., 1996; Almeida et al., 1997), the inactivated CYC mutant exhibited ventralization in the dorsal petals. Our finding would suggest that the SsCYC allele c serves as a loss-of-function mutation, causing the reversal of floral actinomorphy from floral zygomorphy in peloric Gloxinia.
Concluding Remarks
In this study, the 3D quantification of the petal form variation was conducted in the F2 plants of S. speciosa. The morphological traits of petal (e.g., petal outward curvature, petal width, left–right asymmetry, petal size, midrib asymmetry, lobe size, and tube dilation) were defined based on the major form variations discovered through GM. Genotype–phenotype association analysis revealed that the petal outward curvature of the dorsal petals, midrib asymmetry of the lateral petals, and the dilation of ventral region of the tube were associated with the SsCYC genotypes. This finding suggested that the SsCYC gene plays different roles in the dorsal, lateral, and ventral petals and contributes to the integration of floral development. The form similarity analysis in petals suggested that the floral form transition between peloric Gloxinia and its wild varieties resulted from the ventralization of the dorsal petals.
Author Contributions
The experiments were designed by Y-FK. The flower material was prepared by H-CH and C-NW. The experiments were performed by C-HL and C-CW. The data were processed, analyzed, and interpreted by C-HL, C-CW, H-CH, and Y-FK. The manuscript was prepared by H-CH, C-NW, C-HL, and Y-FK.
Funding
This research was supported by the National Science Council (Ministry of Science and Technology) of Taiwan grant NSC-101-2313-B-002-050-MY3 to Y-FK and grant NSC-95-2311-B-002-014-MY3 to C-NW.
Conflict of Interest Statement
The authors declare that the research was conducted in the absence of any commercial or financial relationships that could be construed as a potential conflict of interest.
Acknowledgments
We thank the National Laboratory Animal Center for providing the technical support for the μCT experiment. We thank Mr. Chun-Ming Chen at the Dr. Cecilia Koo Botanic Conservation and Environmental Protection Center for providing the F1 S. speciosa plants.
References
Adams, D. C., Rohlf, F. J., and Slice, D. E. (2004). Geometric morphometrics: ten years of progress following the ‘revolution’. Ital. J. Zool. 71, 5–16. doi: 10.1080/11250000409356545
Alexandre, H., Vrignaud, J., Mangin, B., and Joly, S. (2015). Genetic architecture of pollination syndrome transition between hummingbird-specialist and generalist species in the genus Rhytidophyllum (Gesneriaceae). PeerJ 3:e1028. doi: 10.7717/peerj.1028
Almeida, J., Rocheta, M., and Galego, L. (1997). Genetic control of flower shape in Antirrhinum majus. Development 124, 1387–1392.
Boyden, G. S., Donoghue, M. J., and Howarth, D. G. (2012). Duplications and expression of RADIALIS-like genes in dipsacales. Int. J. Plant Sci. 173, 971–983. doi: 10.1093/molbev/msp051
Brock, M. T., Kover, P. X., and Weinig, C. (2012). Natural variation in GA1 associates with floral morphology in Arabidopsis thaliana. New Phytol. 195, 58–70. doi: 10.1111/j.1469-8137.2012.04145.x
Broman, K. W., and Sen, S. (2009). A Guide to QTL Mapping with R/qtl, Vol. 46. New York, NY: Springer, doi: 10.1007/978-0-387-92125-9
Chapman, M. A., Tang, S., Draeger, D., Nambeesan, S., Shaffer, H., Barb, J. G., et al. (2012). Genetic analysis of floral symmetry in Van Gogh’s sunflowers reveals independent recruitment of CYCLOIDEA genes in the Asteraceae. PLoS Genet. 8:e1002628. doi: 10.1371/journal.pgen.1002628
Churchill, G. A., and Doerge, R. W. (1994). Empirical threshold values for quantitative trait mapping. Genetics 138, 963–971.
Citerne, H., and Cronk, Q. C. B. (1999). The origin of the peloric Sinningia. New Plantsman 6, 219–222.
Citerne, H., Jabbour, F., Nadot, S., and Damerval, C. (2010). The evolution of floral symmetry. Adv. Bot. Res. 54, 85–137. doi: 10.1016/S0065-2296(10)54003-5
Citerne, H., Möller, M., and Cronk, Q. C. (2000). Diversity of cycloidea-like genes in Gesneriaceae in relation to floral symmetry. Ann. Bot. 86, 167–176. doi: 10.1006/anbo.2000.1178
Citerne, H. L., Pennington, R. T., and Cronk, Q. C. (2006). An apparent reversal in floral symmetry in the legume Cadia is a homeotic transformation. Proc. Natl. Acad. Sci. U.S.A. 103, 12017–12020. doi: 10.1073/pnas.0600986103
Corley, S. B., Carpenter, R., Copsey, L., and Coen, E. (2005). Floral asymmetry involves an interplay between TCP and MYB transcription factors in Antirrhinum. Proc. Natl. Acad. Sci. U.S.A. 102, 5068–5073. doi: 10.1073/pnas.0501340102
Cronk, Q. C. (2006). Legume flowers bear fruit. Proc. Natl. Acad. Sci. U.S.A. 103, 4801–4802. doi: 10.1073/pnas.0601298103
Ding, B., Mou, F., Sun, W., Chen, S., Peng, F., Bradshaw, H. D., et al. (2016). A dominant-negative actin mutation alters corolla tube width and pollinator visitation in Mimulus lewisii. New Phytol. 213, 1936–1944. doi: 10.1111/nph.14281
Endress, P. K. (2001). Evolution of floral symmetry. Curr. Opin. Plant Biol. 4, 86–91. doi: 10.1016/S1369-5266(00)00140-0
Feng, X., Zhao, Z., Tian, Z., Xu, S., Luo, Y., Cai, Z., et al. (2006). Control of petal shape and floral zygomorphy in Lotus japonicus. Proc. Natl. Acad. Sci. U.S.A. 103, 4970–4975. doi: 10.1073/pnas.0600681103
Fiorani, F., and Schurr, U. (2013). Future scenarios for plant phenotyping. Annu. Rev. Plant Biol. 64, 267–291. doi: 10.1146/annurev-arplant-050312-120137
Fishman, L., Beardsley, P. M., Stathos, A., Williams, C. F., and Hill, J. P. (2015). The genetic architecture of traits associated with the evolution of self-pollination in Mimulus. New Phytol. 205, 907–917. doi: 10.1111/nph.13091
Galego, L., and Almeida, J. (2002). Role of DIVARICATA in the control of dorsoventral asymmetry in Antirrhinum flowers. Genes Dev. 16, 880–891. doi: 10.1101/gad.221002
Hileman, L. C. (2014). Trends in flower symmetry evolution revealed through phylogenetic and developmental genetic advances. Philos. Trans. R. Soc. Lond. B Biol. Sci. 369, 20130348. doi: 10.1098/rstb.2013.0348
Hileman, L. C., Kramer, E. M., and Baum, D. A. (2003). Differential regulation of symmetry genes and the evolution of floral morphologies. Proc. Natl. Acad. Sci. U.S.A. 100, 12814–12819. doi: 10.1073/pnas.1835725100
Hsu, H. C., Chen, C. Y., Lee, T. K., Weng, L. K., Yeh, D. M., Lin, T. T., et al. (2015). Quantitative analysis of floral symmetry and tube dilation in an F2 cross of Sinningia speciosa. Sci. Hortic. 188, 71–77. doi: 10.1016/j.scienta.2015.03.019
Huttenlocher, D. P., Klanderman, G. A., and Rucklidge, W. J. (1993). Comparing images using the Hausdorff distance. IEEE Trans. Pattern Anal. Mach. Intell. 15, 850–863. doi: 10.1109/34.232073
Karahara, I., Yamauchi, D., Uesugi, K., and Mineyuki, Y. (2015). Three-dimensional imaging of plant tissues using X-ray micro-computed tomography. Plant Morphol. 27, 21–26. doi: 10.5685/plmorphol.27.21
Lawing, A. M., and Polly, P. D. (2010). Geometric morphometrics: recent applications to the study of evolution and development. J. Zool. 280, 1–7. doi: 10.1111/j.1469-7998.2009.00620.x
Luo, D., Carpenter, R., Vincent, C., Copsey, L., and Coen, E. (1996). Origin of floral asymmetry in Antirrhinum. Nature 383, 794–799. doi: 10.1038/383794a0
Mitteroecker, P., Gunz, P., Windhager, S., and Schaefer, K. (2013). A brief review of shape, form, and allometry in geometric morphometrics, with applications to human facial morphology. Hystrix 24, 59–66. doi: 10.4404/hystrix-24.1-6369
Nii, K., and Kawabata, S. (2011). Assessment of the association between the three-dimensional shape of the corolla and two-dimensional shapes of petals using fourier descriptors and principal component analysis in Eustoma grandiflorum. J. Jpn. Soc. Hortic. Sci. 80, 200–205. doi: 10.2503/jjshs1.80.200
Preston, J. C., Kost, M. A., and Hileman, L. C. (2009). Conservation and diversification of the symmetry developmental program among close relatives of snapdragon with divergent floral morphologies. New Phytol. 182, 751–762. doi: 10.1111/j.1469-8137.2009.02794.x
Raimundo, J., Sobral, R., Bailey, P., Azevedo, H., Galego, L., Almeida, J., et al. (2013). A subcellular tug of war involving three MYB-like proteins underlies a molecular antagonism in Antirrhinum flower asymmetry. Plant J. 75, 527–538. doi: 10.1111/tpj.12225
Reyes, E., Sauquet, H., and Nadot, S. (2016). Perianth symmetry changed at least 199 times in angiosperm evolution. Taxon 65, 945–964. doi: 10.12705/655.1
Scheffé, H. (1953). A method for judging all contrasts in the analysis of variance. Biometrika 40, 87–110. doi: 10.1093/biomet/40.1-2.87
Stuppy, W. H., Maisano, J. A., Colbert, M. W., Rudall, P. J., and Rowe, T. B. (2003). Three-dimensional analysis of plant structure using high-resolution X-ray computed tomography. Trends Plant Sci. 8, 2–6. doi: 10.1016/S1360-1385(02)00004-3
van der Niet, T., Zollikofer, C. P., de León, M. S. P., Johnson, S. D., and Linder, H. P. (2010). Three-dimensional geometric morphometrics for studying floral shape variation. Trends Plant Sci. 15, 423–426. doi: 10.1016/j.tplants.2010.05.005
Waites, R., and Hudson, A. (2001). The Handlebars gene is required with Phantastica for dorsoventral asymmetry of organs and for stem cell activity in Antirrhinum. Development 128, 1923–1931.
Wang, C. N., Hsu, H. C., Wang, C. C., Lee, T. K., and Kuo, Y. F. (2015). Quantifying floral shape variation in 3D using microcomputed tomography: a case study of a hybrid line between actinomorphic and zygomorphic flowers. Front. Plant Sci. 6:724. doi: 10.3389/fpls.2015.00724
Wessinger, C. A., Hileman, L. C., and Rausher, M. D. (2014). Identification of major quantitative trait loci underlying floral pollination syndrome divergence in Penstemon. Philos. Trans. R. Soc. Lond. B Biol. Sci. 369, 20130349. doi: 10.1098/rstb.2013.0349
Wiley, D. F., Amenta, N., Alcantara, D. A., Ghosh, D., Kil, Y. J., Delson, E., et al. (2005). “Evolutionary morphing,” in Visualization, 2005. VIS 05. IEEE, ed. L. de Floriani (Minneapolis, MN: IEEE), 431–438.
Yang, X., Pang, H. B., Liu, B. L., Qiu, Z. J., Gao, Q., Wei, L., et al. (2012). Evolution of double positive autoregulatory feedback loops in CYCLOIDEA2 clade genes is associated with the origin of floral zygomorphy. Plant Cell 24, 1834–1847. doi: 10.1105/tpc.112.099457
Zaitlin, D. (2012). Intraspecific diversity in Sinningia speciosa (Gesneriaceae: Sinningieae), and possible origins of the cultivated florist’s gloxinia. AoB Plants 2012, ls039. doi: 10.1093/aobpla/pls039
Zelditch, M. L., Swiderski, D. L., and Sheets, H. D. (2012). Geometric Morphometrics for Biologists: A Primer. Cambridge, MA: Academic Press. doi: 10.1016/B978-012778460-1/50001-6
Keywords: CYCLOIDEA, dorsoventral asymmetry, genotype–phenotype association, petal form variation, Sinningia speciosa, three-dimensional (3D) analysis, ventralization
Citation: Hsu H-C, Wang C-N, Liang C-H, Wang C-C and Kuo Y -F (2017) Association between Petal Form Variation and CYC2-like Genotype in a Hybrid Line of Sinningia speciosa. Front. Plant Sci. 8:558. doi: 10.3389/fpls.2017.00558
Received: 10 February 2017; Accepted: 28 March 2017;
Published: 18 April 2017.
Edited by:
Elena M. Kramer, Harvard University, USAReviewed by:
Lachezar A. Nikolov, Max Planck Institute for Plant Breeding Research (MPG), GermanyFlorian Jabbour, National Museum of Natural History, France
Copyright © 2017 Hsu, Wang, Liang, Wang and Kuo. This is an open-access article distributed under the terms of the Creative Commons Attribution License (CC BY). The use, distribution or reproduction in other forums is permitted, provided the original author(s) or licensor are credited and that the original publication in this journal is cited, in accordance with accepted academic practice. No use, distribution or reproduction is permitted which does not comply with these terms.
*Correspondence: Yan-Fu Kuo, eWt1b0BudHUuZWR1LnR3
†These authors have contributed equally to this work.