- Department of Biotechnology and Bioinformatics, Jaypee University of Information Technology, Waknaghat, India
Picroside-II (P-II), an iridoid glycoside, is used as an active ingredient of various commercial herbal formulations available for the treatment of liver ailments. Despite this, the knowledge of P-II biosynthesis remains scarce owing to its negligence in Picrorhiza kurroa shoots which sets constant barrier for function validation experiments. In this study, we utilized natural variation for P-II content in stolon tissues of different P. kurroa accessions and deciphered its metabolic route by integrating metabolomics of intermediates with differential NGS transcriptomes. Upon navigating through high vs. low P-II content accessions (1.3–2.6%), we have established that P-II is biosynthesized via degradation of ferulic acid (FA) to produce vanillic acid (VA) which acts as its immediate biosynthetic precursor. Moreover, the FA treatment in vitro at 150 μM concentration provided further confirmation with 2-fold rise in VA content. Interestingly, the cross-talk between different compartments of P. kurroa, i.e., shoots and stolons, resolved spatial complexity of P-II biosynthesis and consequently speculated the burgeoning necessity to bridge gap between VA and P-II production in P. kurroa shoots. This work thus, offers a forward looking strategy to produce both P-I and P-II in shoot cultures, a step toward providing a sustainable production platform for these medicinal compounds via-à-vis relieving pressure from natural habitat of P. kurroa.
Introduction
Picrorhiza kurroa, locally named as Kutki, is a high altitude (3000–5000 m) medicinal herb distributed in the North-Western Himalayas of India. It is used for the treatment of various ailments due to pharmacological properties like hepatoprotective, antiallergic, antiasthmatic, antioxidant, anticancerous, and immunomodulatory and therefore, consequently provide livelihood and health security to a large segment of high altitude populations (Kumar et al., 2015a, 2017). It is listed among top 15 most traded medicinal herbs in India with respect to revenues generated by traded material (Uniyal et al., 2011). P. kurroa is a self-propagating medicinal herb. It originates as a young bud on stolons which develops to produce mature stolon and subsequently rhizomes with self-governing roots and shoots compartments (Pandit et al., 2013a). Thus, during the collection of mature rhizomes of P. kurroa, all the young stolons and buds are also get uprooted which subsequently disrupt it’s proliferation in natural habitat. The extensive harvesting has thus put this herb in the category of critically endangered medicinal herbs and as a result legal restrictions have been levied on its collection from the wild (Kumar et al., 2017). The scarcity of herbal raw material not only caused economic constraints on local communities but also resulted in adulteration of P. kurroa, thereby affecting quality and efficacy of drugs due to lower levels of picroside-I (P-I) and picroside-II (P-II), the signature bioactive compounds of P. kurroa (Shitiz et al., 2013).
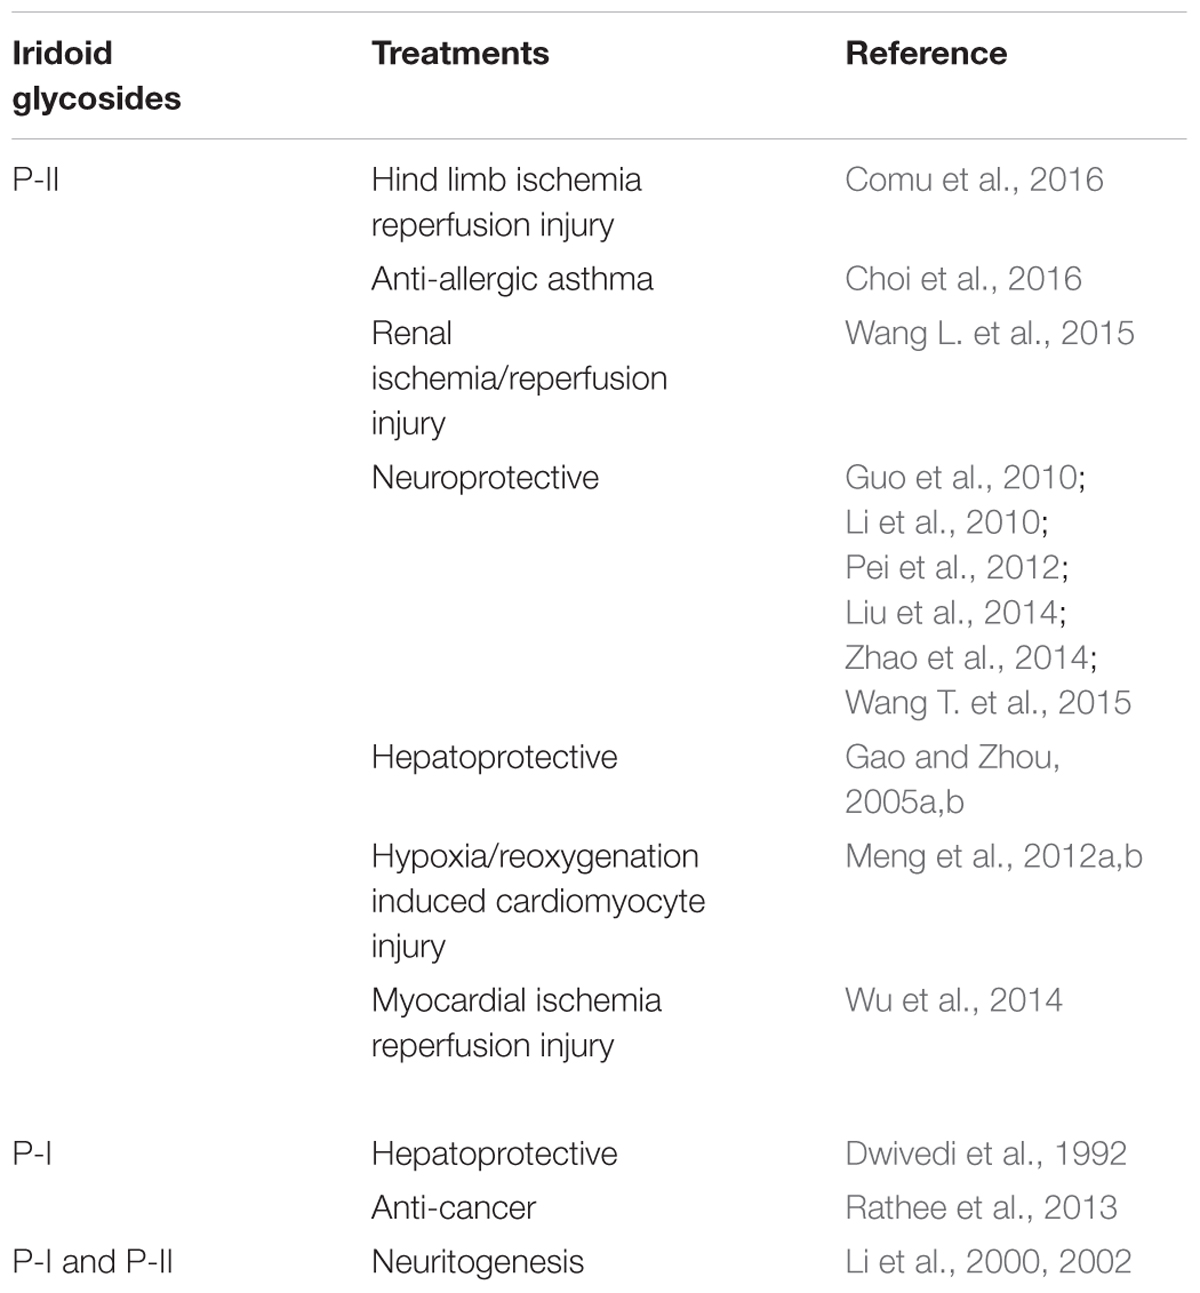
The picrosides, P-I and P-II, possess vast therapeutic potential and their bio-efficacy has also been tested via both in vitro as well as in vivo studies (Kumar et al., 2017, Table 1). Moreover, the herbal drug formulations required both P-I and P-II in a ratio of 1:1.5 (Kumar et al., 2017). Therefore, to provide a constant supply of raw material without sacrificing the levels of major chemical constituents, mass propagation of quality plant material is a pressing need. Mass propagation of P. kurroa shoots through in vitro culture has been optimized but with lower yields of P-I (Sood and Chauhan, 2010). Moreover, the content of P-I is also ∼5-fold lesser in P. kurroa shoots grown in vitro compared to those available in natural habitats (Sood and Chauhan, 2010; Shitiz et al., 2015; Sharma et al., 2016).
In P. kurroa, it has been hypothesized that the P-I and P-II are biosynthesized in a tissue specific manner, i.e., shoots synthesize P-I, roots contained only P-II and stolons/rhizomes produce both P-I and P-II (Pandit et al., 2013a). The shoots of P. kurroa have been established as biosynthetic tissues of only P-I as P-II was not detected in P. kurroa shoots and the P-I content also showed progressive increase in different growth and developmental stages of P. kurroa shoots (Sood and Chauhan, 2010; Pandit et al., 2013a; Kumar et al., 2015b). In contrast, both P-I and P-II contents have been detected and showed progressive increase in different growth and developmental stages of P. kurroa stolons/rhizomes. In previous reports, we had suggested that rhizomes are a storage tissue for P-I and P-II not the biosynthetic tissue, whereas P-I was postulated as biosynthesized in shoots and possibly transported to rhizomes (Sood and Chauhan, 2010; Pandit et al., 2013a). The root tissues of P. kurroa contained only P-II which was detected at the later stage compared to rhizome and thus, it was hypothesized that P-II might be transported from rhizomes to roots (Pandit et al., 2013a). Therefore, it would be of paramount importance if P-II can be produced in shoots, which will not only relieve pressure from natural habitat of P. kurroa for uprooting rhizomes/roots but will also provide a continuous supply of herbal raw material through shoot cultures with desired amounts of P-I and P-II. However, lack of knowledge on P-II biosynthesis has precluded implementing any genetic intervention strategy toward enriching P-II in P. kurroa shoot cultures.
In previous studies, maximum efforts have been focused on P-I production in P. kurroa as P-II was not produced under in vitro shoot cultures. The biosynthetic pathways for P-I and P-II were, therefore, proposed including; mevalonate (MVA), non-mevalonate (MEP), shikimate/phenylpropanoid, and iridoid pathways so as to pinpoint key genetic intervention points to maximize picrosides content using metabolic engineering approaches (Kumar et al., 2013; Shitiz et al., 2015). It has been hypothesized that the catalpol (CAT) backbone derived from iridoid pathway undergoes esterification reactions with trans-cinnamic acid (CA) and vanillic acid (VA) to produce P-I and P-II, respectively (Kumar et al., 2013). The metabolic route of P-I biosynthesis has been ascertained through precursor feeding and enzyme inhibitor studies along with the assortment of key candidate genes through expression analysis using qRT-PCR vis-à-vis P-I content (Pandit et al., 2013b; Kumar et al., 2015b, 2016b,c; Shitiz et al., 2015). However, the complexity of P-II biosynthesis is still unresolved as both protocatechuate and ferulic acid (FA); the metabolites of shikimate/phenylpropanoid pathway, are plausible to produce VA, the immediate precursor of P-II (Figure 1) (Kawoosa et al., 2010; Gahlan et al., 2012; Kumar et al., 2013). In this study, we have selected mature stolons to elucidate the mechanism controlling P-II biosynthesis in P. kurroa.
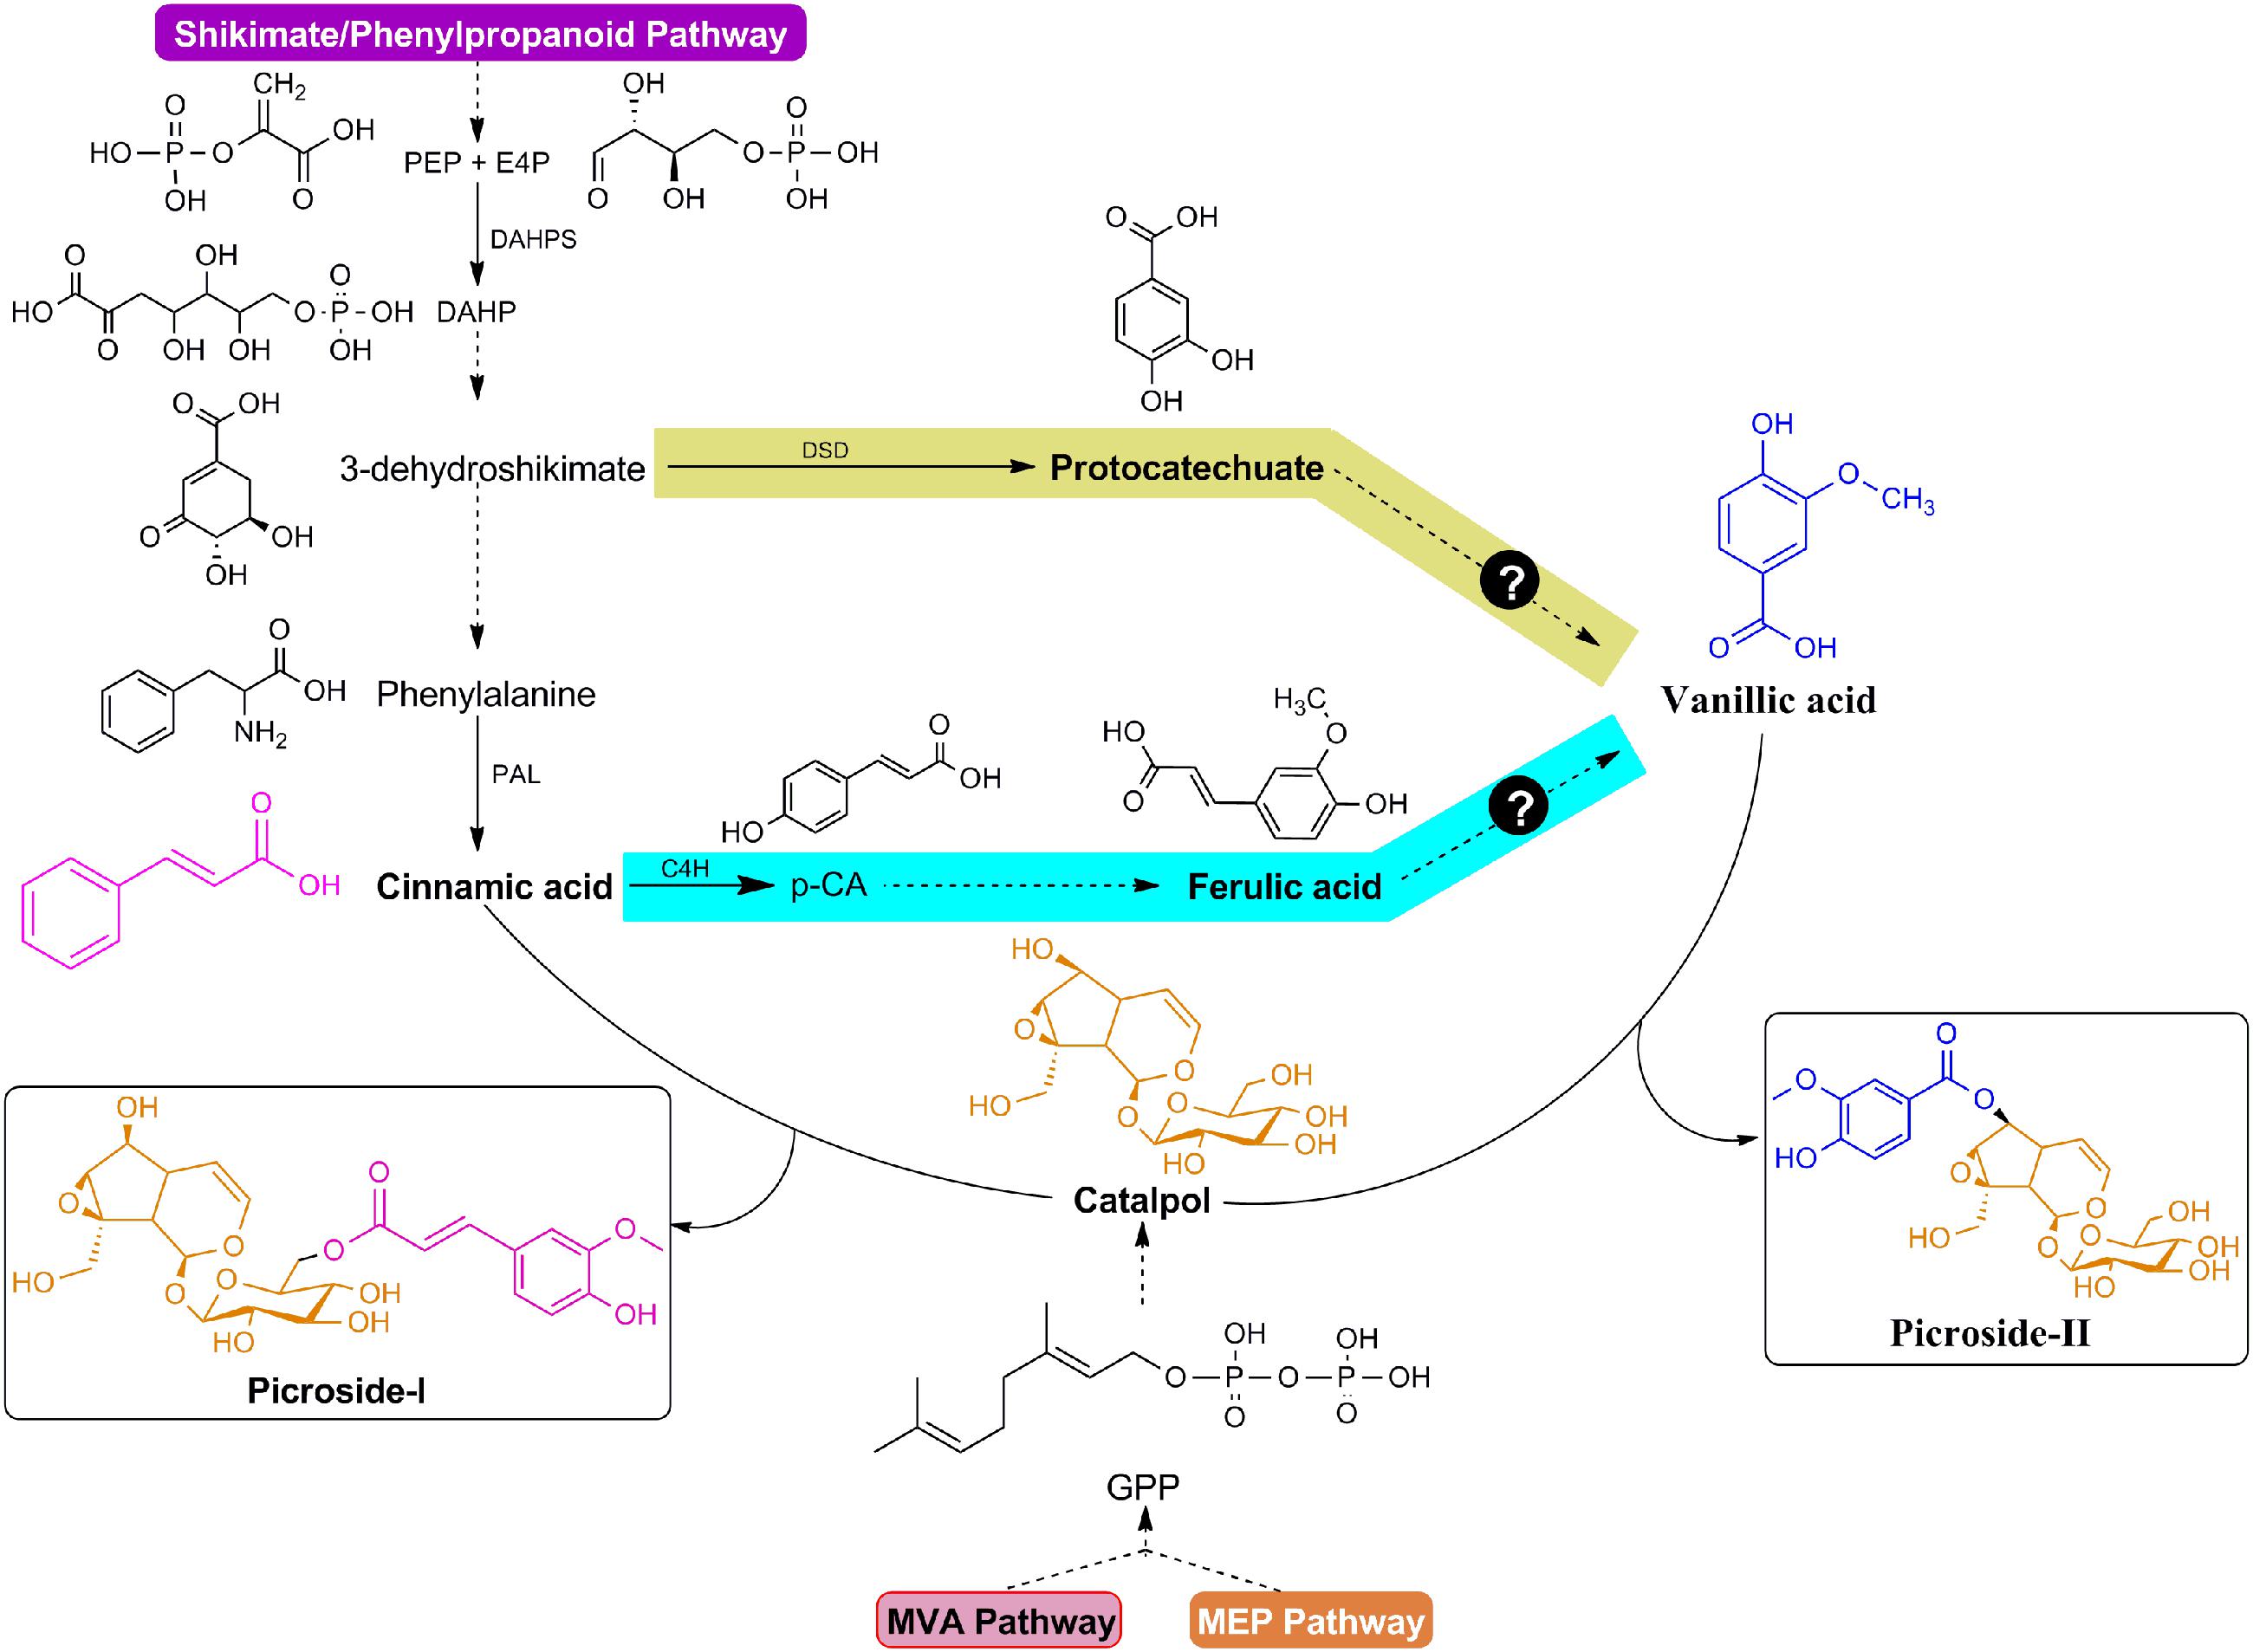
FIGURE 1. Modular design of P-I and P-II biosynthetic pathways. The structures of P-I and P-II linked to cinnamic acid/vanillic acid (purple/blue color) moieties and catalpol (orange color). Question marks indicate plausible routes for vanillic acid production.
To elucidate the metabolic fluxes, radioactive/stable isotopes labeled flux analysis has been used in various plant species (Ishihara et al., 2015; Xiong et al., 2015) but concurrently accompanied with cost intensive and time consuming experiments (Stephanopoulos, 2012). Therefore, in this study, we have utilized natural variation in P-II content among different accessions (genotypes) of P. kurroa so as to guide us in discerning the route and flux of intermediates leading to the biosynthesis of P-II. Moreover, the integration of metabolites contents data with the corresponding transcriptomes would enable us to understand the flux of intermediates vis-à-vis gene transcripts controlling P-II biosynthesis in P. kurroa.
Materials and Methods
Collection of Plant Material
A total of 10 accessions of 1 year old P. kurroa were collected from different locations of North-Western Himalaya, India. The details of accessions are provided in Supplementary Table 1. All the accessions were kept in the greenhouse of Jaypee University of Information Technology, Waknaghat, Himachal Pradesh, India (31°0′58.55″ N and 77°4′12.63″ E; 1700 m, altitude). The plants were washed with tap water and segregated into shoots, mature stolons, and roots. The shoots were coded with PKS, while mature stolons were labeled as PKST. In contrast, roots were labeled as PKR. We have used PKS and PKST tissues in this study. All tissue samples were kept at -80°C for further analyses.
Extraction and Quantification of P-I and P-II Contents
The P-I and P-II were extracted in triplicates from shoots and stolons tissues of all 10 P. kurroa accessions as per the protocol described in Kumar et al. (2016c). The quantification of P-I and P-II in all the samples was performed in triplicates by using HPLC method as described in Pandit et al. (2013a).
Extraction and Quantification of Intermediate Metabolites
Four accessions with variation for P-I content in shoots (PKS-1, PKS-4, PKS-5, and PKS-21) and with variation for P-I and P-II contents in stolons (PKST-3, PKST-5, PKST-16, and PKST-18) were subjected to the extraction of intermediate metabolites viz. CA, p-coumaric acid (p-CA), FA, protocatechuic acid (PA), and VA. The extraction was performed as per the method described in Mattila and Kumpulainen (2002) with some modifications. The samples (200 mg) were weighed and homogenized with liquid N2 in prechilled pestle and mortar. To each homogenized sample, 7 mL of combination of methanol [containing 2 g/L butylated hydroxytoluene (BHT)] and 10% acetic acid in a ratio of 85:15 was added and vortexed for 10 min at room temperature (25°C). The volume of extracts was made up to 10 mL with distilled water and mixed properly. Each extract was then transferred to 100 mL reagent bottle and suspended with 12 mL of distilled water and 5 mL 10 M sodium hydroxide. The contents of the extracts were then bubbled with N2 gas, sealed and kept on a magnetic stirrer for overnight at room temperature (25°C). On following day, the pH of extracts was adjusted to 2 with concentrated hydrochloric acid. The metabolites released in the solution were then extracted three times with 15 mL of a mixture of cold diethyl ether and ethyl acetate in a ratio of 1:1 by shaking and centrifuging for 10 min at 7000 rpm and 4°C temperature condition. The diethyl ether/ethyl acetate layers thus obtained, were evaporated to dryness and reconstituted in 1.5 mL of absolute methanol. The obtained samples were filtered through 0.22 μm filter (Millipore) and subjected to quantification of selected metabolites by using HPLC as per the method described in Nour et al. (2013). The selected compounds viz. CA, p-CA, and FA were detected at a wavelength of 290 ± 4 nm, 310 ± 4 nm, and 330 ± 4 nm, respectively while PA and VA were detected at an absorbance of 260 ± 4 nm. All the selected compounds were identified upon comparison of retention time and UV spectra with standards (Sigma–Aldrich, USA). The extraction and quantification experiments were performed in triplicates.
Feeding of In vitro Grown P. kurroa Shoots with Different Precursors
The solutions of different precursors including, p-CA, PA, and FA (Sigma-Aldrich, USA) were prepared as neutral aqueous stocks at 150 μM concentrations. Conversely, 150 μM aqueous solution of VA (Sigma-Aldrich, USA) was mixed with 70 μM CAT (Sigma-Aldrich, USA) and used for the feeding of in vitro grown P. kurroa shoots. These concentrations were selected based on their effects on P-I production in P. kurroa when applied alone and in combination under tissue culture conditions (Kumar et al., 2016b). Following this, the solutions of different precursors were added into the culture tubes containing optimized MS medium [containing 3 mg/L indole-3-butyric acid (IBA) and 1 mg/L kinetin (KN)] after filter sterilization through 0.22 μm syringe filter (Millipore) (Sharma et al., 2015). In each culture flask, the shoot explant of P. kurroa grown at 25 ± 2°C (having negligible P-I content) was aseptically transferred and all the cultures were kept in a plant tissue culture chamber maintained at 15 ± 2°C (temperature favors P-I production) (Sood and Chauhan, 2010). The P. kurroa shoots without precursor’s treatment were referred to as controls. The experiment was performed in triplicates. The shoot samples were collected after 30 days and immediately stored at -80°C for further analyses. All the samples were subjected to the extraction and quantification of CA, p-CA, FA, VA, P-I, and P-II metabolites in triplicates as per the protocol mentioned above.
Culturing of P. kurroa Shoots Grown In vitro with Different Concentrations of VA+CAT Mixture and P-II
The different concentrations of VA+CAT mixture viz. 25 μM each VA+CAT, 70 μM each VA+CAT, 70 μM VA with 150 μM CAT, 150 μM each VA+CAT and 230 μM each VA+CAT, were also tested after determination of P-II content in shoot cultures fed with different precursors. Moreover, P-II at a concentration of 25 μM was also introduced separately in the MS medium to check the accumulation of P-II in P. kurroa shoots. The culturing of P. kurroa shoots was performed according to the same protocol as mentioned above. The untreated shoots were labeled as controls. The experiment was performed in triplicates. The shoot samples were harvested after 30 days and immediately stored at -80°C for the analysis of P-I and P-II contents. The analysis of picrosides was carried out in triplicates.
Treatment of In vitro Grown P. kurroa Shoots with VA+CAT Mixture and P-II under Liquid Culture Conditions
The solutions of VA+CAT mixture and P-II were prepared at concentrations of 70 and 25 μM, respectively to check the intake of precursors by the plant. These solutions were then incorporated into the culture tubes having optimized liquid MS medium (containing 3 mg/L IBA and 1 mg/L KN) after filter sterilization through 0.22 μm syringe filter (Millipore). The culturing of P. kurroa shoots was performed under the same conditions as mentioned above. The untreated shoots were labeled as controls. The experiment was performed in triplicates. The shoot samples were harvested after 30 days and immediately stored at -80°C for the further analyses. The analysis of VA and P-II contents was performed in both shoots and liquid media left after the harvesting and carried out in triplicates.
Isolation of Total RNA, Preparation of Libraries, and Sequencing for RNA-seq Analysis
Total RNA was isolated from four accessions of shoots (PKS-1, PKS-4, PKS-5, and PKS-21) and stolons (PKST-3, PKST-5, PKST-16, and PKST-18) by using total RNA isolation kit (RaFlexTM) according to the instructions mentioned in the user manual. The construction of libraries and their sequencing for transcriptome analysis was performed as per the protocol described in Pal et al. (2015).
Transcriptome De novo Assembly and Validation
For de novo assembly, we chose go with De brijn graph based Trinity Assembler based on the criteria of; (a) default K-mer, (b) less memory foot print, (c) optimized for Illumina paired end data, (d) reproducibility, and (e) configurable for all computing capacities (Henschel et al., 2012). To pool assembly, 50 core threads of processing with 2.4 GHz speed and a maximum Heap Space of 50 GB was allotted. Nevertheless, de novo transcriptome assemblers are capable of producing in fragmented/miss-assembly, the validation of assembled transcriptome was carried out by mapping back the high quality (HQ) filtered reads to the ESTs. The HQ filtered reads from each library thus obtained were mapped to the assembled transcriptome by using Bowtie software. This analysis generated.bam (Binary Sequence Alignment/Map) files which were processed through bedtools and samtools for quantitation (read count estimation) of each transcript in a library and also to calculate the total coverage and average depth of the transcriptome in each library (Li et al., 2009; Quinlan and Hall, 2010).
Transcripts Annotation
The annotation and statistical analysis of each transcript was performed by homology based method against NCBI nrdb protein database using Blast2GO software through Blastx module (Conesa et al., 2005). The parameters used for this analysis were; (a) e-Value b = 10-e4, (b) Similarity ≥35%, (c) Annotation cutoff ≥55, (d) GO weight cutoff ≥5. Moreover, domain level annotation was also performed by using the Online InterProScan tool RunIprScan-1.1.01 (Henschel et al., 2012).
Normalization of Transcripts and their Expression Profiling
The benefit of using NGS based transcriptome profiling is to recognize sample/condition specific expressed transcripts which was not easy with earlier hybridization methods. Transcripts with a read count of ≥10 in any one of the libraries were considered to be expressed. To perform normalization and expression profiling, a sub bam file was created from the master bam file using RSEM software (Li and Dewey, 2011). In RSEM, the default parameters/commands were used to normalize each library which provides an output with expected normalized read count, TPM (tags per million) and FPKM (fragments per kilobase per million). Log to the base 2 of FPKM was considered as absolute expression or Delta CT equivalent value.
Transcripts Mapping, Differentially Expressed Gene (DEG), and Correlation Analysis
The annotated transcripts obtained from BLAST2GO were mapped to Kyoto Encyclopedia of Genes and Genomes (KEGG) (Kanehisa et al., 2016). Transcripts which were involved in secondary metabolic pathways were shortlisted for DEG analysis using sequence similarity threshold of >98%. Only those transcripts were selected and used for the analyses which were present in all the eight different samples, i.e., four accessions of each shoots and stolons. Hierarchical clustering of selected DEGs were performed using heatmaply, gplot2, plotly packages in R. Further, the correlation analysis was carried out by using R-package through “Corrgram” function (Friendly, 2002).
Preparation of Complementary DNA (cDNA) and Expression Analysis of Selected Genes through Quantitative Real Time Polymerase Chain Reaction (qRT-PCR)
The cDNA of four different shoots (PKS-1, PKS-4, PKS-5, and PKS-21) and stolons accessions (PKST-3, PKST-5, PKST-16, and PKST-18) was synthesized from 5 μg of total RNA by using Verso cDNA synthesis kit (Thermo Scientific, USA) according to the manufacturer’s instructions. The cDNA of each sample thus obtained was quantified by using ND-2000 UV spectrophotometer and diluted with nuclease free water to obtain 100 ng concentration. For gene expression analysis, six genes were selected and subjected to qRT-PCR analysis. The primers of the selected genes were designed from transcriptomic sequences of P. kurroa through Primer3 software and the details with annealing temperature are provided in Supplementary Table 2. The gene expression analysis was performed in triplicates according to the method described in Kumar et al. (2015b). The housekeeping gene, 26S was used as reference in this study for normalization of gene expression.
Statistical Analyses
The one and two-way analysis of variance (ANNOVA) followed by a Bonferroni test were performed from data in triplicates (mean ± SD) using GraphPad prism software version 6.0. To examine the correlations between gene expression profiles obtained from RNA-seq and qRT-pCR, log2 fold change values were estimated among different shoots and stolons accessions. The scatterplots were then created by comparing log2 fold change values determined by RNA-seq and qRT-PCR using GraphPad prism software version 6.0. The correlations were represented in terms of coefficient of determination, i.e., R2.
Results
Picrosides (P-I and P-II) Content in Different Accessions of P. kurroa
A total of 10 different P. kurroa accessions were analyzed for P-I and P-II contents separately in shoots and stolons compartments. The analysis of shoot tissues of different P. kurroa accessions revealed significant variations in P-I content (Figure 2A). The maximum level of P-I was observed in PKS-1, i.e., 2.38% which was significantly higher (p < 0.0001) as compared to PKS-5 (1.18%), PKS-2 (1.07%), PKS-3 (1%), PKS-26 (0.9%), PKS-16 (0.68%), PKS-18 (0.63%), PKS-14 (0.63%), PKS-4 (0.49%), and PKS-21 (0.13%), respectively (Figure 2A). In contrast, P-II was not detected in shoots of P. kurroa plants. It was evident from the results that PKS-1 and PKS-5 showed maximum P-I content and thus, referred to as high P-I content accessions of P. kurroa. In contrast, PKS-4 and PKS-21 showed minimum P-I content and thus, referred to as low P-I content accessions of P. kurroa.
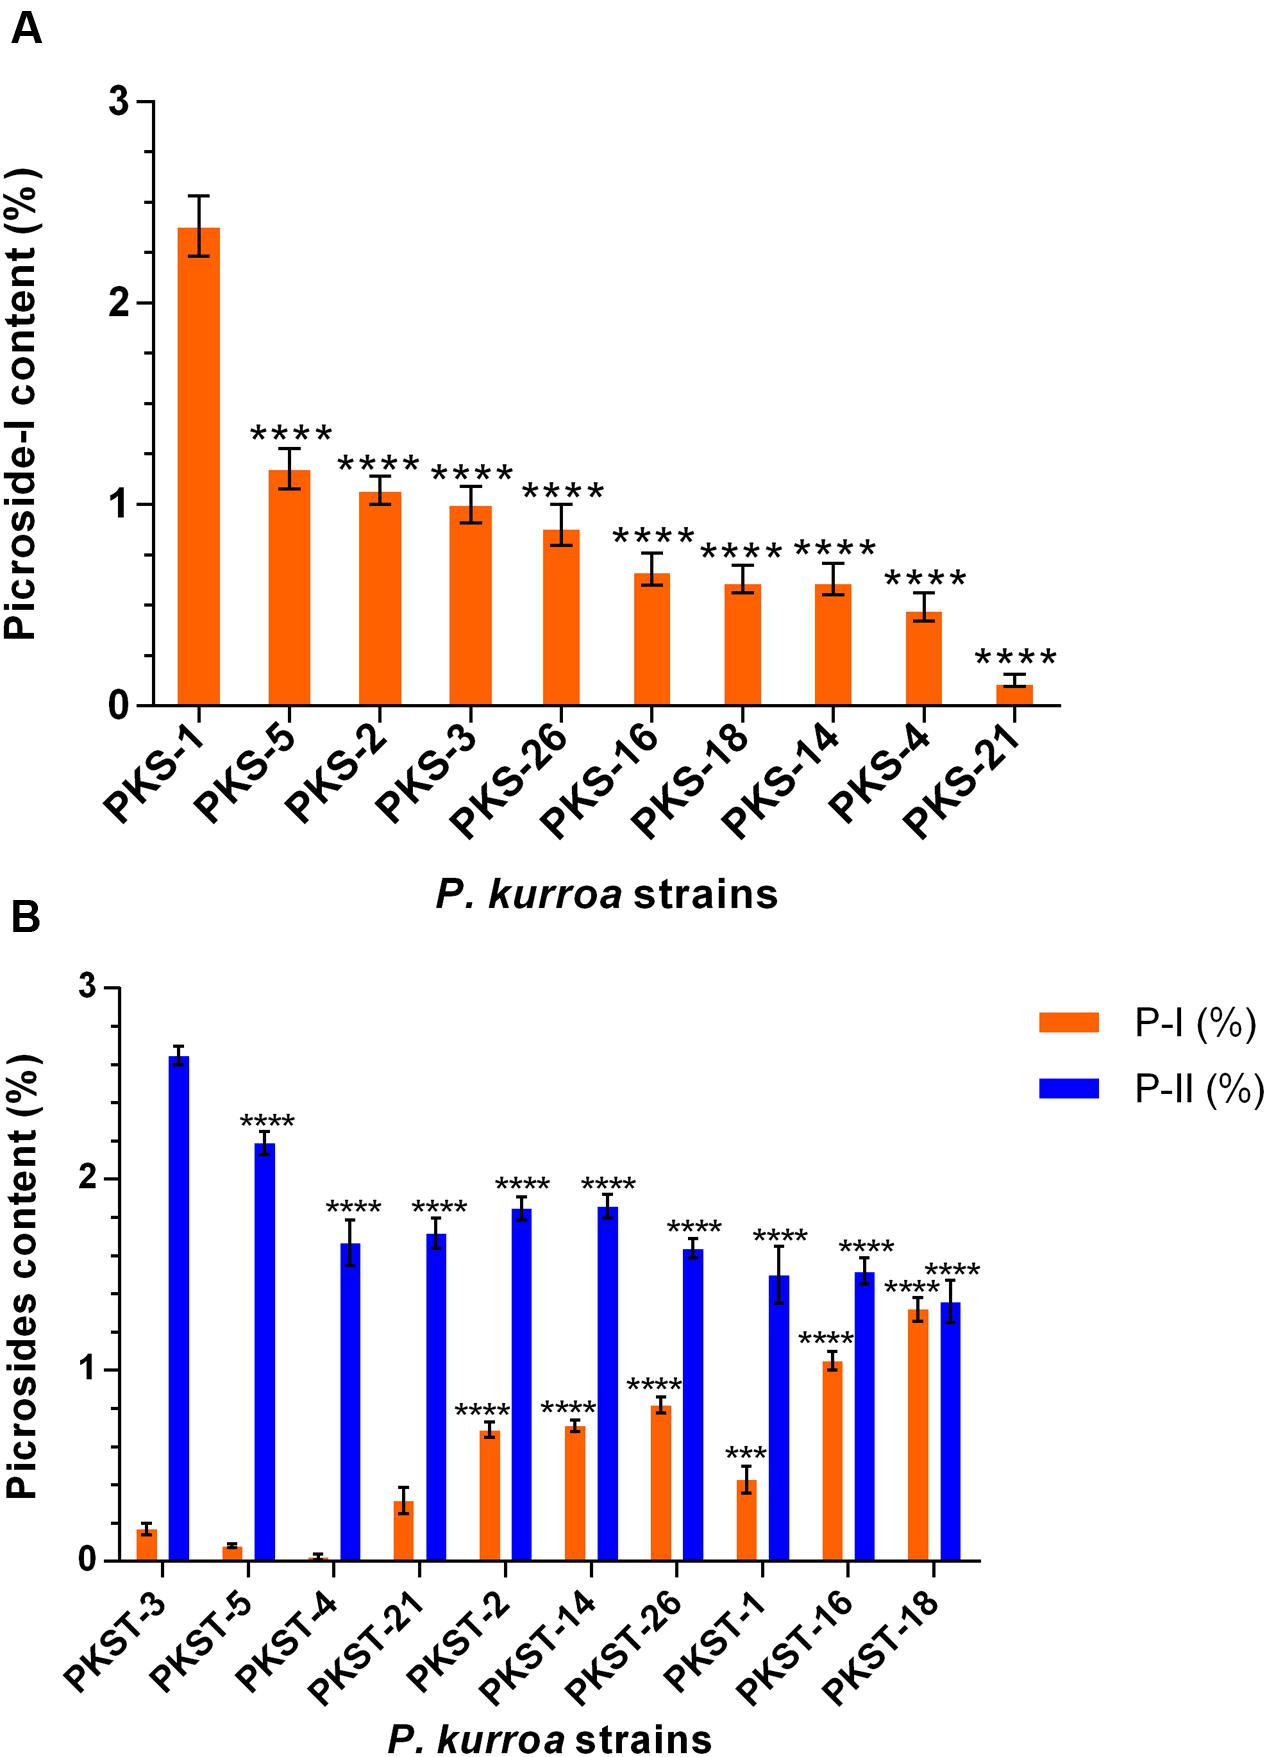
FIGURE 2. Determination of picrosides contents in different tissues of Picrorhiza kurroa accessions; (A) shoots and (B) stolons. The data presented as means ± SD (n = 3). Significance was evaluated within picrosides contents between different accessions (∗∗∗p < 0.001, ∗∗∗∗p < 0.0001).
Upon analysis of stolons portions of different P. kurroa accessions, significant modulations in both P-I and P-II contents were observed (Figure 2B). The maximum P-II content, i.e., 2.65% was observed in PKST-3 which showed significant progressive decrease leading to PKST-18 with 1.36% P-II content (p < 0.0001) (Figure 2B). In contrast, the minimum P-I content of 0.08% was detected in PKST-5 followed by non-significant increase in PKST-3 stolon (0.17%). Further, the stolons of PKST-1, PKST-2, PKST-14, PKST-26, PKST-16, and PKST-18 showed significant progressive increase with 0.43% (p < 0.001), 0.69% (p < 0.0001), 0.71% (p < 0.0001), 0.82% (p < 0.0001), 1.05% (p < 0.0001), and 1.32% (p < 0.0001), respectively P-I content compared to PKST-5 (Figure 2B). These observations implies that PKST-3 and PKST-5 stolons contained maximum P-II content but minimum P-I content and thus, referred to as high P-II content accessions of P. kurroa. Conversely, PKST-16 and PKST-18 stolons contained minimum P-II but maximum P-I content and thus, referred to as low P-II content accessions of P. kurroa.
Alterations in the Levels of Intermediate Metabolites of Shikimate/Phenylpropanoid Pathway among Selected P. kurroa Accessions
The shoots and stolons of P. kurroa accessions selected for high and low P-I/P-II contents were examined for the levels of intermediate metabolites in shikimate/phenylpropanoid pathway viz. CA, p-CA, FA, PA, and VA (Figures 3A–F). The investigation of shoot tissues revealed that PKS-1 contained maximum CA content of 0.5% which showed significant progressive decrease in PKS-5, PKS-4, and PKS-21 with 1.5- (p < 0.0001), 2.5- (p < 0.0001), and 5.3-fold (p < 0.0001), respectively (Figure 3E). These results are akin to P-I accumulation patterns in selected shoot tissues of P. kurroa. In contrast, the lowest p-CA content (0.04%) was observed in PKS-1 and showed significant increase in PKS-5 and PKS-21 with 2.1- (p < 0.05) and 5.9-fold (p < 0.0001), respectively. The p-CA content of PKS-4 showed non-significant modulation compared to PKS-1 shoots (Figure 3E). The examination of FA content in shoot tissues revealed 2-fold (p < 0.05) significant elevation in PKS-21 compared to PKS-1, PKS-5, and PKS-4 accessions (Figure 3E). Moreover, the VA content showed non-significant modulation among all the four selected shoots of P. kurroa. The PA content was not detected in the selected shoots of P. kurroa. It was evident from these results that CA is positively correlated with P-I content in shoots with Pearson correlation coefficient (PCC) of 0.99 (Figure 3F).
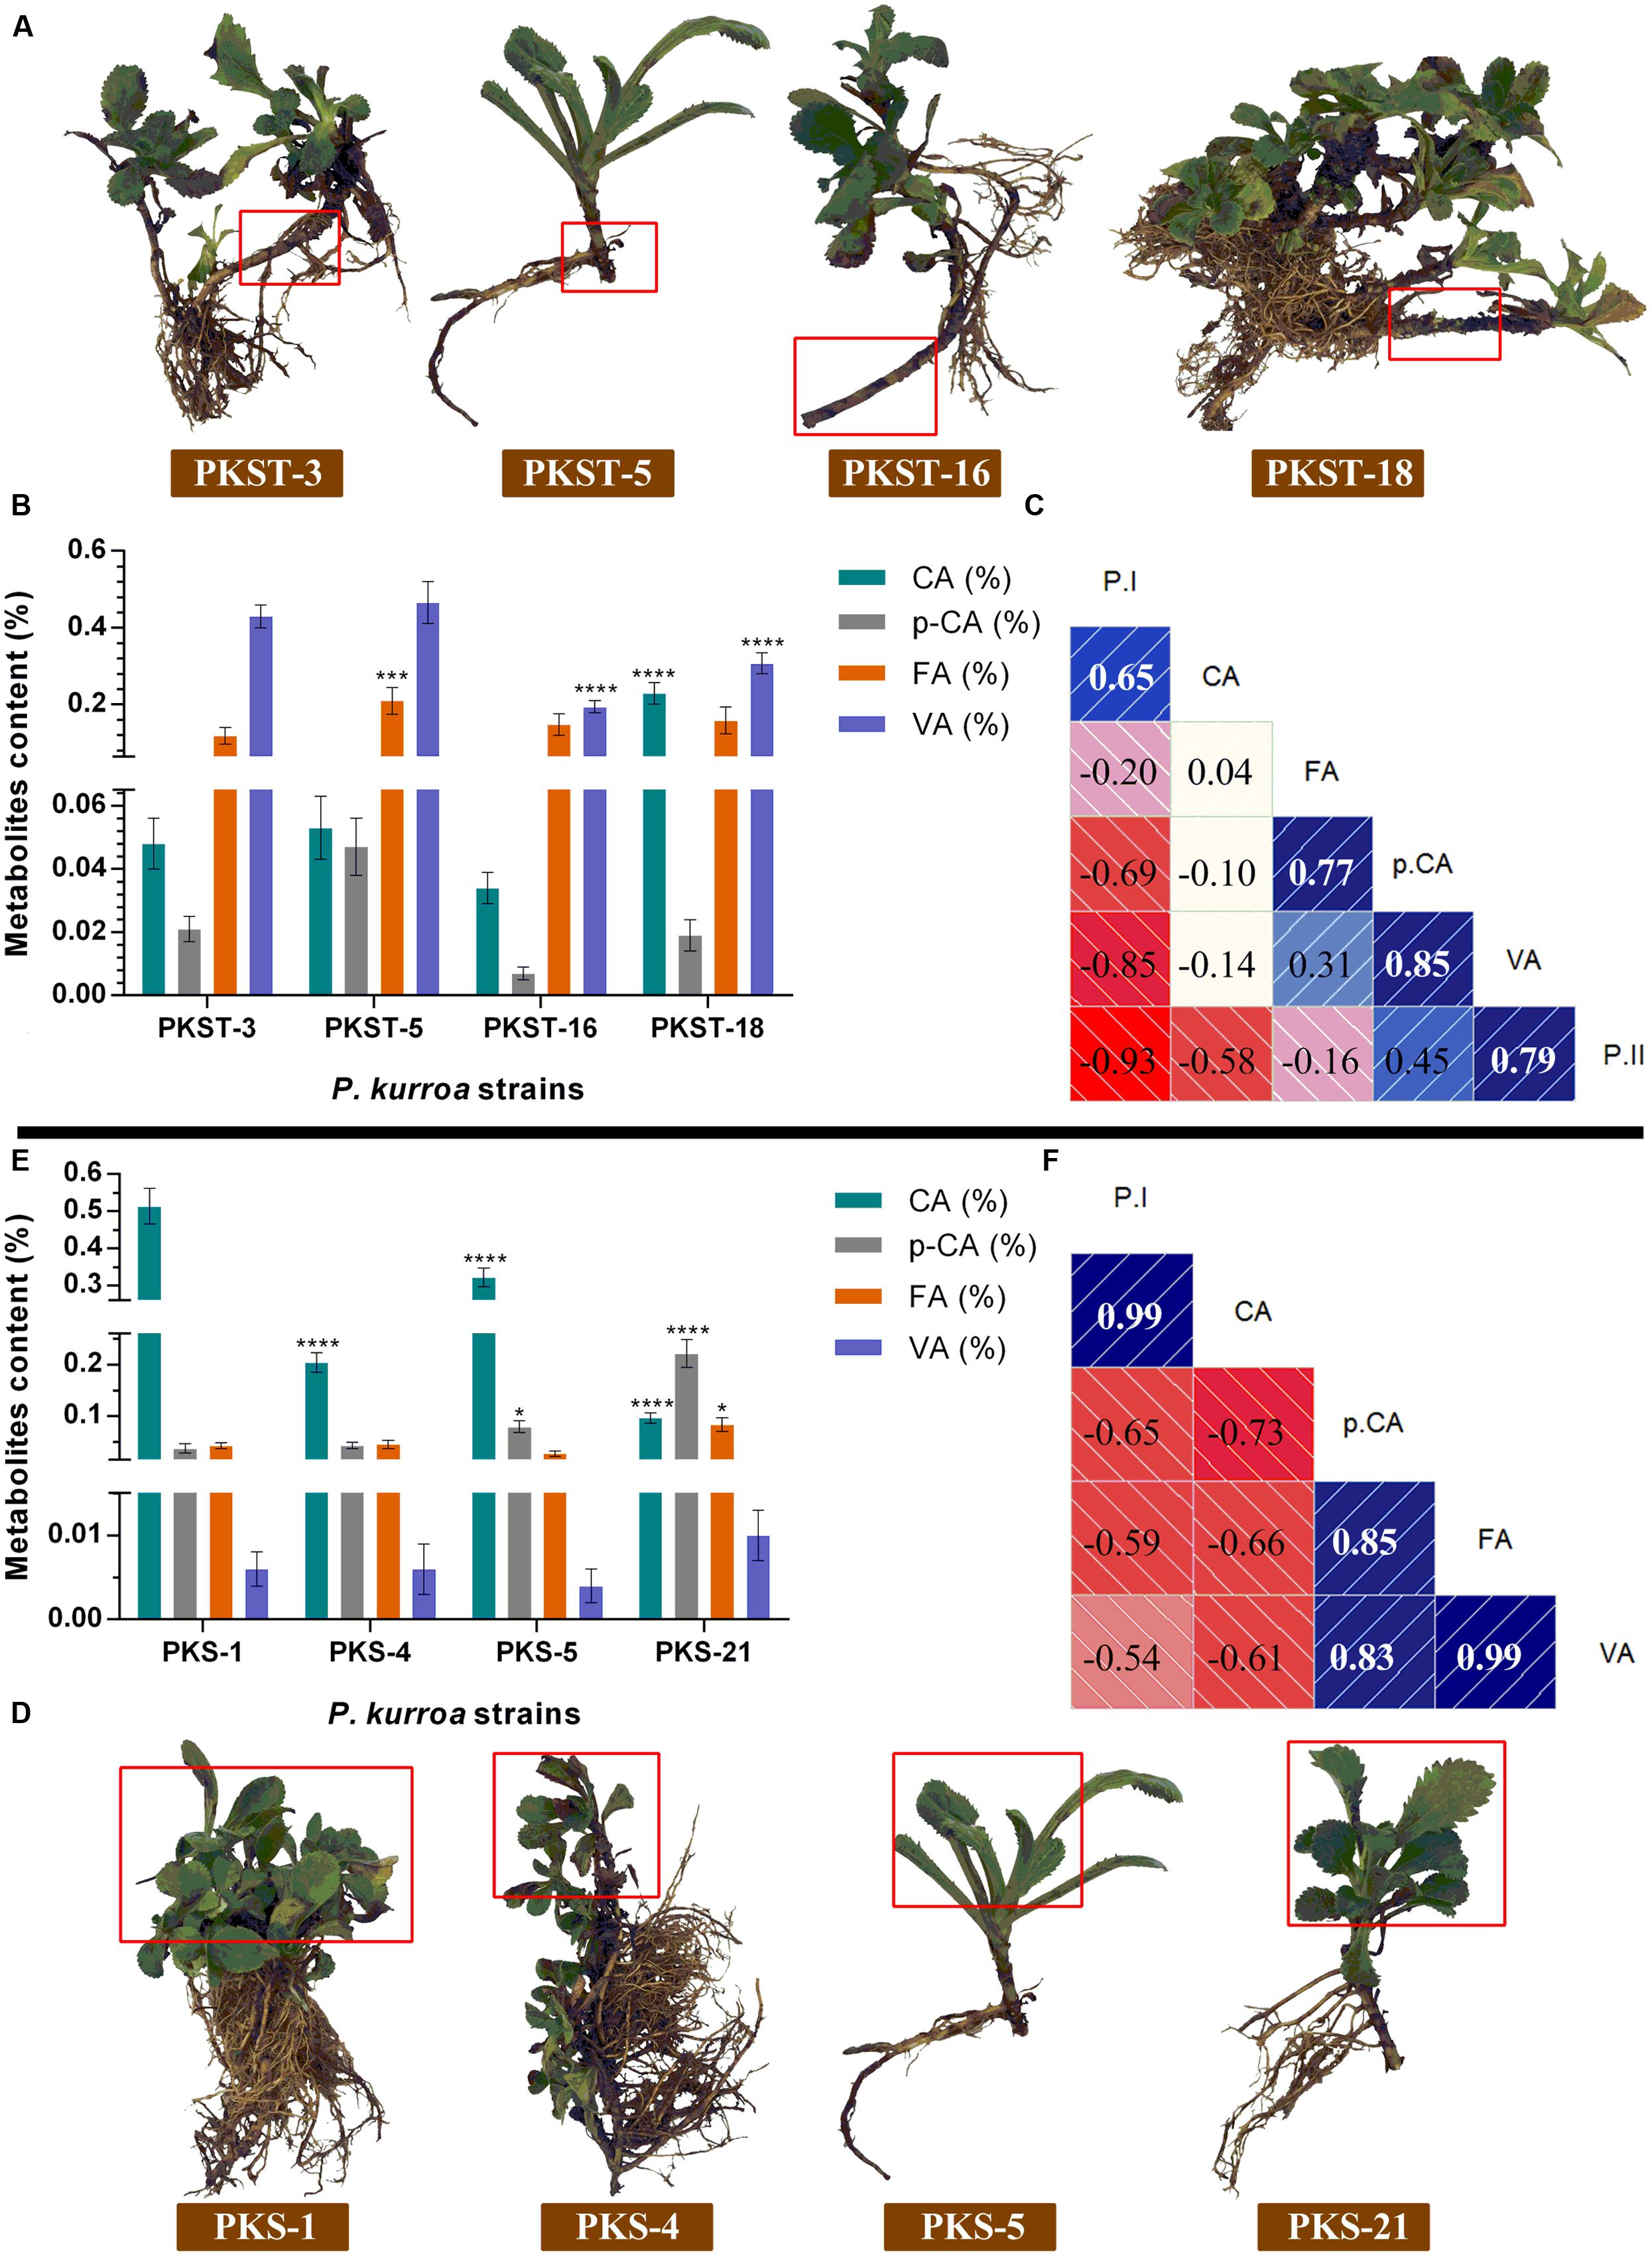
FIGURE 3. Comparative analysis of intermediate metabolites contents among different tissues of P. kurroa accessions; (A,D) different P. kurroa accessions selected for stolons and shoots, respectively; (B,E) variations in metabolites contents between stolons and shoots, respectively and; (C,F) correlogram showing correlations between tested metabolites and picrosides contents among stolons and shoots, respectively. Correlations are presented in the form of graphs filled in proportion to the Pearson’s correlation coefficient values. Clock-wise occupied with blue color depict positive correlations while anti-clockwise graphs filled with red color indicate negative correlations. The data presented as means ± SD (n = 3). Significance was evaluated within metabolites contents between different accessions (∗p < 0.05, ∗∗∗p < 0.001, ∗∗∗∗p < 0.0001).
The investigation of four different stolons revealed that PKST-18 contained maximum CA content of 0.2% which showed significant increase with 4.7-fold (p < 0.0001) compared to PKST-3 (Figure 3B). The CA content of PKST-3 showed non-significant modulation with PKST-5 and PKST-16 stolons. The analysis of p-CA content showed non-significant alterations in all the four selected stolons of P. kurroa. Upon examination of FA content, we observed highest level in PKST-5 (0.2%) which exhibited 1.7-fold (p < 0.001) significant increase compared to PKST-3, PKST-16, and PKST-18 (Figure 3B). In contrast, highest VA content was observed in PKST-3 and PKST-5 followed by significant decrease in PKST-16 and PKST-18 with 2.2- (p < 0.0001) and 1.3-fold (p < 0.0001), respectively (Figure 3B). Moreover, PA content was not observed in the stolons of P. kurroa. These observations infer positive correlations of p-CA and VA with P-II through PCC of 0.45 and 0.79, respectively (Figure 3C).
Effect of Treatment with Different Precursors on Picrosides and Intermediate Metabolites Contents
The in vitro grown shoots of P. kurroa were treated with 150 μM concentration of PA, FA, and p-CA along with combination of 150 μM VA and 70 μM CAT to observe their effects on the CA, p-CA, FA, VA, P-I, and P-II contents (Figures 4A–C). The analysis of CA content revealed 2.2- (p < 0.0001) and 1.7-fold (p < 0.0001) significant increase in shoots treated with FA and p-CA, respectively, whereas 1.3-fold (p < 0.001) significant decrease was observed in VA + CAT fed shoots compared to P. kurroa shoots without treatment, i.e., control shoots (Figure 4A). The p-CA content, on the other hand showed non-significant modulations in all the fed shoots compared to control. The investigation of FA content revealed significant increase with 2.9-fold (p < 0.0001) in shoots treated with FA compared to untreated shoots. In contrast, 1.9- (p < 0.05) and 2-fold (p < 0.01) significant elevation in VA content was observed in shoots fed with FA and VA + CAT, respectively compared to control (Figure 4A). Moreover, the examination of P-I content revealed 1.8-fold (p < 0.0001) significant enhancement in shoots fed with p-CA compared to control. Conversely, small level of P-II, i.e., 0.04% was only detected in P. kurroa shoots treated with VA + CAT (Figure 4A). Thus, it was evident from these results that VA and P-II shared high positive correlation with PCC of 0.64 and the former was also positively correlated with CA and FA with PCC of 0.19 and 0.22, respectively (Figure 4C).
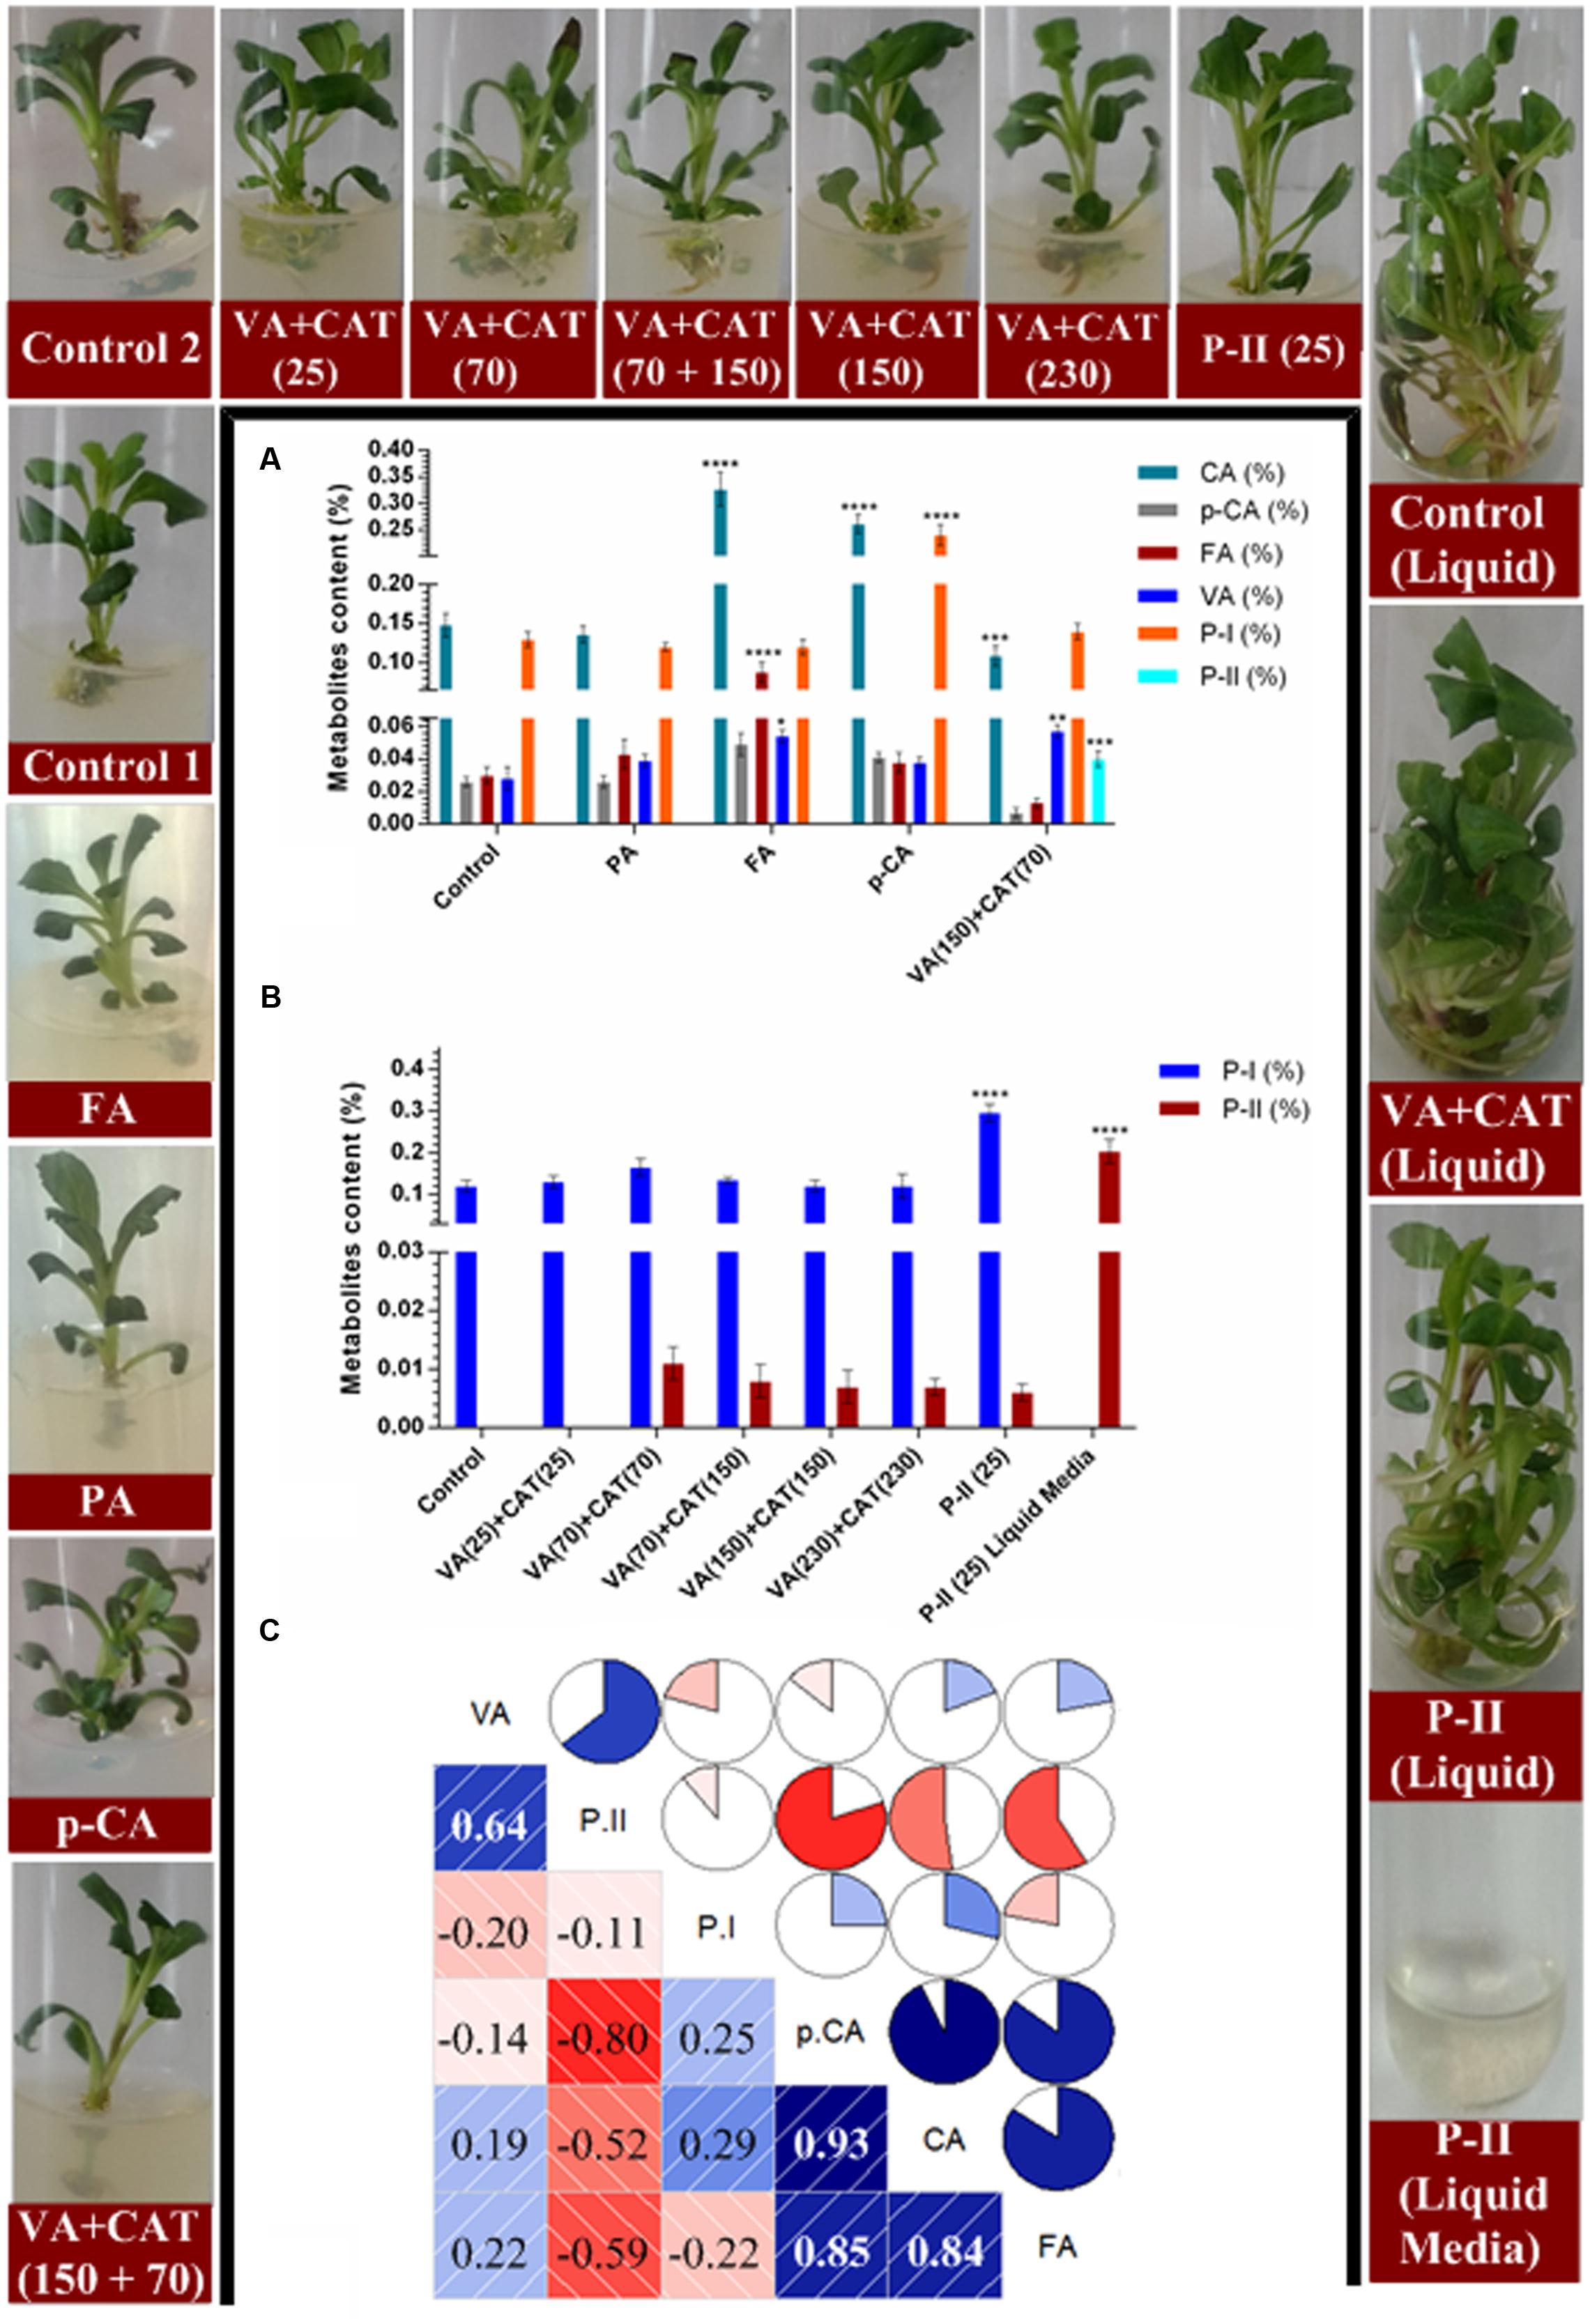
FIGURE 4. Effects of various precursor’s feeding on the contents of tested metabolites; (A) variations in metabolites contents between different precursor treatments, i.e., PRCA, FA, and p-CA at 150 μM concentration along with 150 μM VA + 70 μM CAT; (B) variations in picrosides contents among different concentrations of VA+CAT along with P-II and liquid media remained after the collection of samples and; (C) correlogram showing correlations between tested metabolites and picrosides contents among different precursors treated samples. Correlations are presented in the form of pie graphs filled in proportion to the Pearson’s correlation coefficient values. Clock-wise occupied with blue color depict positive correlations while anti-clockwise pie graphs filled with red color indicate negative correlations. The data presented as means ± SD (n = 3). Significance was evaluated within metabolites contents between different precursor’s treatments (∗p < 0.05, ∗∗p < 0.01, ∗∗∗p < 0.001, ∗∗∗∗p < 0.0001).
Since, P-II was only detected in VA + CAT fed shoots therefore, different concentrations of VA + CAT were further tested to observe their influence on the P-II content. The data revealed non-significant alterations in P-II content among P. kurroa shoots treated with different concentrations of VA + CAT (Figure 4B). Moreover, the P-II content also exhibited non-significant alteration in shoots fed with P-II while 0.2% P-II was observed in the media remained after the sampling of shoots treated with P-II (Figure 4B).
The feeding of different precursors in vitro also increased shoot biomass compared to untreated control which might be due to the enhanced carbon source utilization.
Correlation Analysis between Picrosides Content and Transcripts Abundance Values (FPKM)
To get insight into flux dynamics of different metabolic modules connected to picrosides biosynthesis, correlation maps were constructed between the FPKM values of selected transcripts and picrosides content among different shoots and stolons accessions of P. kurroa2. The transcripts encoding enzymes catalyzing regulatory reactions in different metabolic pathways were selected based on their connection with picrosides biosynthesis. The details of selected transcripts with their role in picrosides production are provided in Table 2.
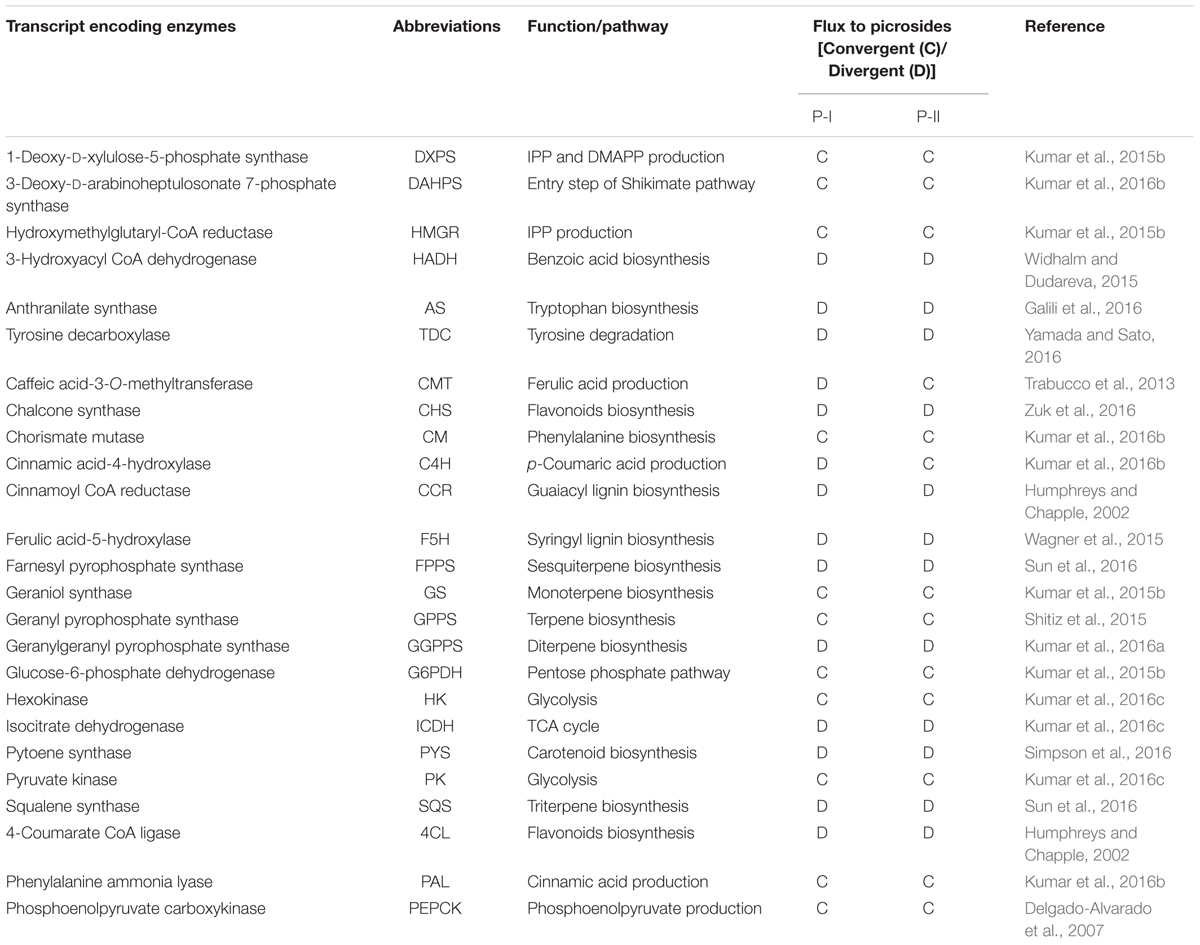
TABLE 2. Details of transcripts encoding enzymes selected for this study and their plausible involvement in picrosides biosynthesis.
The correlation analysis among selected accessions of shoots viz. PKS-1, PKS-5, PKS-4, and PKS-21 revealed positive correlations of PAL (0.66), PEPCK (0.60), DAHPS (0.92), 4CL (0.57), PK (0.03), AS (0.45), GS (0.09), and G6PDH (0.24) with P-I content while rest of the selected transcripts showed negative correlations (Figures 5A,D). In contrast, the correlation analysis among selected accessions of stolons viz. PKST-3, PKST-5, PKST-16, and PKST-18 revealed positive correlations of PYS (0.19), DXPS (0.43), PAL (0.28), HMGR (0.94), HADH (0.13), C4H (0.60), DAHPS (0.79), and GS (0.51) with P-II content while remaining selected transcripts showed negative correlations (Figures 5B,C). These observations implied that DAHPS, PAL, PEPCK, and 4CL which showed high positive correlations (>0.60) with P-I content might be considered as the key candidate genes for P-I biosynthesis. Conversely, HMGR, C4H, DAHPS, and GS might play an important role in the biosynthesis of P-II in P. kurroa.
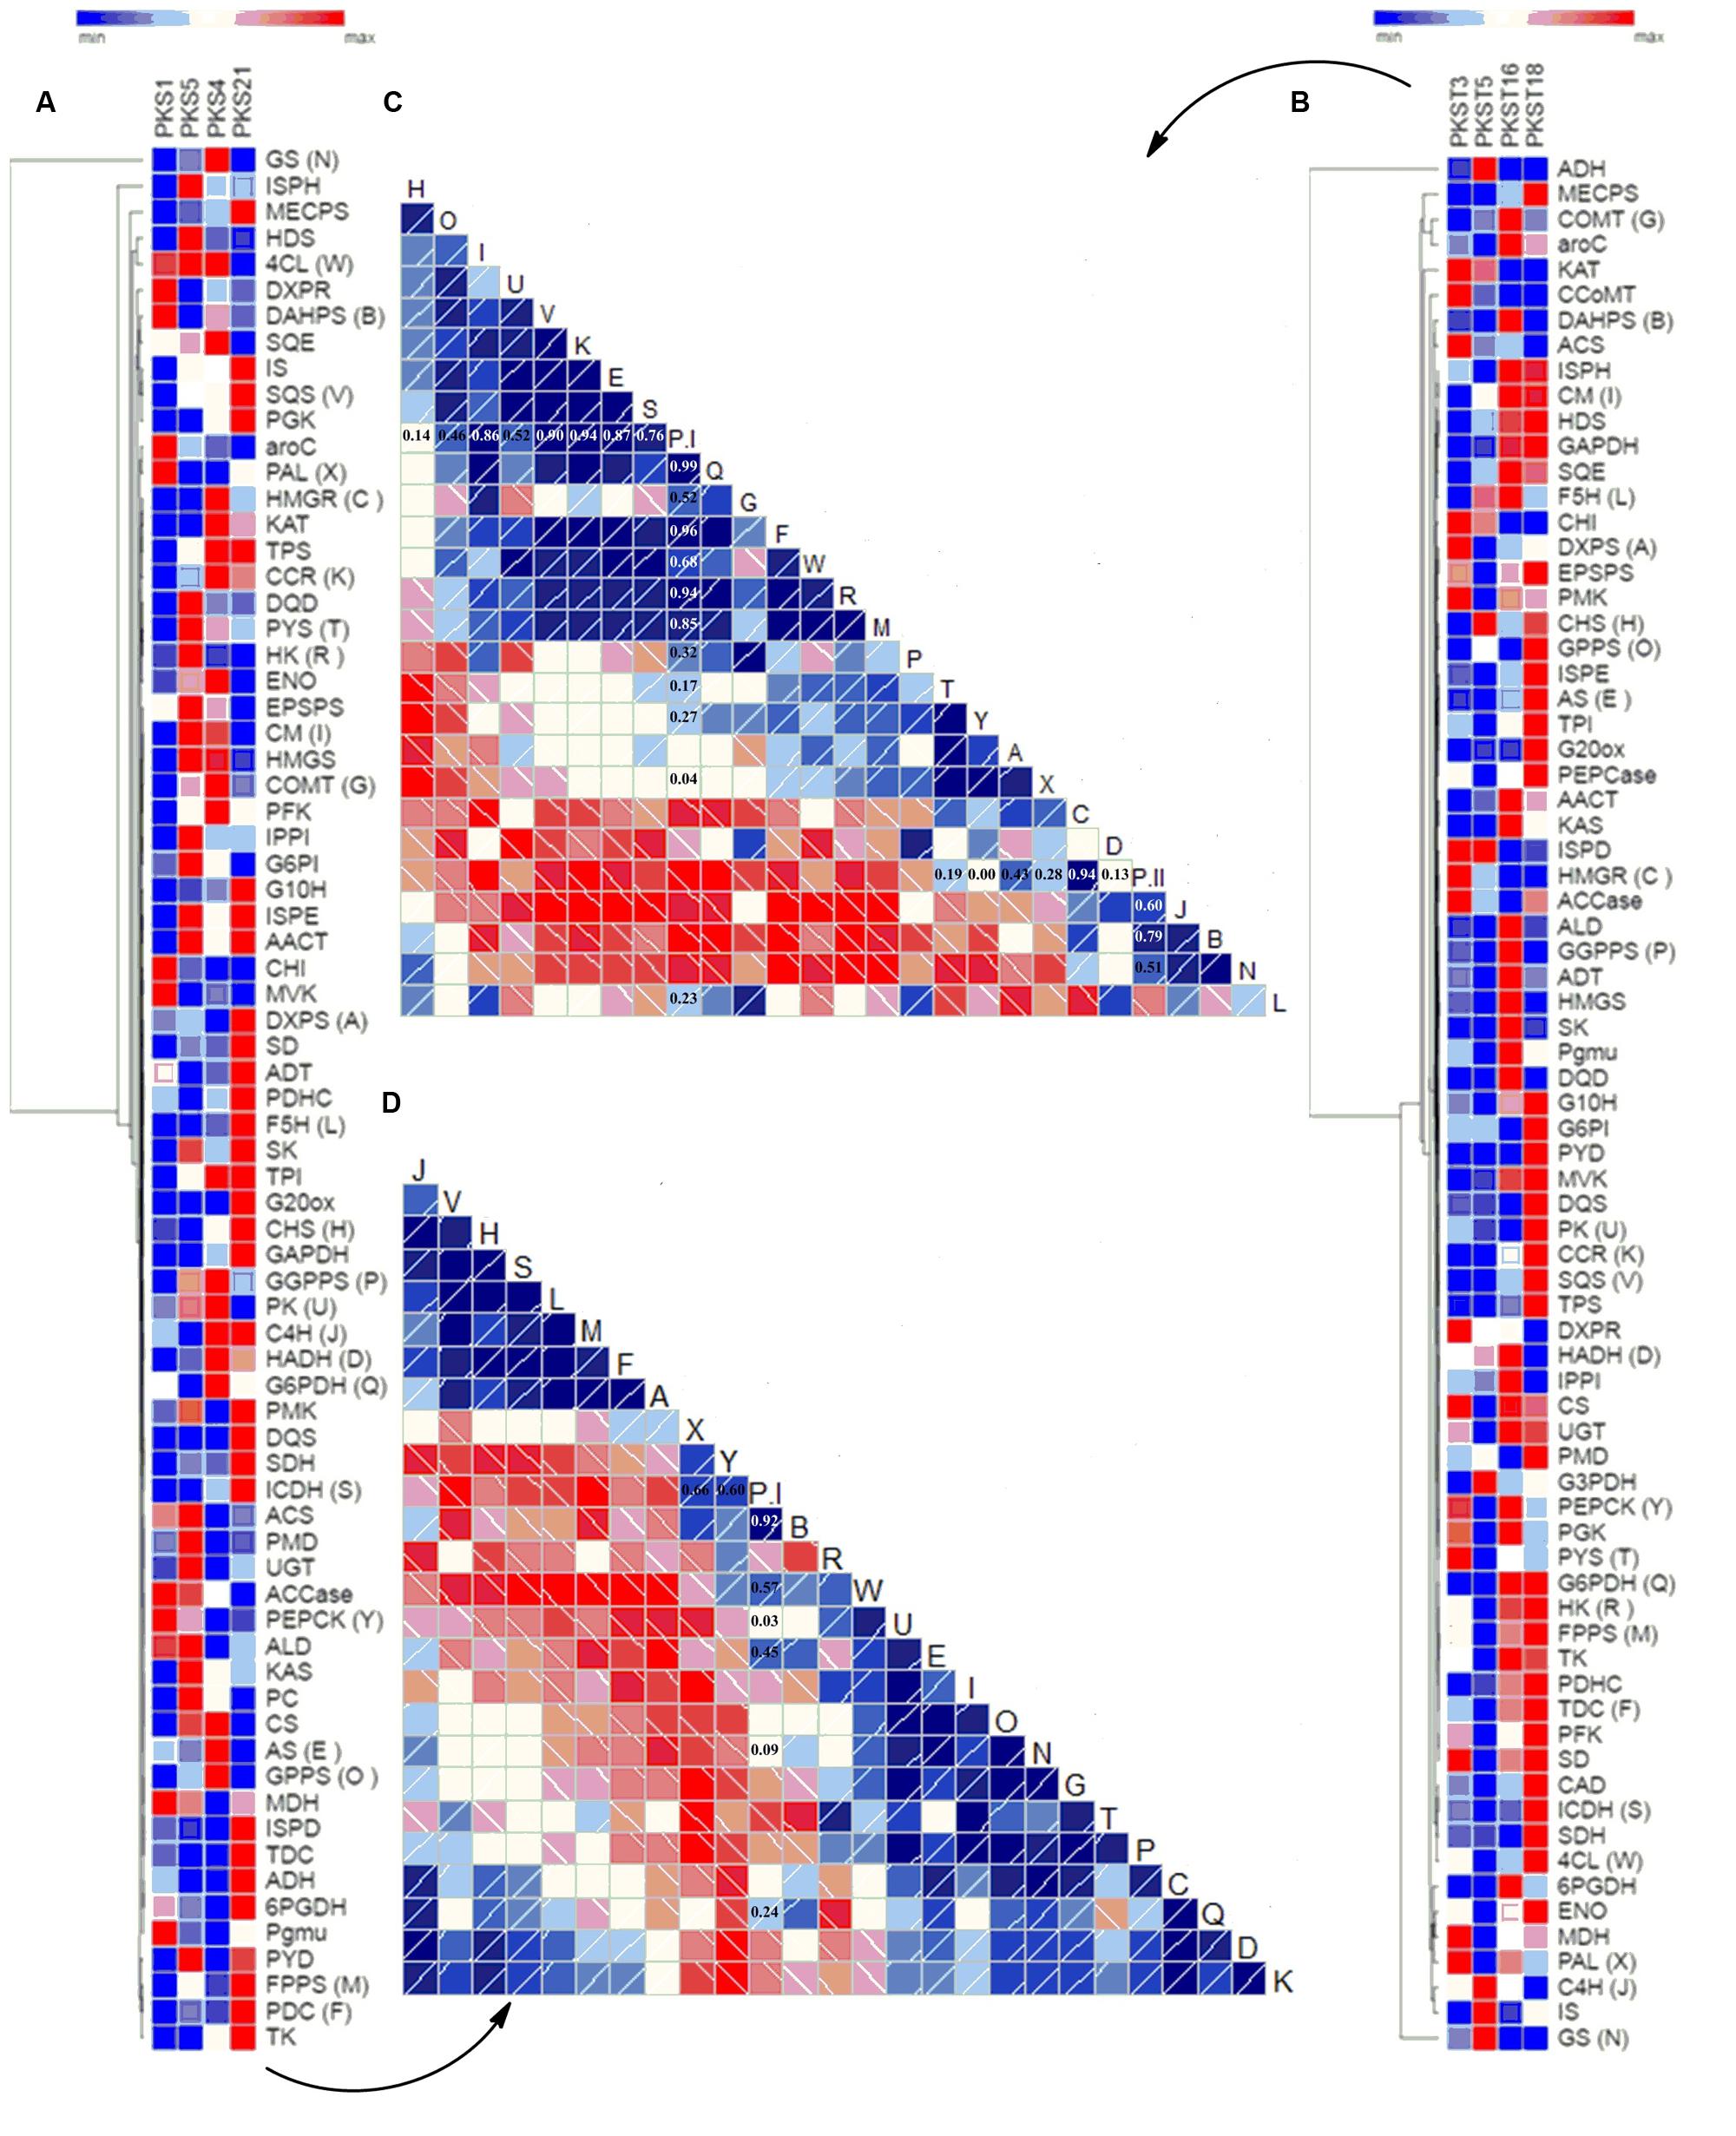
FIGURE 5. Differential expression analysis of genes involved in secondary metabolism among different tissues of P. kurroa accessions; (A,B) cluster analysis of differentially expressed genes patterns between different P. kurroa accessions selected for shoots and stolons, respectively; (C,D) correlations in terms of Pearson’s correlation coefficients depicted using correlogram between selected genes and metabolites contents among different stolons and shoots, respectively. The data is represented in the form of graphs filled in proportion to the Pearson’s correlation coefficient values. Clock-wise occupied with blue color depict positive correlations while anti-clockwise graphs filled with red color indicate negative correlations.
Gene Expression Profiling among Selected Accessions of P. kurroa
To confirm the differential gene expression patterns obtained through transcriptomes analysis, six genes were randomly selected (having both positive and negative correlations with P-I and P-II contents) and further tested using qRT-PCR. Among the selected different accessions of shoots, the transcripts levels of DAHPS showed 1.3- (p < 0.01), 1.8- (p < 0.0001), and 1.6-fold (p < 0.0001) significant decrease in PKS-4, PKS-5, and PKS-21, respectively compared to PKS-1 (Figure 6A). The expression level of CMT displayed 1.8- (p < 0.05) and 3.3-fold (p < 0.0001) significant increase in PKS-4 and PKS-21, respectively compared to PKS-1 (Figure 6A). In contrast, the expression level of PAL was maximum in PKS-1 which showed significant decrease in PKS-4, PKS-5, and PKS-21 with 10.7- (p < 0.0001), 18- (p < 0.0001), and 1.3-fold (p < 0.01), respectively (Figure 6A). The transcript levels of C4H exhibited significant elevation in PKS-21 with 2.4-fold (p < 0.0001), while 2.8-fold (p < 0.05) significant decrease was observed in PKS-5 compared to PKS-1 (Figure 6A). Moreover, the transcript level of G10H showed 3.3- (p < 0.0001) and 2.5-fold (p < 0.0001) significant increment in PKS-5 and PKS-21, respectively compared to PKS-1 (Figure 6A). The expression level of HK showed 3.4-fold (p < 0.0001) significant decrease in PKS-4 compared to PKS-1 (Figure 6A).
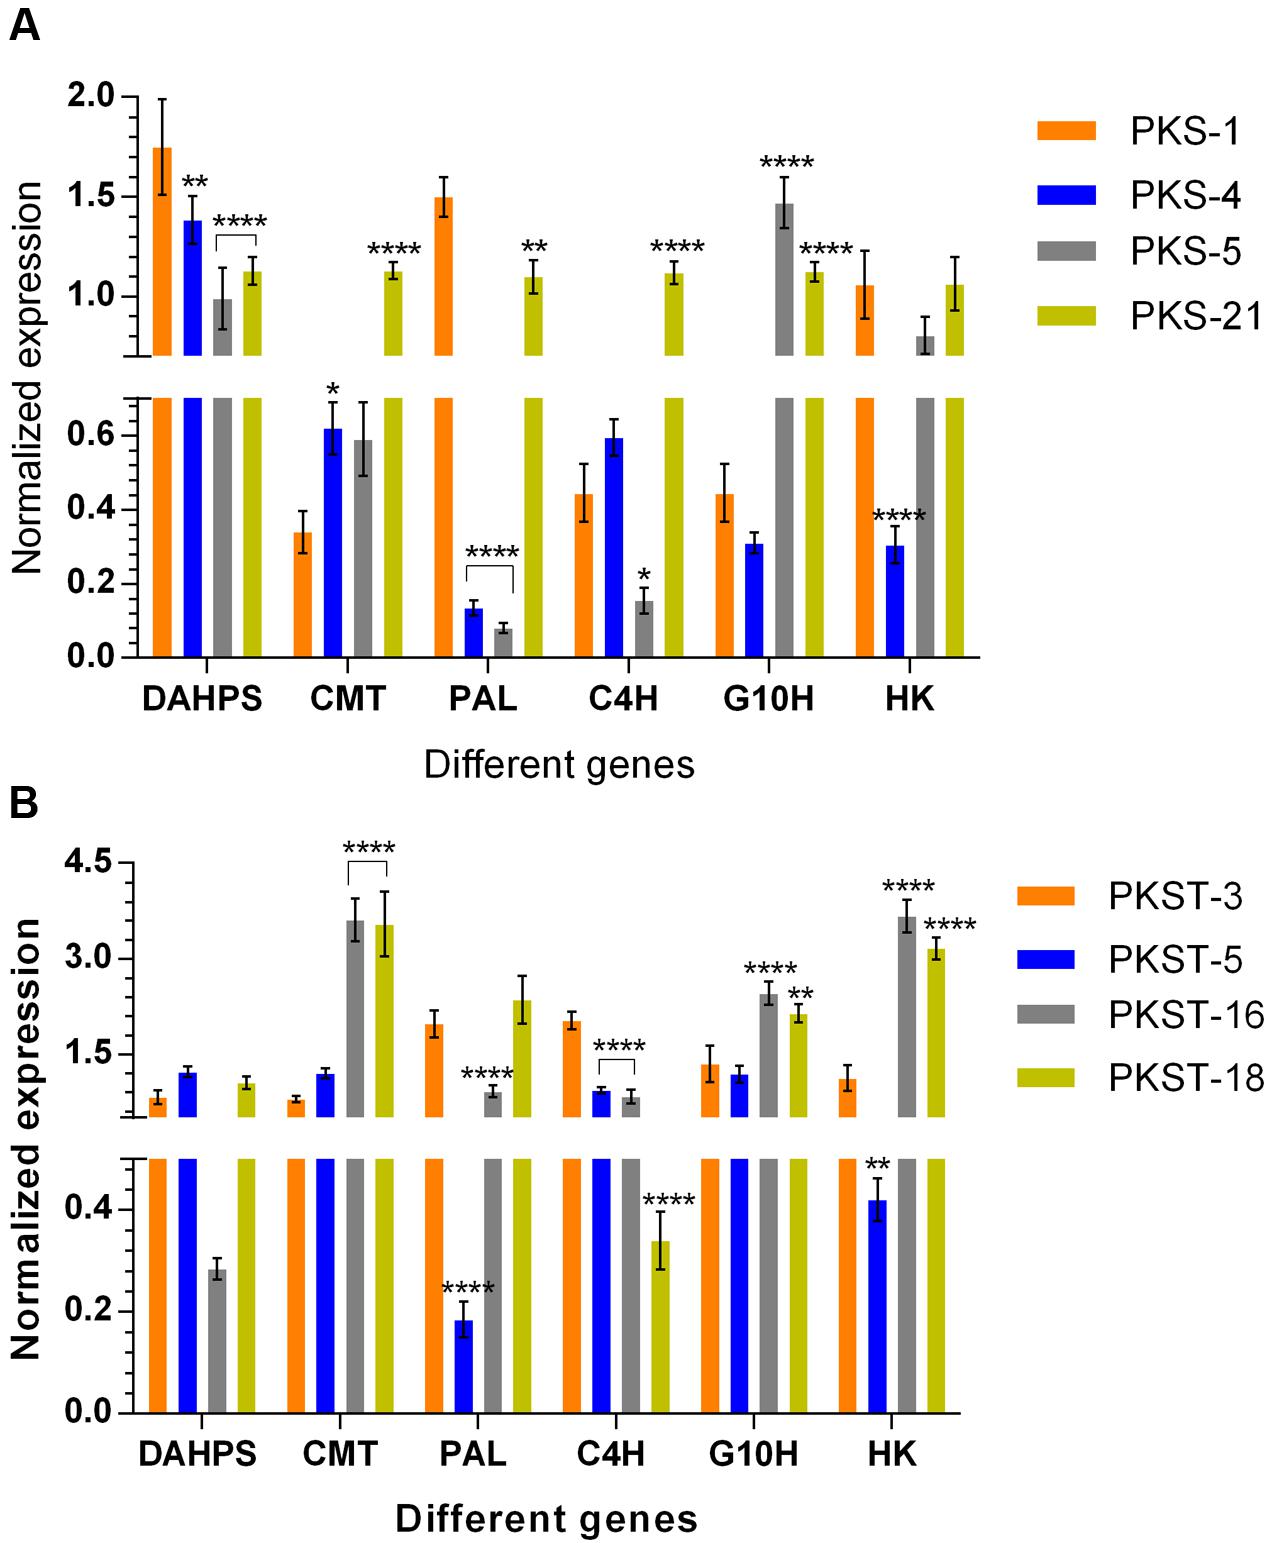
FIGURE 6. Expression profiling of selected genes in different tissues of P. kurroa accessions; (A) shoots and (B) stolons. Expression values were normalized with levels of 26S reference gene. The data presented as means ± SD (n = 3). Significance was evaluated for each gene between different accessions (∗p < 0.05, ∗∗p < 0.01, ∗∗∗∗p < 0.0001).
The expression analysis of DAHPS gene among different accessions of stolons showed non-significant modulations (Figure 6B). The expression level of CMT displayed 4.5- (p < 0.0001) and 4.4-fold (p < 0.0001) significant increase in PKST-16 and PKST-18, respectively compared to PKST-3 (Figure 6B). In contrast, the expression level of PAL showed 10.4- (p < 0.0001) and 2.2-fold (p < 0.0001) significant decrease in PKST-5 and PKST-16, respectively compared to PKST-3 (Figure 6B). The transcript level of C4H was maximum in PKST-3 which showed significant decrease in PKST-5, PKST-16, and PKST-18 with 2.1- (p < 0.0001), 2.4- (p < 0.0001), and 5.9-fold (p < 0.0001), respectively (Figure 6B). The transcript level of G10H exhibited 1.8- (p < 0.0001) and 1.6-fold (p < 0.01) significant increment in PKST-16 and PKST-18, respectively compared to PKST-3 (Figure 6B). Moreover, the expression level of HK showed 3.2- (p < 0.0001) and 2.8-fold (p < 0.0001) significant elevation in PKST-16 and PKST-18, respectively, while 2.6-fold (p < 0.01) significant decrease in PKST-5 was observed compared to PKST-3 (Figure 6B).
Finally, the correlations between differential gene expression patterns of six selected genes obtained from transcriptomes data and qRT-PCR were determined and we observed coefficient of determination (R2) ≥ 0.75 which indicates a good positive correlation (Figure 7). It was thus evident from the results that gene expression patterns investigated by qRT-PCR were corroborated with those obtained by RNA-seq analysis, thereby supporting the reliability of our transcriptomes data.
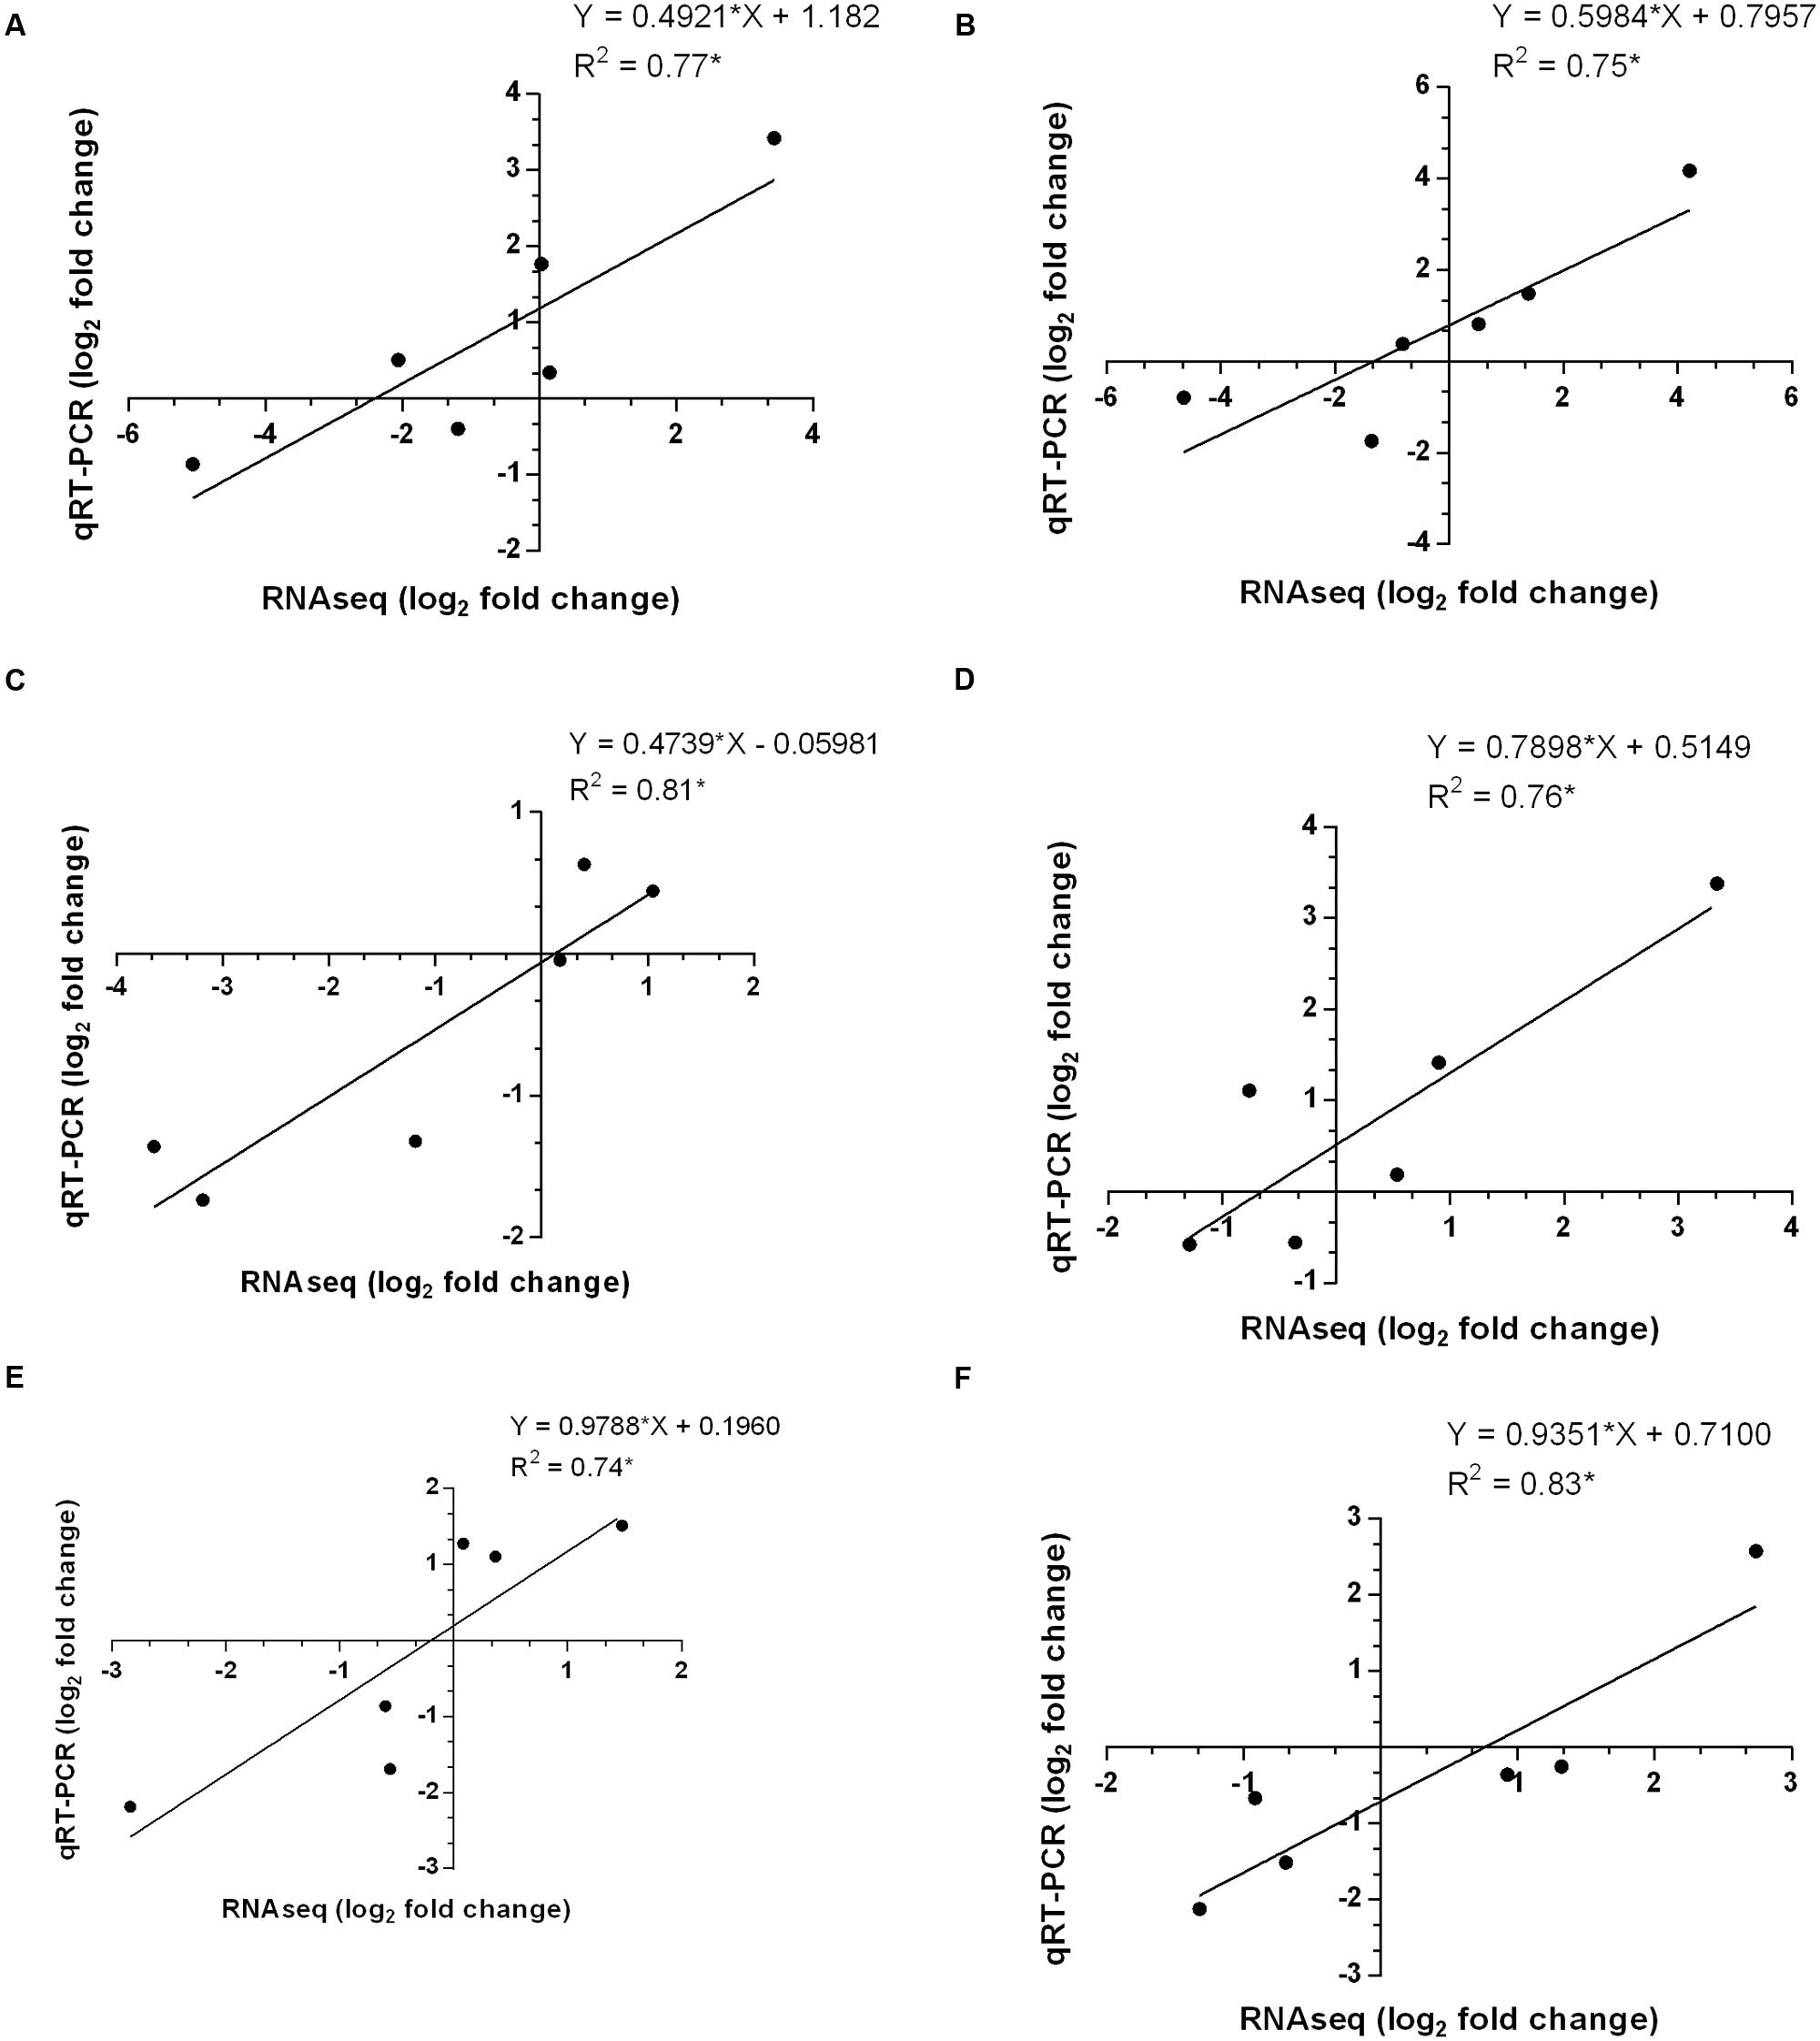
FIGURE 7. Correlations determined between differential gene expression patterns of selected genes among transcriptomes data and qRT-PCR in different tissues of P. kurroa accessions; (A) PKS-1 vs. PKS-4, (B) PKS-1 vs. PKS-5, (C) PKS-1 vs. PKS-21, (D) PKST-3 vs. PKST-5, (E) PKST-3 vs. PKST-16 and, (F) PKST-3 vs. PKST-18. R2 = Coefficient of determination.
Discussion
The metabolic network of picrosides production is overwhelmingly complex as multiple pathways contribute to their biosynthesis in P. kurroa. In recent years, the major attention was paid to elucidate the metabolic flux dynamics in P-I production through the use of various inhibitors and precursors specific to the enzymes catalyzing critical steps in its biosynthesis (Shitiz et al., 2015; Kumar et al., 2016b). However, the biosynthesis of P-II remains untapped since it is not produced in P. kurroa plants grown in vitro (Sood and Chauhan, 2010). Moreover, the shoots of P. kurroa plants grown in natural habitats exhibited only P-I while stolons contained both P-I and P-II (Pandit et al., 2013a). Thus, to investigate the metabolic basis of P-II biosynthesis, we have employed a strategy utilizing natural genetic diversity existing for the production of P-II among P. kurroa accessions collected from different geographic locations of North-Western Himalayas, India. Moreover, the genes/enzymes information for most of the enzymatic steps has been obtained through generating and mining NGS transcriptomes from differential content phenotypes of P. kurroa. The differential transcriptomes provided greater insights not only into the genes involved in biosynthetic pathways but also molecular mechanisms that regulate the contents of picrosides in P. kurroa. In the present study, the analysis of stolon tissues from different P. kurroa accessions revealed prominent increase in P-II content upon reduction in P-I level indicating that both P-I and P-II biosynthesis skewed from a common metabolic node. It is likely since VA, the immediate precursor of P-II; is supposed to be formed from either PA or FA, both are derived from shikimate/phenylpropanoid pathway which also produces CA, the immediate biosynthetic precursor of P-I (Funk and Brodelius, 1992; Kumar et al., 2013, 2016b).
The shikimate/phenylpropanoid pathway produces numerous branchpoints such as chorismate, arogenate, CA, p-CA, caffeic acid and FA, which act as precursors for the formation of phenylpropanoids, alkaloids, flavonoids, lignins, and picrosides, i.e., P-I and P-II (Tohge et al., 2013; Alvarez et al., 2016; Kumar et al., 2016b). The chorismate is involved in the formation of both tryptophan and arogenate metabolites (Kumar et al., 2016b), the later one on the other hand, can be converted into tyrosine and phenylalanine, the branchpoints for the formation of alkaloids and phenylpropanoids, respectively (Pascual et al., 2016; Schlager and Drager, 2016). The CA formed from phenylalanine acts as immediate precursor to P-I and also produces various phenylpropanoids via the formation of p-CA (Kumar et al., 2016b; Rigano et al., 2016). Moreover, the CoA pools generated from CA, p-CA, caffeic acid, and FA can deviate P-II biosynthesis by directing the flux of shikimate/phenylpropanoid pathway toward the formation of flavonoids and lignins (Alvarez et al., 2016; Figure 8).
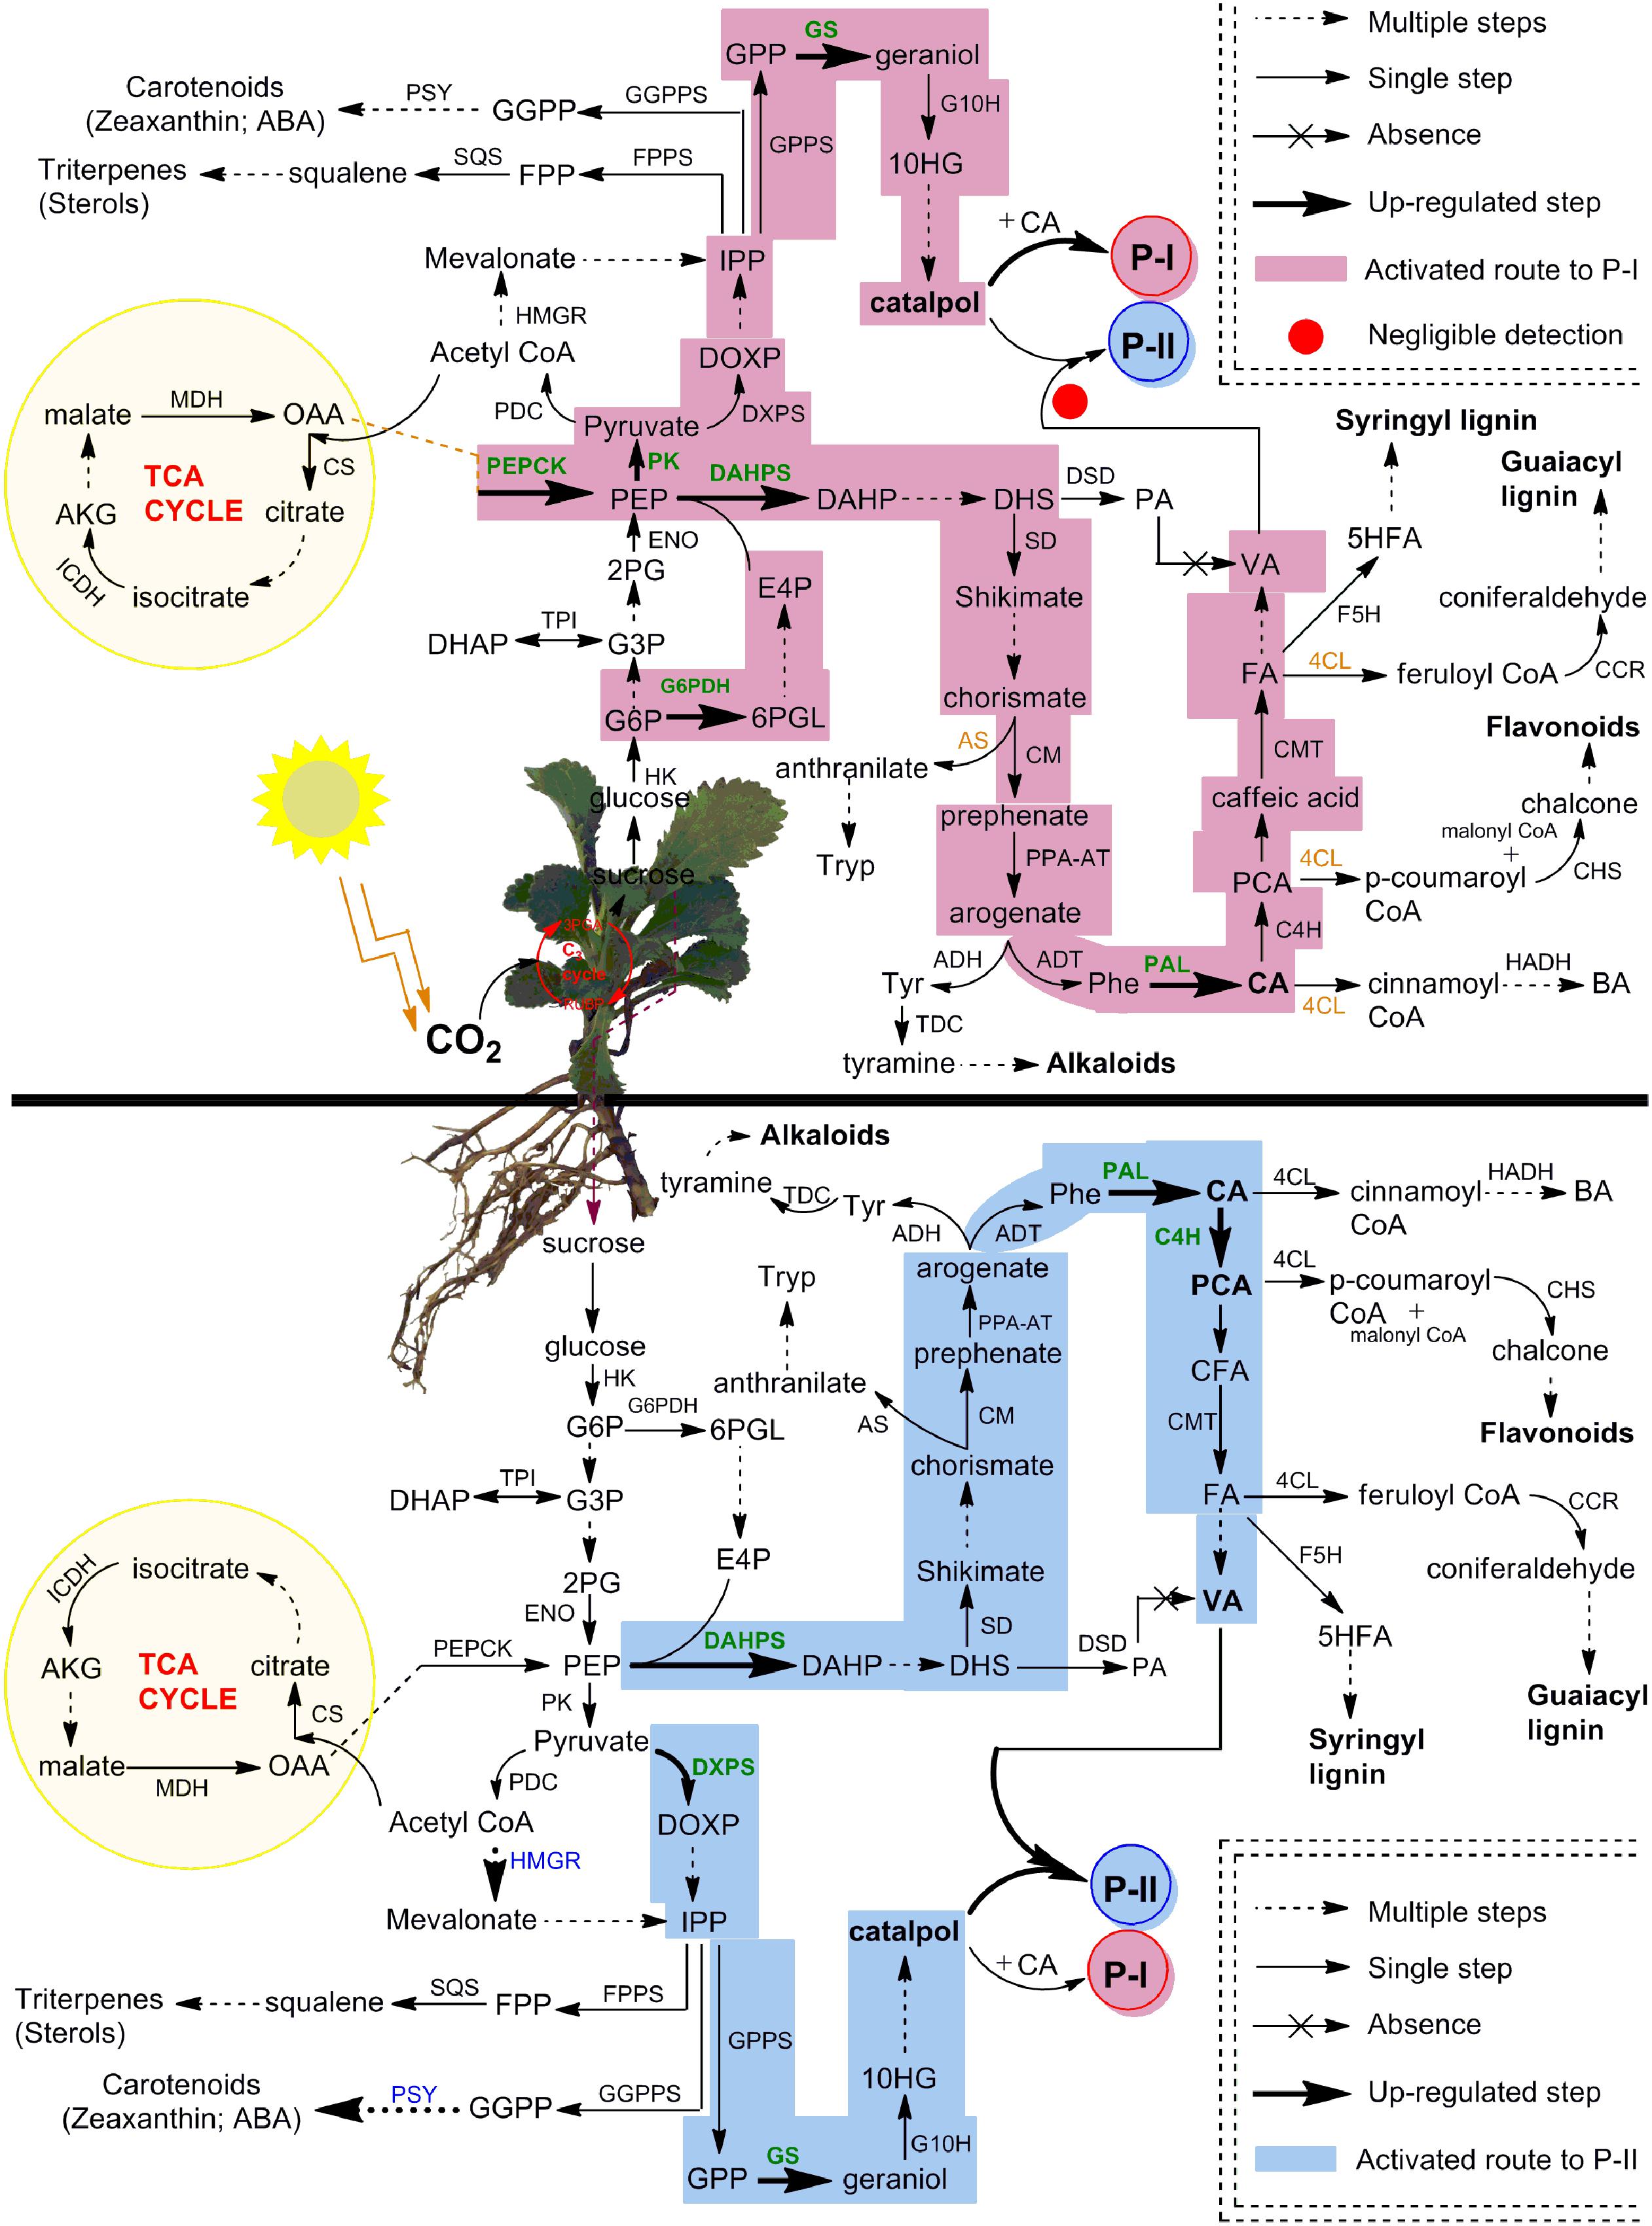
FIGURE 8. Complete framework of metabolic network depicted P-I and P-II biosynthesis in different compartments of P. kurroa. The established routes of P-I and P-II production were presented with different colors to highlight the modulations in shoots and stolons tissues of P. kurroa. Up-regulated gene expressions were highlighted with bold and green color. The abbreviations are elaborated in Supplementary Table 3.
Therefore, it is crucial to monitor dynamic profiles of intermediate metabolites in shikimate/phenylpropanoid pathway to get deep insight for metabolic switches of P-II biosynthesis. To address this, we have analyzed stolon tissues of four P. kurroa accessions based on their varying P-II content ranged from minimum to maximum (1.36–2.65%). The results observed in this study revealed statistically significant increase in VA content among high P-II content stolon tissues (PKST-3 and PKST-5) compared to stolons possessing low P-II content (PKST-16 and PKST-18) which established that VA is associated with P-II biosynthesis. This result is consistent with the proposed hypothesis that VA is the immediate precursor of P-II biosynthesis (Kumar et al., 2013). It is noteworthy that analysis of CA and p-CA metabolites content in selected stolon tissues revealed the flux direction of shikimate/phenylpropanoid pathway through to the CA step leading to the biosynthesis of p-CA and P-I as CA is located at the branching point between P-I and p-CA production (Kumar et al., 2016b). Interestingly, 87% CA was converted to p-CA in PKST-5 (P-1, 0.08%; P-II, 2.19%), 44.4% in PKST-3 (P-1, 0.17%; P-II, 2.65%), 21.1% in PKST-16 (P-1, 1.05%; P-II, 1.52%) and 8.2% in PKST-18 (P-1, 1.32%; P-II, 1.36%). This implies that with increase in the P-I content, the flux of shikimate/phenylpropanoid pathway limits through to the CA step to p-CA while increase in the P-II content directs the flux of shikimate/phenylpropanoid pathway through to the CA to p-CA leading to the enhanced P-II production in P. kurroa (Figure 8). This statement is also supported by comparative transcriptome analysis of selected stolon tissues which showed high positive correlation of gene encoding cinnamic acid-4-hydroxylase (0.60) with P-II content compared to gene encoding phenylalanine ammonia lyase enzyme which showed PCC of 0.28 with P-II content (Figure 5C). The cinnamic acid-4-hydroxylase is an enzyme that catalyzes the conversion of CA to p-CA while phenylalanine ammonia lyase catalyzes the conversion of phenylalanine to CA, the immediate precursor of the P-I biosynthesis (de Jong et al., 2015; Kumar et al., 2016b). Therefore, based on this analysis, we have hypothesized that CA is the common metabolic node between P-I and P-II biosynthesis in P. kurroa rather than 3-dehydroshikimate which serves as the branch point between PA and shikimate production; the metabolites also supposed to be the common nodes for P-I and P-II biosynthesis (Shitiz et al., 2015).
The analysis of FA, however, did not show statistically significant variations among selected stolon tissues. Albeit, increased VA content was observed in PKST-3 and PKST-5; stolons having high P-II content, compared to PKST-16 and PKST-18; low P-II content stolons. Keeping in view that FA is a canonical intermediate metabolite in the biosynthesis of guaiacyl- and syringyl lignin’s in addition to its proposed role in VA production, the results observed in this study might indicate that flux of FA is directed toward both VA and P-II in PKST-3 and PKST-5, whereas maximum flux of FA might deviate to lignin biosynthesis in PKST-16 and PKST-18. This statement is in agreement with correlation map constructed between P-II content and transcripts abundance values (FPKM) which revealed negative correlation of gene encoding caffeic acid-3-O-methyltransferase (CMT) with P-II content (-0.63) followed by a strong positive correlation of CMT through a PCC value of 0.82 with ferulic acid-5-hydroxylase (F5H), an enzyme that catalyzes the conversion of ferulic acid to 5-hydroxy ferulic acid, which represents as a precursor for syringyl lignin biosynthesis (Wagner et al., 2015). Consequently, it is apparent that up-regulated transcript level of CMT; an enzyme catalyzing the conversion of caffeic acid to FA accompanied by F5H, might be linked to the activation of lignin biosynthesis in PKST-16 and PKST-18. Trabucco et al. (2013) also reported the reduced total lignin content upon down-regulation of gene encoding CMT enzyme in Brachypodium distachyon. As a whole, the analysis of stolon tissues with natural variations for P-II content hypothesized that P-II is produced via shikimate/phenylpropanoid pathway through degradation of FA to VA, which finally integrates with catalpol (CAT) to produce P-II in P. kurroa (Figure 8).
Previous studies have reported that shoots of P. kurroa are independent biosynthetic tissues for P-I, a secondary metabolite produced by the combination of CA and catalpol (Kumar et al., 2016b). Nevertheless, current study established stolons of P. kurroa as autonomous biosynthetic machinery for P-I and P-II, both share a common biosynthetic pathway, it is inspiring to comprehend the negligence of P-II biosynthesis in P. kurroa shoots. To address this, the shoot tissues of four P. kurroa accessions based on their varying P-I content ranged from minimum to maximum (0.13–2.31%) were selected for analysis of p-CA, CA, FA, and VA with the aim to investigate the fate of shikimate/phenylpropanoid pathway in P. kurroa shoots. The analysis of shoot tissues of four P. kurroa accessions for CA and p-CA revealed that increased P-I production limits flux of CA toward p-CA biosynthesis. It is likely since CA shares a common biosynthetic node for P-I and p-CA (Kumar et al., 2016b). In contrast, the analysis of FA revealed slight significant variation between the selected shoots and also showed a high positive correlation by PCC of 0.85 with p-CA. However, C4H and chalcone synthase (CHS) showed a strong positive correlation with PCC of 0.90 compared to PCC of 0.23 between C4H and CMT (Figure 5D). CHS is an enzyme that catalyzes the formation of naringenin chalcone; the later one serves as a starting metabolite for flavonoids biosynthesis (Zuk et al., 2016). Therefore, this finding underscores that phenylpropanoid pathway might allocate the flux of p-CA to produce both FA and flavonoids in P. kurroa shoots. This statement is in agreement with previous study which revealed that silencing of gene encoding hydroxycinnamoyl-CoA shikimate/quinate hydroxycinnamoyltransferase enzyme (HCT) involved in lignin biosynthesis, re-routed the flux of phenylpropanoid pathway into flavonoids through CHS activity (Besseau et al., 2007). Interestingly, negligible levels of VA were observed in all the selected shoot tissues which implies that P-II biosynthesis arrests in the downstream steps of FA, which possibly limits the VA supply.
Therefore, p-CA, FA, and PA were exogenously applied along with mixture of VA and catalpol in tissue culture conditions not only to establish the course of P-II biosynthesis but also to produce P-II in P. kurroa shoots. The results revealed significant enhancement of VA content in FA fed shoots compared to shoots without treatment. This observation further ascertained that FA is associated with VA production rather than PA which is previously proposed to be the precursor for VA biosynthesis (Kumar et al., 2013; Shitiz et al., 2015). Moreover, significant enhancement of VA content in VA+CAT fed shoots over untreated control might indicate it’s accumulation due to exogenous application. This was also supported by the absence of VA content observed in the MS media left after the collection of VA+CAT fed shoots. Upon analysis of P-II content, minor detection was only observed in VA+CAT fed shoots which indicate that exogenous application of VA+CAT, both immediate precursors of P-II biosynthesis, might stimulate its production in P. kurroa shoots. Therefore, different concentrations of VA+CAT were further tested with the aim to observe the progressive increase of P-II content in P. kurroa shoots. Unfortunately, we did not observe significant increment in P-II content among different VA+CAT fed shoots which is possibly due to low activity of a probable acyltransferase that catalyzes the esterification of VA and CAT to produce P-II. However, we have not observed the activity of probable acyltransferase as it is not discovered yet. It is striking that P-II was not taken up by the P. kurroa plants upon its exogenous introduction in purified form. This was clearly demonstrated from the negligible level of P-II observed in shoots fed with P-II whereas its substantial content was detected in the MS media left after the collection of P-II fed shoots. This finding suggests that P. kurroa plants are unable to take P-II in its ready form and subsequently they are dependent on its endogenous production.
Taken together, the findings of this study shed light on metabolic modulations underlying the biosynthesis of P-I and P-II in P. kurroa. It offers convincing evidences that independent mechanisms control the biosynthesis of P-I and P-II in both compartments of P. kurroa, i.e., shoots and stolons. The intermediates of shikimate/phenylpropanoid pathway produced in stolons guided the flux toward P-II biosynthesis via degradation of FA to produce VA, the immediate precursor of P-II. In contrast, flux of precursors deviate from the non-canonical view of P-II biosynthesis in shoot tissues of P. kurroa. Theoretically, we have finally illustrated the basis of P-II negligence in shoot compartment that provides impetus for the future investigation of an enzyme catalyzing the conversion of VA and CAT to produce P-II, a task that can rewrite the P-II production in shoots of P. kurroa.
Author Contributions
VK conducted tissue culture experiments. VK conducted molecular experiments and HPLC analysis. AB performed transcriptomes data analysis and VK conducted correlation analysis. VK and RC conceived and designed research. VK, AB, and RC analyzed data. VK and RC wrote the manuscript. All authors read and approved the manuscript.
Funding
This work was supported by Department of Biotechnology, Ministry of Science and Technology, Government of India (Grant number: BT/COE/34/SP15268/2015) in the form of a Programme Support on high-value medicinal plants under Centres of Excellence.
Conflict of Interest Statement
The authors declare that the research was conducted in the absence of any commercial or financial relationships that could be construed as a potential conflict of interest.
Acknowledgments
We are also thankful to the Himalayan Forest Research Institute (HFRI), Panthaghati, Shimla, India for providing authenticated plant material of P. kurroa and Dr. Hemant Sood, Assistant Professor, JUIT, for providing in vitro grown P. kurroa plants for culturing. A special note of thanks to Mr. Kamlesh Kumar, Lab attendant, JUIT for his assistance in plant tissue culture experiments.
Supplementary Material
The Supplementary Material for this article can be found online at: http://journal.frontiersin.org/article/10.3389/fpls.2017.00564/full#supplementary-material
Footnotes
References
Alvarez, A., Montesano, M., Schmelz, E., and de Leon, I. P. (2016). Activation of shikimate, phenylpropanoid, oxylipins, and auxin pathways in Pectobacterium carotovorum elicitors-treated moss. Front. Plant Sci. 35:328. doi: 10.3389/fpls.2016.00328
Besseau, S., Hoffmann, L., Geoffroy, P., Lapierre, C., Pollet, B., and Legrand, M. (2007). Flavonoid accumulation in Arabidopsis repressed in lignin synthesis affects auxin transport and plant growth. Plant Cell 19, 148–162. doi: 10.1105/tpc.106.044495
Choi, J., Choi, B. K., Kim, J. S., Lee, J. W., Park, H. A., Ryu, H. W., et al. (2016). Picroside II attenuates airway inflammation by downregulating the transcription factor GATA3 and Th2-related cytokines in a mouse model of HDM-induced allergic asthma. PLoS ONE 11:e0167098. doi: 10.1371/journal.pone.0167098
Comu, F. M., Kilic, Y., Ozer, A., Kirisci, M., Dursun, A. D., Tatar, T., et al. (2016). Effect of picroside II on erythrocyte deformability and lipid peroxidation in rats subjected to hind limb ischemia reperfusion injury. Drug Des. Dev. Ther. 10, 927–931. doi: 10.2147/DDDT.S95418
Conesa, A., Gotz, S., Garcia-Gomez, J. M., Terol, J., Talon, M., and Robles, M. (2005). Blast2GO: a universal tool for annotation, visualization and analysis in functional genomics research. Bioinformatics 21, 3674–3676. doi: 10.1093/bioinformatics/bti610
de Jong, F., Hanley, S. J., Beale, M. H., and Karp, A. (2015). Characterisation of the willow phenylalanine ammonia-lyase (PAL) gene family reveals expression differences compared with poplar. Phytochemistry 117, 90–97. doi: 10.1016/j.phytochem.2015.06.005
Delgado-Alvarado, A., Walker, R. P., and Leegood, R. C. (2007). Phosphoenolpyruvate carboxykinase in developing pea seeds is associated with tissues involved in solute transport and is nitrogen-responsive. Plant Cell Environ. 30, 225–235. doi: 10.1111/j.1365-3040.2006.01622.x
Dwivedi, Y. R. R., Garg, N. K., and Dhawan, B. N. (1992). Picroliv and its components kutkoside and P-I protect liver against galactosamine induced damage in rats. Pharmacol. Toxicol. 71, 383–387. doi: 10.1111/j.1600-0773.1992.tb00566.x
Friendly, M. (2002). Corrgrams: exploratory displays for correlation matrices. Am. Stat. 56, 316–324. doi: 10.1198/000313002533
Funk, C., and Brodelius, P. E. (1992). Phenylpropanoid metabolism in suspension cultures of Vanilla planifolia Andr: IV. Induction of vanillic acid formation. Plant Physiol. 99, 256–262. doi: 10.1104/pp.99.1.256
Gahlan, P., Singh, H. R., Shankar, R., Sharma, N., Kumari, A., Chawla, V., et al. (2012). De novo sequencing and characterization of Picrorhiza kurrooa transcriptome at two temperatures showed major transcriptome adjustments. BMC Genomics 13:126. doi: 10.1186/1471-2164-13-126
Galili, G., Amir, R., and Fernie, A. R. (2016). The regulation of essential amino acid synthesis and accumulation in plants. Annu. Rev. Plant Biol. 67, 153–178. doi: 10.1146/annurev-arplant-043015-112213
Gao, H., and Zhou, Y. W. (2005a). Inhibitory effect of picroside II on hepatocyte apoptosis. Acta Pharmacol. Sin. 26, 729–736.
Gao, H., and Zhou, Y. W. (2005b). Anti-lipid peroxidation and protection of liver mitochondria against injuries by picroside II. World J. Gastroenterol. 11, 3671–3674.
Guo, Y., Xu, X., Li, Q., Li, Z., and Du, F. (2010). Anti-inflammation effects of picroside 2 in cerebral ischemic injury rats. Behav. Brain Funct. 6:43. doi: 10.1186/1744-9081-6-43
Henschel, R., Lieber, M., Wu, L. S., Nista, P. M., Haas, B. J., and LeDuc, R. D. (2012). “Trinity RNA-Seq assembler performance optimization,” in Proceedings of the 1st Conference of the Extreme Science and Engineering Discovery Environment: Bridging from the eXtreme to the campus and beyond, (Chicago, IL: ACM), 1–8. doi: 10.1145/2335755.2335842
Humphreys, J. M., and Chapple, C. (2002). Rewriting the lignin roadmap. Curr. Opin. Plant Biol. 5, 224–229. doi: 10.1016/S1369-5266(02)00257-1
Ishihara, H., Obata, T., Sulpice, R., Fernie, A. R., and Stitt, M. (2015). Quantifying protein synthesis and degradation in Arabidopsis by dynamic 13CO2 labeling and analysis of enrichment in individual amino acids in their free pools and in protein. Plant Physiol. 168, 74–93. doi: 10.1104/pp.15.00209
Kanehisa, M., Sato, Y., Kawashima, M., Furumichi, M., and Tanabe, M. (2016). KEGG as a reference resource for gene and protein annotation. Nucleic Acids Res. 44, D457–D462. doi: 10.1093/nar/gkv1070
Kawoosa, T., Singh, H., Kumar, A., Sharma, S. K., Devi, K., Dutt, S., et al. (2010). Light and temperature regulated terpene biosynthesis: hepatoprotective monoterpene picroside accumulation in Picrorhiza kurrooa. Funct. Integr. Genomics 10, 393–404. doi: 10.1007/s10142-009-0152-9
Kumar, V., Chauhan, R. S., and Tandon, C. (2017). Biosynthesis and therapeutic implications of iridoid glycosides from Picrorhiza genus: the road ahead. J. Plant Biochem. Biotechnol. 26, 1–13. doi: 10.1007/s13562-016-0364-8
Kumar, V., Kumar, V., Chauhan, R. S., Sood, H., and Tandon, C. (2015a). Cost effective quantification of picrosides in Picrorhiza kurroa by employing response surface methodology using HPLC-UV. J. Plant Biochem. Biotechnol. 24, 376–384. doi: 10.1007/s13562-014-0285-3
Kumar, V., Sharma, N., Shitiz, K., Singh, T. R., Tandon, C., Sood, H., et al. (2015b). An insight into conflux of metabolic traffic leading to picroside-I biosynthesis by tracking molecular time course changes in a medicinal herb, Picrorhiza kurroa. Plant Cell Tissue Organ Cult. 123, 435–441. doi: 10.1007/s11240-015-0839-7
Kumar, V., Malhotra, N., Pal, T., and Chauhan, R. S. (2016a). Molecular dissection of pathway components unravel atisine biosynthesis in a non-toxic Aconitum species, A. heterophyllum Wall. 3 Biotech 6, 106. doi: 10.1007/s13205-016-0417-7
Kumar, V., Sharma, N., Sood, H., and Chauhan, R. S. (2016b). Exogenous feeding of immediate precursors reveals synergistic effect on picroside-I biosynthesis in shoot cultures of Picrorhiza kurroa Royle ex Benth. Sci. Rep. 6:29750. doi: 10.1038/srep29750
Kumar, V., Shitiz, K., Chauhan, R. S., Sood, H., and Tandon, C. (2016c). Tracking dynamics of enzyme activities and their gene expression in Picrorhiza kurroa with respect to picroside accumulation. J. Plant Biochem. Biotechnol. 25, 125–132. doi: 10.1007/s13562-015-0317-7
Kumar, V., Sood, H., Sharma, M., and Chauhan, R. S. (2013). A proposed biosynthetic pathway of picrosides linked through the detection of biochemical intermediates in the endangered medicinal herb Picrorhiza kurroa. Phytochem. Anal. 24, 598–602. doi: 10.1002/pca.2437
Li, B., and Dewey, C. N. (2011). RSEM: accurate transcript quantification from RNA-Seq data with or without a reference genome. BMC Bioinformatics 12:323. doi: 10.1186/1471-2105-12-323
Li, H., Handsaker, B., Wysoker, A., Fennell, T., Ruan, J., Homer, N., et al. (2009). The sequence alignment/map format and SAMtools. Bioinformatics 25, 2078–2079. doi: 10.1093/bioinformatics/btp352
Li, P., Matsunaga, K., Yamakuni, T., and Ohizumi, Y. (2000). Potentiation of nerve growth factor-action by picrosides I and II, natural iridoids, in PC12D cells. Eur. J. Pharmacol. 406, 203–208. doi: 10.1016/S0014-2999(00)00662-2
Li, P., Matsunaga, K., Yamakuni, T., and Ohizumi, Y. (2002). Picrosides I and II, selective enhancers of the mitogen-activated protein kinase-dependent signaling pathway in the action of neuritogenic substances on PC12D cells. Life Sci. 71, 1821–1835. doi: 10.1016/S0024-3205(02)01949-5
Li, Q., Li, Z., Xu, X. Y., Guo, Y. L., and Du, F. (2010). Neuroprotective properties of picroside II in a rat model of focal cerebral ischemia. Int. J. Mol. Sci. 11, 4580–4590. doi: 10.3390/ijms11114580
Liu, G., Zhao, L., Wang, T., Zhang, M., and Pei, H. (2014). Optimal therapeutic dose and time window of picroside II in cerebral ischemic injury. Neural Regener. Res. 9, 1437–1445. doi: 10.4103/1673-5374.139460
Mattila, P., and Kumpulainen, J. (2002). Determination of free and total phenolic acids in plant-derived foods by HPLC with diode-array detection. J. Agric. Food Chem. 50, 3660–3667. doi: 10.1021/jf020028p
Meng, F. J., Hou, Z. W., Li, Y., Yang, Y., and Yu, B. (2012a). The protective effect of picroside II against hypoxia/reoxygenation injury in neonatal rat cardiomyocytes. Pharm. Biol. 50, 1226–1232. doi: 10.3109/13880209.2012.664555
Meng, F. J., Jiao, S. M., and Yu, B. (2012b). Picroside II protects cardiomyocytes from hypoxia/reoxygenation-induced apoptosis by activating the PI3K/Akt and CREB pathways. Int. J. Mol. Med. 30, 263–270. doi: 10.3892/ijmm.2012.987
Nour, V., Trandafir, I., and Cosmulescu, S. (2013). HPLC determination of phenolic acids, flavonoids and juglone in walnut leaves. J. Chromatogr. Sci. 51, 883–890. doi: 10.1093/chromsci/bms180
Pal, T., Malhotra, N., Chanumolu, S. K., and Chauhan, R. S. (2015). Next-generation sequencing (NGS) transcriptomes reveal association of multiple genes and pathways contributing to secondary metabolites accumulation in tuberous roots of Aconitum heterophyllum Wall. Planta 242, 239–258. doi: 10.1007/s00425-015-2304-6
Pandit, S., Shitiz, K., Sood, H., and Chauhan, R. S. (2013a). Differential biosynthesis and accumulation of picrosides in an endangered medicinal herb Picrorhiza kurroa. J. Plant Biochem. Biotechnol. 22, 335–342. doi: 10.1007/s11033-012-2147-1
Pandit, S., Shitiz, K., Sood, H., Naik, P. K., and Chauhan, R. S. (2013b). Expression pattern of fifteen genes of non-mevalonate (MEP) and mevalonate (MVA) pathways in different tissues of endangered medicinal herb Picrorhiza kurroa with respect to picrosides content. Mol. Biol. Rep. 40, 1053–1063. doi: 10.1007/s11033-012-2147-1
Pascual, M. B., El-Azaz, J., de la Torre, F. N., Cañas, R. A., Avila, C., and Cánovas, F. M. (2016). Biosynthesis and metabolic fate of phenylalanine in conifers. Front. Plant Sci. 7:1030. doi: 10.3389/fpls.2016.01030
Pei, H., Su, X., Zhao, L., Li, H., Guo, Y., Zhang, M., et al. (2012). Primary study for the therapeutic dose and time window of picroside II in treating cerebral ischemic injury in rats. Int. J. Mol. Sci. 13, 2551–2562. doi: 10.3390/ijms13032551
Quinlan, A. R., and Hall, I. M. (2010). BEDTools: a flexible suite of utilities for comparing genomic features. Bioinformatics 26, 841–842. doi: 10.1093/bioinformatics/btq033
Rathee, D., Thanki, M., Bhuva, S., Anandjiwala, S., and Agrawal, R. (2013). Iridoid glycosides-kutkin, picroside I, and kutkoside from Picrorrhiza kurroa Benth inhibits the invasion and migration of MCF-7 breast cancer cells through the down regulation of matrix metalloproteinases: 1st Cancer Update. Arab. J. Chem. 6, 49–58. doi: 10.1016/j.arabjc.2011.01.011
Rigano, M. M., Raiola, A., Docimo, T., Ruggieri, V., Calafiore, R., Vitaglione, P., et al. (2016). Metabolic and molecular changes of the phenylpropanoid pathway in tomato (Solanum lycopersicum) lines carrying different Solanum pennellii wild chromosomal regions. Front. Plant Sci. 7:1484. doi: 10.3389/fpls.2016.01484
Schlager, S., and Drager, B. (2016). Exploiting plant alkaloids. Curr. Opin. Biotechnol. 37, 155–164. doi: 10.1016/j.copbio.2015.12.003
Sharma, N., Chauhan, R. S., and Sood, H. (2015). Seaweed extract as a novel elicitor and medium for mass propagation and picroside-I production in an endangered medicinal herb Picrorhiza kurroa. Plant Cell Tissue Organ Cult. 122, 57–65. doi: 10.1007/s11240-015-0749-8
Sharma, N., Kumar, V., Chauhan, R. S., and Sood, H. (2016). Modulation of picroside-I biosynthesis in grown elicited shoots of Picrorhiza kurroa In Vitro. J. Plant Growth Regul. 35, 965–973. doi: 10.1007/s00344-016-9594-1
Shitiz, K., Pandit, S., Chauhan, R. S., and Sood, H. (2013). Picrosides content in the rhizomes of Picrorhiza kurroa Royle ex Benth. traded for herbal drugs in the markets of North India. Int. J. Med. Aromat. Plants 3, 226–233.
Shitiz, K., Sharma, N., Pal, T., Sood, H., and Chauhan, R. S. (2015). NGS transcriptomes and enzyme inhibitors unravel complexity of picrosides biosynthesis in Picrorhiza kurroa Royle ex. Benth. PLoS ONE 10:e0144546. doi: 10.1371/journal.pone.0144546
Simpson, K., Quiroz, L. F., Rodriguez-Concepcion, M., and Stange, C. R. (2016). Differential contribution of the first two enzymes of the MEP pathway to the supply of metabolic precursors for carotenoid and chlorophyll biosynthesis in Carrot (Daucus carota). Front. Plant Sci. 7:1344. doi: 10.3389/fpls.2016.01344
Sood, H., and Chauhan, R. S. (2010). Biosynthesis and accumulation of a medicinal compound, Picroside-I, in cultures of Picrorhiza kurroa Royle ex Benth. Plant Cell Tissue Organ Cult. 100, 113. doi: 10.1007/s11240-009-9618-7
Stephanopoulos, G. (2012). Synthetic biology and metabolic engineering. ACS Synth. Biol. 1, 514–525. doi: 10.1021/sb300094q
Sun, P., Schuurink, R. C., Caissard, J. C., Hugueney, P., and Baudino, S. (2016). My way: noncanonical biosynthesis pathways for plant volatiles. Trends Plant Sci. 21, 884–894. doi: 10.1016/j.tplants.2016.07.007
Tohge, T., Watanabe, M., Hoefgen, R., and Fernie, A. R. (2013). Shikimate and phenylalanine biosynthesis in the green lineage. Front. Plant Sci. 4:62. doi: 10.3389/fpls.2013.00062
Trabucco, G. M., Matos, D. A., Lee, S. J., Saathoff, A. J., Priest, H. D., Mockler, T. C., et al. (2013). Functional characterization of cinnamyl alcohol dehydrogenase and caffeic acid O-methyltransferase in Brachypodium distachyon. BMC Biotechnol. 13:61. doi: 10.1186/1472-6750-13-61
Uniyal, A., Uniyal, S. K., and Rawat, G. S. (2011). Commercial Extraction of Picrorhiza kurrooa Royle ex Benth. in the Western Himalaya. Mt. Res. Dev. 31, 201–208. doi: 10.1659/MRD-JOURNAL-D-10-00125.1
Wagner, A., Tobimatsu, Y., Phillips, L., Flint, H., Geddes, B., Lu, F., et al. (2015). Syringyl lignin production in conifers: proof of concept in a Pine tracheary element system. Proc. Natl. Acad. Sci. U.S.A. 112, 6218–6223. doi: 10.1073/pnas.1411926112
Wang, L., Liu, X., Chen, H. U. I., Chen, Z., Weng, X., Qiu, T. A. O., et al. (2015). Effect of picroside II on apoptosis induced by renal ischemia/reperfusion injury in rats. Exp. Ther. Med. 9, 817–822. doi: 10.3892/etm.2015.2192
Wang, T., Zhai, L., Guo, Y., Pei, H., and Zhang, M. (2015). Picroside II has a neuroprotective effect by inhibiting ERK1/2 activation after cerebral ischemic injury in rats. Clin. Exp. Pharmacol. Physiol. 42, 930–939. doi: 10.1111/1440-1681
Widhalm, J. R., and Dudareva, N. (2015). A familiar ring to it: biosynthesis of plant benzoic acids. Mol. Plant 8, 83–97. doi: 10.1016/j.molp.2014.12.001
Wu, N., Li, W., Shu, W., and Jia, D. (2014). Protective effect of picroside II on myocardial ischemia reperfusion injury in rats. Drug Des. Dev. Ther. 8, 545–554. doi: 10.2147/DDDT.S62355
Xiong, W., Morgan, J. A., Ungerer, J., Wang, B., Maness, P. C., and Yu, J. (2015). The plasticity of cyanobacterial metabolism supports direct CO2 conversion to ethylene. Nat. Plants 1, 15053. doi: 10.1038/nplants.2015.85
Yamada, Y., and Sato, F. (2016). Tyrosine phosphorylation and protein degradation control the transcriptional activity of WRKY involved in benzylisoquinoline alkaloid biosynthesis. Sci. Rep. 6:31988. doi: 10.1038/srep31988
Zhao, L., Guo, Y., Ji, X., and Zhang, M. (2014). The neuroprotective effect of picroside II via regulating the expression of myelin basic protein after cerebral ischemia injury in rats. BMC Neurosci. 15:25. doi: 10.1186/1471-2202-15-25
Keywords: correlation, metabolic flux, picrosides, Picrorhiza kurroa, NGS transcriptomes
Citation: Kumar V, Bansal A and Chauhan RS (2017) Modular Design of Picroside-II Biosynthesis Deciphered through NGS Transcriptomes and Metabolic Intermediates Analysis in Naturally Variant Chemotypes of a Medicinal Herb, Picrorhiza kurroa. Front. Plant Sci. 8:564. doi: 10.3389/fpls.2017.00564
Received: 17 January 2017; Accepted: 29 March 2017;
Published: 11 April 2017.
Edited by:
Danièle Werck, Centre National de la Recherche Scientifique (CNRS), FranceReviewed by:
Nethaji Gallage, University of Copenhagen, DenmarkDayakar Badri, Hill’s Pet Nutrition, Inc., USA
Copyright © 2017 Kumar, Bansal and Chauhan. This is an open-access article distributed under the terms of the Creative Commons Attribution License (CC BY). The use, distribution or reproduction in other forums is permitted, provided the original author(s) or licensor are credited and that the original publication in this journal is cited, in accordance with accepted academic practice. No use, distribution or reproduction is permitted which does not comply with these terms.
*Correspondence: Rajinder S. Chauhan, anByYWppbmRlckBnbWFpbC5jb20=
 Varun Kumar
 Ankush Bansal
 Rajinder S. Chauhan