- 1Institute of Vegetables and Flowers, Chinese Academy of Agricultural Sciences, Beijing, China
- 2College of Landscape Architecture, Nanjing Forestry University, Nanjing, China
Quantitative real-time PCR (qRT-PCR) is a reliable and high-throughput technique for gene expression studies, but its accuracy depends on the expression stability of reference genes. To date, several reliable reference gene identifications have been reported in Lilium spp., but none has been obtained for lily tepals at different developmental stages. In this study, ten candidate reference genes were selected and evaluated for their expression stability in Lilium ‘Tiny Padhye’ during the process of bicolor tepal development. The expression stability of these candidates was evaluated by three software programs (geNorm, NormFinder, and BestKeeper) and the comparative ΔCt method, and comprehensive stability rankings were generated by RefFinder. As a result, TIP41-like family gene (TIP41) and actin (ACT) were the best combination of reference genes for tepals at different developmental stages; TIP41 and F-box family gene (F-box) for tepals under shading treatment; ACT, actin11 (ACT11), and elongation factor 1-α (EF1-α) for different tissues; and ACT, TIP41, and ACT11 for all samples. The selected optimal reference genes were further verified by analyzing the expression levels of flavonoid 3′-hydroxylase (LhF3′H) and anthocyanidin 3-O-glucosyltransfersae (LhUFGT) in tepals at different developmental stages. This study provides useful information for gene expression characterization in lilies under different experimental conditions, and can serve as a basis for similar research in other closely related species.
Introduction
Lily (Lilium spp.) is one of the most important ornamental plants because of their various flower colors (yellows, oranges, pinks, reds, and whites) and color patterns (spots and bicolors). Among them, white–purple bicolor lily cultivars (e.g., ‘Tiny Padhye’) are attractive varieties because of their unique color pattern. However, the molecular mechanisms underlying a bicolor appearance in lilies remain largely unknown.
Gene expression analysis plays an important role in elucidating the molecular mechanisms underlying various biological processes (Bustin et al., 2005). qRT-PCR has been widely used as a powerful technique for monitoring gene expression profiles in different samples, due to its high sensitivity, accuracy, specificity, throughput capability, and cost-effectiveness (Bustin, 2002; Wong and Medrano, 2005; Nolan et al., 2006). However, the accuracy of relative quantification in qRT-PCR is always affected by many variable factors (RNA quality, reverse transcription efficiency, and amplification efficiency), which may cause inaccuracies in the gene expression data (Nolan et al., 2006). To ensure accurate results, it is necessary to use one or more stable reference genes to normalize the expression data of target genes.
Housekeeping genes, such as ACT, glyceraldehyde 3-phosphate dehydrogenase (GAPDH), TUB, ubiquitin (UBQ), and 18S ribosomal RNA (18S), are commonly used as reference genes to normalize the expression profiles of target genes because of their essential roles in basic cellular processes, cell structure maintenance, and primary metabolism (Bustin, 2002). However, many studies have shown that the expression levels of these genes vary across different cultivars (Li J. et al., 2016; Qi et al., 2016), different tissues (Mallona et al., 2010; Klie and Debener, 2011; Zhang et al., 2013; Sudhakar Reddy et al., 2016), and treatments (Nicot et al., 2005; Li et al., 2014; Sinha et al., 2015). Therefore, it is necessary to validate reliable reference genes under different experimental conditions prior to gene expression studies (Gutierrez et al., 2008; Kosir et al., 2010; Xiao et al., 2016).
Several statistical tools, such as geNorm (Vandesompele et al., 2002), NormFinder (Andersen et al., 2004), and BestKeeper (Pfaffl et al., 2004), and the comparative ΔCt method (Silver et al., 2006), have been developed to identify appropriate reference genes for qRT-PCR analysis. A number of studies on the validation of reference genes using these tools have been reported in different plants under different experimental conditions (Mallona et al., 2010; Klie and Debener, 2011; Li et al., 2014; Sinha et al., 2015). Recently, the evaluation of reference genes has also been reported in roots, leaves, and bulbs of lilies at different development stages or under different stresses (Luo et al., 2014; Li et al., 2015a; Liu et al., 2016). However, to the best of our knowledge, no systematic validation of reference genes in lily tepals has yet been performed.
In this study, 10 candidate reference genes, namely, TUB, cyclophilin (CYP), EF1-α, ACT, ACT11, F-box, GAPDH, TIP41-like family gene (TIP41), SAND family gene (SAND), and 18S, were assessed by qRT-PCR during various bicolor lily tepal developmental stages and in different tissues. To obtain the most suitable reference genes, five different statistical tools (geNorm, NormFinder, BestKeeper, the comparative ΔCt method, and RefFinder) were selected to evaluate the expression stability of these candidate genes. In addition, to validate the selected best-ranked reference genes, the expression levels of LhF3’H and LhUFGT in tepals at different developmental stages were investigated using each of the most stable reference genes or the combination of them in comparison to the least stable ones.
Materials and Methods
Plant Materials
The Asiatic lily cultivar ‘Tiny Padhye’ (a white-purple bicolor cultivar) was used in this study. Plants were grown in a greenhouse at the Chinese Academy of Agricultural Sciences (Beijing, China). No artificial light was provided. A total of 13 samples were collected. The expression stability of candidate reference genes was analyzed in the following four experimental sets. Samples from the first experimental set A represented inner tepals at four different developmental stages. Upper parts and bases of inner tepals were collected separately. Flower bud development stages (S) were as follows: stage 1 (S1; bud length of about 1.5 cm and no anthocyanin pigment is visible on tepals); stage 2 (S2; anthocyanin pigment becomes visible on tepal bases); stage 3 (S3; the day before anthesis, lower halves of tepals are fully pigmented); and stage 4 (S4; 0 day post-anthesis) (Figure 1). In experimental set B (shading treatment), 1.5-cm flower buds of Asiatic ‘Tiny Padhye’ were covered with silver paper, which was removed when the flowers developed to S3. Upper parts and bases of inner tepals were then immediately collected from these S3 inner tepals. Plants under natural light conditions were used as a control group. In experimental set C (plant tissues), upper parts and bases of S3 inner tepals, fresh bulb scales, stems, and leaves, were collected from untreated lily plants during flowering. The fourth experimental set D (all) was composed of all samples. The collected samples were frozen in liquid nitrogen immediately and stored at -80°C until use. Samples were obtained from 10 individual plants and three independent biological replicates were collected for each sample.
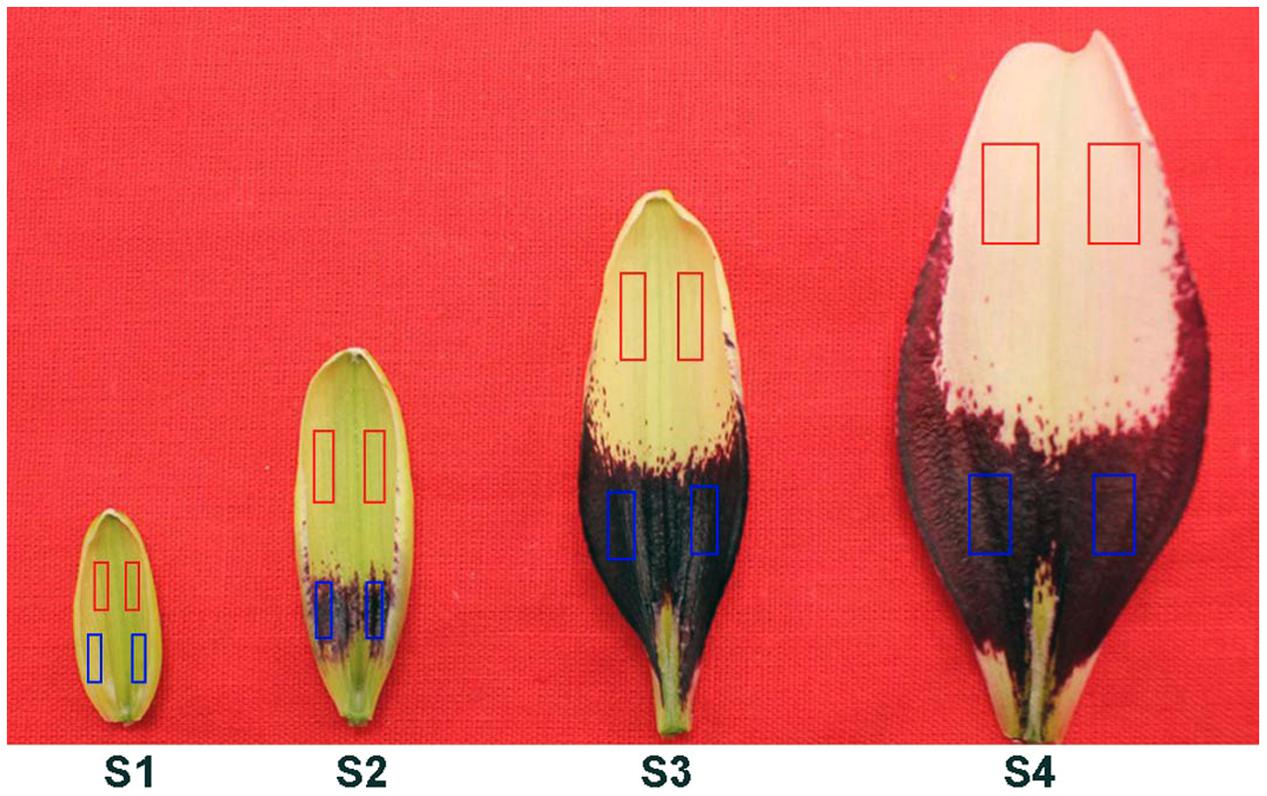
FIGURE 1. Inner tepals of Asiatic ‘Tiny Padhye’ at four different developmental stages. Colored boxes indicate tepal parts used for the experiments (red boxes, upper tepals; blue boxes, tepal bases).
RNA Isolation and cDNA Synthesis
Total RNA was extracted using an RNAprep Pure Plant Kit (Tiangen, Beijing, China), according to the manufacturer’s instructions. RNA integrity was confirmed by denaturing 1.0% agarose gel electrophoresis. RNA quality and quantity were determined using a NanoDrop 2000 spectrophotometer (Thermo Scientific, Waltham, MA, USA). Only the RNA samples with absorbance ratios at OD260/OD280 between 1.9 and 2.2 and OD260/OD230 greater than 2.0 were used for cDNA synthesis. First-strand cDNA synthesis was performed using a SuperScript III reverse transcription kit (Invitrogen, Carlsbad, CA, USA), according to the manufacturer’s instructions.
Reference Gene Selection and Primer Design
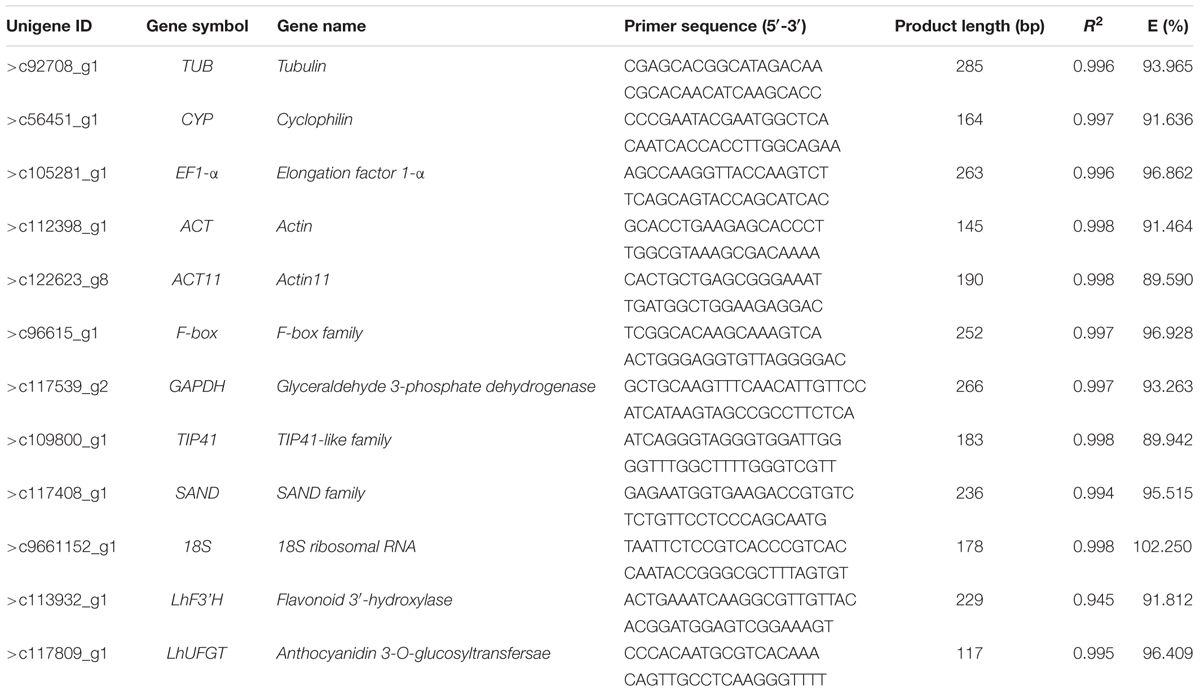
Ten reference genes (commonly used in qRT-PCR) and two target genes were selected from the transcriptome of the Asiatic lily cultivar ‘Tiny Padhye’ (Xu et al., 2016). Primers for ACT were previously described (Xu et al., 2016). Primer pairs for genes were designed using Primer Premier 5.0 software1 with the following parameters: melting temperatures (Tm) of 55–65°C, primer lengths of 17–25 bp, and amplicon lengths of 100–300 bp (Table 1). Primer specificity was assessed using gel electrophoresis and melting-curve analyses.
qRT-PCR Analysis
qRT-PCR analysis was performed using SYBR® Premix Ex TaqTM II (Tli RNaseH Plus) (Takara, Dalian, China) and a Bio-Rad CFX96 system (Bio-Rad, Hercules, CA, USA) with the following reaction conditions: initial denaturation at 95°C for 30 s, 40 cycles of 95°C for 5 s and 60°C for 30 s, and a melting-curve program (65–95°C with a temperature increment of 0.5°C every 5 s). The melting curve was created to identify the amplicon specificity. All reactions were performed with three biological replicates and three technical replicates. The primer efficiency of each gene and regression coefficient (R2) were evaluated using a standard curve generated from a fivefold dilution series of cDNA (1/5, 1/25, 1/125, 1/625). A no-template control and a reverse transcription negative control were included to monitor the potential reagents and genomic DNA contamination, respectively.
Gene Expression Stability Analysis
To show the variation in the expression of each gene, boxplots of quantitative cycle (Cq) values for the 10 candidate reference genes were drawn using the boxplot R package. Expression stability of these 10 reference genes under different experimental conditions was analyzed using geNorm (Vandesompele et al., 2002), NormFinder (Andersen et al., 2004), BestKeeper (Pfaffl et al., 2004), and the comparative ΔCt method (Silver et al., 2006). All of these software tools were run in accordance with their manuals. Furthermore, comprehensive stability rankings were generated using the web-based tool RefFinder2. It should be noted that the data of each biological replicate were analyzed separately.
Validation of Identified Reference Genes
Two lily anthocyanin biosynthesis-related genes, LhF3′H and LhUFGT, were selected as target genes to validate the reliability of the identified reference genes. Their gene expression profiles in the upper parts and bases of inner tepals at different developmental stages were normalized using the most stable candidate reference gene(s) as well as the least stable reference gene(s). Sample collections and experiments were performed as described above. The average Cq value was calculated from three biological replicates and three technical replicates and used for relative expression analyses. Relative gene expression levels of LhF3’H and LhUFGT were calculated using the 2-ΔΔCq method (Livak and Schmittgen, 2001).
Results
Assessment of Primer Specificity and PCR Amplification Efficiency
A total of 10 candidate reference genes were selected from the transcriptome of the Asiatic lily cultivar ‘Tiny Padhye’ for qRT-PCR analysis. The presence of a single PCR product with the expected size and single peak in the melting curve analysis for each gene confirmed the specific amplification of each gene (Figure 2). The amplification efficiency (E) of all PCR reactions ranged from 89.59% for ACT11 to 102.25% for 18S (Table 1), suggesting that these genes are suitable for further gene expression analysis. Meanwhile, the standard curves showed good linear relationships, with correlation coefficients (R2) above 0.99 (Table 1).
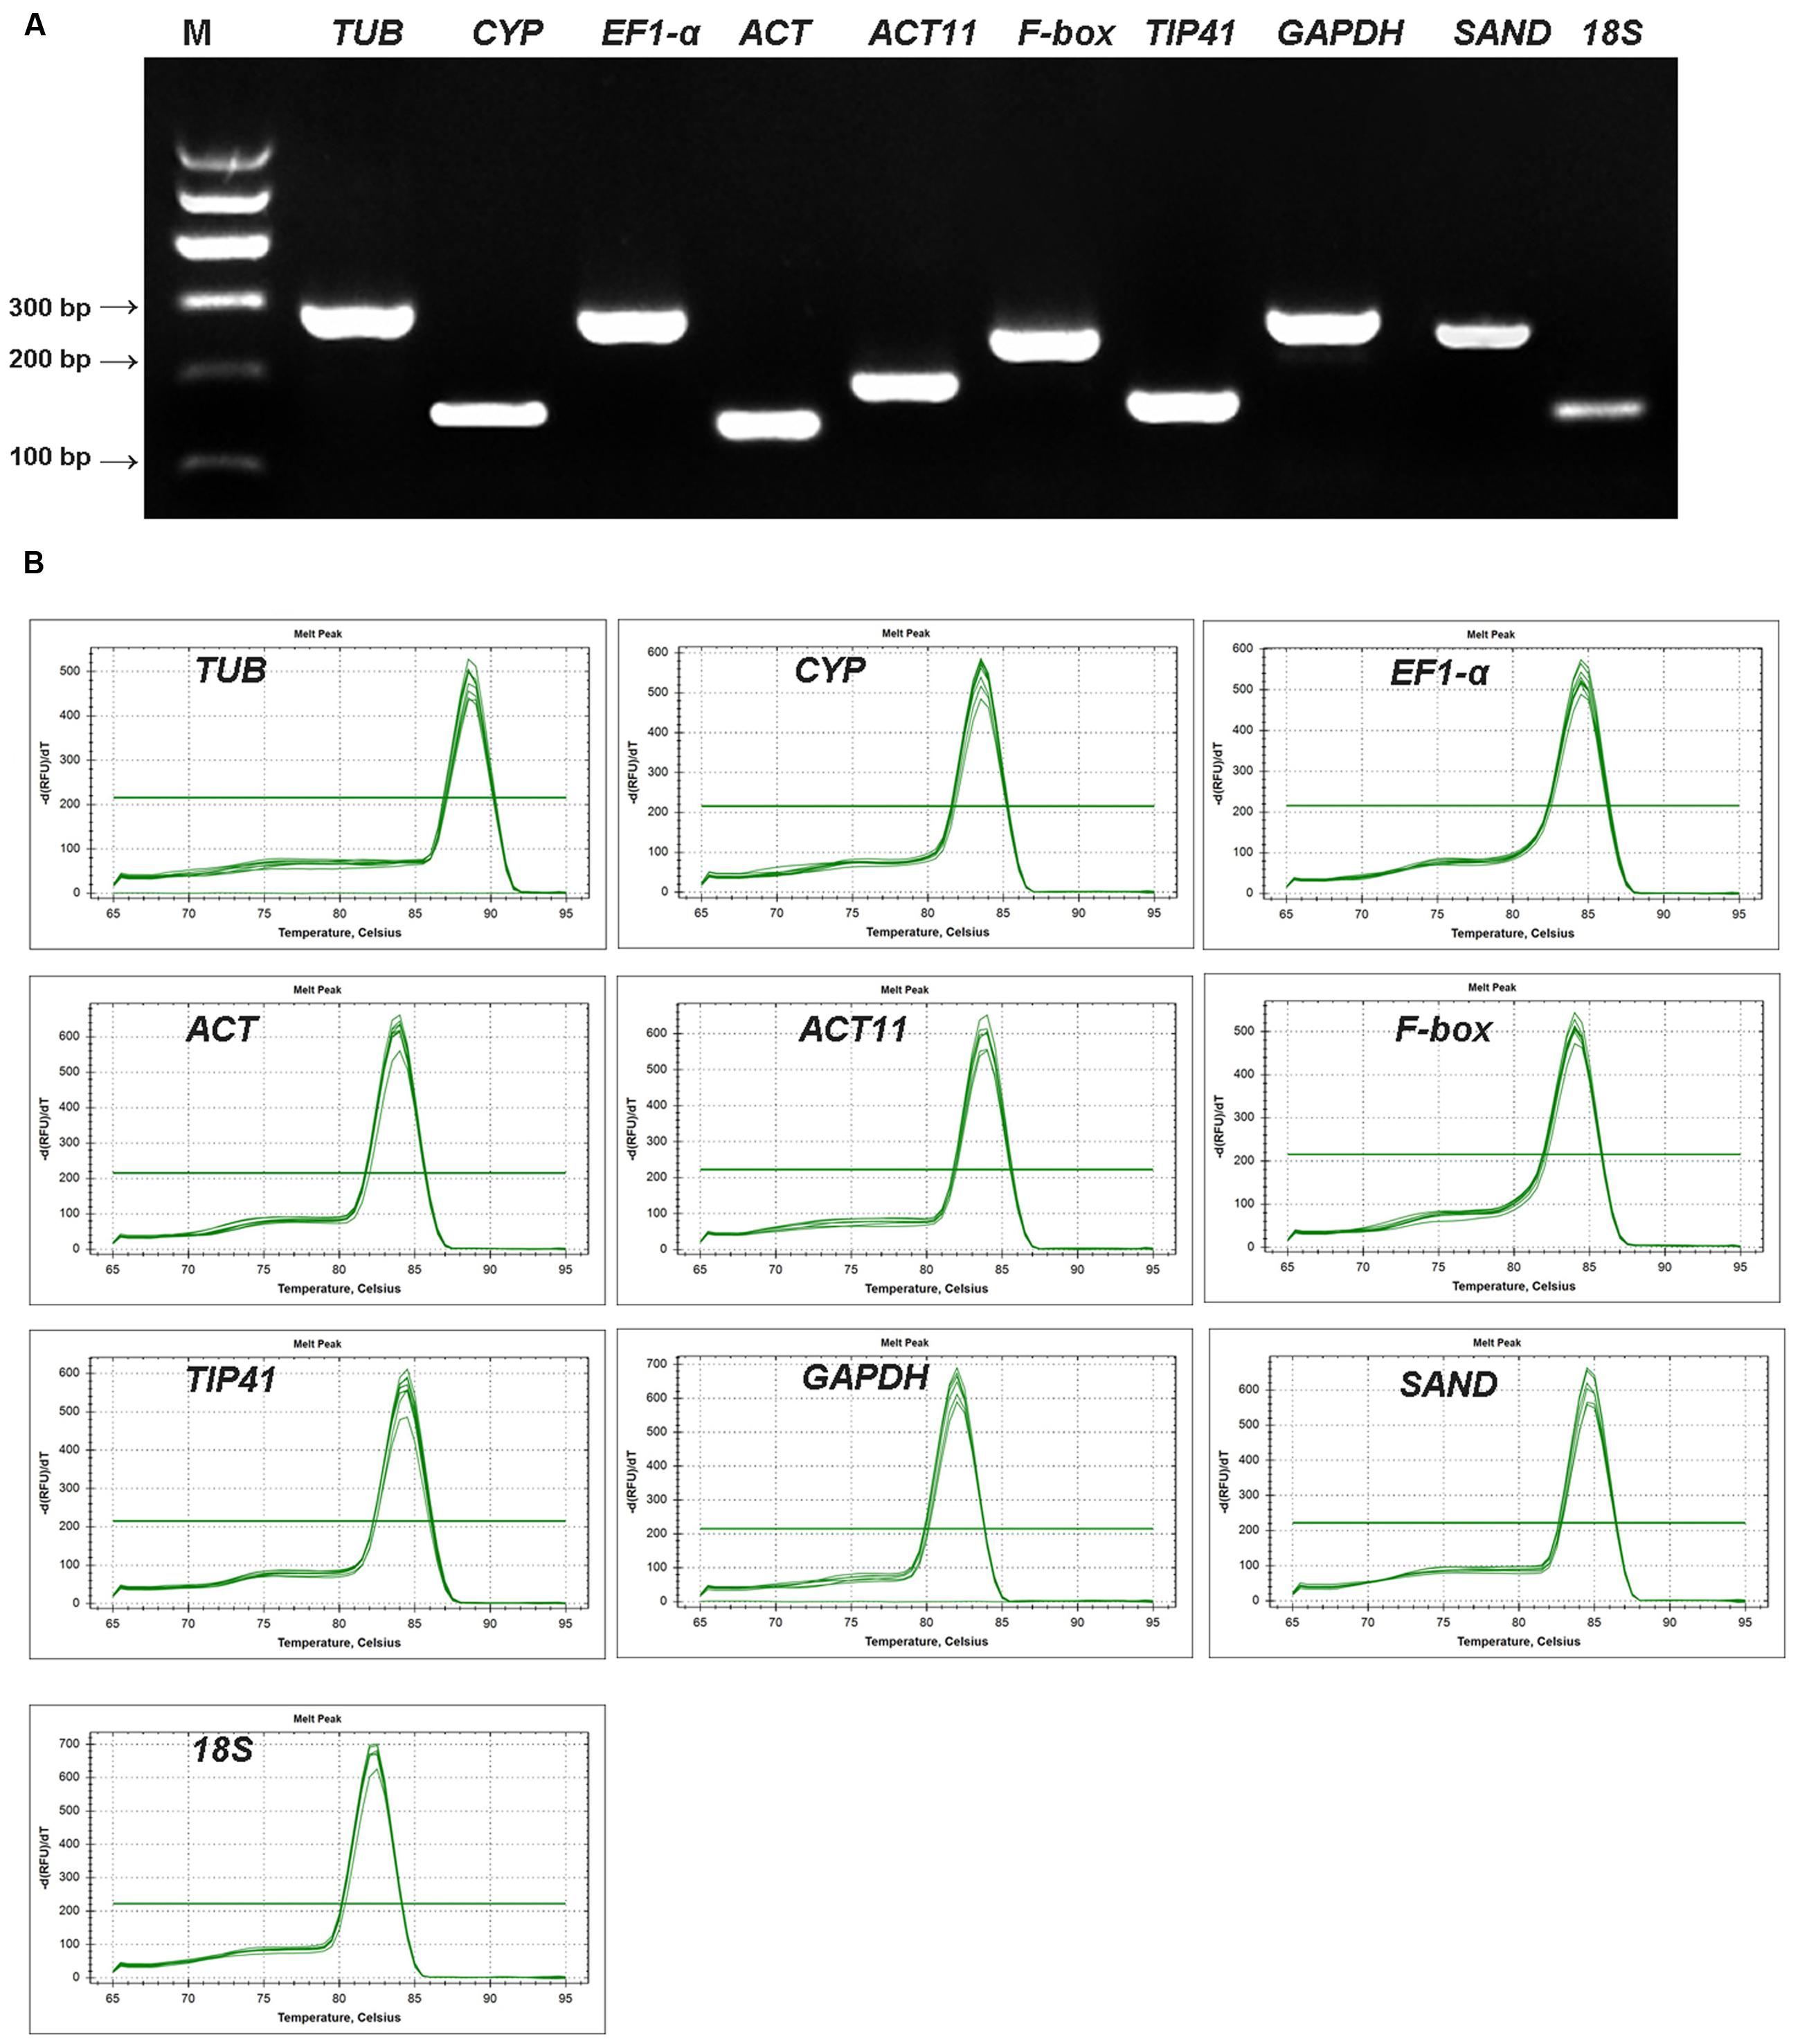
FIGURE 2. Amplification specificity of primers for qRT-PCR amplification. (A) Amplified fragments of ten candidate genes on 2% agarose gel. (B) Melting curves of 10 candidate reference genes.
Cq Values of Candidate Reference Genes
To assess the expression stability of the reference genes in different samples, the transcript abundances of 10 candidate reference genes were presented as their Cq values, which varied from 16.22 (GAPDH) to 32.76 (TUB), while the mean Cq values varied from 20.02 (GAPDH) to 28.39 (18S) (Figure 3).
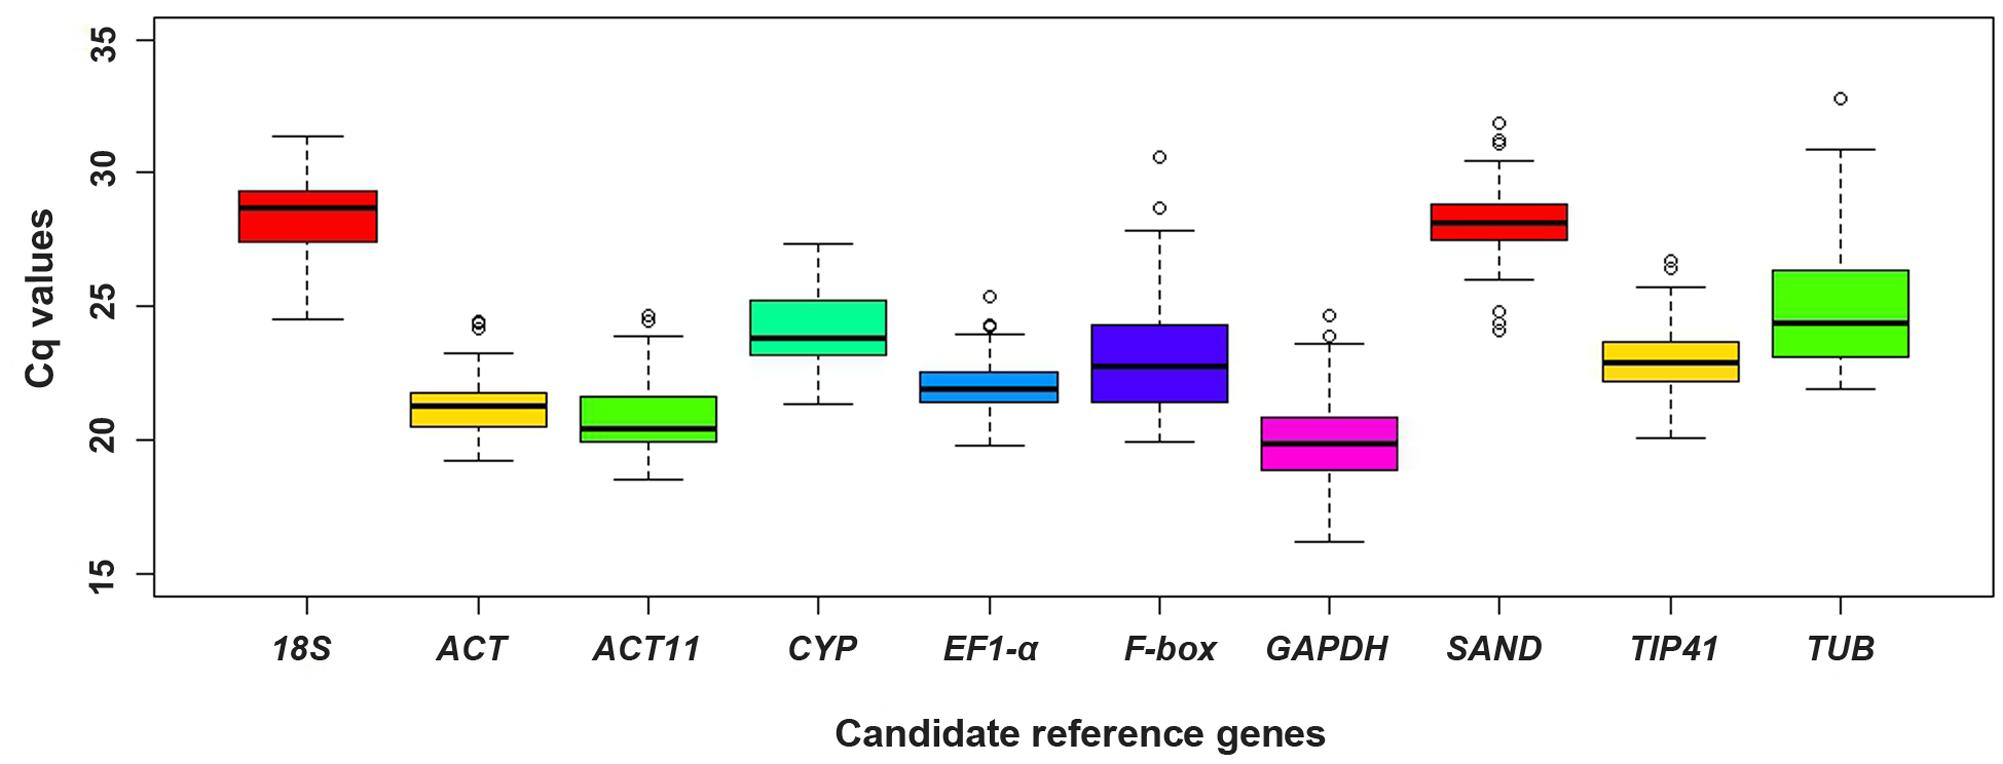
FIGURE 3. Distribution of Cq values of candidate reference genes in all samples. Boxplots show the 25th and 75th percentiles, mean, and outliers.
Analysis of Reference Gene Stability Using Five Bioinformatic Programs
The orders of candidate gene stability ranking under different experimental conditions were determined separately using geNorm, NormFinder, BestKeeper, the comparative ΔCt method, and RefFinder.
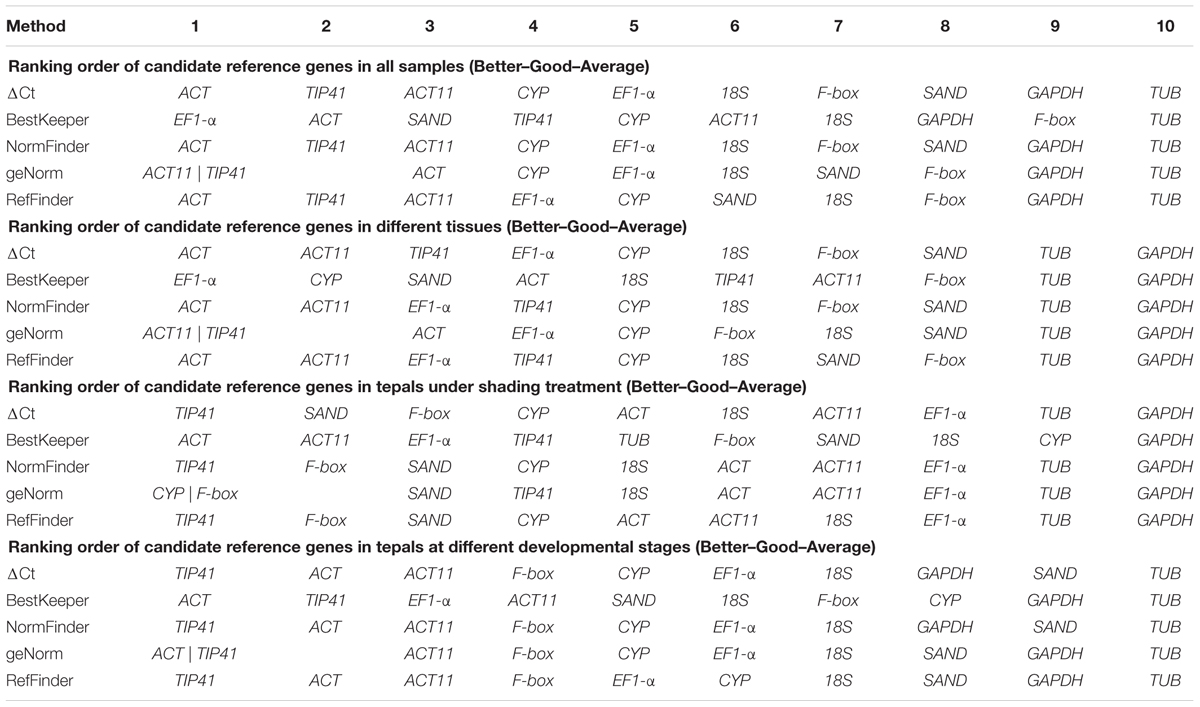
The geNorm program is used to rank the stability of expression of tested genes by calculating their expression stability values (M) based on the average pairwise expression ratio (Vandesompele et al., 2002). Candidate reference genes with lower average expression stability values (M) are considered to be more stably expressed reference genes (Vandesompele et al., 2002). The stability values (M) of tested genes evaluated by geNorm are shown in Figure 4. TIP41 and ACT were ranked as the two most stable genes for tepals at different developmental stages, and ACT11 and TIP41 for different tissues and all samples, while TUB and GAPDH were the two least stable genes. For tepals under shading treatment, CYP and F-box were the two most stable genes with the lowest M-value.
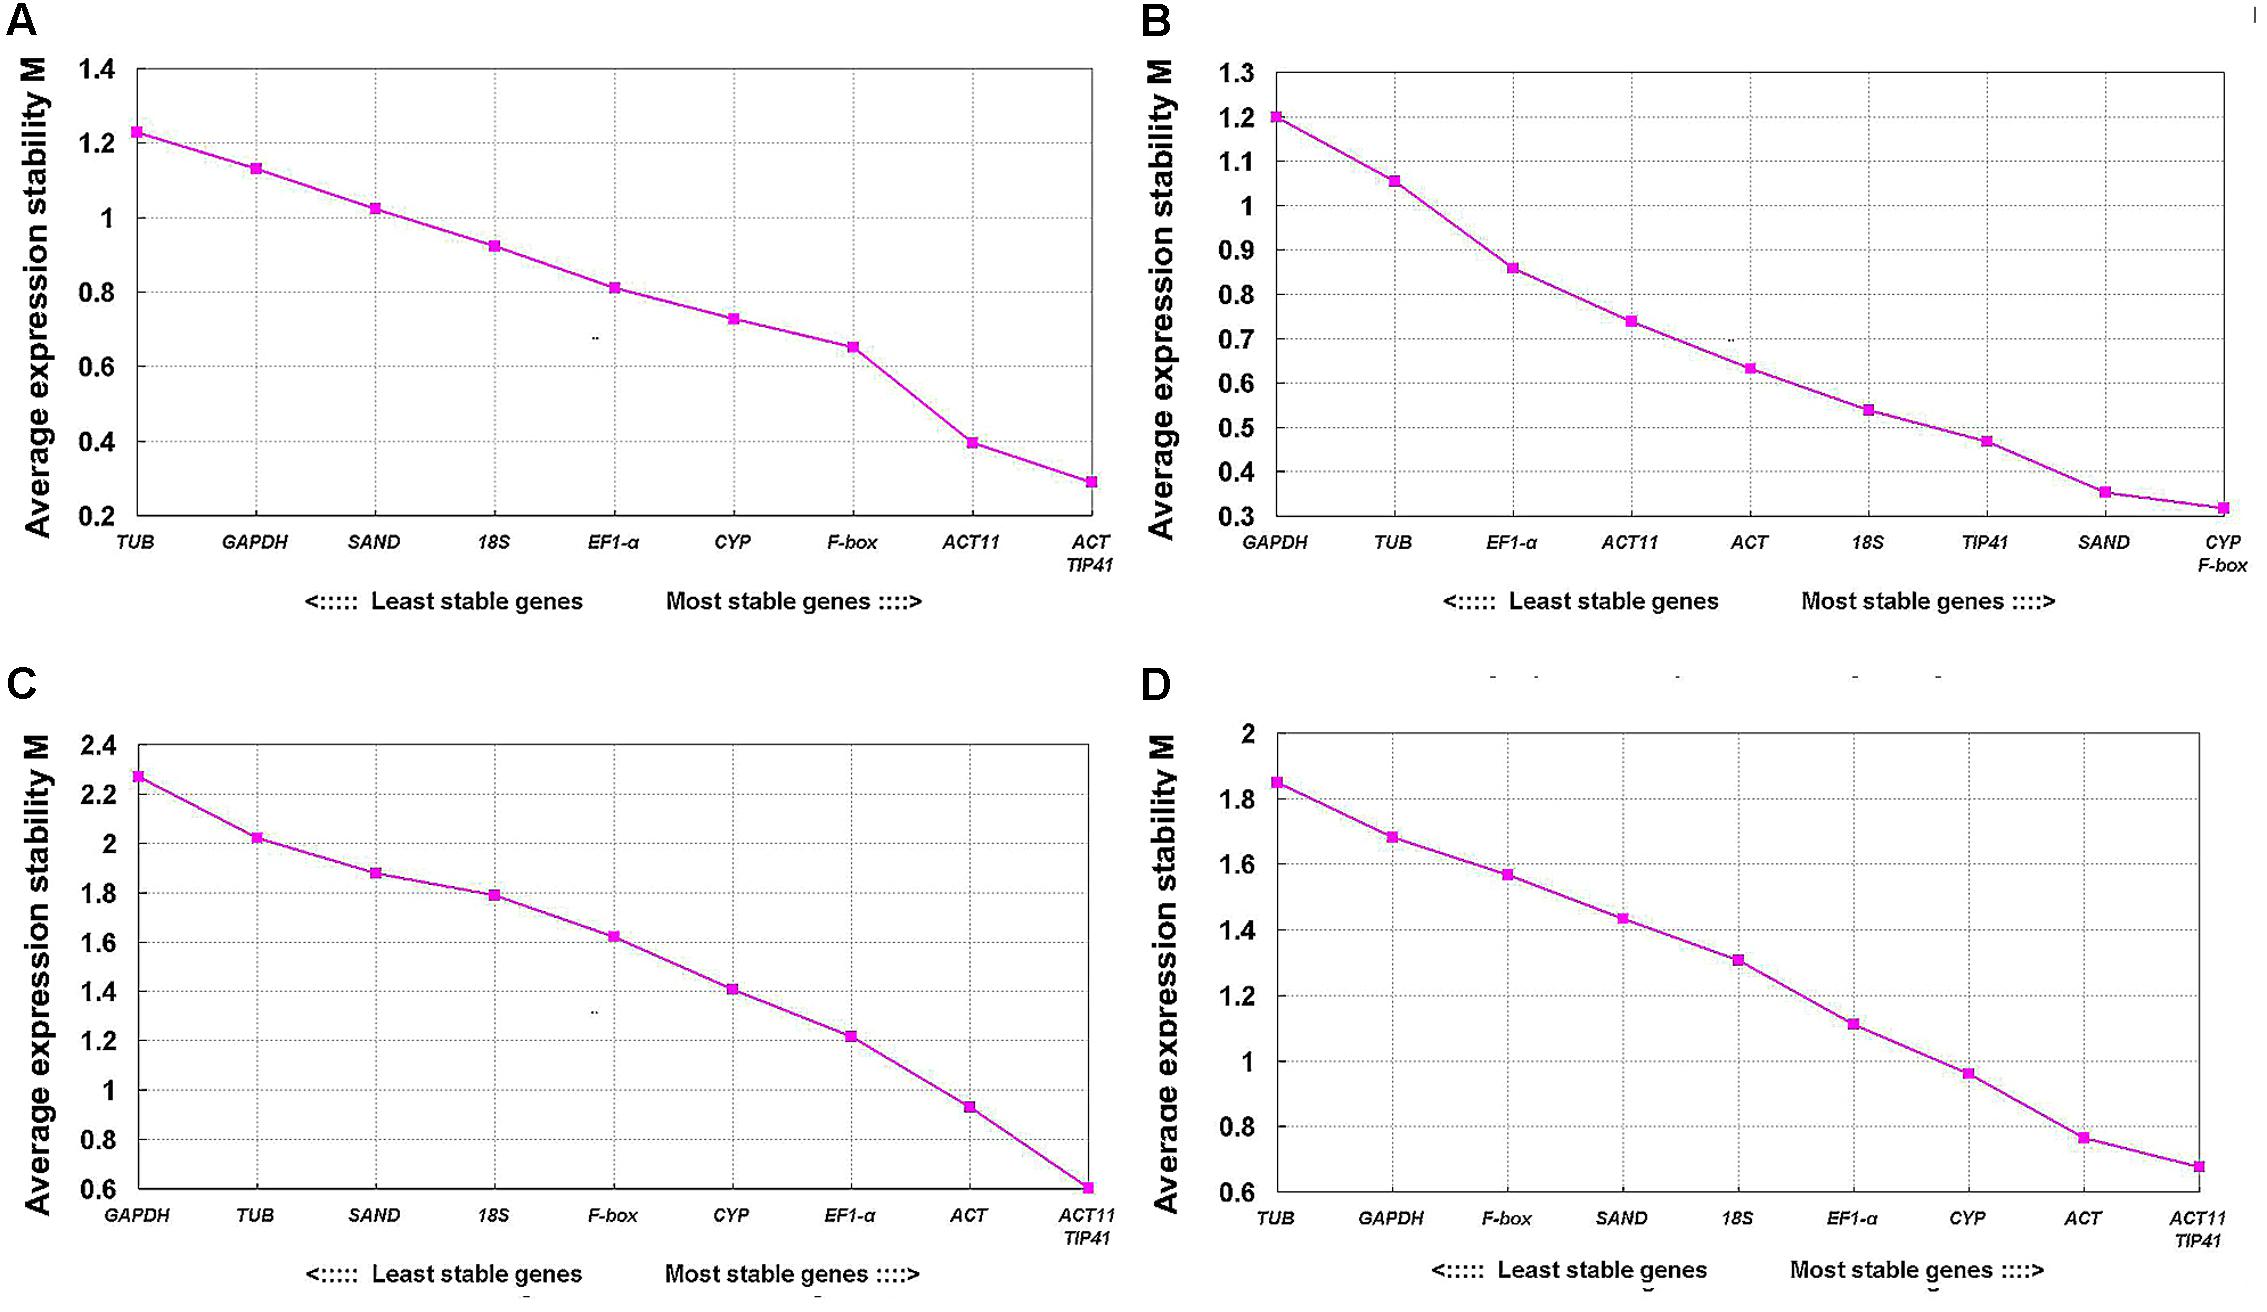
FIGURE 4. Expression stability values (M) of 10 candidate reference genes calculated by geNorm. (A) Upper parts and bases of inner tepals at different developmental stages, (B) tepals under shading treatment, (C) different tissues, and (D) all samples.
The pairwise variation (Vn/Vn + 1) value calculated by the geNorm algorithm determines the optimal number of reference genes for gene expression normalization. A value of Vn/Vn + 1 < 0.15 suggests that the optimal number of reference genes equal to a value of n is sufficient (Vandesompele et al., 2002). In this study, the value of V2/V3 was below 0.15 for tepals at different developmental stages and under shading treatment (Figures 5A,B), indicating that two reference genes would be sufficient for gene normalization under these experimental conditions. However, when different tissues and total samples were considered, all Vn/Vn + 1 values were still above 0.15 (Figures 5C,D), and thus the cut-off value of 0.15 was somewhat strict in these cases. Many studies have shown that the use of 0.15 as a cut-off value is just a recommendation, and whether 0.15 is actually used is dependent on the data (Silveira et al., 2009; Fernandez et al., 2011; Lu et al., 2013; De Lima et al., 2016). Generally, a reliable result could be obtained by using three reference genes in the majority of experiments (Toegel et al., 2007; Maroufi et al., 2010; Wang et al., 2014; Wang and Lu, 2015; Li M.Y. et al., 2016). Considering this, we opted to use three reference genes in these experimental conditions.
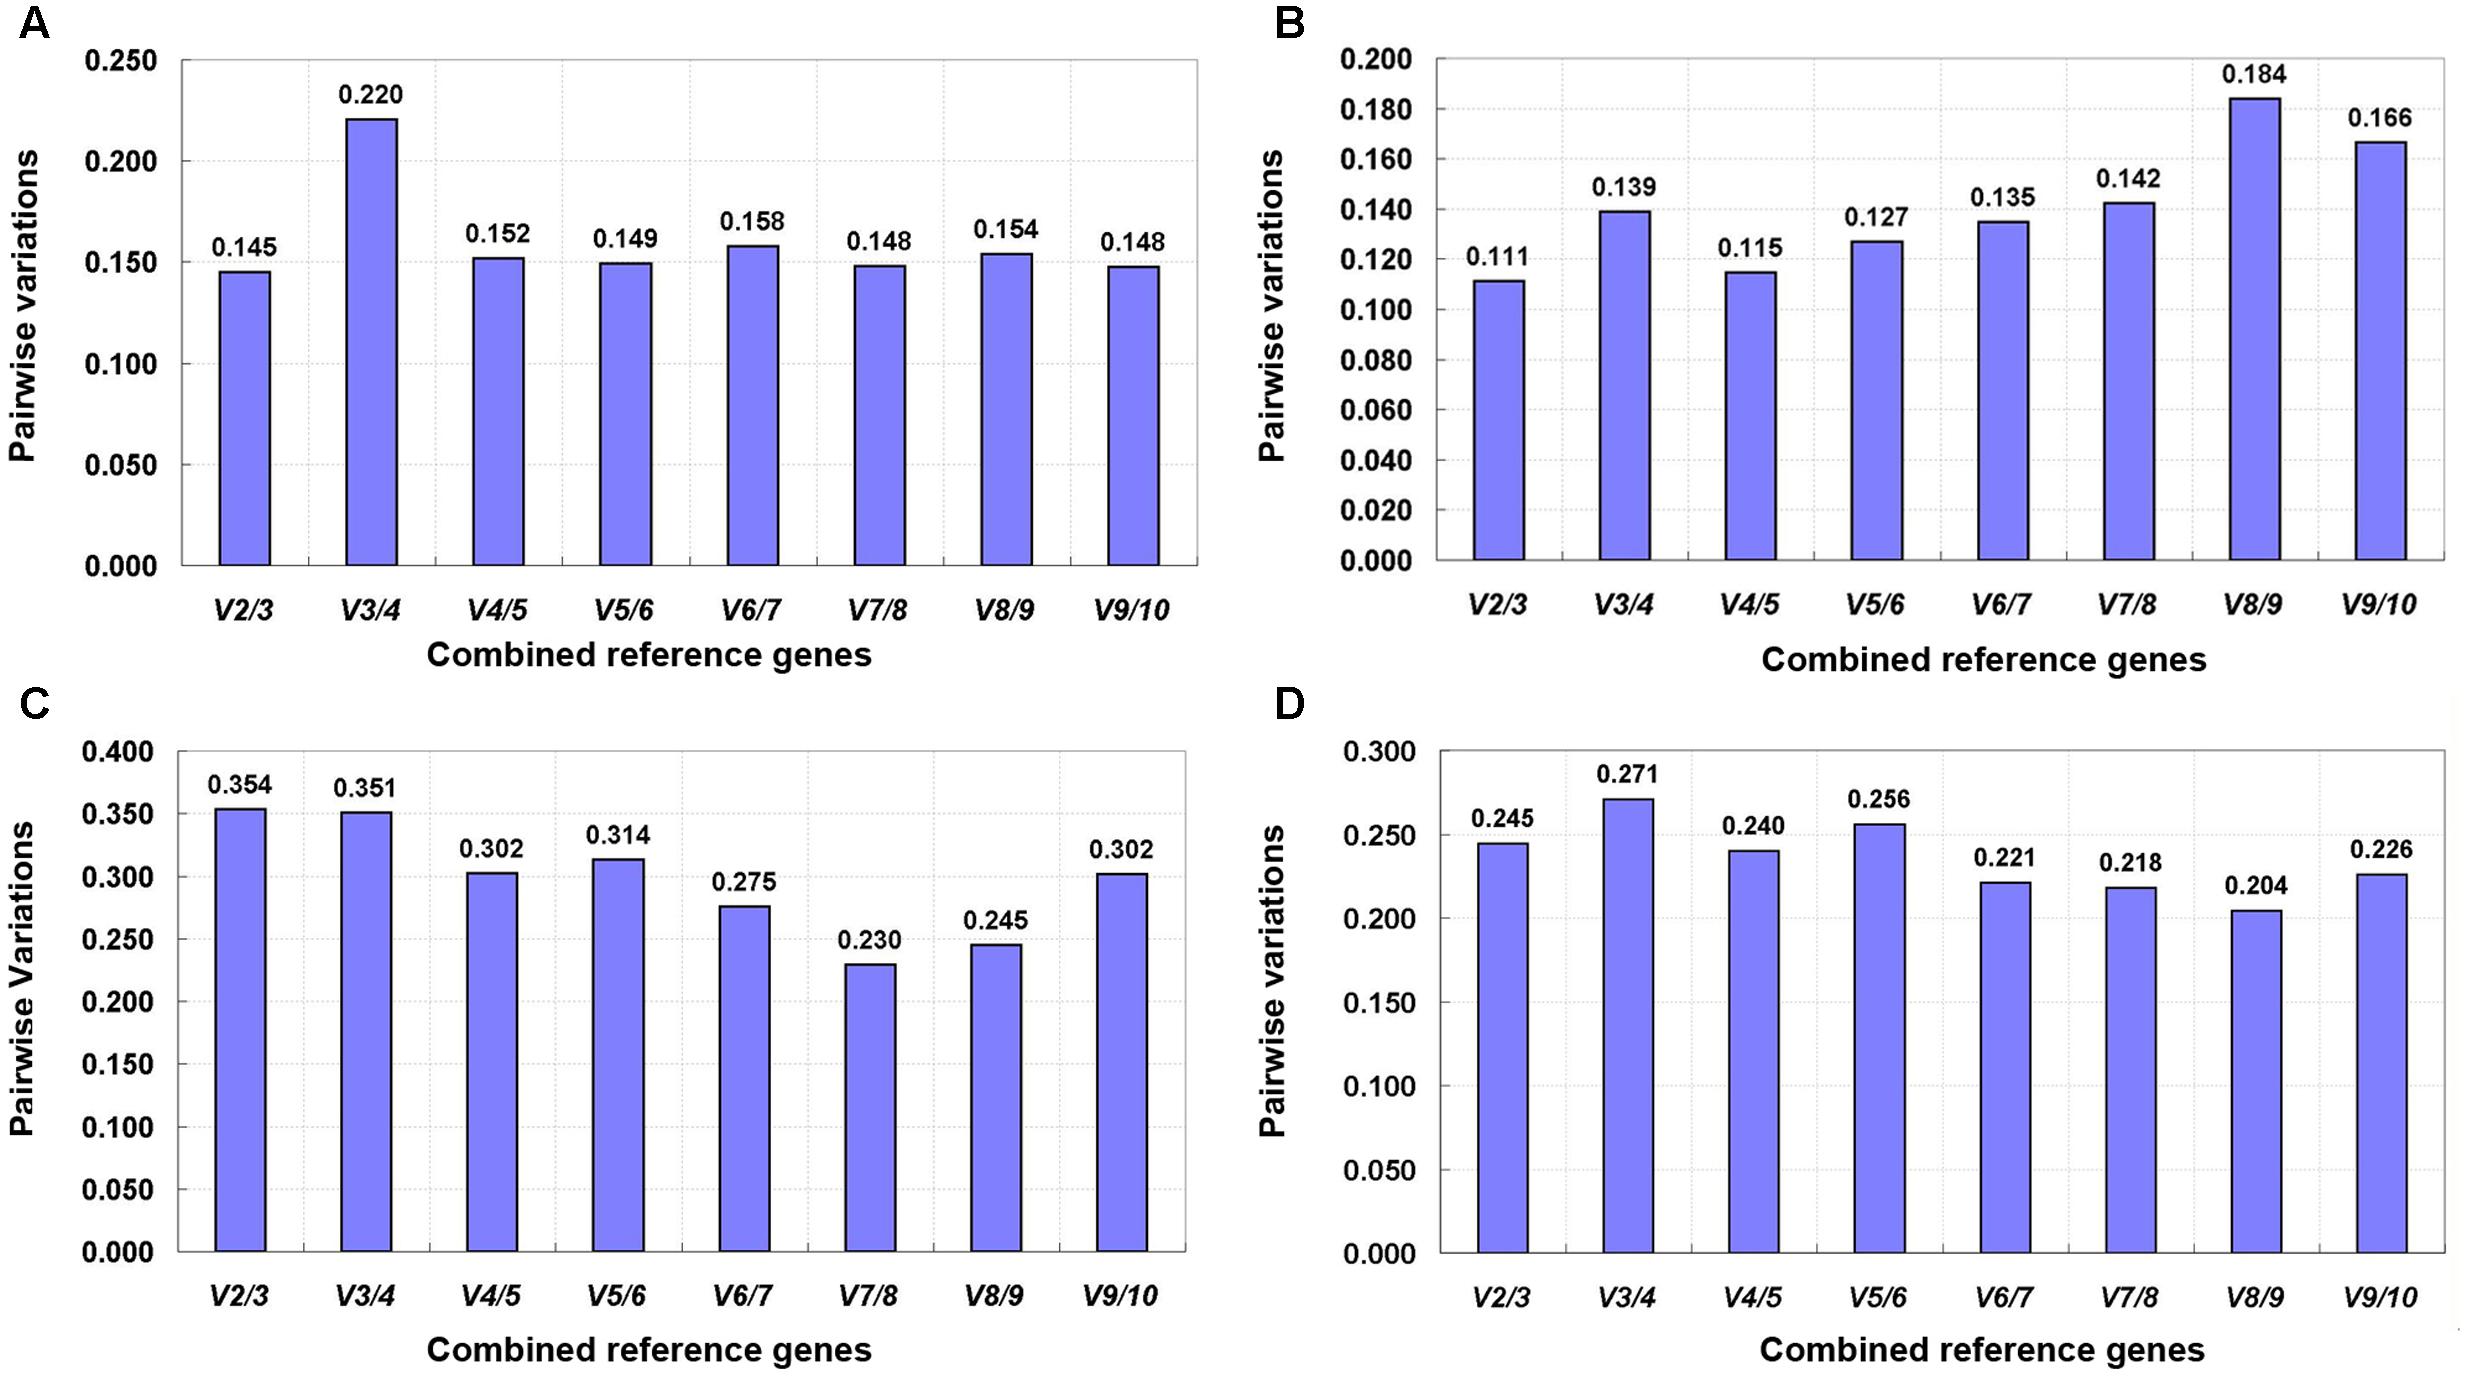
FIGURE 5. Pairwise variation (V) of 10 candidate reference genes calculated by geNorm. (A) Upper parts and bases of inner tepals at different developmental stages, (B) tepals under shading treatment, (C) different tissues, and (D) all samples.
NormFinder ranks the stability of expression of candidate reference genes by calculating the average pairwise variation in a gene relative to that of other candidate genes (Andersen et al., 2004). Genes with the lowest expression stability value are characterized as the most stable reference genes (Andersen et al., 2004). The stability values of tested genes evaluated by NormFinder are listed in Table 2. For different tissues, the most stable gene was ACT, followed by ACT11 and EF1-α. For tepals under shading treatment, TIP41 and F-box were the two most stable genes. For tepals at different developmental stages, the three most stable genes were TIP41, ACT, and ACT11. Finally, ACT was the most stable reference gene while TUB was the least stable one for all samples.
BestKeeper is another software tool for determining the expression stability of reference genes by calculating the coefficient of variation (CV) and the standard deviation (SD) of Cq values (Pfaffl et al., 2004). The most stable reference genes are identified as those with the lowest CV and SD (Pfaffl et al., 2004). In this study, EF1-α and CYP were identified as the most stable genes for different tissues, ACT and ACT11 for tepals under shading treatment, ACT and TIP41 for tepals at different developmental stages, and EF1-α and ACT for all samples (Table 2).
The comparative ΔCt method identifies potential reference genes by comparing the relative expression of gene pairs within each sample (Silver et al., 2006). The ranking orders of the ten tested genes generated by the ΔCt method are shown in Table 2. ACT, TIP41, and ACT11 were the three most stable genes for tepals at different flower developmental stages, different tissues, and all samples. For tepals under shading treatment, the most stable gene was TIP41, followed by SAND and F-box (Table 2).
The ranking orders of the ten tested genes generated by geNorm, NormFinder, BestKeeper, and the comparative ΔCt method showed some differences (Table 2). To provide a comprehensive evaluation of candidate reference genes, further analysis was thus carried out using the web-based comprehensive tool RefFinder, which integrates geNorm, Normfinder, BestKeeper, and the comparative ΔCt method. The comprehensive ranking orders recommended by RefFinder are shown in Table 2. For all samples and tepals at different developmental stages, TIP41, ACT, and ACT11 were ranked as the top three most stable genes. TIP41 and F-box were found to be the most stable genes for tepals under shading treatment, while ACT, ACT11, and EF1-α were the most stable genes for different tissues.
The best combination of reference genes in different experimental sets was determined based on the optimal number of reference genes calculated by geNorm and the ranking list obtained using RefFinder. Specifically, TIP41 and ACT were found to be the best combination of reference genes for tepals at different developmental stages, TIP41 and F-box for tepals under shading treatment, ACT, ACT11, and EF1-α for different tissues, and ACT, TIP41, and ACT11 for all samples.
Validation of the Identified Reference Genes
To validate the selected candidate reference genes, the expression levels of two anthocyanin biosynthesis-related genes (LhF3′H and LhUFGT) were investigated using different reference genes in inner tepals at different developmental stages. Each of the two most stable reference genes (ACT and TIP411), combination of stable genes (ACT + TIP41), and the least stable reference gene (TUB) were used as internal controls. When using ACT alone, TIP41 alone, and the combination of ACT + TIP41 for normalization, LhF3′H and LhUFGT showed the highest expression in tepal bases at S2 and an extremely low level of expression in upper tepals at all four stages (Figure 6). However, when the least stable gene TUB was used for normalization, the expression patterns were completely different. Namely, LhF3′H and LhUFGT had the highest expression levels in tepal bases at S4 (Figure 6).
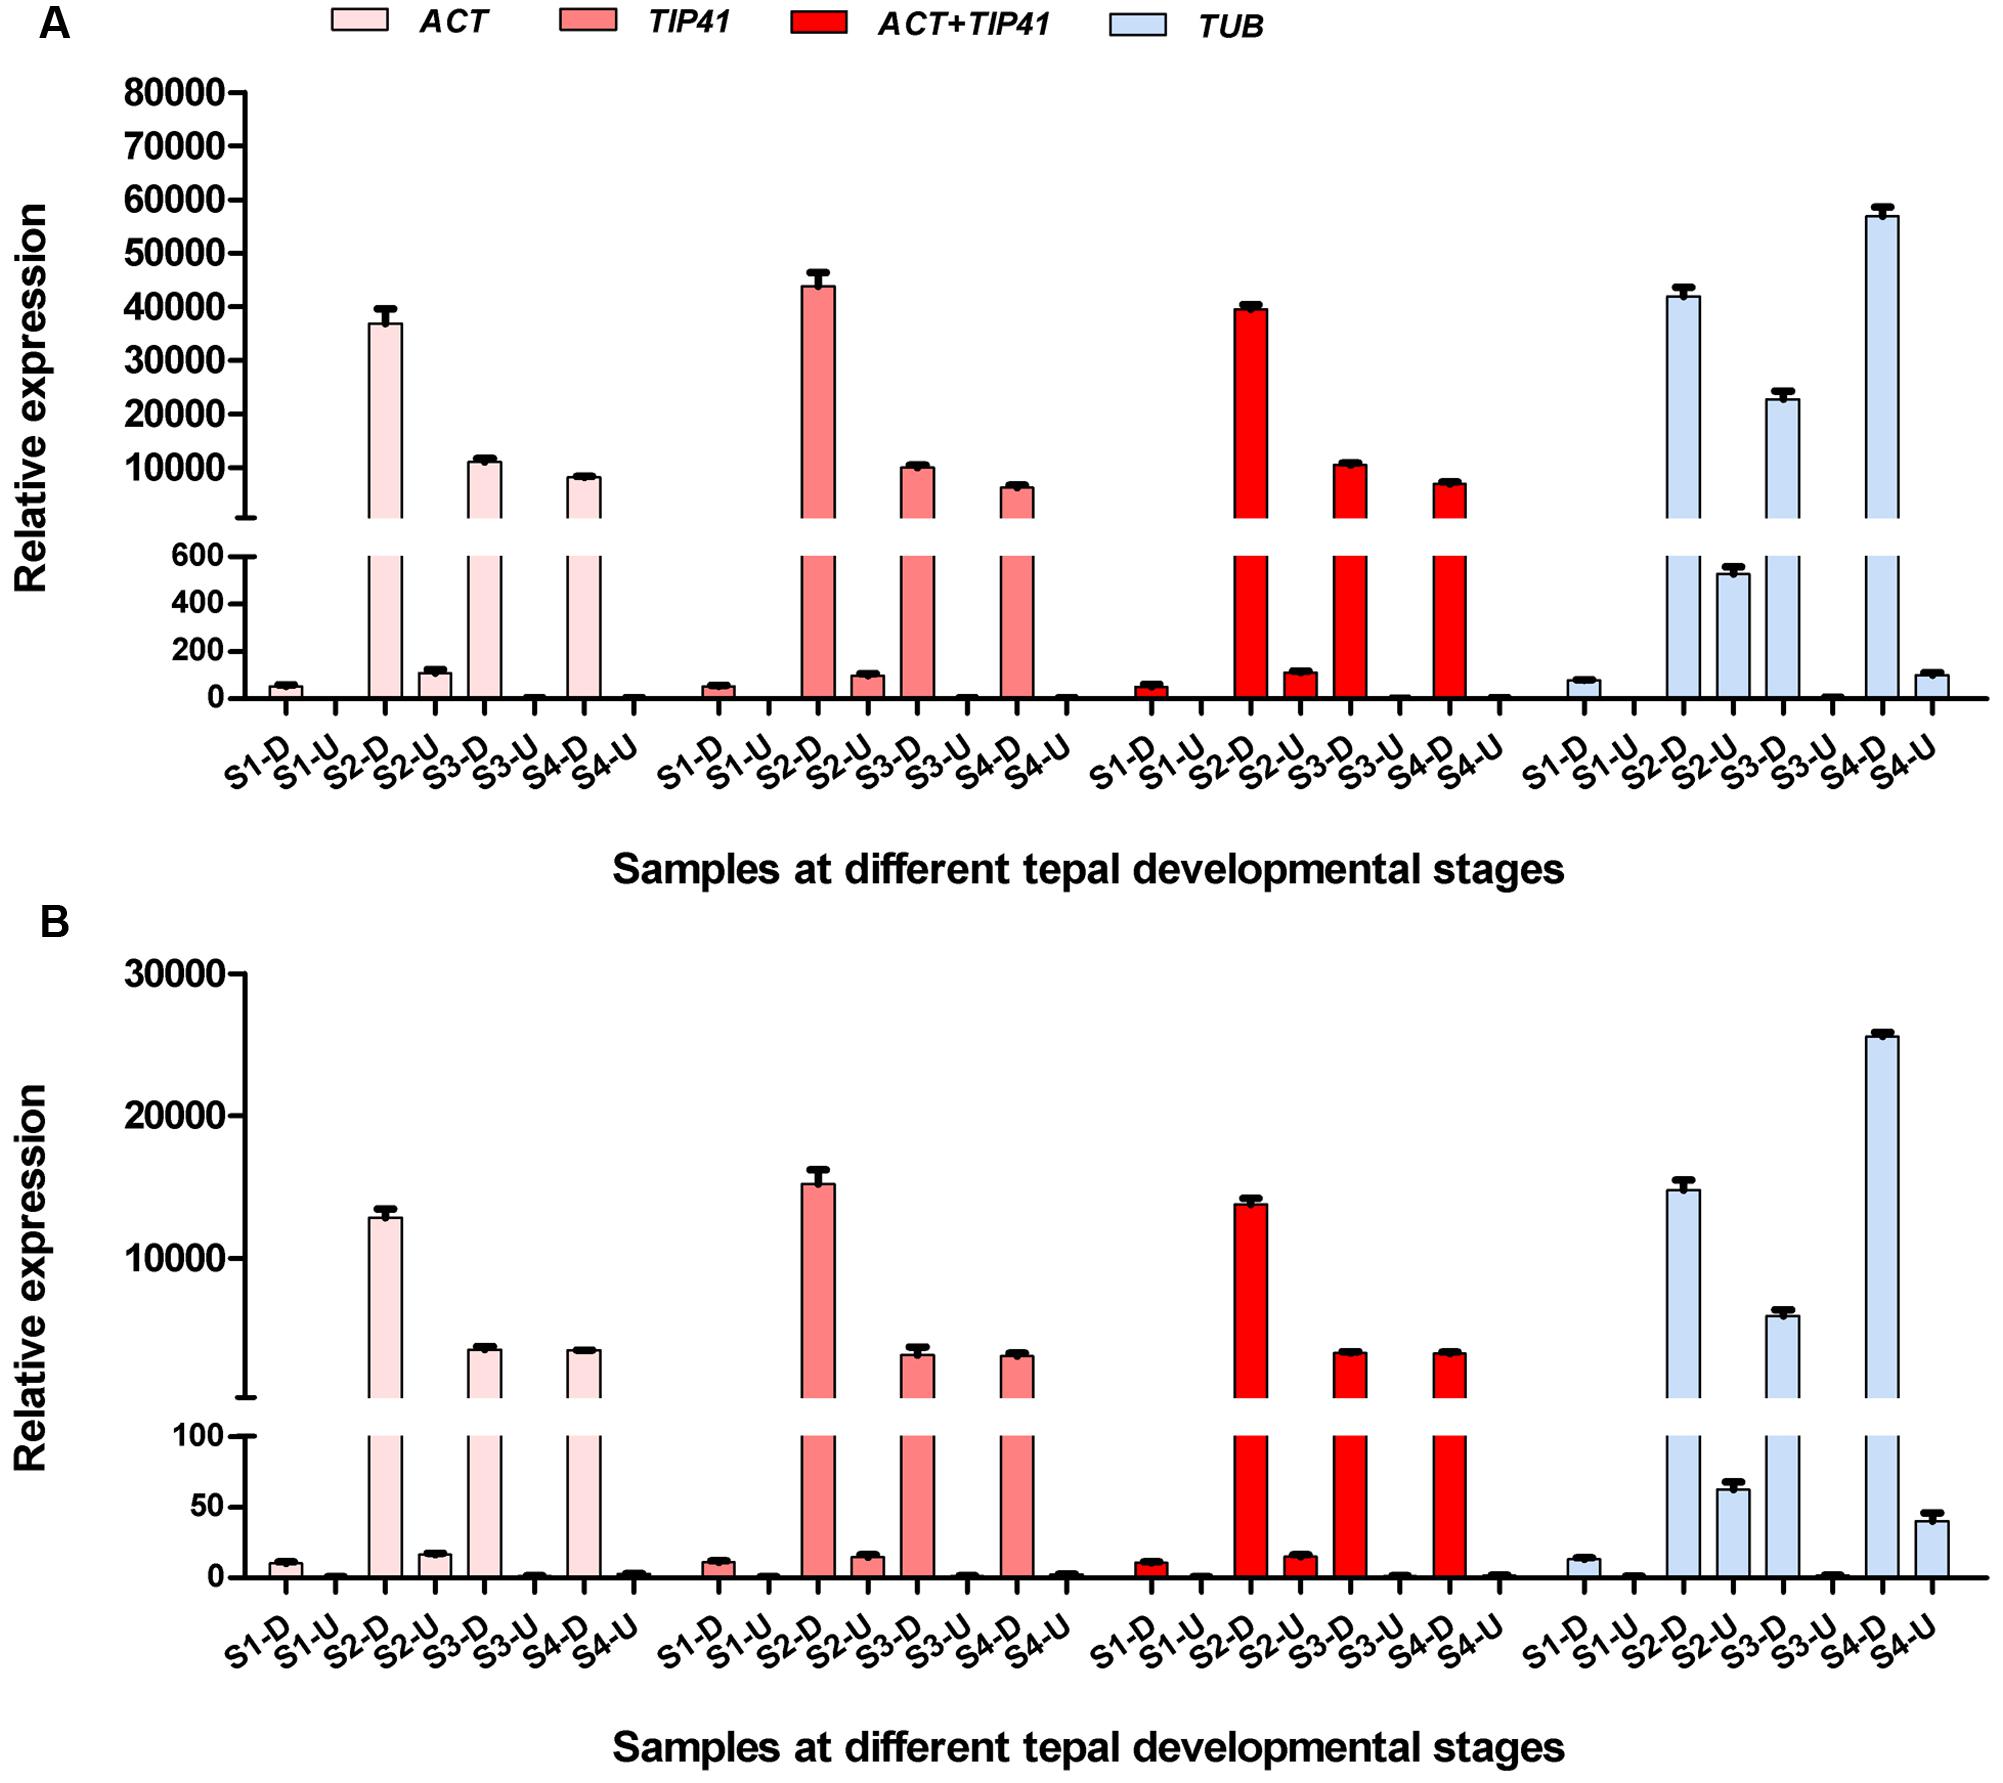
FIGURE 6. Relative expression patterns of LhF3′H (A) and LhUFGT (B) in upper parts and bases of inner tepals at different developmental stages. S1-D, S2-D, S3-D, and S4-D mean inner tepal bases at S1, S2, S3, and S4, respectively. S1-U, S2-U, S3-U, and S4-U mean upper parts of inner tepals at S1, S2, S3, and S4, respectively. Error bars for qRT-PCR show the standard deviation of three replicates.
Discussion
qRT-PCR has become an important technique for the analysis of gene expression because of its sensitivity, accuracy, and high throughput (Bustin, 2002). However, it is necessary to validate reliable reference genes under different experimental conditions prior to qRT-PCR analysis. In this study, the expression stability of 10 candidate reference genes was analyzed in Asiatic ‘Tiny Padhye’ under different experimental conditions. This is the first systematic study on the selection of reliable stable reference genes for qRT-PCR analysis in lily tepals at different developmental stages.
Three software programs (geNorm, NormFinder, and BestKeeper) and the comparative ΔCt method were used to evaluate the expression stability of candidate reference genes in our analysis. The ranking orders of the 10 tested genes generated by different algorithms showed some substantial discrepancies (Table 2). For instance, in tepals under shading treatment, CYP and F-box were the best reference genes identified by geNorm (Table 2 and Figure 4), while ACT was identified as the most stable reference gene by BestKeeper (Table 2), and TIP41 was the best reference gene predicted by NormFinder and the comparative ΔCt method (Table 2). Differences in rankings among these programs have also been reported in other studies (Tong et al., 2009; Delporte et al., 2015; Mangeot-Peter et al., 2016; Sudhakar Reddy et al., 2016), which is likely the result of the different statistical models that they employ. In this study, to provide a comprehensive evaluation of candidate reference genes, the web-based tool RefFinder was used to generate comprehensive stability rankings, and then the best combinations of reference genes in different subsets were determined based on the optimal number of reference genes calculated by geNorm (Figure 5) and the ranking list obtained using RefFinder (Table 2).
In this study, the best combinations of reference genes in different experimental conditions are different. TIP41 and ACT were the best combination of reference genes for tepals at different developmental stages; TIP41 and F-box for tepals under shading treatment; ACT, ACT11, and EF1-α for different tissues; and ACT, TIP41, and ACT11 for all samples. Additionally, GAPDH shows stable expression in different tissues of Lilium brownii (Luo et al., 2014) and Lilium davidii var. Unicolor (Li et al., 2015a). Nevertheless, in our study, it was found to be the least stable reference gene in different tissues of Asiatic ‘Tiny Padhye,’ while ACT was the most stable reference gene. These confirm the importance of validating reliable reference genes prior to qRT-PCR analysis under particular experimental conditions.
To validate the suitability of the identified reference genes, the expression patterns of LhF3′H and LhUFGT were investigated in tepals at different developmental stages using different reference genes. The data once again demonstrated that reference genes play a key role in normalizing the data from qRT-PCR, and the use of inappropriate reference genes may lead to inaccurate results.
There are some limitations in this study that should be mentioned. To avoid the effect of gDNA contamination, intron-spanning primer pairs are regarded as ideal primers for qRT-PCR analysis (Kosir et al., 2010; Eildermann et al., 2012; Carvalho et al., 2015). Unfortunately, since genomic resources for Lilium spp. are still scarce, it is difficult to design intron-spanning primer pairs for the candidate reference genes. However, in this study, a reverse transcription negative control was included to monitor potential genomic DNA contamination. Furthermore, selected reference genes here were limited to 10 traditional housekeeping genes. An increasing number of studies have identified other novel reference genes, such as clathrin adaptor complexes medium subunit family protein (GhMZA) (Artico et al., 2010), clathrin adaptor complexes (CAC) (Xiao et al., 2014), calmodulin-like domain protein kinase (CDPK) (Li et al., 2015b), histone H3 (HIS) (Zhuang et al., 2015), and ribosomal protein L17 (RPL17) (Huang et al., 2016), which can also be evaluated for their expression stability in Lilium spp. in the future.
Author Contributions
JM designed the research. LX, HX, YC, PY, YT, SY, and YF conducted the experiments. LX analyzed the data and wrote the manuscript.
Conflict of Interest Statement
The authors declare that the research was conducted in the absence of any commercial or financial relationships that could be construed as a potential conflict of interest.
Acknowledgments
This study was supported by the National Natural Science Foundation of China (31272205; 31672196), the Fundamental Research Funds for Central Non-profit Scientific Institution, and the Science and Technology Innovation Program of the Chinese Academy of Agricultural Sciences. This research was conducted at the Key Laboratory of Biology and Genetic Improvement of Horticultural Crops, Ministry of Agriculture, China.
Footnotes
References
Andersen, C. L., Jensen, J. L., and Ørntoft, T. F. (2004). Normalization of realtime quantitative reverse transcription-PCR data: a model-based variance estimation approach to identify genes suited for normalization, applied to bladder and colon cancer data sets. Cancer Res. 64, 5245–5250. doi: 10.1158/0008-5472.CAN-04-0496
Artico, S., Nardeli, S. M., Brilhante, O., Grossi-De-Sa, M. F., and Alves-Ferreira, M. (2010). Identification and evaluation of new reference genes in Gossypium hirsutum for accurate normalization of real-time quantitative RT-PCR data. BMC Plant Biol. 10:49. doi: 10.1186/1471-2229-10-49
Bustin, S. A. (2002). Quantification of mRNA using real-time reverse transcription PCR (RT-PCR): trends and problems. J. Mol. Endocrinol. 29, 23–39. doi: 10.1677/jme.0.0290023
Bustin, S. A., Benes, V., Nolan, T., and Pfaffl, M. W. (2005). Quantitative real-time RT-PCR-a perspective. J. Mol. Endocrinol. 34, 597–601. doi: 10.1677/jme.1.01755
Carvalho, L. C., Coito, J. L., Colaco, S., Sangiogo, M., and Amancio, S. (2015). Heat stress in grapevine: the pros and cons of acclimation. Plant Cell Environ. 38, 777–789. doi: 10.1111/pce.12445
De Lima, J. C., De Costa, F., Fuller, T. N., Rodrigues-Correa, K. C., Kerber, M. R., Lima, M. S., et al. (2016). Reference genes for qPCR analysis in resin-tapped adult slash pine as a tool to address the molecular basis of commercial resinosis. Front. Plant Sci. 7:849. doi: 10.3389/fpls.2016.00849
Delporte, M., Legrand, G., Hilbert, J. L., and Gagneul, D. (2015). Selection and validation of reference genes for quantitative real-time PCR analysis of gene expression in Cichorium intybus. Front. Plant Sci. 6:651. doi: 10.3389/fpls.2015.00651
Eildermann, K., Aeckerle, N., Debowski, K., Godmann, M., Christiansen, H., Heistermann, M., et al. (2012). Developmental expression of the pluripotency factor sal-like protein 4 in the monkey, human and mouse testis: restriction to premeiotic germ cells. Cells Tissues Organs 196, 206–220. doi: 10.1159/000335031
Fernandez, P., Di Rienzo, J. A., Moschen, S., Dosio, G. A., Aguirrezabal, L. A., Hopp, H. E., et al. (2011). Comparison of predictive methods and biological validation for qPCR reference genes in sunflower leaf senescence transcript analysis. Plant Cell Rep. 30, 63–74. doi: 10.1007/s00299-010-0944-3
Gutierrez, L., Mauriat, M., Pelloux, J., Bellini, C., and Van Wuytswinkel, O. (2008). Towards a systematic validation of references in real-time RT-PCR. Plant Cell 20, 1734–1735. doi: 10.1105/tpc.108.059774
Huang, X., Gao, Y., Jiang, B., Zhou, Z., and Zhan, A. (2016). Reference gene selection for quantitative gene expression studies during biological invasions: a test on multiple genes and tissues in a model ascidian Ciona savignyi. Gene 576, 79–87. doi: 10.1016/j.gene.2015.09.066
Klie, M., and Debener, T. (2011). Identification of superior reference genes for data normalisation of expression studies via quantitative PCR in hybrid roses (Rosa hybrida). BMC Res. Notes 4:518. doi: 10.1186/1756-0500-4-518
Kosir, R., Acimovic, J., Golicnik, M., Perse, M., Majdic, G., Fink, M., et al. (2010). Determination of reference genes for circadian studies in different tissues and mouse strains. BMC Mol. Biol. 11:60. doi: 10.1186/1471-2199-11-60
Li, J., Han, J., Hu, Y., and Yang, J. (2016). Selection of reference genes for quantitative real-time PCR during flower development in tree peony (Paeonia suffruticosa Andr.). Front. Plant Sci. 7:516. doi: 10.3389/fpls.2016.00516
Li, M. Y., Wang, F., Jiang, Q., Wang, G. L., Tian, C., and Xiong, A. S. (2016). Validation and comparison of reference genes for qPCR normalization of celery (Apium graveolens) at different development stages. Front. Plant Sci. 7:313. doi: 10.3389/fpls.2016.00313
Li, W., Qian, Y. Q., Han, L., Liu, J. X., and Sun, Z. Y. (2014). Identification of suitable reference genes in buffalo grass for accurate transcript normalization under various abiotic stress conditions. Gene 547, 55–62. doi: 10.1016/j.gene.2014.06.015
Li, X., Cheng, J., Zhang, J., Teixeira Da Silva, J. A., Wang, C., and Sun, H. (2015a). Validation of reference genes for accurate normalization of gene expression in Lilium davidii var. unicolor for Real Time Quantitative PCR. PLoS ONE 10:e0141323. doi: 10.1371/journal.pone.0141323
Li, X., Zhang, D., Li, H., Gao, B., Yang, H., Zhang, Y., et al. (2015b). Characterization of reference genes for RT-qPCR in the desert moss Syntrichia caninervis in response to abiotic stress and desiccation/rehydration. Front. Plant Sci. 6:38. doi: 10.3389/fpls.2015.00038
Liu, Q., Wei, C., Zhang, M. F., and Jia, G. X. (2016). Evaluation of putative reference genes for quantitative real-time PCR normalization in Lilium regale during development and under stress. PeerJ 4:e1837. doi: 10.7717/peerj.1837
Livak, K. J., and Schmittgen, T. D. (2001). Analysis of relative gene expression data using real-time quantitative PCR and the 2(-Delta Delta C(T)) Method. Methods 25, 402–408. doi: 10.1006/meth.2001.1262
Lu, Y. H., Yuan, M., Gao, X. W., Kang, T. H., Zhan, S., Wan, H., et al. (2013). Identification and validation of reference genes for gene expression analysis using quantitative PCR in Spodoptera litura (Lepidoptera: Noctuidae). PLoS ONE 8:e68059. doi: 10.1371/journal.pone.0068059
Luo, H. L., Luo, L. P., Guan, B. C., Li, E. X., Xiong, D. J., Sun, B. T., et al. (2014). Evaluation of candidate reference genes for RT-qPCR in lily (Lilium brownii). J. Hortic. Sci. Biotechnol. 89, 345–351. doi: 10.1080/14620316.2014.11513089
Mallona, I., Lischewski, S., Weiss, J., Hause, B., and Egea-Cortines, M. (2010). Validation of reference genes for quantitative real-time PCR during leaf and flower development in Petunia hybrida. BMC Plant Biol. 10:4. doi: 10.1186/1471-2229-10-4
Mangeot-Peter, L., Legay, S., Hausman, J. F., Esposito, S., and Guerriero, G. (2016). Identification of reference genes for RT-qPCR data normalization in Cannabis sativa stem tissues. Int. J. Mol. Sci. 17, E1556. doi: 10.3390/ijms17091556
Maroufi, A., Van Bockstaele, E., and De Loose, M. (2010). Validation of reference genes for gene expression analysis in chicory (Cichorium intybus) using quantitative real-time PCR. BMC Mol. Biol. 11:15. doi: 10.1186/1471-2199-11-15
Nicot, N., Hausman, J. F., Hoffmann, L., and Evers, D. (2005). Housekeeping gene selection for real-time RT-PCR normalization in potato during biotic and abiotic stress. J. Exp. Bot. 56, 2907–2914. doi: 10.1093/jxb/eri285
Nolan, T., Hands, R. E., and Bustin, S. A. (2006). Quantification of mRNA using real-time RT-PCR. Nat. Protoc. 1, 1559–1582. doi: 10.1038/nprot.2006.236
Pfaffl, M. W., Tichopad, A., Prgomet, C., and Neuvians, T. P. (2004). Determination of stable housekeeping genes, differentially regulated target genes and sample integrity: bestKeeper-Excel-based tool using pair-wise correlations. Biotechnol. Lett. 26, 509–515. doi: 10.1023/B:BILE.0000019559.84305.47
Qi, S., Yang, L., Wen, X., Hong, Y., Song, X., Zhang, M., et al. (2016). Reference gene selection for RT-qPCR analysis of flower development in Chrysanthemum morifolium and Chrysanthemum lavandulifolium. Front. Plant Sci. 7:287. doi: 10.3389/fpls.2016.00287
Silveira, E. D., Alves-Ferreira, M., Guimaraes, L. A., Da Silva, F. R., and Carneiro, V. T. (2009). Selection of reference genes for quantitative real-time PCR expression studies in the apomictic and sexual grass Brachiaria brizantha. BMC Plant Biol. 9:84. doi: 10.1186/1471-2229-9-84
Silver, N., Best, S., Jiang, J., and Thein, S. L. (2006). Selection of housekeeping genes for gene expression studies in human reticulocytes using real-time PCR. BMC Mol. Biol. 7:33. doi: 10.1186/1471-2199-7-33
Sinha, P., Saxena, R. K., Singh, V. K., Krishnamurthy, L., and Varshney, R. K. (2015). Selection and validation of housekeeping genes as reference for gene expression studies in Pigeonpea (Cajanus cajan) under heat and salt stress conditions. Front. Plant Sci. 6:1071. doi: 10.3389/fpls.2015.01071
Sudhakar Reddy, P., Srinivas Reddy, D., Sivasakthi, K., Bhatnagar-Mathur, P., Vadez, V., and Sharma, K. K. (2016). Evaluation of Sorghum [Sorghum bicolor (L.)] reference genes in various tissues and under abiotic stress conditions for quantitative real-time PCR data normalization. Front. Plant Sci. 7:529. doi: 10.3389/fpls.2016.00529
Toegel, S., Huang, W., Piana, C., Unger, F. M., Wirth, M., Goldring, M. B., et al. (2007). Selection of reliable reference genes for qPCR studies on chondroprotective action. BMC Mol. Biol. 8:13. doi: 10.1186/1471-2199-8-13
Tong, Z., Gao, Z., Wang, F., Zhou, J., and Zhang, Z. (2009). Selection of reliable reference genes for gene expression studies in peach using real-time PCR. BMC Mol. Biol. 10:71. doi: 10.1186/1471-2199-10-71
Vandesompele, J., De Preter, K., Pattyn, F., Poppe, B., Van Roy, N., De Paepe, A., et al. (2002). Accurate normalization of real-time quantitative RT-PCR data by geometric averaging of multiple internal control genes. Genome Biol. 3, 1–12. doi: 10.1186/gb-2002-3-7-research0034
Wang, J., Wang, Y., Wang, H., Hao, X., Wu, Y., and Guo, J. (2014). Selection of reference genes for gene expression studies in porcine whole blood and peripheral blood mononuclear cells under polyinosinic:polycytidylic acid stimulation. Asian-Australas. J. Anim. Sci. 27, 471–478. doi: 10.5713/ajas.2013.13471
Wang, M., and Lu, S. (2015). Validation of suitable reference genes for quantitative gene expression analysis in Panax ginseng. Front. Plant Sci. 6:1259. doi: 10.3389/fpls.2015.01259
Wong, M. L., and Medrano, J. F. (2005). Real-time PCR for mRNA quantitation. Biotechniques 39, 75–85. doi: 10.2144/05391RV01
Xiao, X., Ma, J., Wang, J., Wu, X., Li, P., and Yao, Y. (2014). Validation of suitable reference genes for gene expression analysis in the halophyte Salicornia europaea by real-time quantitative PCR. Front. Plant Sci. 5:788. doi: 10.3389/fpls.2014.00788
Xiao, Z., Sun, X., Liu, X., Li, C., He, L., Chen, S., et al. (2016). Selection of reliable reference genes for gene expression studies on Rhododendron molle G. Don. Front. Plant Sci. 7:1547. doi: 10.3389/fpls.2016.01547
Xu, L., Yang, P., Yuan, S., Feng, Y., Xu, H., Cao, Y., et al. (2016). Transcriptome analysis identifies key candidate genes mediating purple ovary coloration in asiatic hybrid lilies. Int. J. Mol. Sci. 17:E1881. doi: 10.3390/ijms17111881
Zhang, L., He, L. L., Fu, Q. T., and Xu, Z. F. (2013). Selection of reliable reference genes for gene expression studies in the biofuel plant Jatropha curcas using real-time quantitative PCR. Int. J. Mol. Sci. 14, 24338–24354. doi: 10.3390/ijms141224338
Keywords: Lilium spp., bicolor tepal, tepal development, quantitative real-time PCR, reference gene
Citation: Xu L, Xu H, Cao Y, Yang P, Feng Y, Tang Y, Yuan S and Ming J (2017) Validation of Reference Genes for Quantitative Real-Time PCR during Bicolor Tepal Development in Asiatic Hybrid Lilies (Lilium spp.). Front. Plant Sci. 8:669. doi: 10.3389/fpls.2017.00669
Received: 07 January 2017; Accepted: 11 April 2017;
Published: 25 April 2017.
Edited by:
Roger Deal, Emory University, USAReviewed by:
M. Teresa Sanchez-Ballesta, Instituto de Ciencia y Tecnología de Alimentos y Nutrición (CSIC), SpainYuhui Chen, Samuel Roberts Noble Foundation, USA
Copyright © 2017 Xu, Xu, Cao, Yang, Feng, Tang, Yuan and Ming. This is an open-access article distributed under the terms of the Creative Commons Attribution License (CC BY). The use, distribution or reproduction in other forums is permitted, provided the original author(s) or licensor are credited and that the original publication in this journal is cited, in accordance with accepted academic practice. No use, distribution or reproduction is permitted which does not comply with these terms.
*Correspondence: Jun Ming, bWluZ2p1bkBjYWFzLmNu
 Leifeng Xu
 Hua Xu1