Abstract
Chloroplast DNA (cpDNA) is frequently used for species demography, evolution, and species discrimination of plants. However, the lack of efficient and universal markers often brings particular challenges for genetic studies across different plant groups. In this study, chloroplast genomes from two closely related species (Quercus rubra and Castanea mollissima) in Fagaceae were compared to explore universal cpDNA markers for the Chinese oak species in Quercus subgenus Quercus, a diverse species group without sufficient molecular differentiation. With the comparison, nine and 14 plastid markers were selected as barcoding and phylogeographic candidates for the Chinese oaks. Five (psbA-trnH, matK-trnK, ycf3-trnS, matK, and ycf1) of the nine plastid candidate barcodes, with the addition of newly designed ITS and a single-copy nuclear gene (SAP), were then tested on 35 Chinese oak species employing four different barcoding approaches (genetic distance-, BLAST-, character-, and tree-based methods). The four methods showed different species identification powers with character-based method performing the best. Of the seven barcodes tested, a barcoding gap was absent in all of them across the Chinese oaks, while ITS and psbA-trnH provided the highest species resolution (30.30%) with the character- and BLAST-based methods, respectively. The six-marker combination (psbA-trnH + matK-trnK + matK + ycf1 + ITS + SAP) showed the best species resolution (84.85%) using the character-based method for barcoding the Chinese oaks. The barcoding results provided additional implications for taxonomy of the Chinese oaks in subg. Quercus, basically identifying three major infrageneric clades of the Chinese oaks (corresponding to Groups Quercus, Cerris, and Ilex) referenced to previous phylogenetic classification of Quercus. While the morphology-based allocations proposed for the Chinese oaks in subg. Quercus were challenged. A low variation rate of the chloroplast genome, and complex speciation patterns involving incomplete lineage sorting, interspecific hybridization and introgression, possibly have negative impacts on the species assignment and phylogeny of oak species.
Introduction
Chloroplast DNA (cpDNA), which is maternally inherited most angiosperm taxa, is considered a useful tool to trace demographic history, explore species divergence and identify species (Thomson et al., 2010; van Velzen et al., 2012; Greiner et al., 2014). The utility of cpDNA is highly manifested by the increasing number of phylogeographic and phylogenetic studies during recent decades (Hickerson et al., 2010; Qiu et al., 2011; Liu et al., 2012). For recently diverged plant species, uniparental inherited cpDNA with high levels of intraspecific genetic diversity and differentiation can provide data to infer population dynamics and phylogeographic patterns (Tzedakis et al., 2013). In addition, when chloroplast gene loci have diverged from a common ancestor and have evolved independently, they are expected to possess interspecific discrepancies, namely the “DNA barcode,” which are expected to be powerful tools for species discrimination, facilitating the recognition of new species as well as biodiversity assessment thus providing useful information for the development of conservation strategies (Kress et al., 2005; Hollingsworth et al., 2011; Krishnamurthy and Francis, 2012; Taylor and Harris, 2012; Li et al., 2015).
Along with traditional morphology-based taxonomy, DNA barcoding, using one or several of the proposed DNA regions to identify species, is particularly useful for taxonomists (DeSalle et al., 2005; Chase et al., 2007; CBOL Plant Working Group, 2009). In contrast to the portion of the mitochondrial Cytochrome Oxidase 1 (COI), which seems common and sufficient to fulfill almost all animal barcodes (Hebert et al., 2003), suitable barcodes to distinguish plant species include some plastid regions such as rbcL, matK, and trnH-psbA, as well as the nuclear ribosomal internal transcribed spacer (ITS) (Kress and Erickson, 2007; CBOL Plant Working Group, 2009; China Plant BOL Group, 2011; Wang X. C. et al., 2015). Additionally, low (single)-copy nuclear loci related to strong reproductive isolation, which serve as the “speciation genes,” may also be potentially useful in species discrimination, albeit designing universal primers for the low (single)-copy nuclear genes are difficult (Wu, 2001; Chase et al., 2005; Ran et al., 2010; Wang et al., 2011). For land plants, although a number of DNA barcodes have been evaluated, special interests and challenges are still under exploration in identifying closely related or recently evolved species, especially within species-rich genera (Liu et al., 2011; Yan et al., 2015). Failures of DNA barcoding to properly discriminate recently diverged species may be due to incomplete lineage sorting or lack of a “barcode gap,” and related to large effective population size as well as low evolutionary rate of species (van Velzen et al., 2012). Additionally, insufficient sampling in a species-rich genus and a lack of consensus on suggested markers also cause inaccurate species identification among closely related species (Ran et al., 2010). Several different DNA barcoding methodologies, such as distance-based, tree-based, similarity-based, and character-based methods have been approved for the assessment of species discrimination, yet dissimilar species identification powers exist among these analytical methods based on same datasets (Zou et al., 2011; van Velzen et al., 2012; Yan et al., 2015). In general, DNA barcoding has become a well-funded, global enterprise as a rapid technique for species identification (Taylor and Harris, 2012). However, challenges still exist in the discrimination of closely related or recently diverged species groups (van Velzen et al., 2012), such as the oak lineage.
Oaks (Quercus L., Fagaceae) are anemophilous species with approximately 400–500 taxa widespread throughout the Northern Hemisphere, belonging to a taxonomically complex group (Dumolin-Lapegue et al., 1999; Aldrich and Cavender-Bares, 2011). The genus Quercus has been recognized as two major clades comprising five or six infrageneric key groups as Lobatae Loudon, Protobalanus (Trelease) Camus, Quercus Linneaus, Cerris Loudon, Ilex Loudon as well as the tropical to subtropical, evergreen (subgenus) Cyclobalanopsis Oersted group in Southeast Asia (Oh and Manos, 2008; Denk and Grimm, 2009, 2010; Denk and Tekleva, 2014; Hubert et al., 2014). However, the Cyclobalanopsis group is also treated as a subgenus of Quercus by some taxonomists due to its controversial phylogenetic position (i.e., Zhou, 1992; Nixon, 1993; Manos et al., 2001; Menitsky, 2005), and we regard it as such here with focus on the Chinese oak species in subg. Quercus. Using cpDNA markers, a series of phylogenetic and phylogeographical studies have mainly been concentrated on oaks distributed in Europe and North America (Petit et al., 2002; Magni et al., 2005; Grivet et al., 2006; Cavender-Bares et al., 2011; Simeone et al., 2016); but these markers are barely shared between the two major research areas. A set of 52 polymorphic cpDNA primers was proposed for the postglacial migration reconstruction of Quercus rubra L. (Borkowski et al., 2014), yet the universality of these markers in other oaks was unknown. To date, only two barcoding prospects have been performed on Italian and Euro-Mediterranean oaks with some of the proposed DNA barcodes (rbcL, rpoC1, trnH-psbA, matK, and ITS2; Piredda et al., 2011; Simeone et al., 2013). While 12 Italian oak species studied revealed extremely low discrimination success (0%), the resolution in Euro-Mediterranean oaks investigated was up to 87.8% when a combination of plastid and nuclear (ITS2) regions was used, yet they sampled large scale ranges with limited sample size (one or two individuals) for most species. The lack of unique DNA barcodes for oaks is suggested to be the result of inconsistent and limited taxonomy, low variation rates of the barcodes, frequent interspecific hybridization, incomplete lineage sorting, shared ancestral polymorphism and reticulation (Simeone et al., 2013), which indicates challenges and the lack of efficient markers for barcoding the species-rich genus Quercus.
China harbors a high diversity of oaks in subg. Quercus with 62 species described in the Flora of China (the Chinese version), while the English revision retained 35 species, essentially removing the hybrids and morphologically similar species (http://www.floraofchina.org/). Based on morphological and anatomical studies of pollen and leaves (Zhou et al., 1995; Pu et al., 2002; Peng et al., 2007), the Chinese oaks (subg. Quercus) are divided into five morphology-based sections: Quercus, Aegilops, Heterobalanus, Engleriana, and Echinolepides. Of these five sections, the first two consist of deciduous oak species that are included in phylogenetic Groups Quercus and Cerris, while the remaining sections comprise evergreen oak species are hypothesized to be nested within Group Ilex (Pu et al., 2002; Denk and Grimm, 2009), although particular phylogenetic tests for the Chinese oaks are absent. Recent phylogeographic studies have been performed on some widespread deciduous species in Sections Quercus and Aegilops, suggesting that geological and climatic changes during the Neogene and/or Pleistocene have acted as potential triggers for intra- and inter-specific differentiation of these Chinese oaks (Zeng et al., 2011, 2015; Chen et al., 2012; Wang Y. H. et al., 2015; Zhang X. W. et al., 2015; Yang J. et al., 2016). Additional studies have mainly focused on ecological issues of Section Heterobalanus, which contains about nine sclerophyllous alpine species and occurs mainly in the Hengduan Mountains (Yang et al., 2009; Feng et al., 2016). Other oaks, for example the species of morphology-based Sections Engleriana and Echinolepides are mainly endemics and relics with narrow and scattered distributions, and most of them are endangered due to habitat loss. However, the species discrimination and differentiation, as well as phylogeny and evolution of the entire Chinese oak species have yet to be well uncovered due ambiguous species boundaries and lack of universal molecular markers.
In this study, over 200 individuals of 35 Chinese oak species of subg. Quercus (Table 1) were collected to explore species identification using DNA barcoding analyses. Particularly, to provide sufficient barcode candidates targeting the barcoding analyses, we (1) first developed universal cpDNA markers for the Chinese oak species using a comparative method between the chloroplast genomes of Q. rubra and Castanea mollissima Blume. Designed cpDNA primers were tested on a subset of 14 deciduous oaks to obtain candidate DNA barcodes. In addition, cpDNA markers generating highly intraspecific divergence were also identified for future phylogeographic studies of the Chinese oak species. We then (2) selected five of the identified cpDNA barcode candidates in step (1) with addition of the proposed ITS and a single-copy nuclear gene (SAP) to barcode the 35 Chinese oaks. Four different DNA barcoding methods were compared to evaluate the resolution rates of species identification. Finally, based on the (tree-based) barcoding results, we discussed the potential implications for phylogenetic prospects of the Chinese oaks in subg. Quercus.
Table 1
| Group | Section | Species | Sample size | Location (Province) |
|---|---|---|---|---|
| Quercus | Quercus | Quercus aliena Blume | 9 | Weining (Guizhou); Shaoxing (Zhejiang); Qinhuangdao (Hebei) |
| Quercus aliena Blume var. acutiserrata Maximowicz ex Wenzig | 9 | Jiujiang (Jiangxi); Anlong (Guizhou); Emeishan (Sichuan) | ||
| Quercus dentata Thunb | 9 | Foping (Shaanxi); Shenyang (Liaoning); Guangyuan (Sichuan) | ||
| Quercus fabri Hance | 9 | Weining (Guizhou); Enshi (Hubei); Dongkou (Hunan) | ||
| Quercus serrata Murray | 8 | Guangyuan (Sichuan); Dujiangyan (Sichuan); Bikou (Gansu) | ||
| Quercus serrata Murray var. brevipetiolata (A. DC.) Nakai | 6 | Shangnan (Shaanxi); Jiujiang (Jiangxi) | ||
| Quercus liaotungensis Koidz. (or Quercus wutaishanica Blume) | 9 | Mengda (Qinghai); Huayin (Shaanxi); Zhashui (Shaanxi) | ||
| Quercus mongolica Fischer ex Ledebour | 9 | Xiyang (Shanxi); Changchun (Jilin); Yantai (Shandong) | ||
| Quercus griffithii Hook. f. et Thoms. ex Miquel | 6 | Lijiang (Yunnan); Tianlin (Guangxi) | ||
| Quercus yunnanensis Franchet | 3 | Yanyuan (Sichuan) | ||
| Quercus stewardii Rehd. | 3 | Huoshan (Anhui) | ||
| Cerris | Aegilops | Quercus acutissima Carr. | 9 | Funing (Yunnan); Longnan (Gansu); Qinhuangdao (Hebei) |
| Quercus variabilis Blume | 6 | Xixia (Henan); Yichang (Hubei) | ||
| Quercus chenii Nakai | 3 | Xinning (Hunan) | ||
| Ilex | Heterobalanus | Quercus spinosa David ex Franchet | 15 | Hanzhong (Shaanxi); Jiulong (Sichuan); Shiyan (Hubei); Lijiang (Yunnan); Dali (Yunnan); Shangluo (Shaanxi); Xianju (Zhejiang); Hualien (Taiwan) |
| Quercus aquifolioides Rehd. et Wils. | 8 | Maerkang (Sichuan); Mangkang (Tibet); Maoxian (Sichuan); Lijiang (Yunnan) | ||
| Quercus rehderiana Hand. -Mazz. | 3 | Maoxian (Sichuan) | ||
| Quercus pseudosemecarpifolia A. Camus | 6 | Weining (Guizhou); Luding (Sichuan); Lijiang (Yunnan) | ||
| Quercus pannosa Hand. -Mazz. | 4 | Bomi (Tibet); Muli (Sichuan) | ||
| Quercus longispica (Hand. -Mazz.) A. Camus | 6 | Maerkang (Sichuan); Muli (Sichuan); Lijiang (Yunnan) | ||
| Quercus monimotricha Hand. -Mazz. | 4 | Yanyuan (Sichuan); Kangding (Sichuan) | ||
| Quercus senescens Hand. -Mazz. | 10 | Chayu (Tibet); Lijiang (Yunnan); Muli (Sichuan); Huize (Yunnan); Weining (Guizhou) | ||
| Quercus guajavifolia H. Leveille | 8 | Maerkang (Sichuan); Deqin (Yunnan); Lijiang (Yunnan); Muli (Sichuan) | ||
| Quercus semecarpifolia Smith | 3 | Linzhi (Tibet) | ||
| Quercus gilliana Rehd. et Wils. | 3 | Maoxian (Sichuan) | ||
| Engleriana | Quercus engleriana Seem. | 3 | Tongren (Guizhou) | |
| Quercus cocciferoides Hand. -Mazz. | 3 | Muli (Sichuan) | ||
| Quercus phillyraeoides A. Gray | 6 | Shaowu (Fujian); Chongqing | ||
| Quercus franchetii Skan | 3 | Miyi (Sichuan) | ||
| Quercus acrodonta Seemen | 6 | Xinning (Hunan); Shangnan (Shaanxi) | ||
| Quercus lanata Roxb | 3 | Tongmai (Tibet) | ||
| Quercus tarokoensis Hayata | 4 | Taroko (Taiwan) | ||
| Echinolepides | Quercus dolicholepis A. Camus | 6 | Longlin (Guangxi); Enshi (Hubei) | |
| Quercus oxyphylla (E. H. Wilson) Handel-Mazzetti | 6 | Lueyang (Shaanxi); Shaowu (Fujian) | ||
| Quercus baronii Skan | 9 | Linfen (Shanxi); Xian (Shaanxi); Lushi (Henan) |
Taxon information of 35 Chinese oaks in Quercus subgenus Quercus used in this study.
Materials and methods
Taxon information, DNA isolation and PCR amplification
A total of 35 oak species representing the five morphology-based sections (corresponding to the phylogenetic Groups Quercus, Cerris, and Ilex, see the introduction) of the Chinese oaks (Zhou et al., 1995; Pu et al., 2002; Peng et al., 2007) were collected following the morphological classification of the Flora of China (Table 1). The deciduous North American species Q. rubra was used for primer development; screening of plastid primers was conducted on a subset of 14 deciduous oaks, each with three to four individuals, including 11 species of the Section Quercus and three of Aegilops. For DNA barcoding analyses below, we used all 35 oak species with increased sample size (Table 1). Voucher specimens of the 35 Chinese oak species collected were archived in the herbarium of College of Life Sciences at Northwest University (Table S1). DNA extractions and PCR protocols were the same as in Yang J. et al. (2016).
Development and screening of the chloroplast primers
The complete chloroplast genomes of Q. rubra (NC_020152.1; Alexander and Woeste, 2014) and C. mollissima (NC_014674.1; Jansen et al., 2011) were aligned and compared in program Mauve (Darling et al., 2010) with full alignment, iterative refinement parameters and default seed weight to search potential genetic variation. The large single copy (LSC) and small single copy (SSC) regions exhibiting gaps and variations between the two genomes were extracted and divided into suitable fragments for primer design. Locations of the extracted cpDNA fragments were identified based on the chloroplast genome of Q. rubra, and conserved regions flanking variable regions were used to design primers. Additionally, repetitive structures (except the mononucleotide repeats) in the chloroplast genome, which can provide additional genetic information at low taxonomic levels, were searched in program REPuter (Kurtz et al., 2001) with parameters of minimal repeat size of 8 bp and maximum repeats of 50 bp. Primers were designed using the PrimerSelect program in DNAStar software (DNASTAR Inc., Wisconsin, USA) with the following characteristics: primer length = 18–24 bp, melting temperature = 50–65°C and default parameters for the rest of the conditions. Product length was restricted to 400–1,100 bp to facilitate standard PCR amplification.
For each designed plastid marker, obtained sequences for 14 deciduous oak species (GenBank accession numbers: KX824782-KX825832) were visually checked and aligned in BioEdit 7.0.9.0 (Hall, 1999). Ambiguous sites and poly (A and T) structures were removed, while indels were retained for potential informative characters (Jaen-Molina et al., 2015). To choose potential barcoding markers for species discrimination, all alignments were visually scanned, and markers displaying species-specific characters (including gaps) in individual oak species were retained as candidate barcodes. To select universal primers that generate high intraspecific diversity for future phylogeographic studies, the mean diversity (nucleotide diversity, π) for each species was estimated using MEGA 6.06 (Tamura et al., 2013). Two criteria were used to filter the designed cpDNA markers: (1) primers could be successfully amplified among most of the 14 deciduous oaks; and (2) the estimated mean diversity of the 14 oak species (π) > 0.0005; this threshold value was chosen based on the average estimation of cpDNA nucleotide diversity documented in previous phylogeographic researches on anemophilous tree species such as Populus balsamifera (Breen et al., 2012), Pteroceltis tatarinowii (Li et al., 2012), and Quercus variabilis (Chen et al., 2012). Sequences having repetitive structures were evaluated with the deletion-insertion polymorphism (DIP) analysis using the Multiallelic option in DnaSP 5.0 (Rozas et al., 2003), but were only performed on two widespread species Quercus aliena and Quercus acutissima, which have sample sizes of nine individuals for each species.
DNA barcoding analyses
Five cpDNA candidate barcodes were selected for barcoding the Chinese oak species, as a combination of them showed the maximum species identification potential among 14 Chinese deciduous oaks (see the results). Additionally, two nuclear genes with newly designed primers, the ITS region flanking ITS1-5.8S rDNA-ITS2 (Forward: GTTCGGGCGACGGGACAC; Reverse: CCTGCGGGCGGGGACCTC) and a predicted zinc finger A20 and AN1 domain-containing stress-associated protein 8-like gene (SAP) (Vij and Tyagi, 2006) (Forward: ATGGAGCATGATGAGACGGG; Reverse: GCCTTAACAACAGGGTTGGC) which was confirmed as a single-copy gene using a BLAST search based on a comparative transcriptome work (unpublished data) and against the Quercus EST database in the National Center for Biotechnology Information (NCBI), were joined to test their discriminatory power in subg. Quercus of China. All obtained DNA sequences for each candidate region (GenBank accession numbers: KX836866-KX838287) were checked visually and aligned with BioEdit 7.0.9.0. Ambiguous sites and poly (A and T) structures were removed, while informative insertion-deletion events (gaps) showing species-specific characters were coded as nucleotide substitutions following Simmons and Ochoterena (2000). Potential pseudogenes of the ITS region (Manos et al., 2001; Ma and Zhou, 2006; Denk and Grimm, 2010) were checked and filtered using multiple examinations (i.e., G+C content, secondary structure and conserved domains of ITS2, and conserved motifs in 5.8S rDNA; see Note S1); only functional ITS orthologues were retained for the barcoding analysis. Sequencing peaks of nucleotide sites having an overlap greater than 80% in the nuclear sequences were treated as heterozygous, and ambiguity was coded according to the IUPAC (International Union of Pure and Applied Chemistry). Individual barcodes and all possible combinations of the seven candidates (five plastid and two nuclear regions) were evaluated using four different barcoding methods as follows:
Method-1 Genetic distance-based: DNA barcoding gaps of the Chinese oak species were evaluated by comparing the distributions of ranked pairwise differences (p-distance) with the maximum intraspecific genetic divergence calculated in MEGA 6.06 with 1,000 bootstraps for each candidate barcode. A barcode gap would exhibit a sudden increase in the vicinity of the maximum intraspecific divergence. For each barcode candidate and all possible combinations, the obtained genetic distance matrices were then used as input to explore potential species groups using the Automatic Barcode Gap Discovery (ABGD) tool with estimated maximum intraspecific distance as threshold and 100 simulation steps (Puillandre et al., 2012). A species group was considered as successfully delimited if conspecific individuals were partitioned into the same group without sequences from other species. Differentiations between the intra- and interspecific divergences for each candidate and infrageneric partition (i.e., the five morphology-based sections of the Chinese oaks and traditional phylogenetic classification of Quercus) were also compared using the Student's t-test and Wilcoxon rank sum test in R 3.2.3 (R Development Core Team, 2011).
Method-2 BLAST-based: Sequences of the seven candidate barcodes were concatenated as a local reference database. Individual sequences from a specified barcode were then used to query the reference database with the local NCBI-blast-2.2.28+ program in C environment (Camacho et al., 2009). Query parameters were compiled as: –query BLAST_sequence –db reference_database –out BLAST_results –outfmt 7 –max_target_seqs 10. Species discrimination was considered successful when all individuals of a species had a top hit to conspecific individuals (the query sequence itself was excluded from the blast results).
Method-3 Character-based: The character-based DNA barcode method in BLOG (Barcoding with LOGic) 2.0 was used for species identification under a machine learning approach which selects a small set of suitable positions from the reference sequences to classify species (Weitschek et al., 2013). Raw sequences of each candidate barcode and combinations were used as the reference database and were tested with 100% slicing for training, 50 POSCOST and 800 NEGPOST for the logic formulas against itself to verify the identification power of each database. For each reference, the total percentage of correct species classification rates was recorded.
Method-4 Tree-based: Unrooted neighbor-joining (NJ) trees were constructed in MEGA 6.06 based on pairwise deletion and the p-distance model with 1,000 bootstrap replicates according to Yan et al. (2015) for species-level discrimination of closely related groups. Only species with multiple individuals forming a monophyletic clade in the NJ tree were considered to be successfully identified.
Results
Comparison of the two chloroplast genomes
The total consensus chloroplast genome length of Q. rubra was 161,304 and 160,799 bp for C. mollisima (Figure S1). Both species had similar GC contents but differed in the total number of genes with Q. rubra having 11 more genes than C. mollisima. The LSC and SSC regions of Q. rubra were larger (91,121 and 20,150 bp) than those of C. mollissima (90,432 and 18,995 bp). In contrast, the inverted repeat (IR) of Q. rubra was shorter than in C. mollissima. Searching for repetitive structures within the chloroplast genome revealed 12 repeats in Q. rubra, while C. mollissima had eight (Table 2). When the IR regions were removed, comparison of the chloroplast genome of Q. rubra with C. mollissima as reference yielded 701 plastid SNP sites and 221 gaps for primer design.
Table 2
| Quercus rubra | Castanea mollissima | |
|---|---|---|
| Total length (bp) | 161,304 | 160,799 |
| LSC length (bp) | 91,121 | 90,432 |
| SSC length (bp) | 20,150 | 18,995 |
| IR length (bp) | 25,051 | 25,686 |
| GC content (%) | 36.79 | 36.80 |
| Number of gene | 138 | 127 |
| Number of repetitive structure | 12 | 8 |
Comparison of major features of the two chloroplast genomes Quercus rubra and Castaena mollissima.
Information of designed primers for the Chinese oaks
Thirty-nine pairs of plastid primers were designed based on detected variations and gaps in the LSC and SSC regions of the chloroplast genome of Q. rubra. Total expected PCR product length of the 39 primers was 28,555 bp, covering 17.7% of the Q. rubra chloroplast genome. In addition, the repetitive structures in the chloroplast genome of Q. rubra yielded eight primer pairs. The average length of PCR products for these 47 primers was 710 bp. Primer screening on 14 deciduous oak species resulted in successful amplification of 30 primer pairs with an average success rate of 62% among the 47 designed markers (Table S2); most primers showed high universality across the 14 Chinese deciduous oaks.
To select suitable cpDNA markers for future phylogeographic studies, estimation of the mean genetic diversity (π) suggested that 12 primer pairs could reveal high intraspecific diversity in most of the 14 deciduous oak species based on our criteria (π > 0.0005; Figure S2; Tables 3 and Table S3); moreover, these primers had high amplification success. Of these 12 cpDNA markers, two primers (B13 and B36) revealed the highest mean intraspecific diversity (π) with the values of 0.0056 and 0.0051 across the 14 deciduous oaks. For the eight plastid regions having repetitive structures, two markers (R1 and R7) showed high DIPs with the mean values of 0.4290 and 0.5000, respectively (Table 3).
Table 3
| Primer ID | Amplification region | Forward (5′-3′) | Reverse (5′-3′) | Tm (°C) | Aligned length (bp) | Amplification success (%) | Mean diversity (π) |
|---|---|---|---|---|---|---|---|
| B1* | psbA-trnKUUU | GACGGTTTTCAGTGCTGGTTATCC | TTTTCATCAATGGTCTGTCC | 55 | 514 | 100 | 0.0016 |
| B2*# | matK-trnKUUU | TCTTACGATTTCTGCCCCTTCT | TTCTTAGCGGATCGGTTCAAAA | 53 | 755 | 100 | 0.0008 |
| B3*# | rps16 | TTGGGATAGATGTAGATGAATAA | TCGGGGGTTGGGATGTAAATAGT | 53 | 612 | 100 | 0.0012 |
| B4# | matK | ACCCAGTCCATCTGGAAATCTTGGTTC | CGTACAGTACTTTTGTGTTTACGAG | 55 | 698 | 100 | 0.0002 |
| B9* | atpI-rps2 | ATAATGGCTGAACCTAATAAGATA | TCCCAGCAAATGATGACG | 56 | 379 | 86 | 0.0006 |
| B13* | trnDGUC-trnEUUC | CTTGACAGGGCGGTGCTCT | TAATGGGGACGGACTGTAAAT | 54 | 491 | 100 | 0.0056 |
| B14* | psbC-lhbA | ATTGATCGCGATTTTGAACCT | CCACGAATCTATTAATGCTGTATG | 55 | 435 | 100 | 0.0018 |
| B17*# | ycf3-trnSGGA | AAATCGCACCATCTCTGTAATAGG | CAAAACCGGGTGAATAGTGAGTC | 58 | 884 | 100 | 0.0011 |
| B29* | rps11-rps8 | TATTCTACGCGCACTCTTACG | AACGGGTTTCTATTCTCACTCTC | 55 | 661 | 100 | 0.0022 |
| B30* | rps3-rps19 | TGCAAACCAAAGAGAATGATGAC | TCCGAGGACACGCAAAAA | 55 | 618 | 100 | 0.0012 |
| B31*# | ndhF | TTCGGCCAATGCTCTTAT | TCCACCCCTTGCCTGTTTT | 54 | 781 | 100 | 0.0007 |
| B36*# | rps15-ycf1 | ATCCCCTGTTTTCTTCTTTTTC | CAATAATGGTAGTCGTTTCAGTCT | 53 | 493 | 100 | 0.0051 |
| B37*# | ycf1(5′) | CGCGATAGGGTCCGTTCA | CTATTTAGGCAGAGTACCGTCACC | 55 | 757 | 93 | 0.0008 |
| B38# | ycf1 | ATTCTGATGGTCCGGAAGGG | CCTTATCAGACTGAAACGACTAC | 52 | 440 | 100 | 0.0006 |
| B39# | trnHGUG-psbA | GTTATGCATGAACGTAATGCTC | CGCGCATGGTGGATTCACAATCC | 62 | 332 | 100 | 0.0003 |
| R1* | rps12-trnVGAC | CCAAATTGACGGGTTAGTGTGA | TTACCTCCGCGGAAAAGATGAT | 55 | 415 | 100 | 0.429a |
| R7* | rps16-trnQUUG | AAAGAAAATGATGGATGTAAGAAT | TAATGTAATGATAGTGAAATAGGA | 54 | 483 | 100 | 0.5a |
Information of plastid primers selected for phylogeography and species identification based on 14 deciduous oak species.
Primers selected for phylogeographic analysis;
Primers selected for species identification;
Values of Deletion-Insertion polymorphism (DIP).
For selection of candidate DNA barcodes, screening on amplicons revealed that nine primer pairs generated species-specific characters, which might show discriminating potential among the 14 deciduous oak species (Table 3). Overall, the selected cpDNA markers for phylogeographic and barcoding studies amplified 17 chloroplast regions, 12 were located in intergenic spacers, while four and one markers were anchored in codon and intron regions (Figure S3), respectively. In order to select powerful barcoding markers for all the Chinese oak species, the ABGD method was initially applied to sequences obtained from 14 deciduous oaks after PCR amplification of these nine primer candidates and all possible combinations. The ABGD results showed that most primer pair candidates demarcated one species groups and only primer pair B38 (ycf1) delineated three species groups, while ranges of intra- and interspecific genetic distances in each candidate barcode were overlapped based on the 14 deciduous oak species (Table S4). Despite this, five cpDNA markers (psbA-trnH, matK-trnK, ycf3-trnS, matK, and ycf1; Table 4) were chosen for our barcoding analyses because their combination revealed the highest species identification level among the 14 deciduous oaks tested.
Table 4
| Barcode ID | No. amplicons | Aligned length (bp) | No. variable sites | No. informative sites | No. indels | No. diagnostic indels | Maximum intraspecific distance (SE) |
|---|---|---|---|---|---|---|---|
| matK-trnK | 205 | 694 | 37 | 33 | 2 | 1 | 0.0130 (0.0043) |
| ycf3-trnS | 207 | 607 | 23 | 21 | 2 | 0 | 0.0099 (0.0038) |
| psbA-trnH | 211 | 502 | 37 | 36 | 11 | 5 | 0.0139 (0.0052) |
| matK | 209 | 729 | 34 | 32 | 0 | 0 | 0.0123 (0.0038) |
| ycf1 | 216 | 448 | 29 | 29 | 0 | 0 | 0.0117 (0.0048) |
| ITS | 201 | 411 | 96 | 86 | 2 | 1 | 0.0389 (0.0095) |
| SAP | 173 | 355 | 52 | 39 | 0 | 0 | 0.0169 (0.0064) |
Estimation of genetic information of seven barcode candidates in DNA barcoding analysis based on the 35 Chinese oak species.
Barcode universality and sequence characteristics
The five plastid candidate barcodes and two nuclear genes showed high amplification success rates (100%) at the species level for the 35 Chinese oak species. At the individual level, these five cpDNA candidates as well as the ITS region had medium to high success rates (87–100%), while the SAP gene showed the lowest amplification rates in species from morphology-based Sections Quercus, Heterobalanus, Engleriana, and Echinolepides (Table 5).
Table 5
| Barcode ID | Quercus | Cerris | Ilex | |||
|---|---|---|---|---|---|---|
| Quercus (%) | Aegilops (%) | Heterobalanus (%) | Engleriana (%) | Echinolepides (%) | ||
| Species level | matK-trnK | 100 | 100 | 100 | 100 | 100 |
| ycf3-trnS | 100 | 100 | 100 | 100 | 100 | |
| psbA-trnH | 100 | 100 | 100 | 100 | 100 | |
| matK | 100 | 100 | 100 | 100 | 100 | |
| ycf1 | 100 | 100 | 100 | 100 | 100 | |
| ITS | 100 | 100 | 100 | 100 | 100 | |
| SAP | 100 | 100 | 100 | 100 | 100 | |
| Overall | 100 | 100 | 100 | 100 | 100 | |
| Individual level | matK-trnK | 94 | 100 | 93 | 93 | 100 |
| ycf3-trnS | 99 | 100 | 89 | 96 | 100 | |
| psbA-trnH | 100 | 100 | 94 | 93 | 100 | |
| matK | 99 | 100 | 93 | 96 | 95 | |
| ycf1 | 99 | 100 | 100 | 100 | 100 | |
| ITS | 96 | 94 | 87 | 93 | 95 | |
| SAP | 75 | 100 | 76 | 89 | 81 | |
| Overall | 95 | 99 | 90 | 94 | 96 | |
Information of amplification success for the seven candidate barcodes used in this study.
A total of 1422 sequences of the 35 Chinese oak species were available for the DNA barcoding analyses. The aligned lengths of the seven barcodes ranged from 355 bp for the SAP gene to 729 bp of the matK region. Among the seven barcodes, the aligned ITS region showed the highest number of variable sites, while the ycf3-trnS alignment had the lowest variable sites. The two nuclear genes exhibited more variable sites than the five plastid candidates. Of the seven tested barcodes, the psbA-trnH region had the highest number of indels (11) with five of them being diagnostic for some Chinese oak species. The matK-trnK and ycf3-trnS sequences as well as the ITS region showed two indels in each alignment, but only one gap was species-specific for the matK-trnK and ITS regions. No indels were found in the matK, ycf1 and SAP alignments (Table 4).
DNA barcoding gap assessment
Among the seven barcodes, the ITS region revealed the highest variation in the maximum intraspecific genetic distance, while ycf3-trnS showed the lowest maximum intraspecific variation (Table 4). No sudden increase was found around the vicinity of the maximum intraspecific distance for the ranked genetic distances, indicating no DNA barcoding gap among the 35 Chinese oak species for each barcode candidate (Figure 1). The differentiation tests between the minimum inter- and maximum intra-specific genetic distances revealed significantly higher values of the intraspecific variation than genetic variation at the interspecific level for ycf3-trnS, matK, ycf1 and the two nuclear genes, while no differences between the intra- and inter-specific genetic distances were shown in matK-trnK and psbA-trnH. Among species of each morphology-based section, the differentiation tests also showed significantly higher intraspecific variations than interspecific differentiation for Sections Quercus (corresponding to the phylogenetic Group Quercus), Aegilops (phylogenetic Group Cerris), Heterobalanus and Echinolepides, with the exception of Engleriana, for which the maximum intraspecific genetic distances were significantly lower than the minimum interspecific divergence (Table S5). However, when the differentiation tests were performed on the phylogenetic Group Ilex (including species of Sections Heterobalanus, Engleriana, and Echinolepides), both tests showed significantly higher intraspecific variations than interspecific differentiation among these evergreen oaks (t = 3.811, P <0.001; W = 32563.5, P <0.001).
Figure 1
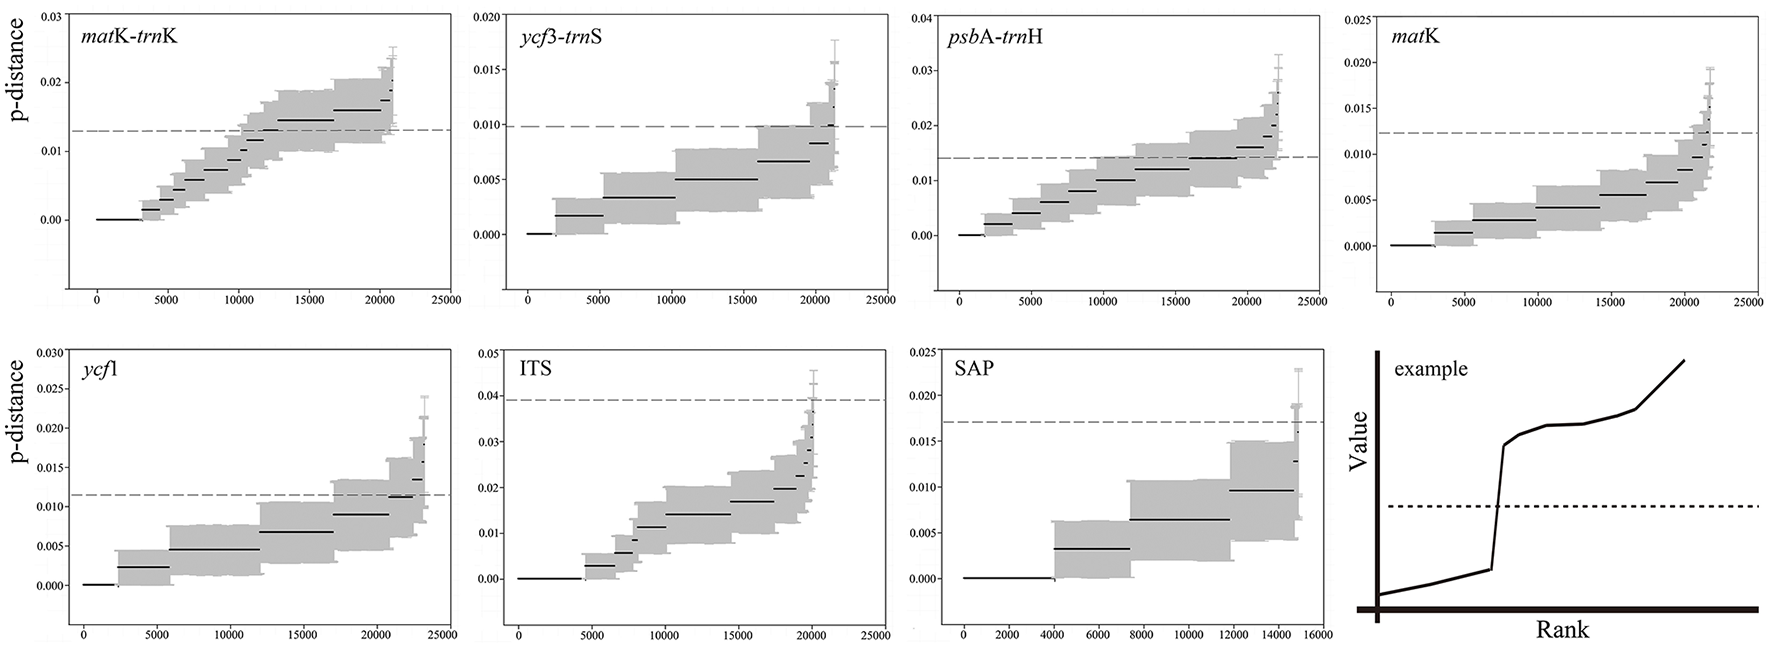
Ranked values of genetic distances (p-distance) for the seven DNA barcode candidates among 35 Chinese oaks in Quercus subgenus Quercus, and an example (Puillandre et al., 2012) indicating a clear barcoding gap. X-axes represent the numbers of ranked genetic distances, Y-axes indicate the values of genetic distance. Black solid lines with gray areas show the estimated genetic distances with standard errors for each candidate. Dashed lines correspond to values of the maximum intraspecific divergence revealed for each candidate barcode.
Comparison of species discrimination
The four analysis methods afforded different rates of species discrimination for the 35 Chinese oak species in subg. Quercus. Overall, among the four different DNA barcoding methods, the character-based method showed the highest species discrimination rates with values from 30.30 to 84.85% for individual candidates to seven barcode combination. For a single barcode, the BLAST- and character-based methods provided the highest level of species identification (30.30%). The genetic distance-based method showed the lowest discrimination rates for the Chinese oak species for single barcodes and all their combinations, ranging from 0 to 17.14% (Figure 2; Tables S6, S7).
Figure 2
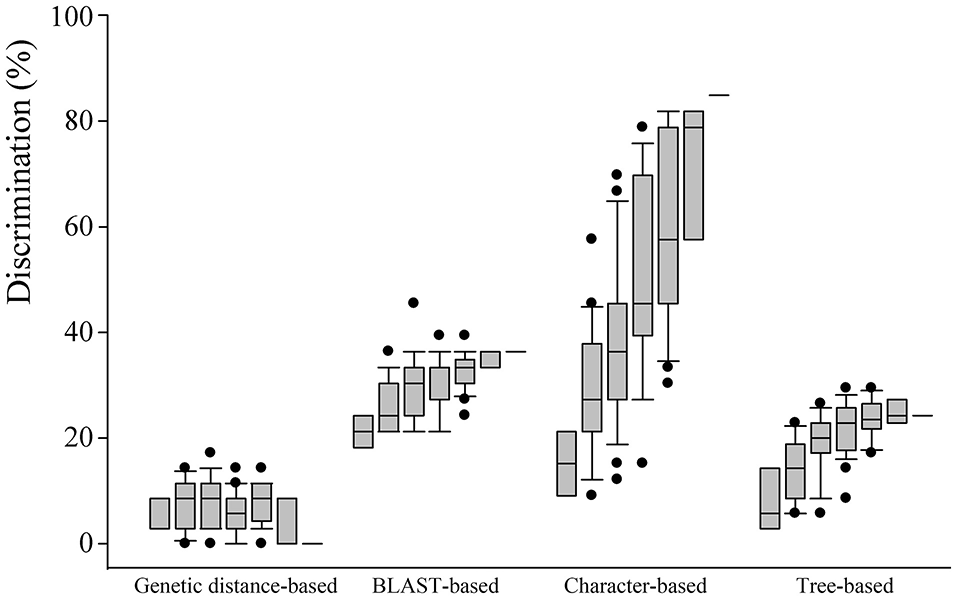
Comparison of species resolution for four different barcoding methods (genetic distance-, BLAST-, character-, and tree-based methods) with single to seven barcode combinations based on the 35 Chinese oak species in Quercus subgenus Quercus. Box with error bars indicates 95% confidence intervals, and solid lines in the box show the mean values of species resolution. Black dots indicate outliers for specified barcode combination.
When comparing the discriminating potentials of each of the seven candidate loci and all of their combinations (Figure 2), ITS and the psbA-trnH region showed the highest species discrimination rate (both 30.30%) when the character-based method and the BLAST-based method were used, respectively. However, the ITS region identified no species group with the genetic distance-based method. For the character-based method, combinations with increasing numbers of barcoding markers tended to provide increasing rates of the species discrimination and showed the highest species discrimination potentials (84.85%) with the combination of psbA-trnH + matK-trnK + matK + ycf1 + ITS + SAP, as well as with all the seven barcode candidates. In contrast, for the three remaining methods, the species identification rates did not significantly increase when the barcode combinations included a larger number of candidate barcodes (Tables S6, S7). No species group was found for the combination of the seven barcoding markers when the genetic distance-based method was performed (Figure 2). The highest species identification rates of the genetic distance-, BLAST- and tree-based methods were 17.14% with a three-marker combination (matK-trnK + ycf3-trnS + ITS), 45.45% using the combination of matK + ycf1 + SAP, and 30.30% with six combined candidates of psbA-trnH + matK-trnK + ycf3-trnS + ycf1 + ITS + SAP, respectively.
Along with the DNA barcoding aspects, the NJ trees generated were also used to test the five morphology-based sections Quercus, Aegilops, Heterobalanus, Engleriana, and Echinolepides, and the phylogenetic hypothesis of Groups Quercus, Cerris and Ilex for the Chinese oaks of subg. Quercus. The NJ tree with the highest species discrimination was shown in Figure 3. Ten of 33 Chinese oak species (Quercus monimotricha and Quercus senescens were not counted due only one sample of each in the analyses) were identified: two species in morphology-based Section Aegilops, two in Heterobalanus, five species in Engleriana, and one in Echinolepides. No monophyletic species clade was found in Section Quercus. At the infrageneric level, the five morphology-based sections were not well resolved in the NJ tree: all the white oaks of Section Quercus formed a distinct group; the three deciduous oak species from Aegilops also clustered together as a monophyletic group, and showed close relationship with the remaining evergreen oaks; while oaks of Sections Heterobalanus, Engleriana, and Echinolepides were mixed and formed multiple clades without clear section boundaries. In contrast, a previous phylogenetic classification for subg. Quercus was highly confirmed that individuals of the 35 Chinese oak species basically formed three major clades, corresponding to the phylogenetic Groups Quercus, Cerris, and Ilex. The NJ trees generated from four single barcodes (psbA-trnH, matK-trnK, ITS, and SAP), the combinations of the five cpDNA barcodes and of two nuclear genes, as well as the combination of seven candidate loci showed similar phylogenetic patterns to the best species identification tree based on six barcodes (Figure 3), while for the NJ trees of the ycf3-trnS, matK, and ycf1 regions, species of the three major groups were mixed without distinct boundaries except that the Group Cerris was identified by the ycf1 region (Figures S4–S13). The morphology-based Section Heterobalanus was only supported by a NJ tree using the combination of ITS and SAP (Figure S12), however, support for this monophyletic clade was low (Bootstrap probability = 58).
Figure 3
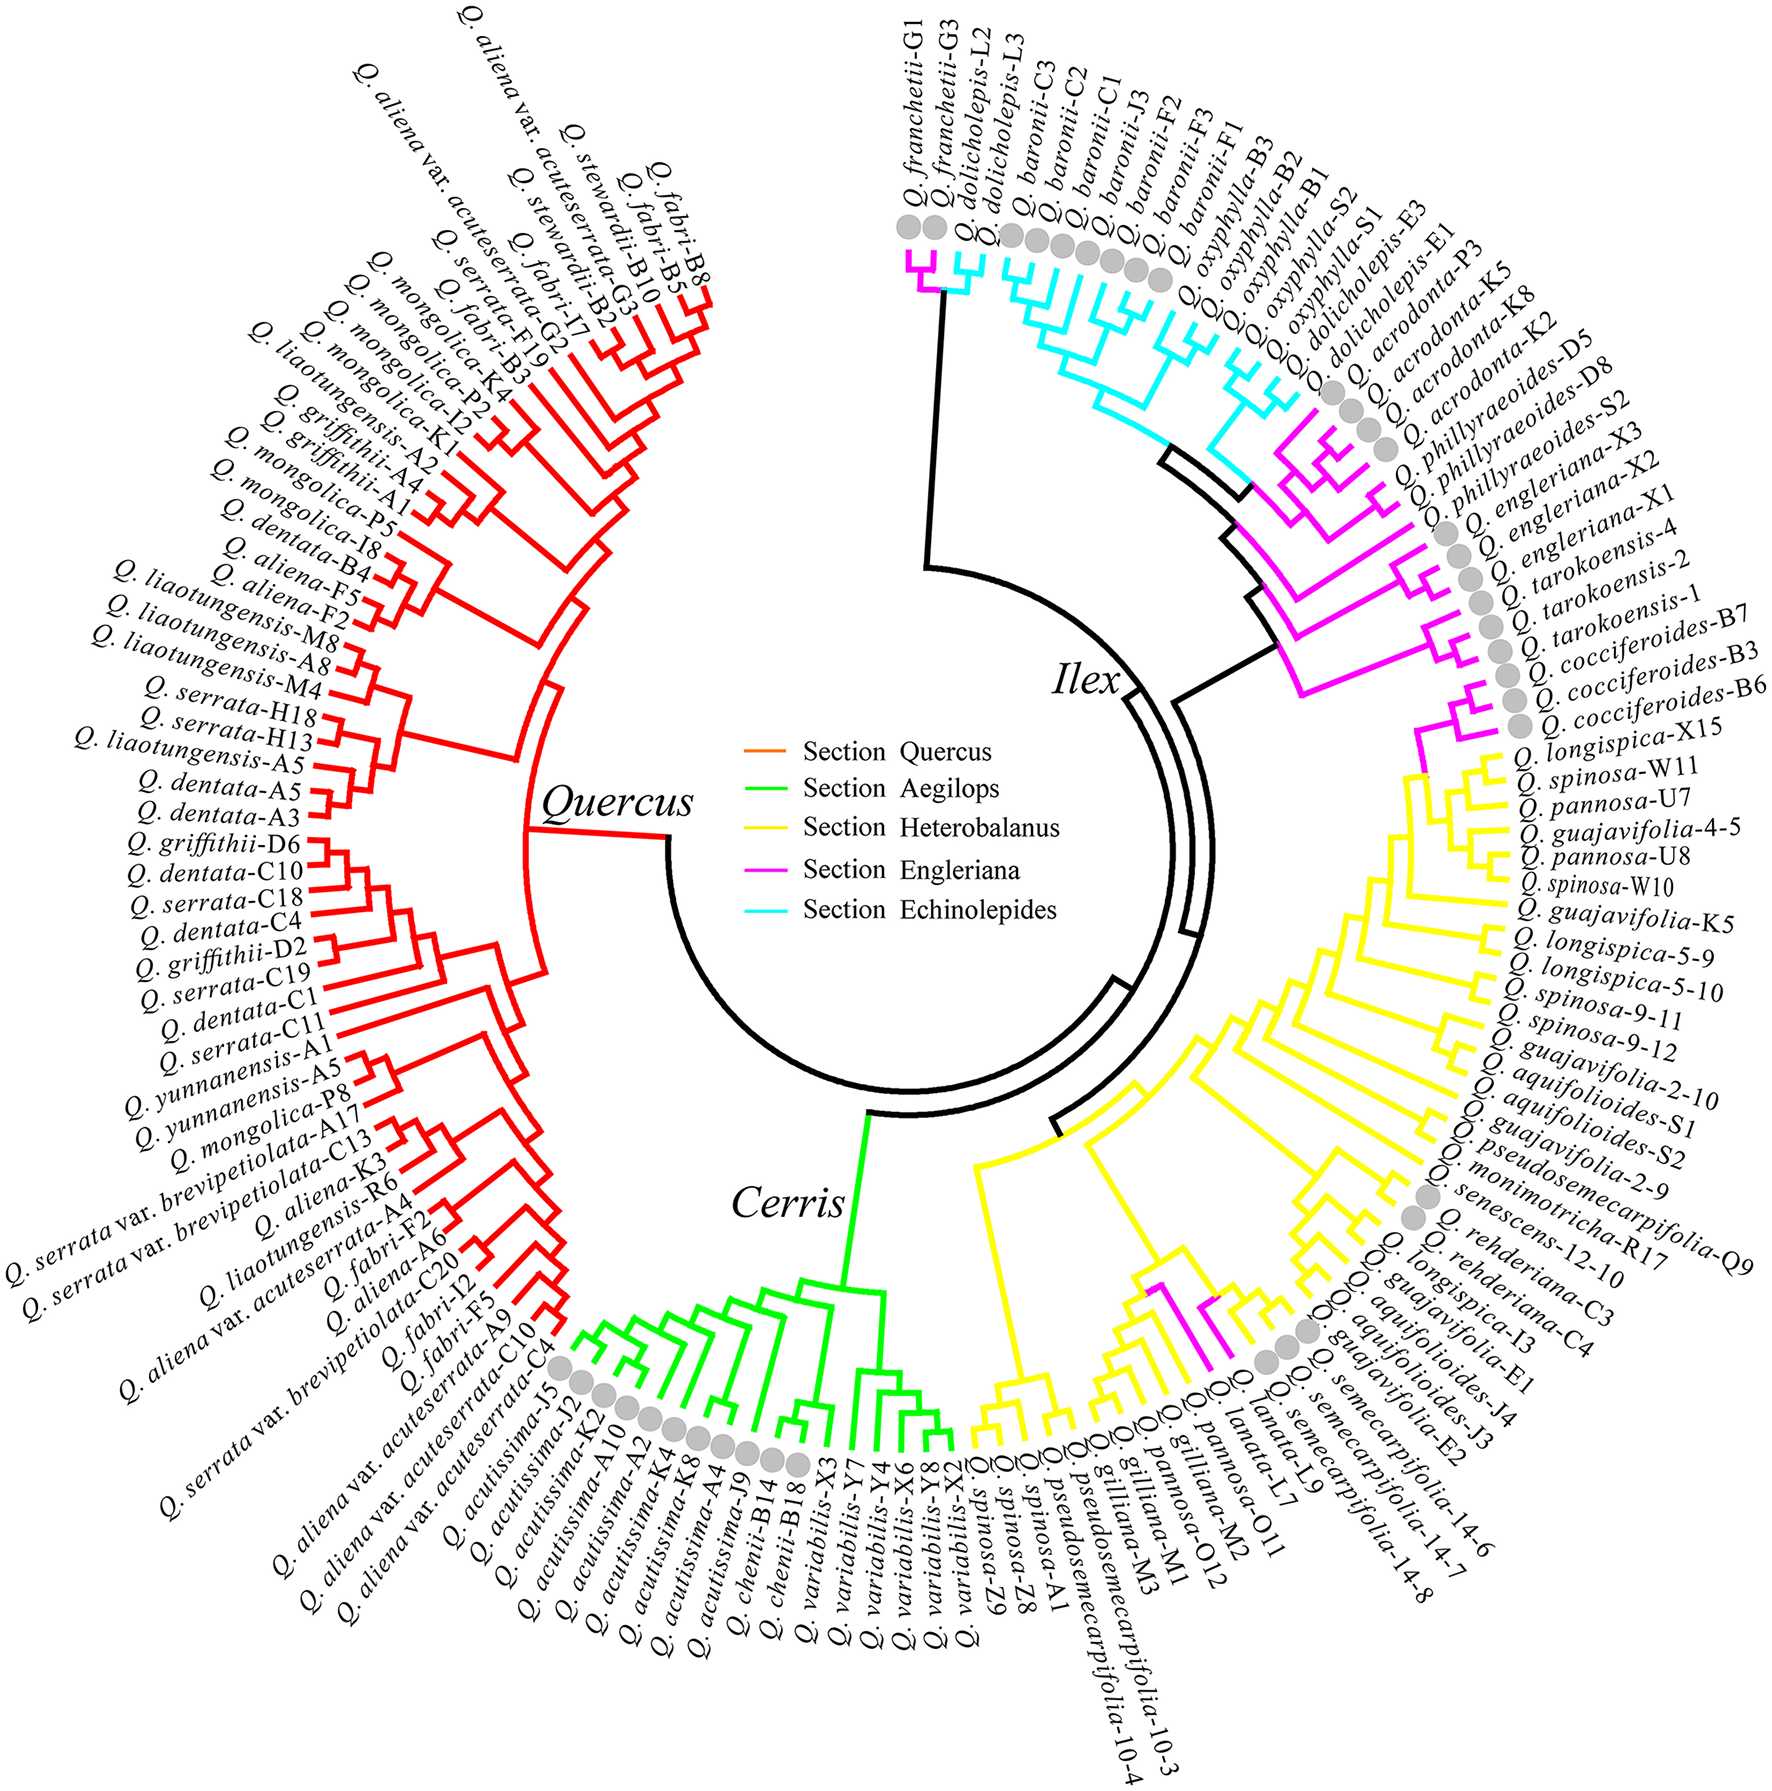
NJ tree of the highest species identification rate with the combination of psbA-trnH + matK-trnK + ycf3-trnS + ycf1 + ITS + SAP shows the phylogenetic implications for the Chinese oak species of Quercus subgenus Quercus. Gray dots highlight the individuals of identified oak species.
Discussion
Development of universal cpDNA markers for the Chinese oak species
The Chinese oak species in subg. Quercus show complex distribution patterns from the Qinghai-Tibetan Plateau to south and north China (Wang et al., 1985; Zhou, 1993), possibly reflecting complex population dynamics among species, as the past climatic and geographical impacts in different regions of China are considered heterogeneous (Harrison et al., 2001; Qiu et al., 2011). However, relatively few phylogeographic and phylogenetic studies have been performed for the Chinese oak species, probably due to the ambiguous species boundaries and low universality and genetic variation of current molecular markers. To overcome these limitations, the chloroplast genomes of Q. rubra and C. mollissima were compared to develop universal cpDNA markers. Two reasons were considered for this comparison: (1) among the complete and available Fagaceae genomes, these two species are closely related taxa. Further, previous comparative genomic analysis, as well as phylogenetic investigations, have shown that oaks are more closely related to chestnuts than to other taxa in Fagaceae (Manos and Steele, 1997; Kremer et al., 2012); (2) our recent comparative work on the chloroplast genomes of five Chinese oak species indicates highly conserved identity of sequences across these oak genomes, suggesting limited genetic variation at low taxonomic levels (Yang Y. C. et al., 2016). The universal plastid markers developed in this study are envisioned to provide useful tools for phylogenetic, biodiversity and population studies of oak species, as well as for other genera in the Fagaceae.
In this study, 14 deciduous oak species with multiple samples per species were used to test the designed cpDNA markers rather than screening them with pairs of species (Shaw et al., 2007). Most of the designed cpDNA markers can be amplified across the 14 oaks, suggesting superior universality of these primer pairs for the Chinese oaks (Tables 3 and Table S2). After screening on the 14 deciduous oaks, we suggested 12 plastid regions generating high intraspecific diversity that could be useful for phylogeographic and population genetic studies. As expected, most of the 12 chloroplast markers amplify intergenic spacers (Figure S3), supporting the intergenic regions accumulate more intraspecific polymorphism than the codon regions in chloroplast genome (Shaw et al., 2007; Yang Y. C. et al., 2016). Additionally, two pairs of primers (R1 and R7) exhibiting high DIPs by introducing indels in individual sequences may provide additional genetic information for evolutionary processes of oak species having slow evolutionary rates (Table 3). For selection of candidate cpDNA barcodes, nine primer pairs having discriminatory potentials were chosen based on the results of the 14 deciduous oak species examined. Despite the limited species identification of each candidate (Table S4), five of them (Table 4) were chosen for testing DNA barcoding in 35 Chinese oak species. Evaluation of the five plastid candidates and two additional nuclear genes tested on the 35 Chinese oak species are discussed below.
Evaluation of candidate DNA barcodes for the Chinese oaks
An efficient DNA barcode is expected to have highly universal primer pair as well as high interspecific variation, and to provide steady species-specific characters that allow species identity (Erickson et al., 2008; Hollingsworth et al., 2011; Naciri et al., 2012). The five candidate cpDNA barcodes selected in this study, as well as the two newly designed nuclear genes (ITS and SAP), showed relatively high universal coverage of the 35 Chinese oak species at the species and individual levels (Table 5), while their identification powers were variable across the Chinese oaks under different barcoding methods (Tables S6, S7).
Of the seven candidate barcodes, ITS and psbA-trnH provided the highest species resolution (both 30.30%) using the character- and the BLAST-based method, respectively. The ITS region was proposed as one of the core and powerful barcodes for seed plants (China Plant BOL Group, 2011), and its utility has also been supported in several barcoding studies (Liu et al., 2011, 2014; Muellner et al., 2011; Pang et al., 2011; Zhang et al., 2012; Chen et al., 2014; Zhang J. Q. et al., 2015). In a barcoding study of Euro-Mediterranean oaks, ITS2 increased the species resolution when combined with two plastid barcoding loci (Simeone et al., 2013); however, by itself, the ITS region showed no species identification when the genetic distance method was applied. Similarly, a barcoding study of Rhododendron, using ITS, showed low species resolution; this aspect could be attributed to recent radiative speciation, hybridization and introgression (Yan et al., 2015). The contrast performance of ITS in species identification of the 35 Chinese oaks between the character- and genetic distance-based analyses can be induced by technical difference of methods between these two barcoding approaches, as the rapid evolution rate of ITS could accumulate high intra- and inter-specific mutations, concealing interspecific genetic divergence among species; conversely, the character-based method synthesizes a set of diagnostic positions to distinguish species but ignores uninformative sites in the sequences (Bertolazzi et al., 2009), which may reduce the impact of intraspecific genetic variations. Obviously, with the character-based method, species identification rates of the Chinese oaks were increased when the ITS region was combined with other candidate barcodes (Table S7), supporting the utility of this region as an efficient barcode in plants.
As a single-copy gene, the SAP region was used to test the potential of low-copy nuclear loci as suitable barcodes for Quercus. Although there were amplification failures on some samples, the SAP gene showed 100% amplification success at the species level (Table 5). However, the SAP gene showed relatively low rate of species identification among the seven candidate barcodes (i.e., 2.86% in the genetic distance-based method and 18.18% using the BLAST-based method). Most combinations between the SAP gene and the remaining candidates provided inconspicuous promotions on the species discrimination rate except when the ITS region was joined (Table S7). The limited nucleotide variation and parsimonious informative sites of the functional SAP gene (Table 4), which yield low interspecific differentiations among closely related oak species, account for its poor species identification rate. Interestingly, despite the frustrating rate of species identification for the SAP gene, individuals of a widespread deciduous oak, Q. acutissima, seem to be well differentiated from two closely related species (Q. variabilis + Quercus chenii) (Figures 3, Figures S10, S12). One stable transition (in Q. acutissima) was found between Q. acutissima and Q. variabilis + Q. chenii in the alignment of SAP, which may induce potential differentiation of the stress-associated protein function encoded by this gene (Vij and Tyagi, 2006), and foster ecological differentiation among sympatric oaks (Cavender-Bares et al., 2015), particularly between the two widespread species Q. acutissima and Q. variabilis. However, given that only a few samples of the three closely related oaks were included in this study, the assumption that the SAP gene is likely a “speciation gene” (Wu, 2001) bears further verification with the study of a larger number of individuals and a functional proteomics approach.
Of the five plastid candidate barcodes, the psbA-trnH region showed the highest species resolution (30.30%) using the BLAST-based method. Due to its high level of sequence divergence and species identification rate, the non-coding psbA-trnH region has been suggested as a robust DNA barcode for plants (Kress et al., 2005; Hollingsworth et al., 2011; Taylor and Harris, 2012), and has been supported in several studies (Liu et al., 2014; Yan et al., 2015; Zhang J. Q. et al., 2015). In this study, the psbA-trnH region showed the highest number of informative sites, as well as diagnostic indels compared to the rest of plastid barcode candidates (Table 4). Additionally, the proposed problematic ambiguous inversions within psbA-trnH region encountered in some Euro-Mediterranean oaks (Simeone et al., 2013) was not found among the Chinese oak species, suggesting this region as a suitable core DNA barcode for Quercus. The ycf1 region is functional and exists in all Chinese oak species tested in this study, and showed the highest species resolution (14.29%) when the tree-based method was considered. This cpDNA region also provided considerable species discrimination rates compared to the psbA-trnH region using the other three methods, supporting that this locus should be included as a marker for barcoding analyses at low taxonomic levels (Neubig et al., 2009; Dong et al., 2012, 2015). However, given the high variation of the ycf1 gene that was verified in some angiosperm taxa (Dong et al., 2015), universality of the newly designed ycf1 region in this study bears further verification in other seed plants. The matK-trnK region showed higher species resolution rates than matK among most of the four barcoding methods, probably due to higher sequence variation in the intergenic region of matK-trnK compared to the coding region of matK. Thus, although these two regions are adjacent to each other (Figure S3), it seems better to use the matK-trnK region for barcoding Quercus than matK. The ycf3-trnS had the lowest sequence variation (Table 4) and showed relatively low species differentiation among the five plastid candidates. Combinations of the ycf3-trnS region with other candidate barcodes provided very little or no improvement of species resolution for the Chinese oak species, suggesting that this region could be omitted from barcoding studies in Quercus.
Overall, the seven barcode candidates show low rates of species identification among the 35 Chinese oaks when analyzed individually. Nevertheless, the combinations of DNA barcodes improved species discrimination, and provided varying species resolution with different barcoding methods (Figure 2; Table S6). The highest species discrimination rate (84.85%) was found using the combination of psbA-trnH + matK-trnK + matK + ycf1 + ITS + SAP with the character-based method, which is the same as the result obtained with the combination of all seven candidates (Tables S6, S7), and possibly acts as the best choice for barcoding the Chinese oaks. However, given the different performances among the four barcoding methods tested, choosing a suitable barcoding method is also crucial for barcoding analyses (Yan et al., 2015).
Comparison of different analytical methods for barcoding the Chinese oaks
Among the four analytical methods, the character-based method provided the highest species resolution when individual barcode candidate and all of their combinations were used. Conversely, the genetic distance-based method showed the lowest rates of species identification, particularly with the combination of all the seven candidates, which assigned no species groups to the 35 Chinese oaks. The BLAST-based method exhibited higher species discrimination than the tree-based method, but was lower than the character-based approach (Figure 2; Table S6). The different performances of the four methods used in this study possibly reflect the variant analytical theories of the approaches implemented: the character-based method identifies potential distinctive nucleotide positions from DNA barcode sequences (the reference database) and assigns species using logic formulas based on the species-specific (diagnostic) codes (Table S8), which is suggested to be efficient and precise (van Velzen et al., 2012; Weitschek et al., 2013). Our results strongly support the highly discriminate capacity (84.85%) of this method, even when tested in Quercus, which is widely known as a taxonomically problematic group (Dumolin-Lapegue et al., 1999; Aldrich and Cavender-Bares, 2011). In addition, the highest species identification rate obtained with this approach is comparable to the average rate of successful species discrimination (70%) found in land plants (Ran et al., 2010; Hollingsworth et al., 2011), and also shows considerable ability of species identification compared with some previous researches in species-rich and recently divergent plant lineages using multiple DNA barcodes (Ran et al., 2010; Zhang et al., 2012; Simeone et al., 2013; Liu et al., 2014; Zhang J. Q. et al., 2015). However, caution should be taken as it is hard to provide a reliable/idealistic DNA barcoding reference containing specimens with a priori known species when not all the individuals of a species are tested against the putative barcode. Besides, the evolutionary processes of a species, such as local adaptation and hybridization, may obscure species identification by introducing negative mutations to the diagnostic sites in short DNA barcodes. Therefore, rather than indicating the species identification rate among the Chinese oaks, the character-based method may suggest possibilities of the barcode candidates that act as DNA barcodes to the oak species with those samples involved in this study, and bear further verification with additional individuals from unsampled areas. The BLAST-based method calculates the similarity of sequences with the assumption that conspecific individuals will be more similar to each other than to any other species (van Velzen et al., 2012). This method also yields higher identification rates than the distance- and tree-based methods as documented in several barcoding studies (Hassel et al., 2013; Chen et al., 2014; Yan et al., 2015). The tree-based approach is a bottom-up clustering algorithm that forms a single tree based on genetic distance matrix; however, the result could be affected by the distance algorithm used for tree construction (Yan et al., 2015), and by the incomplete lineage sorting effects among recently diverged species (Simeone et al., 2013). The (genetic distance-based) ABGD analysis has been proposed as a method sensitive to the presence of recent speciation events; in this method, species delimitation is based on the partition of intra- and inter-specific genetic distances of species datasets (Puillandre et al., 2012). However, in our study, application of this method seems impractical for barcoding the Chinese oak species given that the intra- and inter-specific genetic distances of the seven barcode candidates largely overlap (Figure 1; Table S5). Moreover, as it was concluded in a DNA barcoding test on Euro-Mediterranean oaks by Simeone et al. (2013), an increased sampling may lead to a continuum of overlapping genetic distances among closely related species, thus discouraging the successful species identification based on the genetic distance approach. The lack of a barcode gap among congeners was also observed for the Italian oak species, a probable consequence of low variation rate, frequent interspecific hybridization, and the complex incidence of biogeography of some sympatric species (Piredda et al., 2011).
Phylogenetic implications for the Chinese oak species
Despite the overall poor performance of DNA barcoding for the Chinese oak species, the (NJ) tree-based results provided considerable insights into phylogenetic relationships of the Chinese oaks in subg. Quercus. The NJ tree with the highest species discrimination (Figure 3) largely confirms the traditionally recognized Quercus infrageneric Groups Quercus, Cerris, and Ilex (Denk and Grimm, 2009, 2010; Denk and Tekleva, 2014; Hubert et al., 2014). This infrageneric framework is also supported by the NJ trees generated with two cpDNA barcode candidates (psbA-trnH and matK-trnK) (Figures S4, S5) and two nuclear genes (ITS and SAP) (Figures S9, S10) respectively. While for the three remaining cpDNA barcodes, the NJ trees indicated unclear boundaries among the three major groups of subg. Quercus (Figures S6–S8), probably due to a lower mutation rate and less genetic information of these cpDNA markers obtained among the Chinese oaks when compared with that of the intergenic psbA-trnH and matK-trnK regions and the two nuclear genes (Table 4). In contrast, the five morphology-based sections (Zhou et al., 1995; Pu et al., 2002; Peng et al., 2007) are controversial. Oak species of the Group Quercus (morphology-based Section Quercus) are clearly distinct from the clade comprising oaks of Groups Cerris and Ilex, strongly supporting a scenario of two possible originations (the New World and Old World Oaks) of Quercus that was previously identified with phylogenetic classification (Oh and Manos, 2008; Denk and Grimm, 2009, 2010; Denk and Tekleva, 2014; Hubert et al., 2014). In China, the three deciduous East Asian species of Group Cerris (morphology-based Section Aegilops) are strongly supported forming a monophyletic clade in contrast to the shared “Cerris-Ilex” haplotype scenario found in some Eurasian oaks (Denk and Grimm, 2010; Hubert et al., 2014; Simeone et al., 2016). Pollen morphology of the three cerriod oaks in East Asia (Q. acutissima, Q. variabilis, and Q. chenii) is different from the evergreen oaks of Group Ilex in China (Cao and Zhou, 2002), thus suggesting possible reproductive isolation between the cerriod and ilicoid oaks in China. However, although the hybrid formations are considered to be highly frequent among closely related species within a section/group, hybridization and gene flow between oak species from Groups Cerris and Ilex were found in Europe, such as hybridization between Quercus suber and Q. ilex, which may reflect enigmatic species evolutionary history of the two major Old World clades (Groups Cerris and Ilex) linked with complex incidence of geographical effects during different periods in Europe (Aldrich and Cavender-Bares, 2011; Hubert et al., 2014; Simeone et al., 2016). Within Group Ilex, species of the morphological Sections Heterbalanus, Engleriana, and Echinolepides are mixed and form multiple clades without clear boundaries in the NJ trees (i.e., Figures 3 and Figure S13), albeit the oaks among the three morphology-based sections show distinct morphological differences in foliage and acorn cupule patterns (Pu et al., 2002; Peng et al., 2007). Previous phylogenetic studies on Eurasian oaks involving a fraction of these evergreen Asian species indicated similar patterns, highlighting the incongruence between morphology and phylogenetic relationships in Quercus (Denk and Grimm, 2010; Simeone et al., 2016). Prior morphological and phylogenetic studies have provided evidences that Section Heterobalanus is an expanded/natural group within Group Ilex (Zhou et al., 1995; Manos et al., 2001; Deng et al., 2017); however, a morphologically distinct species (Quercus engleriana) was found to be paraphyletic within the Heterobalanus clade in that phylogeny (Manos et al., 2001), and our phylogenetic implications of NJ trees also rejected the monophyly of Section Heterobalanus (Figure 3 and Figure S13) except for a NJ tree using the combination of ITS and SAP (Figure S12), which slightly supported the Heterobalanus subclade (BP = 58) within Group Ilex. The sclerophyllous alpine oaks in Section Heterobalanus are largely sympatric and mainly concentrated in the Hengduan Mountains and adjacent alpine regions in east of the Himalayas, where they chiefly occur above 2000 m (Yang et al., 2009). Specific morphological characteristics of the alpine oak species in Section Heterobalanus, such as dense hairs, thick cuticles and lignified epidermal cell walls, are believed to be initiated by the cold and dry conditions of the Hengduan Mountains since the Miocene to Pliocene (Zhou et al., 2003), suggesting potential ecological niche shift of these alpine oaks to the intense orographic and climatic turbulence around the Qinghai-Tibetan Plateau. The hypothesis of the subclade Heterobalanus within Group Ilex based on two combined nuclear genes in this study also indicates that nuclear genes may provide more efficient phylogenetic signals than chloroplast genes having low mutation rate in recently divergent lineages. However, given the limited molecular markers and phylogenetic methodology used in the DNA barcoding test, the monophyly of Section Heterobalanus in Group Ilex still needs further verification with more functional nuclear genes. In summary, the lack of clear boundaries of the three evergreen morphological sections in Group Ilex can be explained by incomplete lineage sorting and/or gene introgression between closely related species (Manos et al., 2001; Denk and Grimm, 2010), as well as by limited genetic information revealed in current phylogeny, which requires further phylogenetic evidences using more comprehensive genomic coverage.
At the species level, the NJ tree with the highest discrimination rate identified 10 Chinese oak species in subg. Quercus, most of which are evergreen oaks in the Ilex group, while no species resolution was found among Chinese white oaks (Group Quercus) (Figures 3 and Figure S13). The identified evergreen species, for example Quercus franchetii, Quercus acrodonta, Quercus cocciferoides and Q. engleriana, are highly diverse in morphology and karyotype (Cao and Zhou, 2000), and evolved early according to fossil data (Zhou, 1993). Additionally, these oaks are endemic and allopatric, suggesting long-time isolation due geographical barriers among these species, which may have enhanced genetic and morphological differentiation during species evolution. This aspect is also found among the European oak species of Group Ilex, which showed conspicuous plastid diversity, reflecting complex geographical history and growing geographic isolation among members of this clade (Simeone et al., 2016). In contrast, some white oak species of Group Quercus, such as Q. aliena, Quercus fabri, and Quercus dentata, are widespread tree species across south China (Wang et al., 1985). Adaptive divergence to different ecological niches due extensive distribution could explain the species identification failure for this group. Additionally, fossil evidences and previous researches suggested recently radiative diversification of the closely related species involved in Group Quercus (Zhou, 1992; Hubert et al., 2014; Yang J. et al., 2016), which possibly indicates incomplete lineage sorting and shared ancestral polymorphism among these deciduous oak species. Moreover, according to the flora of China, flowering time of these white oaks highly overlaps from March to May, suggesting that frequent interspecific hybridization may occur among recently diverged species, thus eroding species coherence in this group. The latter explanation, as well as introgression, incomplete lineage sorting and reticulation (Simeone et al., 2013), have also been suggested as potential processes that complicate species identification of the morphology-based Section Heterobalanus (if it exists), which comprises 8–11 alpine sclerophyllous oaks that mainly happen in the Hengduan Mountains (Yang et al., 2009) and show identical florescence covering May and June.
Overall, the NJ results of the DNA barcoding analyses in this study highlighted the phylogenetic relationship and evolutionary significance of the Chinese oak species in subg. Quercus, and provided additional taxonomic patterns for the diverse oak lineage. However, considering the few DNA barcode candidates and a simple genetic distance method (p-distance) used for constructing NJ trees in our DNA barcoding analyses without regarding any evolutionary model and compatibility among these barcode candidates, the phylogenetic implications obtained from the NJ results in this study may be insufficient compared with that of a specific phylogenetic research, which warrant particular investigations using comprehensive samplings and analytical methods, as well as with more efficient genetic information covering the genomic level (Zhang et al., 2012; Simeone et al., 2013).
Conclusions
In this study, a comparative analysis on two chloroplast genomes (Q. rubra and C. mollissima) in Fagaceae was adopted to explore potential universal cpDNA markers for Quercus. After laborious screening on a subset of 14 deciduous Chinese oaks, 14 primer pairs revealing high intraspecific genetic diversity in most of the species dataset were selected for phylogeographic studies, while nine plastid regions exhibiting species discriminate potentials were retained for barcoding Quercus. Five of the nine plastid candidate barcodes, with additions of the proposed ITS region and a single-copy nuclear gene (SAP) were then used to test their discriminatory power employing four different barcoding methods for 35 Chinese oak species. Among the seven barcode candidates, the ITS and psbA-trnH regions provided the highest species resolution (30.30%) using the character- and BLAST-based method, respectively, and were recommended as core DNA barcodes for Quercus. The highest species discrimination rate (84.85%) was found using the combination of psbA-trnH + matK-trnK + matK + ycf1 + ITS + SAP with the character-based method, which seems to be the best choice for barcoding the Chinese oaks. The character-based method showed the best potential for species identification among the four barcoding methods, which is supported as an efficient tool for barcoding lineages having recently diverged species. The DNA barcoding results also provided phylogenetic implications for the framework of the Chinese oak species which has yet been assessed, supporting the phylogenetic classification of three major groups Quercus, Cerris and Ilex; however, the previously recognized five morphology-based sections proposed for the Chinese oaks are not well recovered. Some factors, such as low evolutionary rate of the plastid genome, interspecific hybridization and introgression, and incomplete lineage sorting, are likely to affect the phylogenetic signal in Chinese oaks and lead to intractable species identification based on different barcoding methods.
Statements
Author contributions
JY and GZ designed the research. JY, XC and HL performed the experiments. JY, XC, HL, and HZ contributed materials and data analysis. JY and LV wrote the paper. LV, ZL and GZ revised the paper. All authors read and approved the final manuscript.
Acknowledgments
We thank the two reviewers for their valuable comments and suggestions for improving the manuscript. We are grateful to all collectors listed in Table S1 for their assistance on sample collections. This work was financially supported by the Program for Changjiang Scholars and Innovative Research Team in University (No. IRT1174).
Conflict of interest
The authors declare that the research was conducted in the absence of any commercial or financial relationships that could be construed as a potential conflict of interest.
Supplementary material
The Supplementary Material for this article can be found online at: http://journal.frontiersin.org/article/10.3389/fpls.2017.00816/full#supplementary-material
Figure S1Annotation of the complete chloroplast genome of Quercus rubra. Inner circle indicates inferred structures of a complete chloroplast genome. Black boxes on the outer circle represent the selected regions for primer design.
Figure S2Estimation of mean intraspecific diversity (π) for 12 selected cpDNA markers (in Table 3) based on a subset of 14 Chinese oak species from morphology-based Sections Quercus and Aegilops. Box plots represent 95% confidence intervals and solid lines in the box plots indicate mean diversity values. Black dots indicate outlying values.
Figure S3Priming sites of the 17 selected cpDNA markers (Table 3) in chloroplast genome of Quercus rubra. White boxes indicate relative coding positions of chloroplast genes for primer design and gene names are displayed above. Black and gray lines indicate intergenic spacer and intron region, respectively. Numbers above the lines show the intergenic spacer and intron length (bp). Marker IDs are displayed in bold.
Figure S4NJ tree of the single barcode candidate psbA-trnH region for the Chinese oak species in Quercus subgenus Quercus.
Figure S5NJ tree of the single barcode candidate matK-trnK region for the Chinese oak species in Quercus subgenus Quercus.
Figure S6NJ tree of the single barcode candidate ycf3-trnS region for the Chinese oak species in Quercus subgenus Quercus.
Figure S7NJ tree of the single barcode candidate matK region for the Chinese oak species in Quercus subgenus Quercus.
Figure S8NJ tree of the single barcode candidate ycf1 region for the Chinese oak species in Quercus subgenus Quercus.
Figure S9NJ tree of the single barcode ITS region for the Chinese oak species in Quercus subgenus Quercus.
Figure S10NJ tree of the single-copy nuclear gene (SAP) for the Chinese oak species in Quercus subgenus Quercus highlights the species discrimination of Quercus acutissima from Quercus variabilis + Quercus chenii in Group Cerris.
Figure S11NJ tree based on the combination of five cpDNA barcode candidates for the Chinese oak species in Quercus subgenus Quercus.
Figure S12NJ tree based on the combination of two nuclear genes for the Chinese oak species in Quercus subgenus Quercus highlights the species discrimination of Quercus acutissima from Quercus variabilis + Quercus chenii in Group Cerris and shows the monophyletic subclade of Section Heterobalanus in Group Ilex.
Figure S13NJ tree of the combination with all seven candidate barcodes shows the phylogenetic implications for the Chinese oak species in Quercus subgenus Quercus. Gray dots highlight the individuals of identified oak species.
Table S1Information of voucher specimens of the 35 Chinese oak species in Quercus subgenus Quercus.
Table S2Information of 49 designed cpDNA markers based on the comparison of two chloroplast genomes of Quercus rubra and Castanea mollissima.
Table S3Estimation of intraspecific genetic diversity (π) for 14 deciduous oak species of morphology-based Sections Quercus and Aegilops based on the designed cpDNA markers.
Table S4Estimation of genetic information and Automatic Barcode Gap Discovery (ABGD) results for nine candidate barcodes based on 14 Chinese oak species.
Table S5Differentiation tests between the minimum interspecific and maximum intraspecific genetic distance (p-distance) for each barcode candidate and section.
Table S6Estimation of the highest species discrimination rates for four barcoding methods based on single and all possible barcode combinations.
Table S7Species resolution of seven single barcodes and all their possible combinations for the Chinese oaks based on four barcoding methods.
Table S8The minimum cost logic formula (diagnostic nucleotide) of the highest species identification using six barcode candidates (psbA-trnH + matK-trnK + matK + ycf1 + ITS + SAP) for the Chinese oaks.
Note S1Detailed methods for data filtering of the ITS sequence.
References
1
AldrichP. R.Cavender-BaresJ. (2011). Chapter 6 Quercus, in Wild Crop Relatives: Genomic and Breeding Resources, Forest Trees, ed KoleC. (Clemson: Springer-Verlag Berlin Heidelberg Press), 89–129.
2
AlexanderL. W.WoesteK. E. (2014). Pyrosequencing of the northern red oak (Quercus rubra L.) chloroplast genome reveals high quality polymorphisms for population management. Tree Genet. Genomes10, 803–812. 10.1007/s11295-013-0681-1
3
BertolazziP.FeliciG.WeitschekE. (2009). Learning to classify species with barcodes. BMC Bioinformatics10:S7. 10.1186/1471-2105-10-S14-S7
4
BorkowskiD. S.McClearyT.McAllisterM.SeversonJ. R. (2014). Primers for 52 polymorphic regions in the Quercus rubra chloroplast, 47 of which amplify across 11 tracheophyte clades. Tree Genet. Genomes10, 885–893. 10.1007/s11295-014-0729-x
5
BreenA. L.MurrayD. F.OlsonM. S. (2012). Genetic consequences of glacial survival: the late Quaternary history of balsam poplar (Populus balsamifera L.) in North America. J. Biogeogr.39, 918–928. 10.1111/j.1365-2699.2011.02657.x
6
CamachoC.CoulourisG.AvagyanV.MaN.PapadopoulosJ.et al. (2009). BLAST+: architecture and applications. BMC Bioinformatics10:421. 10.1186/1471-2105-10-421
7
CaoM.ZhouZ. K. (2000). A karyotype analysis of 9 species of the Quercus from China. Guihaia20, 341–345. 10.3969/j.issn.1000-3142.2000.04.012
8
CaoM.ZhouZ. K. (2002). Pollen morphology and its systematic significance of the Quercus from China. Guihaia22, 14–18. 10.1371/journal.pone.0161762
9
Cavender-BaresJ.Gonzalez-RodriguezA.PahlichA.KoehlerK.DeaconN. (2011). Phylogeography and climatic niche evolution in live oaks (Quercus series Virentes) from the tropics to the temperate zone. J. Biogeogr.38, 962–981. 10.1111/j.1365-2699.2010.02451.x
10
Cavender-BaresJ.Gonzalez-RodriguezA.EatonD. A.HippA. A.BeulkeA.ManosP. S. (2015). Phylogeny and biogeography of the American live oaks (Quercus subsection Virentes): a genomic and population genetics approach. Mol. Ecol.24, 3668–3687. 10.1111/mec.13269
11
CBOL Plant Working Group (2009). A DNA barcode for land plants. Proc. Natl. Acad. Sci. U.S.A.106, 12794–12797. 10.1073/pnas.0905845106
12
ChaseM. W.SalaminN.WilkinsonM.DunwellJ. M.KesanakurthiR. P.HaidarN.et al. (2005). Land plants and DNA barcodes: short-term and long-term goals. Proc. R. Soc. Lond. B Biol. Sci.360, 1889–1895. 10.1098/rstb.2005.1720
13
ChaseM. W.CowanR. S.HolllingsworthP. M.van den BergC.MadrinanS.PetersenG.et al. (2007). A proposal for a standardised protocol to barcode all land plants. Taxon56, 295–299.
14
ChenD. M.ZhangX. X.KangH. Z.SunX.YinS.DuH. M.et al. (2012). Phylogeography of Quercus variabilis based on chloroplast DNA sequence in East Asia: multiple glacial refugia and Mainland-migrated island populations. PLoS ONE7:e47268. 10.1371/journal.pone.0047268
15
ChenJ.ZhaoJ.EricksonD. L.XiaN.KressW. J. (2014). Testing DNA barcodes in closely related species of Curcuma (Zingiberaceae) from Myanmar and China. Mol. Ecol. Resour.15, 337–348. 10.1111/1755-0998.12319
16
China Plant BOL Group (2011). Comparative analysis of a large dataset indicates that internal transcribed spacer (ITS) should be incorporated into the core barcode for seed plants. Proc. Natl. Acad. Sci. U.S.A.108, 19641–19646. 10.1073/pnas.1104551108
17
DarlingA. E.MauB.PernaN. T. (2010). progressiveMauve: multiple genome alignment with gene gain, loss and rearrangement. PLoS ONE5:e11147. 10.1371/journal.pone.0011147
18
DengM.JiangX. L.SongY. G.CoombesA.YangX. R.XiongY. S.et al. (2017). Leaf epidermal features of Quercus Group Ilex (Fagaceae) and their application to species identification. Rev. Palaeobot. Palynol.237, 10–36. 10.1016/j.revpalbo.2016.11.006
19
DenkT.GrimmG. W. (2009). Significance of pollen characteristics for infrageneric classification and phylogeny in Quercus (Fagaceae). Int. J. Plant Sci.170, 926–940. 10.1086/600134
20
DenkT.GrimmG. W. (2010). The oaks of western Eurasia: traditional classifications and evidence from two nuclear markers. Taxon59, 351–366.
21
DenkT.TeklevaM. V. (2014). Pollen morphology and ultrastructure of Quercus with focus on Group Ilex (= Quercus subgenus Heterobalanus (Oerst.) Menitsky): impliations for oak systematics and evolution. Grana53, 255–282. 10.1080/00173134.2014.918647
22
DeSalleR.EganM. G.SiddallM. (2005). The unholy trinity: taxonomy, species delimitation and DNA barcoding. Proc. R. Soc. Lond. B Biol. Sci.360, 1905–1916. 10.1098/rstb.2005.1722
23
DongW. P.LiuJ.YuJ.WangL.ZhouS. L. (2012). Highly variable chloroplast markers for evaluating plant phylogeny at low taxonomic levels and for DNA barcoding. PLoS ONE7:e35071. 10.1371/journal.pone.0035071
24
DongW. P.XuC.LiC. H.SunJ. H.ZuoY. J.ShiS.et al. (2015). ycf 1, the most promising plastid DNA barcode of land plants. Sci. Rep.5:8348. 10.1038/srep08348
25
Dumolin-LapegueS.KremerA.PetitR. J. (1999). Are chloroplast and mitochondrial DNA variation species independent in oaks?Evolution53, 1406–1413. 10.2307/2640887
26
EricksonD. L.SpougeJ.ReschA.WeigtL. A.KressW. J. (2008). DNA barcoding in land plants: developing standards to quantify and maximize success. Taxon57, 1304–1316.
27
FengL.ZhengQ. J.QianZ. Q.YangJ.ZhangY. P.LiZ. H.et al. (2016). Genetic structure and evolutionary history of three Alpine Sclerophyllous oaks in East Himalaya-Hengduan Mountains and adjacent regions. Front. Plant Sci.7:1688. 10.3389/fpls.2016.01688
28
GreinerS.SobanskiJ.BockR. (2014). Why are most organelle genomes transmitted maternally?Bioessays37, 80–94. 10.1002/bies.201400110
29
GrivetD.DeguillouxM. F.PetitR. J.SorkV. L. (2006). Contrasting patterns of historical colonization in white oaks (Quercus spp.) in California and Europe. Mol. Ecol.15, 4085–4093. 10.1111/j.1365-294X.2006.03083.x
30
HallT. A. (1999). BioEdit: a user-friendly biological sequence alignment editor and analysis program for Windows 95/98/NT. Nucleic. Acids Symp. Ser.41, 95–98.
31
HarrisonS. P.YuG.TakaharaH.PrenticeI. C. (2001). Palaeovegetation. Diversity of temperate plants in east Asia. Nature413, 129–130. 10.1038/35093166
32
HasselK.SegretoR.EkremT. (2013). Restricted variation in plant barcoding markers limits identification in closely related bryophyte species. Mol. Ecol. Resour.13, 1047–1057. 10.1111/1755-0998.12074
33
HebertP. D.RatnasinghamS.de WaardJ. R. (2003). Barcoding animal life: cytochrome c oxidase subunit 1 divergences among closely related species. Proc. R. Soc. Lond. B Biol. Sci.270, s96–s99. 10.1098/rsbl.2003.0025
34
HickersonM. J.CarstensB. C.Cavender-BaresJ.CrandallK. A.GrahamC. H.JohnsonJ. B.et al. (2010). Phylogeography's past, present, and future: 10 years after Avise, (2000). Mol. Phylogenet. Evol.54, 291–301. 10.1016/j.ympev.2009.09.016
35
HollingsworthP. M.GrahamS. W.LittleD. P. (2011). Choosing and using a plant DNA barcode. PLoS ONE6:e19254. 10.1371/journal.pone.0019254
36
HubertF.GrimmG. W.JousselinE.BerryV.FrancA.KremerA. (2014). Multiple nuclear genes stabilize the phylogenetic backbone of the genus Quercus. Syst. Biodivers.12, 405–423. 10.1080/14772000.2014.941037
37
Jaen-MolinaR.Marrero-rodriguezA.Reyes-BetancortJ. A.Santos-GuerraA.Naranjo-SuarezJ.Caujape-CastellsJ. (2015). Molecular taxonomic identification in the absence of a ‘barcoding gap’: a test with the endemic flora of the Canarian oceanic hotspot. Mol. Ecol. Resour.15, 42–56. 10.1111/1755-0998.12292
38
JansenR. K.SaskiC.LeeS. B.HansenA. K.DaniellH. (2011). Complete plastid genome sequences of three Rosids (Castanea, Prunus, Theobroma): evidence for at least two independent transfers of rpl22 to the nucleus. Mol. Biol. Evol.28, 835–847. 10.1093/molbev/msq261
39
KremerA.AbbottA. G.CarlsonJ. E.ManosP. S.PlomionC.SiscoP.et al. (2012). Genomics of Fagaceae. Tree Genet. Genomes8, 583–610. 10.1007/s11295-012-0498-3
40
KressW. J.EricksonD. L. (2007). A two-locus global DNA barcode for land plants: the coding rbcL gene complements the non-coding trnH-psbA spacer region. PLoS ONE2:e508. 10.1371/journal.pone.0000508
41
KressW. J.WurdackK. J.ZimmerE. A.WeigtL. A.JanzenD. H. (2005). Use of DNA barcodes to identify flowering plants. Proc. Natl. Acad. Sci. U.S.A.102, 8369–8374. 10.1073/pnas.0503123102
42
KrishnamurthyP. K.FrancisR. A. (2012). A critical review on the utility of DNA barcoding in biodiversity conservation. Biodivers. Conserv.21, 1901–1919. 10.1007/s10531-012-0306-2
43
KurtzS.ChoudhuriJ. V.OhlebuschE.SchleiermacherC.StoyeJ.GiegerichR. (2001). REPuter: the manifold applications of repeat analysis on a genomic scale. Nucleic Acids Res.29, 4633–4642. 10.1093/nar/29.22.4633
44
LiX. H.ShaoJ. W.LuC.ZhangX. P.QiuY. X. (2012). Chloroplast phylogeography of a temperate tree Pteroceltis tatarinowii (Ulmaceae) in China. J. Syst. Evol.50, 325–333. 10.1111/j.1759-6831.2012.00203.x
45
LiX. W.YangY.HenryR. J.RossettoM.WangY. T.ChenS. L. (2015). Plant DNA barcoding: from gene to genome. Biol. Rev.90, 157–166. 10.1111/brv.12104
46
LiuJ.MollerM.GaoL. M.ZhangD. Q.LiD. Z. (2011). DNA barcoding for the discrimination of Eurasian yews (Taxus, L., Taxaceae) and the discovery of cryptic species. Mol. Ecol. Resour.11, 89–100. 10.1111/j.1755-0998.2010.02907.x
47
LiuJ. Q.SunY. S.GeX. J.GaoL. M.QiuY. X. (2012). Phylogeographic studies of plants in China, Advances in the past and directions in the future. J. Syst. Evol.50, 267–275. 10.1111/j.1759-6831.2012.00214.x
48
LiuJ. X.ShiL. C.HanJ. P.LiG.LuH.HouJ. Y.et al. (2014). Identification of species in the angiosperm family Apiaceae using DNA barcodes. Mol. Ecol. Resour.14, 1231–1238. 10.1111/1755-0998.12262
49
MaC. L.ZhouZ. K. (2006). Effect of ITS pseudogene on the phylogenetic study of Quercus (Fagaceae) and its revelation on the plant molecular phylogenetics. Acta Bot. Yunnanica28, 127–132. 10.3969/j.issn.2095-0845.2006.02.007
50
MagniC. R.DucoussoA.CaronH.PetitR. J.KremerA. (2005). Chloroplast DNA variation of Quercus rubra L. in North America and comparison with other Fagaceae. Mol. Ecol.14, 513–524. 10.1111/j.1365-294X.2005.02400.x
51
ManosP. S.SteeleK. P. (1997). Phylogenetic analyses of “higher” hamamelididae based on plastid sequence data. Am. J. Bot.84, 1407–1419. 10.2307/2446139
52
ManosP. S.ZhouZ. K.CannonC. H. (2001). Systematics of Fagaceae: phylogenetic tests of reprodective trait evolution. Int. J. Plant Sci.162, 1361–1379. 10.1086/322949
53
MenitskyY. L. (2005). Oaks of Asia. Enfield, NH: Science Publishers.
54
MuellnerA. N.SchaeferH.LahayeR. (2011). Evaluation of candidate DNA barcoding loci for economically important timber species of the mahogany family (Meliaceae). Mol. Ecol. Resour.11, 450–460. 10.1111/j.1755-0998.2011.02984.x
55
NaciriY.CaetanoS.SalaminN. (2012). Plant DNA barcodes and the influence of gene flow. Mol. Ecol. Resour.12, 575–580. 10.1111/j.1755-0998.2012.03130.x
56
NeubigK. M.WhittenW. M.CarlswardB. S.BlancoM. A.EndaraL.WilliamsN. H.et al. (2009). Phylogenetic utility of ycf 1 in orchids: a plastid gene more variable than matK. Plant Syst. Evol.277, 75–84. 10.1007/s00606-008-0105-0
57
NixonK. C. (1993). Infrageneric classification of Quercus (Fagaceae) and typification of sectional names. Ann. Sci. For.50, 25s–34s. 10.1051/forest:19930701
58
OhS.-H.ManosP. S. (2008). Molecular phylogenetics and cupule evolution in fagaceae as inferred from nuclear CRABS CLAW sequences. Taxon57, 434–451.
59
PangX. H.SongJ. Y.ZhuY. J.XuH. X.HuangL. F.ChenS. L. (2011). Applying plant DNA barcodes for Rosaceae species identification. Cladistics27, 165–170. 10.1111/j.1096-0031.2010.00328.x
60
PengY. S.ChenL.LiJ. Q. (2007). Study on numerical taxonomy of Quercus, L. (Fagaceae) in China. J. Wuhan Bot. Res.25, 149–157. 10.3969/j.issn.2095-0837.2007.02.008
61
PetitR. J.CsaiklU. M.BordacsS.BurgK.CoartE.CottrellJ.et al. (2002). Chloroplast DNA variation in European white oaks: phylogeography and patterns of diversity based on data from over 2600 populations. For. Ecol. Manage.156, 5–26. 10.1016/s0378-1127(01)00645-4
62
PireddaR.SimeoneM. C.AttimonelliM.BellarosaR.SchironeB. (2011). Prospects of barcoding the Italian wild dendroflora: oaks reveal severe limitations to tracking species identity. Mol. Ecol. Resour.11, 72–83. 10.1111/j.1755-0998.2010.02900.x
63
PuC. X.ZhouZ. K.LuoY. (2002). A cladistic analysis of Quercus (Fagaceae) in China based on leaf epidermis and architecture. Acta Bot. Yunnanica24, 689–698. 10.3969/j.issn.2095-0845.2002.06.002
64
PuillandreN.LambertA.BrouilletS.AchazG. (2012). ABGD, automatic barcode gap discovery for primary species delimitation. Mol. Ecol.21, 1864–1877. 10.1111/j.1365-294X.2011.05239.x
65
QiuY. X.FuC. X.ComesH. P. (2011). Plant molecular phylogeography in China and adjacent regions: tracing the genetic imprints of Quaternary climate and environmental change in the world's most diverse temperate flora. Mol. Phylogenet. Evol.59, 225–244. 10.1016/j.ympev.2011.01.012
66
R Development Core Team (2011). R: A Language And Environment For Statistical Computing. Vienna: R Foundation for Statistical Computing.
67
RanJ. H.WangP. P.ZhaoH. J.WangX. Q. (2010). A test of seven candidate barcode regions from the plastome in Picea (Pinaceae). J. Integr. Plant Biol.52, 1109–1126. 10.1111/j.1744-7909.2010.00995.x
68
RozasJ.Sanchez-DelbarrioJ. C.MesseguerX.RozasR. (2003). DnaSP, DNA polymorphism analyses by the coalescent and other methods. Bioinformatics19, 2496–2497. 10.1093/bioinformatics/btg359
69
ShawJ.LickeyE. B.SchillingE. E.SmallR. L. (2007). Comparison of whole chloroplast genome sequences to choose noncoding regions for phylogenetic studies in Angiosperms: the tortoise and the hare III. Am. J. Bot.94, 275–288. 10.3732/ajb.94.3.275
70
SimeoneM. C.PireddaR.PapiniA.VessellaF.SchironeB. (2013). Application of plastid and nuclear markers to DNA barcoding of Euro-Mediterranean oaks (Quercus, Fagaceae): problems, prospects and phylogenetic implications. Bot. J. Linn. Soc.172, 478–499. 10.1111/boj.12059
71
SimeoneM. C.GrimmG. W.PapiniA.VessellaF.CardoniS.TordoniE.et al. (2016). Plastome data reveal multiple geographic origins of Quercus Group Ilex. PeerJ4:e1897. 10.7717/peerj.1897
72
SimmonsM. P.OchoterenaH. (2000). Gaps as characters in sequence-based phylogenetic analysis. Syst. Biol.49, 369–381. 10.1093/sysbio/49.2.369
73
TamuraK.StecherG.PetersenD. C. (2013). MEGA6: molecular evolutionary genetics analysis version 6.0. Mol. Biol. Evol.30, 2725–2729. 10.1093/molbev/mst197
74
TaylorH. R.HarrisW. E. (2012). An emergent science on the brink of irrelevance: a review of the past 8 years of DNA barcoding. Mol. Ecol. Resour.12, 377–388. 10.1111/j.1755-0998.2012.03119.x
75
ThomsonR. C.WangI. J.JohnsonJ. R. (2010). Genome-enabled development of DNA markers for ecology, evolution and conservation. Mol. Ecol.19, 2184–2195. 10.1111/j.1365-294X.2010.04650.x
76
TzedakisP. C.EmersonB. C.HewittG. M. (2013). Cryptic or mystic? Glacial tree refugia in northern Europe. Trends Ecol. Evol.28, 696–704. 10.1016/j.tree.2013.09.001
77
van VelzenR.WeltschekE.FellciG.BakkerF. T. (2012). DNA barcoding of recently diverged species: relative performance of matching methods. PLoS ONE7:e30490. 10.1371/journal.pone.0030490
78
VijS.TyagiA. K. (2006). Genome-wide analysis of the stress associated protein (SAP) gene family containing A20/AN1 zinc-finger(s) in rice and their phylogenetic relationship with Arabidopsis. Mol. Genet. Genomics276, 565–575. 10.1007/s00438-006-0165-1
79
WangL. M.RenX. W.LiuY. Q. (1985). Geographic distribution of deciduous oaks in China. J. Beijing Forestry Coll.2, 57–69.
80
WangQ.YuQ. S.LiuJ. Q. (2011). Are nuclear loci ideal for barcoding plants? A case study of genetic delimitation of two sister species using multiple loci and multiple intraspecific individuals. J. Syst. Evol.49, 182–188. 10.1111/j.1759-6831.2011.00135.x
81
WangX. C.LiuC.HuangL.Bengtsson-PalmeJ.ChenH.ZhangJ. H.et al. (2015). ITS1: a DNA barcode better than ITS2 in eukaryotes?Mol. Ecol. Resour.15, 573–586. 10.1111/1755-0998.12325
82
WangY. H.YuQ.YangJ.ZhaoP.LiZ. H.ZhaoG. F. (2015). Genetic diversity and population structure of Quercus serrata var. breviptiolata revealed by nSSR markers. Scientia Silvae Sinicae51, 121–131. 10.11707/j.1001-7488.20151215
83
WeitschekE.van VelzenR.FeliciG.BertolazziP. (2013). BLOG 2.0: a software system for character-based species classification with DNA Barcode sequences. What it does, how to use it. Mol. Ecol. Resour.13, 1043–1046. 10.1111/1755-0998.12073
84
WuC. I. (2001). The genic view of the process of speciation. J. Ecol. Biol.14, 851–865. 10.1046/j.1420-9101.2001.00335.x
85
YanL. J.LiuJ.MollerM.ZhangL.ZhangX. M.LiD. Z.et al. (2015). DNA barcoding of Rhododendron (Ericaceae), the largest Chinese plant genus in biodiversity hotspots of the Himalaya-Hengduan Mountains. Mol. Ecol. Resour.15, 932–944. 10.1111/1755-0998.12353
86
YangQ. S.ChenW. Y.XiaK.ZhouZ. K. (2009). Climatic envelope of evergreen sclerophyllous oaks and their present distribution in the eastern Himalaya and Hengduan Mountains. J. Syst. Evol.47, 183–190. 10.1111/j.1759-6831.2009.00020.x
87
YangJ.DiX. Y.MengX.FengL.LiuZ. L.ZhaoG. F. (2016). Phylogeography and evolution of two closely related oak species (Quercus) from north and northeast China. Tree Genet. Genomes12, 89. 10.1007/s11295-016-1044-5
88
YangY. C.ZhouT.DuanD.YangJ.FengL.ZhaoG. F. (2016). Comparative analysis of the complete chloroplast genomes of five Quercus species. Front. Plant Sci.7:959. 10.3389/fpls.2016.00959
89
ZengY. F.LiaoW. J.PetitR. J.ZhangD. Y. (2011). Geographic variation in the structure of oak hybrid zones provides insights into the dynamics of speciation. Mol. Ecol.20, 4995–5011. 10.1111/j.1365-294X.2011.05354.x
90
ZengY. F.WangW. T.LiaoW. J.WangH. F.ZhangD. Y. (2015). Multiple glacial refugia for cool-temperate deciduous trees in northern East Asia: the Mongolian oak as a case study. Mol. Ecol.24, 5676–5691. 10.1111/mec.13408
91
ZhangC. Y.WangF. Y.YanH. F.HaoG.HuC. M.GeX. J. (2012). Testing DNA barcoding in closely related groups of Lysimachia, L. (Myrsinaceae). Mol. Ecol. Resour.12, 98–108. 10.1111/j.1755-0998.2011.03076.x
92
ZhangX. W.LiY.LiuC. Y.XiaT.ZhangQ.FangY. M. (2015). Phylogeography of the temperate tree species Quercus acutissima in China: Inferences from chloroplast DNA variations. Biochem. Syst. Ecol.63, 190–197. 10.1016/j.bse.2015.10.010
93
ZhangJ. Q.MengS. Y.WenJ.RaoG. Y. (2015). DNA barcoding of Rhodiola (Crassulaceae): a case study on a group of recently diversified medicinal plants from the Qinghai-Tibetan Plateau. PLoS ONE10:e0119921. 10.1371/journal.pone.0119921
94
ZhouZ. K.WilkinsonH.WuZ. Y. (1995). Taxonomical and evolutionary of the leaf anatomy and architecture of Quercus L. subgenus Quercus from China. Cathaya7, 1–34.
95
ZhouZ. K.PuC. X.ChenW. Y. (2003). Relationships between the distributions of Quercus Sect. Heterobalanus (Fagaceae) and uplift of Himalayas. Adv. Earth Sci.18, 884–890. 10.11867/j.issn.1001-8166.2003.06.0884
96
ZhouZ. K. (1992). Origin, phylogeny and dispersal of Quercus from China. Acta Bot. Yunnanica14, 227–236.
97
ZhouZ. K. (1993). Geographical distribution of Quercus from China. J. Grad. Sch. Acad. Sin.3, 95–108.
98
ZouS. M.LiQ.KongL. F.YuH.ZhengX. D. (2011). Comparing the usefulness of distance, monophyly and character-based DNA barcoding methods in species identification: a case study of Neogastropoda. PLoS ONE6:e26619. 10.1371/journal.pone.0026619
Summary
Keywords
plastid marker, nuclear gene, species discrimination, hybridization, phylogeny, Quercus
Citation
Yang J, Vázquez L, Chen X, Li H, Zhang H, Liu Z and Zhao G (2017) Development of Chloroplast and Nuclear DNA Markers for Chinese Oaks (Quercus Subgenus Quercus) and Assessment of Their Utility as DNA Barcodes. Front. Plant Sci. 8:816. doi: 10.3389/fpls.2017.00816
Received
23 January 2017
Accepted
01 May 2017
Published
19 May 2017
Volume
8 - 2017
Edited by
Badri Padhukasahasram, Illumina, USA
Reviewed by
Xue-jun Ge, South China Institute of Botany, China; Pedro Edson Moreira Guimaraes, Universidade Federal de Uberlândia, Brazil
Updates
Copyright
© 2017 Yang, Vázquez, Chen, Li, Zhang, Liu and Zhao.
This is an open-access article distributed under the terms of the Creative Commons Attribution License (CC BY). The use, distribution or reproduction in other forums is permitted, provided the original author(s) or licensor are credited and that the original publication in this journal is cited, in accordance with accepted academic practice. No use, distribution or reproduction is permitted which does not comply with these terms.
*Correspondence: Guifang Zhao gfzhao@nwu.edu.cn
This article was submitted to Evolutionary and Population Genetics, a section of the journal Frontiers in Plant Science
Disclaimer
All claims expressed in this article are solely those of the authors and do not necessarily represent those of their affiliated organizations, or those of the publisher, the editors and the reviewers. Any product that may be evaluated in this article or claim that may be made by its manufacturer is not guaranteed or endorsed by the publisher.