- 1Key Laboratory of New Technology in Agricultural Application, College of Plant Science and Technology, Beijing University of Agriculture, Beijing, China
- 2Beijing Genomics Institute-Shenzhen, Shenzhen, China
- 3College of Plant Science, Jilin University, Changchun, China
The adzuki bean (Vigna angularis) is an important grain legume. Fine mapping of quantitative trait loci (QTL) and qualitative trait genes plays an important role in gene cloning, molecular-marker-assisted selection (MAS), and trait improvement. However, the genetic control of agronomic traits in the adzuki bean remains poorly understood. Single-nucleotide polymorphisms (SNPs) are invaluable in the construction of high-density genetic maps. We mapped 26 agronomic QTLs and five qualitative trait genes related to pigmentation using 1,571 polymorphic SNP markers from the adzuki bean genome via restriction-site-associated DNA sequencing of 150 members of an F2 population derived from a cross between cultivated and wild adzuki beans. We mapped 11 QTLs for flowering time and pod maturity on chromosomes 4, 7, and 10. Six 100-seed weight (SD100WT) QTLs were detected. Two major flowering time QTLs were located on chromosome 4, firstly VaFld4.1 (PEVs 71.3%), co-segregating with SNP marker s690-144110, and VaFld4.2 (PEVs 67.6%) at a 0.974 cM genetic distance from the SNP marker s165-116310. Three QTLs for seed number per pod (Snp3.1, Snp3.2, and Snp4.1) were mapped on chromosomes 3 and 4. One QTL VaSdt4.1 of seed thickness (SDT) and three QTLs for branch number on the main stem were detected on chromosome 4. QTLs for maximum leaf width (LFMW) and stem internode length were mapped to chromosomes 2 and 9, respectively. Trait genes controlling the color of the seed coat, pod, stem and flower were mapped to chromosomes 3 and 1. Three candidate genes, VaAGL, VaPhyE, and VaAP2, were identified for flowering time and pod maturity. VaAGL encodes an agamous-like MADS-box protein of 379 amino acids. VaPhyE encodes a phytochrome E protein of 1,121 amino acids. Four phytochrome genes (VaPhyA1, VaPhyA2, VaPhyB, and VaPhyE) were identified in the adzuki bean genome. We found candidate genes VaAP2/ERF.81 and VaAP2/ERF.82 of SD100WT, VaAP2-s4 of SDT, and VaAP2/ERF.86 of LFMW. A candidate gene VaUGT related to black seed coat color was identified. These mapped QTL and qualitative trait genes provide information helpful for future adzuki bean candidate gene cloning and MAS breeding to improve cultivars with desirable growth periods, yields, and seed coat color types.
Introduction
The adzuki bean (Vigna angularis) is an important diploid pulse crop (2n = 2x = 22) that is rich in easily digestible protein with extremely low fat content (Lin, 2002). It was domesticated about 12,000 years ago in China (Liu et al., 2013), and is cultivated today in over 30 countries of the world, principally those of eastern and northern Asia (Tomooka et al., 2002; Kramer et al., 2012). China is the largest producer of adzuki beans in the world, with an area of approximately 25,000 ha cultivated annually (Cheng and Tian, 2009). The adzuki bean is a rich source of phenolic compounds, flavonoids, vitamin A, vitamin B, iron, zinc, and folate (Amarowicz et al., 2008; Yao et al., 2012).
Gene and QTL mapping is very important for gene cloning, MAS breeding, and trait improvement; however, only a few studies have focused on mapping the QTL and the qualitative trait genes in the adzuki bean. The QTLs of 21 domestication-related traits were first mapped to different linkage groups by 21 polymorphic SSR markers using the same BC1F1,F2,and F2:3 populations to construct a molecular linkage map (Han et al., 2005). Most traits mapped to particular regions of linkage groups (LGs) 1, 2, 4, 7, and 9. Pod size, germination efficacy, seed size, and lower stem length mapped to LGs 1 and 2. The QTLs of LGs 7 and 9 were associated with upper-stem length, maximum leaf size, and pod and seed sizes (Isemura et al., 2007).
Kaga et al. (2008) used 316 SSR primer pairs from the adzuki bean (Wang et al., 2004), 170 SSR primer pairs from the common bean, 45 cowpea SSR primer pairs, and AFLPs to screen for polymorphisms in the two parents. In total, 176 adzuki bean SSRs and 5 common bean SSR primer pairs exhibited clear polymorphisms. F2 mapping population consisted of 188 plants derived from crosses between the Japanese wild bean (V. angularis var. nipponensis) and the cultivated adzuki bean (V. angularis var. angularis). The AFLP approach was developed to fill a large gap (~40 cM) in the center of LG9. In total, 233 markers (191 SSRs, 2 STSs, 1 CAPS, 2 SCARs, and 36 AFLPs) and three morphological traits were mapped to 10 linkage groups (one less than the 11 haploid chromosomes of the adzuki bean). One linkage group, termed “LG4+6,” contained the LG4 and LG6 markers of previous maps. In total, 162 QTLs influencing 46 domestication-related traits were identified. The QTLs affecting seed dormancy; seedling stem length; red seed-coat color; and the organ sizes of seeds, pods, and leaves, were mapped to LG1. The QTLs for pod dehiscence, length, size, and color lay on LG7. The QTLs for organ size, growth habit, and yield-related traits (total seed weight, total pod and seed numbers, 100-seed weight, and total seed weight), maximum leaflet length, primary leaf width, and pod width and length lay in two distinct regions of LG9 (Kaga et al., 2008).
Azuki Dwarf1 (AD1), a single genetically unstable dwarf locus, co-segregates with SSRs on LG4 (Aoyama et al., 2011). A strong QTL for seed coat color, designated OLB1, explains 54.43 and 56% of the total variances in the L* (lightness), a* (redness), and b* (yellowness) values. In addition, a minor QTL, designated OLB2, explains 6% of the total variance in redness. OLB1 and OLB2 are located in LG1. Furthermore, two traits controlled by a single Mendelian gene: IVY (ivory/yellow) and POB (pale olive/buff) (seed coat colors) are located in LG8 and LG10, respectively (Horiuchi et al., 2015).
We previously published a draft version of the adzuki bean genome (Yang et al., 2015), which will facilitate the identification of agronomic trait genes and accelerate the improvement of adzuki bean.
However, to the best of our knowledge, no QTL analysis using high-density segregated SNPs has been performed in adzuki bean. In this study, we initially collected phenotypic data and then defined genotypic data using SNP markers via restriction-site-associated DNA (RAD) sequencing. The QTLs of important agronomic traits of the adzuki bean were mapped using these polymorphic SNP markers. Our results elucidate how genetic features control the agronomic traits of the adzuki bean, and the major QTLs and genes that we have identified will expedite MAS breeding and the improvement of these traits in adzuki bean.
Materials and Methods
The Mapping Population
The F2 mapping population initially comprised 250 individuals derived by crosses between an adzuki bean cultivar (Ass001) and a wild adzuki bean (accession # CWA108) collected in China. The F2 population, and 10 plants of each parent, were grown in the Experimental Farm of Beijing University of Agriculture (BUA) from June to October, 2013. A single seed was planted with 60-cm row spacing and 30-cm plant spacing. Each F2:3 line had two rows that were 3 m long and 45 cm wide; 35 seeds were evenly planted in each row in the field in June 2014 at the BUA Experimental Farm. From the center of the rows, 10 representational plants were selected to evaluate traits, and 10 plants from each parent were grown together with the F2:3 line. The RIL (Recombinant Inbred lines) of F3 were obtained from single seed descendent of the F2 individuals; their parents were grown in the same manner as F2 at the BUA Experimental Farm in 2014 and 2015. F3:4 lines and parents were planted and evaluated for traits in the same manner as F2:3 lines at the BUA Experimental Farm in 2015.
We selected 150 typical F2 individuals to extract DNA for RAD sequencing.
Trait Measurements
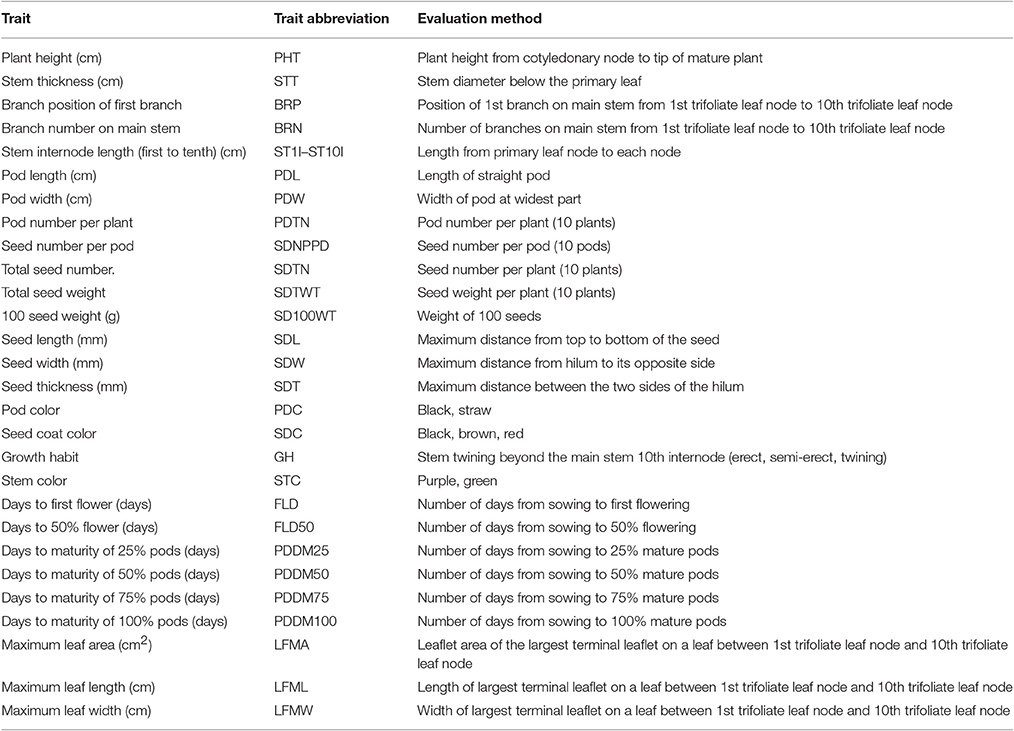
In total, 28 traits, including 24 quantitative, and 4 qualitative traits, were evaluated in F2, F3, and F4 generations from 2013 to 2015 (Table 1; Table S1). Morphology was investigated according to a published standard (Tomooka et al., 2002; Cheng et al., 2012). The traits included the color of the seed-coat, pod, stem and flower; the first-to-tenth internodal length; the maximal leaf length and width; the maximum leaflet area; and the growth habit at 50% of flowering; we investigated plant height, stem diameter, the number of branches, flowering time, and pod maturing time; and 100-seed weight, seed size, and pod size were measured after harvesting, respectively. The maximal leaf lengths and widths, and leaflet areas, were estimated with the aid of a YMJ-C leaf area meter (Zhejiang Top Instrument Co., Ltd., China). The lengths, widths, and thicknesses of 10 seeds were measured using digital calipers.
RAD-Sequencing and SNP Detection
Genomic DNA of 150 F2 individual plants and 10 plants of their parents were selected from which to extract genomic DNA from young leaves using the CTAB protocol. DNA was digested with EcoRI using the method of Baird et al. (2008) with minor modifications for RAD sequencing. SNP detection and genetic map construction followed the method of Yang et al. (2015).
Data Analysis and QTL Mapping
We calculated the mean, the standard error of the mean, and broad-sense heritability (the value) of investigated 24 quantitative traits, including plant height, organ size, yield, flowering time and maturing period, and plant architecture (Table 1) for parents, and the F2, F3, F4 populations. The heritability was computed using a method of regression for progeny values on parental values. The calculation of employed the formula: = bF2·F2:3 = COVF2·F2:3/VF2.
Using RAD tag technology, SNPs were identified among 150 F2 individuals derived from a cross of cultivar Ass001 (P1) with the wild adzuki bean accession no. CWA108 (P2). After genotyping, a linkage map was created using JoinMap 4.0 software (Van Ooijen, 2006) running F2 population-type codes. Markers exhibiting distorted segregation (p < 0.01, Chi-squared test) were excluded (Grattapaglia and Sederoff, 1994). The remaining 1,571 markers were used to construct a genetic map. Eleven linkage groups (for adzuki bean, 2n = 22 chromosomes) were formed with the logarithm-of-the-odds (LOD) score set to 6.0 (Yang et al., 2015) and ordered using a regression mapping algorithm. Recombination frequencies were translated to genetic distances using Kosambi's mapping function (Kosambi, 1994). Qualitative trait genes were mapped using JoinMap 4.1.
Five Mendelian phenotype markers (stem color, flower color, pod color, and two seed coat colors) were detected as described in the Methods section. These phenotype markers were used as molecular markers for genotyping and linkage grouping.
Further QTL analysis was performed using MapQTL 6.0 software, which is widely used in the analysis of QTLs (Van Ooijen, 2009). First, the PERMUTATION test was used to obtain genome-wide LOD thresholds (p < 0.05), and each trait was subjected to 10,000 permutations to derive the empirical LOD threshold (Churchill and Doerge, 1994). Next, the regression approach of the interval mapping model was introduced to obtain LOD values for all the significant markers, and these were associated with candidate traits. All mapping markers for which the LOD value was equal to or greater than the LOD threshold value were retained. Finally, these significant markers were used as cofactors in the multiple QTL method (MQM) (Jansen, 1993), such that the identified markers were adjacent to the significant QTLs in each group. All mapping information including chromosomal location, magnitude, direction of the additive effect, and the proportion of the phenotypic variation explained (PVE) in each detected QTL was obtained from the MQM outputs. Markers with LODs greater than the LOD threshold were identified and were regarded as the optimal final markers.
Candidate Gene Identification and Phylogenetic Analysis
Based on candidate gene sequences of E3, which encodes phyA-type photoreceptors involved in the control of flowering and maturity in soybean (Liu et al., 2008; Watanabe et al., 2009), transcription factor agamous-like MADS-box and AP2 were detected in the mapping regions for flowering time, maturity, and seed coat color. We downloaded 427 AP2 gene sequences, 123 MADS gene sequences, 95 PHY gene sequences, and 150 UGT gene (UDP flavonoid glycosyl transferase) sequences of Arabidopsis thaliana from NCBI. All of these protein sequences were used as seed sequences during gene copy number analysis. These four gene types were searched for and identified from the adzuki bean genome (PRJNA261643), and other sequenced legume genomes like soybean (phytozomev10), chickpea (http://gigadb.org /dataset/100076), Medicago truncatula (phytozomev10), pigeonpea (http://gigadb.org/dataset/100028), common bean (phytozomev10), mung bean (ftp.ncbi.nih.gov) and Arachis duranensis (http://www.peanutbase.org/), and from the genomes of Arabidopsis (TAIR9, Phytozome v10.0), Brassica rapa (Phytozome v10.0), rice (http://rice.plantbiology.msu.edu/), maize (phytozomev10). Previously published related gene sequences from Arabidopsis genomes were collected and used as query sequences. These query sequences were then used to align each sequenced legume genome sequence using TBLASTN v2.2.23 with a threshold E-value less than 10−10. Because we obtained so many alignment results within the nearby genomic area, we extracted high quality alignments (query_align_ratio, the ratio of alignment length of query sequences size ≥ 70% and identity ≥ 40%). Functional intact genes were confirmed via collection of blast-hits using the above method. Each of the blast-hit sequences was then extended in both 3′ and 5′ directions along the genome sequences to predict gene structure using Genewise. The resulting sequences were further confirmed by phylogenetic structure analysis. Finally, the coding sequences with proper ATG or the stop codon were extracted, but not those with interrupting stop codons or frame shifts.
Results
Phenotypic Variation and Genetic Analysis
The phenotypes of the cultivated and wild plants differed significantly. The female parent Ass001 (a cultivar) had a red seed coat, a straw-colored pod, a green stem, an erect plant, and a large seed. The wild parent had a black seed coat, a black pod, a purple stem, a twining plant, and a small seed. The different individuals in the same generation exhibited wide segregation for agronomic traits or variation (Table S1, Table 2, Figure 1).
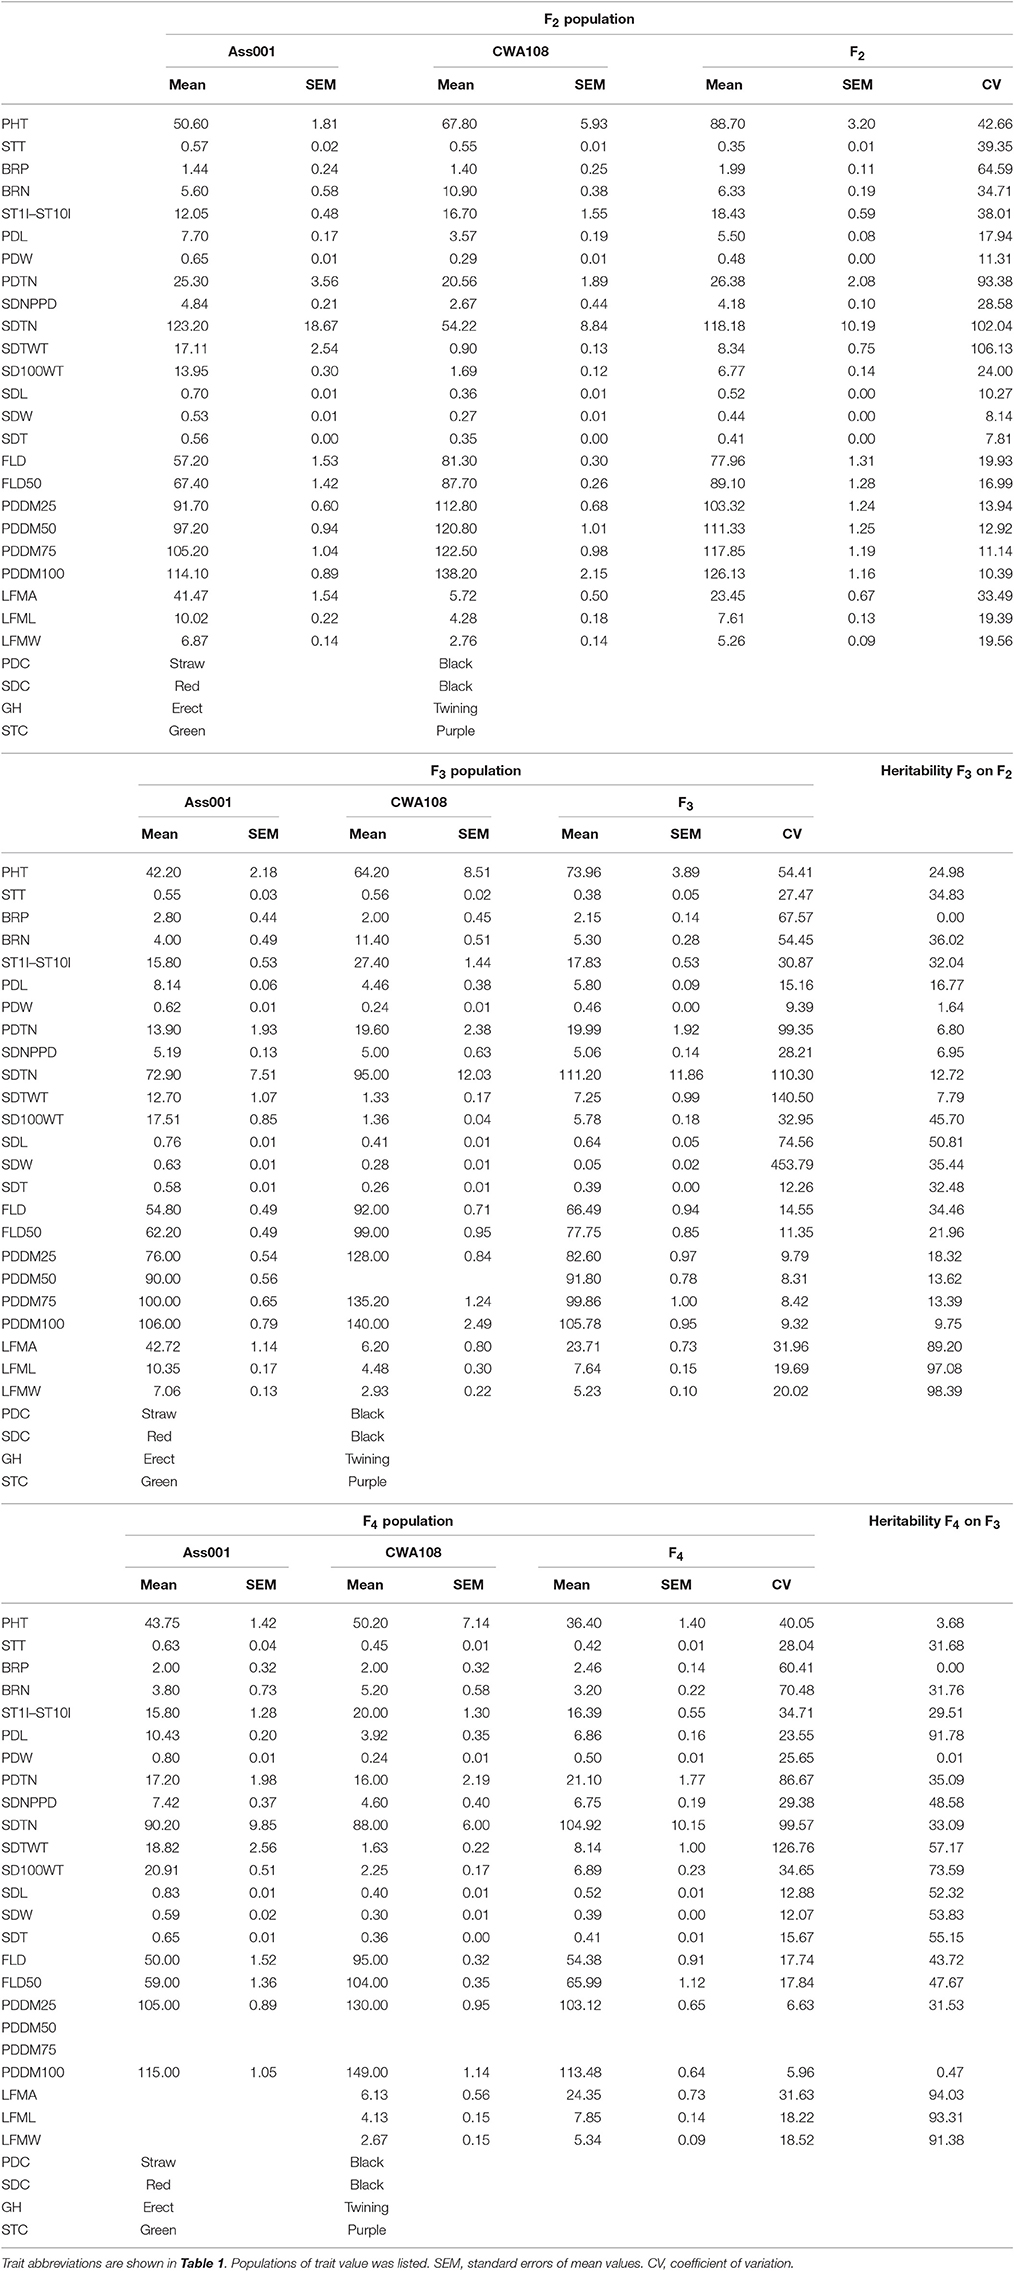
Table 2. The mean, standard error of mean, and heritability values for parents, the F2, F3, F4 populations of the cross between cultivated and wild adzuki bean.
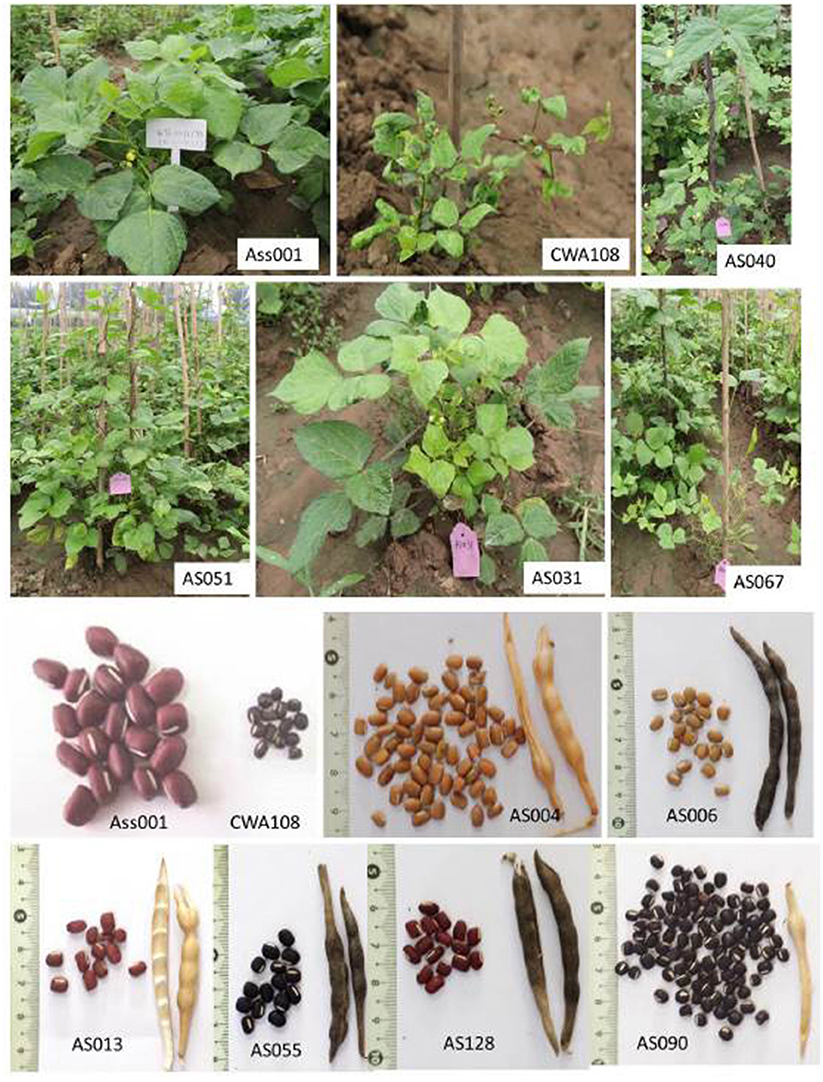
Figure 1. Phenotype of parents (Ass001 and CWA108) and several individuals in the F2 mapping population Ass001: female parent; CWA108: male parent; AS: individuals of F2.
We calculated the trait means, the standard error of the mean, and the heritability of the parental F2, F3, and F4 populations (Table 2). The leaf size, seed and pod sizes, seed number per pod (SDNPPD), seed total number (SDTN), and seed total weight (SDTWT) of the cultivated parent were greater than those of the wild parent. The mean values of the wild parent were greater than those of the cultivated parent for plant height, branch number on the main stem, stem internode length (from the first to the tenth internode [ST1I-ST10I]), and flowering and maturation times. The individuals in F2 showed wide segregation, and different lines in F3 or F4 exhibited similar phenotypic variation (Table 2). The means of various parameters of the F2, F3, and F4 populations generally lay between those of the cultivated and wild parents, except for plant height, ST1I-ST10I, the total number of pods per plant, days of ≥50% flowering (F2), and plant height, total number of pods per plant, and SDTN (F3). Many traits were highly heritable (>70%).
Seed coat color, pod color, and stem color are all qualitative traits. The segregation ratios of the pod color and stem color were as expected (3:1) based on the Chi-squared test. The seed coat colors of the F2 population included black, light brown, and red. The Chi-squared test showed that the segregation ratio of black: light brown: red seed coats was consistent with a 12:3:1 ratio; these seed coat colors were controlled by two genes. Black to light brown showed dominant epistasis (12:3, χ2 = 3.820 < = 3.84), light brown was dominant to red (3:1, χ2 = 0.701 < = 3.84).
QTL Detection and Analysis
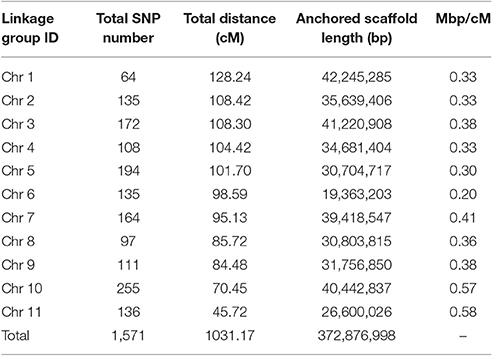
We previously constructed a high-density SNP genetic map that we used only in genome assembly to anchor the scaffolds of the adzuki bean genome to the chromosomes (Yang et al., 2015); however, no morphological characteristics or QTL were involved in that SNP genetic map. The SNP genetic map was composed of 1,571 SNPs covering 11 linkage groups, spanning 1,031.17 cM, with an average of 4.33 mapped SNPs per scaffold at a mean marker distance of 0.67 cM (Table S2, Table 3). We used 1,571 polymorphic SNP markers to map QTL and qualitative trait genes in this study. In total, we identified 26 QTLs for flowering time, growth period, agronomic traits, and yield traits (Figures 2–4 and Table 4).
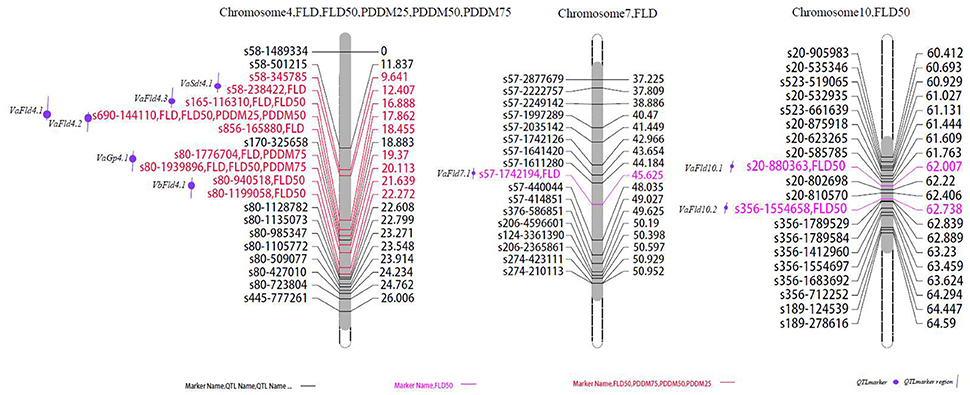
Figure 2. Locations of identified QTLs for flowering and maturation in the map of the population derived from the cross between cultivated and wild adzuki bean. FLD, days to first flowering; FLD50, days to 50% flowering; PDDM25, 25% pod maturation; PDDM50, 50% pod maturation; PDDM75, 75% pod maturation.
Flowering Time and Growth Period
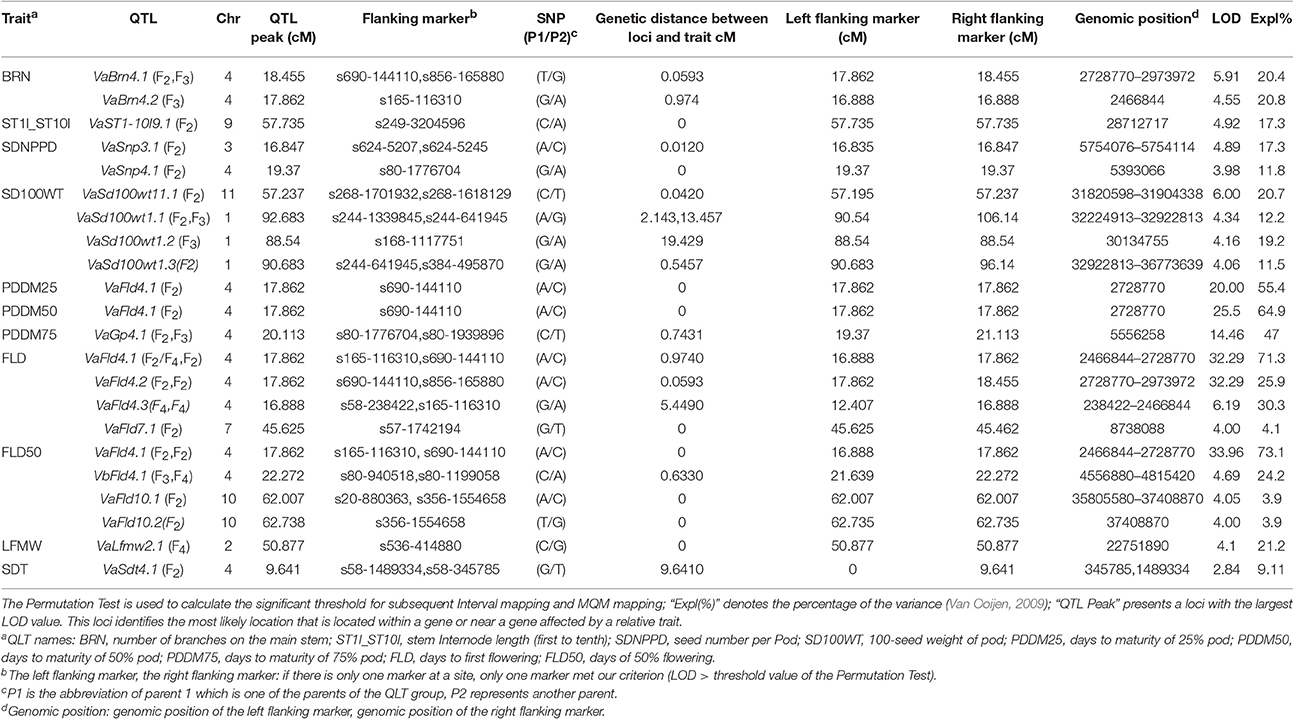
We found 11 QTLs affecting flowering time and pod maturity on chromosomes 4, 7, and 10 (Figure 2). Most flowering and maturation time genes mapped to chromosome 4, except for the two minor QTLs Fld4.5 and Fld4.6. The “days to first flowering” trait was controlled by only a few genes. Two major QTLs (VaFld4.1 and VaFld4.2; PEVs 71.3% and 67.6, respectively) were identified in the 9.65 cM region of chromosome 4 of the F2 population affecting flowering and maturation times. Two “first flowering” QTLs with smaller effects were found on chromosome 4. The SNP marker s690-144110 co-segregated with VaFld4.1, and the genetic distance between VaFld4.2 and the SNP marker s165-116310 was 0.974 cM. The VaFld4.2 flowering time QTL was present in the same chromosome 4 locus in the F4 population, and co-segregated with the s165-116310 SNP marker. Two FLD50 (“time to 50% flowering”) QTLs were located in the scaffold regions of VaFld4.1 (PEV 73.1%) and VaFld4.2 (PEV 69.2%), and two other minor flowering time QTLs were located on chromosome 10, with PEVs of 3.9%. One minor QTL was mapped on chromosome 7. PDDM25 (“25% pod maturation”, PEV 55.4%), PDDM50 (“50% pod maturation”, PEV 64.9%), and PDDM75 (“75% pod maturation”, PEV 71.3%) mapped to the same locus VaFld4.1, and co-segregated with the s690-144110 SNP marker (Table 4, Figure 2). The remaining two major PDDM75 QTLs, VaGp4.1 and VaGp4.2, mapped to the 2.76 cM region of chromosome 4 (PEVs 47 and 40.9%). The VaGp4.1 and VaGp4.2 QTLs for FLD and the VaGp4.1 QTL for FLD50 were identified in the F3 generation.
Morphology and Yield Traits
In total, six SD100WT QTLs were detected, four on chromosome 1 and two on chromosome 11 (Figure 3). VaSd100wt1.1 and VaSd100wt1.2 were mapped to chromosome 1. VaSd100wt11.1 located between SNP markers s268-1701932 and s268-1618129 with 0.0420 cM genetic distance on chromosome 11 (Table 4). Three seed-number-per-pod (SDNPPD) QTLs were identified on chromosome 3 (Snp3.1 PEVs 17.3%) and chromosome 4 (Snp4.1, PEV 11.8%). Snp3.1 was located at a distance of 0.012 cM between SNP markers s624-5207 and s624-5245, and Snp3.2 lay on the same mapping region of Snp3.1. Snp4.1 co-segregated with s624-5245 and s80-1776704, respectively. Three QTLs for branch number on the main stem mapped to chromosome 4 (Figure 3, Table 4). VaBrn4.1 was found on chromosome 4 between SNP markers s690-144110 and s856-165880, and the genetic distance of VaBrn4.2 was 0.974 cM with a s165-116310 marker (Figure 4). A QTL VaLfmw2.1 for maximum leaf width (LFMW) co-segregated with a s536-414880 marker on chromosome 2 (PEV 21.2%). A QTL VaST1-10I9 of stem internode length from the first to the tenth node (ST1I-ST10I) was found on chromosome 9 (PEV 17.3%) and co-segregated with the SNP marker s249-3204596 (Table 4, Figure 4). QTL VaSdt4.1 of SDT (seed thickness) was mapped on chromosome 4 between SNP markers s58-1489334 and s58-345785, and co-segregated with an S58-1489334 marker (Figure 4, Table 4).
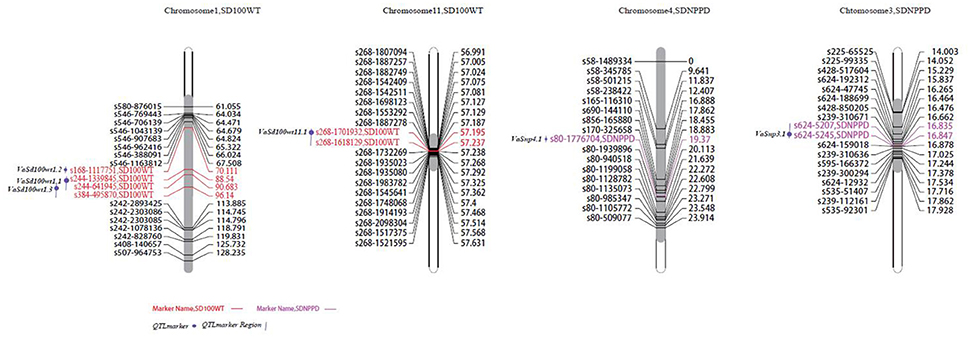
Figure 3. Locations of identified QTLs for yield traits in the map of the population derived from the cross between cultivated and wild adzuki bean. SD100WT, 100 seed weight; SDNPPD, seed number per pod.
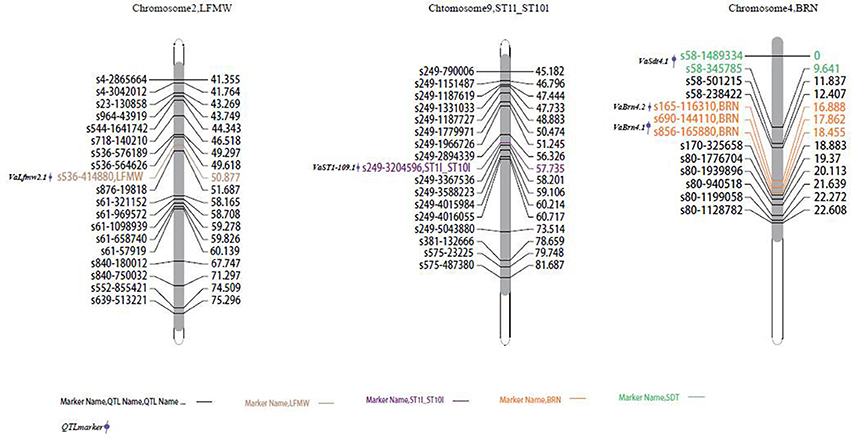
Figure 4. Locations of identified QTLs for morphological traits in the map of the population derived from a cross between cultivated and wild adzuki bean. LFMW, maximum leaf width; ST1I-ST10I, stem internode length from the first to the tenth node; BRN, branch number on the main stem; SDT, seed thickness.
Qualitative Trait Gene Mapping
Pigmentation-related genes controlling seed coat color (SDC), pod color (PDC), stem color (STC), and flower color (FLC) were mapped to chromosome 3. VaFcY controlling yellow flower color mapped to the top of chromosome 3, followed by the black seed coat color gene VaScB, and the green stem color gene VaStcG (Figure 5). The genetic distances between VaStcG, VaScB, VaFcY, and the SNP marker s342-127390 were 8.82, 12.95, and 41.77 cM, respectively. The black pod VaPcB gene was located between SNP markers s225-928306 and s101-825050, the genetic distances of which were 18.16 and 19 cM, respectively. The red seed coat color VaScR gene mapped on top of chromosome 1.
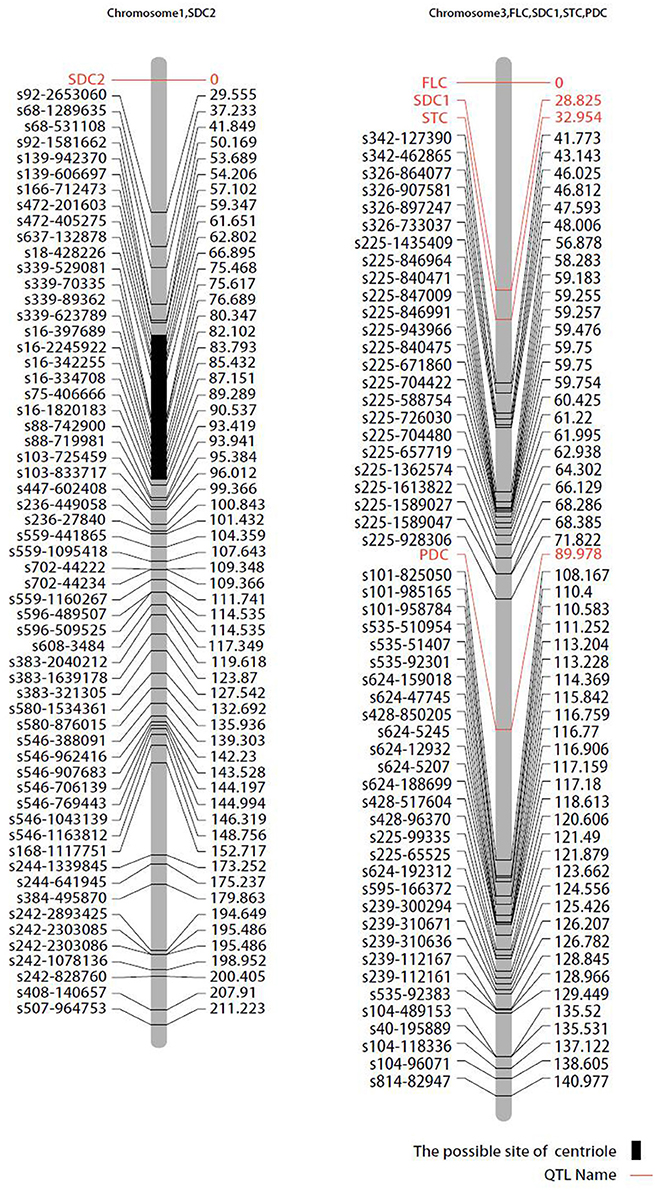
Figure 5. Mapping of qualitative traits on the map of the population derived from the cross between cultivated and wild adzuki bean. SDC, seed coat color; FLC, flower color; STC, stem color; PDC, pod color.
Identification of Candidate Genes
Flowering Time and Pod Maturity
Two flowering time candidate genes, E3-like phytochrome and transcription factor agamous-like MADS-box loci, and an AP2 locus were detected in relative mapping regions controlling flowering time, maturity, and seed size.
VaPhyE (phytochrome E) encodes a protein of 1,121 amino acids. It is located in the interval between 3,182,263 and 3,186,619 bp on chromosome 4. In total, four phytochrome genes—two VaPhyA, a VaPhyB, and a VaPhyE gene—were found in the adzuki bean genome (Table S3). Based on the protein sequence encoded by the VaPhyE gene, clustering results showed that adzuki bean VaPhyE and mung bean VrPhyE have the closest genetic relationship, followed by the common bean PvPhyE (Figure 6).
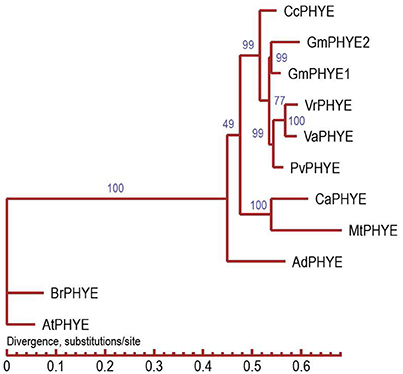
Figure 6. Phylogenetic tree analysis of adzuki bean PHYE. CcPHYE (Cajanus cajan), GmPHYE1 and GmPHYE2 (Glycine max), VrPHYE (Vigna radiata), VaPHYE (Vigna angularis), PvPHYE (Phaseolus vulgaris), CaPHYE (Cicer arietinum), MtPHYE (Medicago truncatula), AdPHYE (Arachis duranensis), BrPHYE (Brassica rapa), and AtPHYE (Arabidopsis thaliana).
The agamous-like MADS-box is involved in flower development and maturity (de Folter et al., 2005). Two major QTLs controlling flowering time and pod maturity traits (FLD, FLD50, PDDM50, and PDDM100), VaFld4.1 and VaFld4.3, were mapped in the interval from 3,102,255 to 3,616,262 bp on chromosome 4 between SNP markers s690-144110 and s856-165880; s856-165880 was the closest. An agamous-like MADS-box candidate gene, VaAGL, encoding a protein of 379 amino acids, was detected in this region. In total, 29 Agamous-like MADS-box genes were found in the adzuki bean genome (Table S4).
Seed and Leaf Size
Two VaAP2/ERF.81 and VaAP2/ERF.82 candidate genes encoding 278 and 225 amino acids were identified in the SD100WT QTL VaSd100wt1.2 region of 28,861,763–28,863,078 bp and 29,072,132–29,072,809 bp on chromosome 1, and the closest SNP marker was s168-1117751 (Figure 3). The candidate gene VaAP2-s4 was found in QTL VaSdt4.1 of SDT (seed width) from 345,785 to 1,489,334 bp on chromosome 4 between SNP markers s58-345785 and s58-1489334 (Figure 4). VaAP2-s4 encodes a protein of 208 amino acids. Another candidate gene, VaAP2/ERF.86, encoding 638 amino acids, was identified in the mapping region of QTL VaLfmw2.1 (LFMW, maximum leaf width) from 20,746,593 to 20,747,231 bp on chromosome 2, between SNP markers s536-414880 and s536-414880 Figure 4. In total, 26 AP2/ERF genes were identified in the adzuki bean genome (Table S5). AP2/RAV genes were absent in adzuki beans, common beans, mung beans, chickpeas, pigeonpeas, and Medicago truncatula, but did exist in soybeans.
Seed Coat Color Genes
The VaScB gene controlling the black seed coat trait (SDC1) was mapped onto the interval from 131,943 to 133,424 bp on chromosome 3 between SNP marker scaffold326-733037 (28.83 cM) and the top of the chromosome 3. A candidate gene, VaUGT, was found within this interval. VaUGT encodes a protein of UDP flavonoid glycosyl transferase (UGT), with 494 amino acids, associated with flavonoid metabolic pathways. In total, 22 UGT-like genes were found in the adzuki bean genome (Table S6, Figure S1).
Discussion
Gene mapping and QTL detection are very useful for gene cloning, MAS breeding, and trait improvement; however, only a few studies have been performed using SSR markers in adzuki bean (Isemura et al., 2007; Kaga et al., 2008). We identified 26 genomic QTLs associated with agronomic traits and gene loci of four qualitative traits using a high-density SNP genetic map created via RAD sequencing. In this study, F2 segregating populations were derived using a wide cross between a cultivated adzuki bean Ass001 (V. angularis var. angularis) and a wild adzuki bean CWA108 (V. angularis var. nipponensis). The seeds of the wild adzuki bean were in dormancy. The seed number of F2 individuals was limited. Each of the F2:3 lines were planted in two rows in 2014. Each of the F3:4 lines were planted in the same manner as the F2:3 lines in 2015. From the center of the rows, 10 representational plants per line and 10 plants of each parent were selected to evaluate each trait based on the mean value. Isemura et al. (2007) planted BC1F1:2 lines and F2:3 lines, each consisting of 10 individuals per line in the field, in June 2003 and 2004 at NIAS, and the lines were evaluated based on the mean values for each trait per line and used for QTL mapping. Kaga et al. (2008) used the same planting model and method for QTL identification in adzuki bean. Wu et al. (2013) mapped the QTL of grain shape and size in wheat RILs using 10 representational plants that were selected from the center of two rows to gain phenotypic data. The phenotypic trait data were reliable in this study.
Control of flowering time is critical when pulse crops have to adapt to different ecogeographic environments and photoperiods. In the soybean, a representative warm-season short-day legume, at least 10 E loci (E1–E9) and J genes controlling flowering time and maturity have been described (Weller and Ortega, 2015; Cao et al., 2017). In the adzuki bean, a first-flowering-day (FLD) QTL has been described in linkage group 4 (Isemura et al., 2007), and a major relevant QTL (Fld3.4a.1, PEV 43.7%) in LG4a; nine FLD and pod maturity QTLs were found to be present on LG2, LG3, LG4a, LG5, LG6a, and LG11 (Kaga et al., 2008). In the present study, we detected 10 QTLs controlling flowering time and pod maturity; the QTLs were on chromosomes 4, 7, and 10. The very relevant VaFld4.1 and VaFld4.2 loci were on chromosome 4, and the candidate phytochrome E gene VaPhyE co-segregated with SNP markers. Phytochrome-A-encoding genes E3 and E4 have been identified in the soybean (Liu et al., 2008; Watanabe et al., 2009). GmE3 and GmE4 are phyA-type (phytochrome A) photoreceptor that plays an important role in the detection of far-red and red light in the soybean, and is associated with early flowering and maturity. E4, controls flowering when the LDs are in the low- and far-red regions (Cober and Voldeng, 2001). E3 functions across a wide range of latitudes, whereas allelic differences in E4 are detected only at high latitudes (Lu et al., 2015). GmPHYA1 and GmPHYA2 (E4) may play redundant roles in photomorphogenesis (de-etiolation response and flowering under low R:FR conditions; Liu et al., 2008). Soybean has eight PHY loci including four PHYA, two PHYB, and two PHYE loci. Phylogenetic analysis of soybean suggests that the four paralogous PHY pairs separated (by genomic duplication) at least 13 million years ago, and that the four PHYA copies are remnants of two rounds of such duplication (ca. 58 and 13 million years ago) (Wu et al., 2013). Adzuki bean, like most sequenced legumes, did not experience this Glycine max-specific whole genome duplication event (13 million years ago). In this study, we found that there are four PHY loci including two PHYA, a PHYB, and a PHYE loci in adzuki bean, common bean, mung bean, chickpea, pigeonpea, and Arachis duranensis, but a PHYA in Medicago truncatula. This result confirms that two rounds of whole genome duplication events led to four PHYA and two PHYE copies in soybean. The PHY family includes the A, B, C, D, and E subfamilies; PHYC and PHYD were not found in the adzuki bean, soybean, common bean, chickpea, pigeonpea, mung bean, Arachis duranensis, or M. truncatula genomes. PHYC and PHYD may have been lost during the evolution of legumes. PHYE was absent in monocotyledon Oryza sativa and Zea mays (Table S4). Dt2, a dominant MADS-domain gene of the AP1/SQUA subfamily, has been cloned from the soybean. Dt2 represses Dt1 expression in the shoot apical meristem, promoting the early conversion of meristem into reproductive inflorescences; the gene thus promotes semi-determinate stem growth and early flowering (Ping et al., 2014). In this study, 28 AGAMOUS-like MADS-box genes were found in the adzuki bean genome for photoperiodic flowering (Table S6). Kim et al. (2014) sequenced a de novo assembly of adzuki bean transcript sequences and subjected them to a BLASTP search to identify putative homologs of the 84 Arabidopsis genes involved in the circadian clock and photoperiodic flowering pathway. Eleven homologs of the AGAMOUS-like MADS-box transcription factor were detected in the adzuki bean. Follow-up studies of candidate gene validation are being planned.
AP2 genes are representative of the large AP2/EREBP gene family, and are both necessary and sufficient for flower development (Jofuku et al., 1994), stem cell maintenance (Wurschum et al., 2005), seed development, determination of seed size, and seed weight (Jofuku et al., 2005); several AP2-encoding proteins repress flowering, redundantly affecting flowering time (Zhu and Helliwell, 2011). Four VaAP2 were identified in QTL mapping intervals of seed weight, leaf size, and seed thickness in adzuki bean. We concluded that these VaAP2 might function in regulating organ size, but their function still requires validation. If leaf width candidate gene VaAP2-l2 is involved in or regulates seed size, this should be analyzed in future studies.
The black seed coat color VaScB and red seed coat color VaScR genes mapped to chromosomes 3 and 1, respectively. Kaga et al. (2008) mapped the red seed coat locus near the SSR marker CEDG053 on linkage group 1 (LG1). Genes that control red or tan seed coat colors, and black seed mottling have been mapped to linkage groups 1 and 4, respectively (Isemura et al., 2007). A minor QTL OLB2 explaining 6% of the total variance in redness is located on LG1 (Horiuchi et al., 2015). VaScR will be finely mapped by reference to the closest SNP and SSR markers in follow-up studies. UGT is a member of the flavonoid metabolic pathway, and is involved in anthocyanin biosynthesis. The enzymes O-methyltransferase, rhamnosyl transferase, and UDP flavonoid glucosyl transferase together synthesize anthocyanins from 3-OH-anthocyanidins. UDP glycosyl transferase is essential for anthocyanin synthesis. The enzyme may be involved in delphinidin synthesis; this pigment is blue–black in color, and may be responsible for the difference between black (pigment present) and brown (pigment absent) seed coat colors (Lepiniec et al., 2006). We designed primers and found a new SNP cosegregative marker with VaScB. The proposed function of VaUGT for synthesis of a black seed coat needs to be verified experimentally. A UGT78K1 (UDP-glucose: flavonoid-3-O-glycosyltransferase) gene, imparting a black seed coat, has been isolated from the black (iRT) soybean (Kovinich et al., 2010). VaUGT belongs to 73C3-like UDP-glycosyl transferase, and is different from GmUGT78K1; its function will need to be further verified.
Author Contributions
PW designed and managed the project and wrote the manuscript. YL prepared DNA samples for RAD sequencing, and engaged in data investigation and analysis. YL, KY, WY, and JJ performed QTL analyses. YL and KY identified candidate flowering time genes. BZ, YSL, and TW participated in trait investigations, data analysis, and field experiments. LC and ZY mapped qualitative traits and identified relevant candidate genes. CC analyzed the phylogenetic tree. KY contributed helpful suggestions.
Conflict of Interest Statement
The authors declare that the research was conducted in the absence of any commercial or financial relationships that could be construed as a potential conflict of interest.
Acknowledgments
The National Natural Science Foundation of China provided financial support (grant nos. 31371694, 31272238, and 31571734).
Supplementary Material
The Supplementary Material for this article can be found online at: http://journal.frontiersin.org/article/10.3389/fpls.2017.00840/full#supplementary-material
Table S1. Phenotype Data of Parents and F2 , F3 and F4 Populations.
Table S2. Comparison of sequences assembly between parents and 150 individuals of F2 by RAD-sequencing.
Table S3. Phytochrome genes in the adzuki bean and comparison to sequenced legume and other plant genomes.
Table S4. Agamous-like MADS-box genes in the adzuki bean and comparison to sequenced legume and other plant genomes.
Table S5. AP2/EREBF genes in the adzuki bean and comparison to sequenced legume and other plant genomes.
Table S6. UDP flavonoid glycosyl transferase (UGT) genes in the adzuki bean and comparison to sequenced legume and other plant genomes.
Figure S1. Phylogenetic tree analysis of adzuki bean UGT-like genes.
References
Amarowicz, R., Estrella, I., Hernández, T., and Troszyńska, A. (2008). Antioxidant activity of extract of adzuki bean and its fractions. J. Food Lipids 15, 119–136. doi: 10.1111/j.1745-4522.2007.00106.x
Aoyama, S., Onishi, K., and Kato, K. (2011). The genetically unstable dwarf locus in azuki bean (Vigna angularis Willd. Ohwi & Ohashi). J. Hered. 102, 604–609. doi: 10.1093/jhered/esr068
Baird, N. A., Etter, P. D., Atwood, T. S., Currey, M. C., Shiver, A. L., Lewis, Z. A., et al. (2008). Rapid SNP discovery and genetic mapping using sequenced RAD markers. PLoS ONE 3:e3376. doi: 10.1371/journal.pone.0003376
Cao, D., Takeshima, R., Zhao, C., Liu, B., Jun, A., and Kong, F. (2017). Molecular mechanisms of flowering under long days and stem growth habit in soybean. J. Exp. Bot. 68, 1873–1884. doi: 10.1093/jxb/erw394
Cheng, X. Z., and Tian, J. (2009). “Status and future perspectives of Vigna (mungbean and azuki bean) production and research in China,” in The 14th National Institute of Agrobiological Sciences, Japan, International Workshop on Genetic Resources, Genetics Resources and Comparative Genomics of Legumes (Tsukuba: Glycine and Vigna), 83–86.
Cheng, X. Z., Wang, S. H., Wang, L. X., Wang, S. M., Zong, X. X., Wang, P. Z., et al. (2012). Descriptors and Data Standard for Adzuki Bean [Vigna angularis (Willd.) Ohwi & Ohashi], eds X. Z. Cheng, S. H. Wang, and L. X. Wang. Beijing: China Agriculture Press.
Churchill, G. A., and Doerge, R. W. (1994). Empirical threshold values for quantitative trait mapping. Genetics 138, 963–971.
Cober, E. R., and Voldeng, H. D. (2001). Low R: FR light quality delays flowering of E7E7 soybean lines. Crop Sci. 41, 1823–1826. doi: 10.2135/cropsci2001.1823
de Folter, S., Immink, R. G. H., Kieffer, M., Paŕenicová, L., Henz, S. R., Weigel, D., et al. (2005). Comprehensive interaction map of the Arabidopsis MADS-box transcription factors. Plant Cell 17, 1424–1433. doi: 10.1105/tpc.105.031831
Grattapaglia, D., and Sederoff, R. (1994). Genetic linkage maps of Eucalyptus grandis and Eucalyptus urophylla using a pseudo-testcross: mapping strategy and RAPD markers. Genetics 137, 1121–1137.
Han, A., Kaga, A., Isemura, T., Wang, X., Tomooka, N., and Vaughan, D. A. (2005). A genetic linkage map for azuki bean [Vigna angularis (Willd.); Ohwi & Ohashi]. Theor. Appl. Genet. 111, 1278–1287. doi: 10.1007/s00122-005-0046-8
Horiuchi, Y., Yamamoto, H., Ogura, R., Shimoda, N., Sato, H., and Kato, K. (2015). Genetic analysis and molecular mapping of genes controlling seed coat colour in adzuki bean (Vigna angularis). Euphytica 206, 609–617. doi: 10.1007/s10681-015-1461-9
Isemura, T., Kaga, A., Konishi, S., Ando, T., Tomooka, N., Han, O. K., et al. (2007). Genome dissection of traits related to domestication in azuki bean (Vigna angularis) and comparison with other warm-season legumes. Ann. Bot. 100, 1053–1071. doi: 10.1093/aob/mcm155
Jofuku, K. D., Den Boer, B., Van Montagu, M., and Okamuro, J. K. (1994). Control of Arabidopsis flower and seed development by the homeotic gene APETALA2. Plant Cell 6, 1211–1225. doi: 10.1105/tpc.6.9.1211
Jofuku, K. D., Omidyar, P. K., Gee, Z., and Okamuro, J. K. (2005). Control of seed mass and seed yield by the floral homeotic gene APETALA2. Proc. Natl. Acad. Sci. U.S.A. 102, 3117–3122. doi: 10.1073/pnas.0409893102
Kaga, A., Isemura, T., Tomooka, N., and Vaughan, D. A. (2008). The genetics of domestication of the azuki bean (Vigna angularis). Genetics 178, 1013–1036. doi: 10.1534/genetics.107.078451
Kim, M. Y., Yang, J. K., and Lee, S. H. (2014). Circadian clock and photoperiodic flowering genes in adzuki bean (Vigna angularis [Willd.] Ohwi & H. Ohashi). Plant Genet. Res. 12, S49–S53. doi: 10.1017/s1479262114000252
Kosambi, D. D. (1994). The estimation of map distance from recombination values. Ann. Eugen. 12, 12172–12175.
Kovinich, N., Saleem, A., Arnason, J. T., and Miki, B. (2010). Functional characterization of a UDP-glucose:flavonoid 3-O-glucosyltransferase from the seed coat of black soybean (Glycine max (L.) Merr.). Phytochem. 71, 1253–1263. doi: 10.1016/j.phytochem.2010.05.009
Kramer, C., Soltani, N., Robinson, D. E., Swanton, C. J., and Sikkema, P. H. (2012). Control of volunteer adzuki bean in soybean. Agri. Sci. 3, 501–509. doi: 10.4236/as.2012.34059
Lepiniec, L., Debeaujon, I., Routaboul, J. M., Baudry, A., Pourcel, L., and Nesi, N. (2006). Genetics and biochemistry of seed flavonoids. Annu. Rev. Plant Biol. 57, 405–430. doi: 10.1146/annurev.arplant.57.032905.105252
Lin, R. F. (2002). Minor Grain Crops in China, eds Y. Chai, Q. Liao, and S. W. Sun. Beijing: China Agricultural Science and Technology Press.
Liu, B., Kanazawa, A., Matsumura, H., Takahashi, R., Harada, K., and Abe, J. (2008). Genetic redundancy in soybean photoresponses associated with duplication of the phytochrome A gene. Genetics 180, 995–1007. doi: 10.1534/genetics.108.092742
Liu, L., Bestel, S., Shi, J., Song, Y., and Chen, X. (2013). Paleolithic human exploitation of plant foods during the last glacial maximum in North China. Proc. Natl. Acad. Sci. U.S.A. 110, 5380–5385. doi: 10.1073/pnas.1217864110
Lu, S., Li, Y., and Wang, J. (2015). QTL mapping for flowering time in different latitude in soybean. Euphytica 206, 725–736. doi: 10.1007/s10681-015-1501-5
Ping, J., Liu, Y., Sun, L., Zhao, M., Li, Y., She, M., et al. (2014). Dt2 is a gain-of-function MADS-domain factor gene that specifies semi-determinacy in soybean. Plant Cell 26, 2831–2842. doi: 10.1105/tpc.114.126938
Tomooka, N., Vaughan, D., Moss, H., and Maxted, N. (2002). The Asian Vigna: Genus Vigna Subgenus Ceratotropis Genetic Resources, ed N. Tomooka. Dordrecht: Kluwer Academic Publishers.
Van Ooijen, J. W. (2006). JoinMap 4: Software for the Calculation of Genetic Linkage Maps in Experimental populations, ed B. V. Kyazma. Wageningen.
Van Ooijen, J. W. (2009). “MapQTL6: Software for the mapping of quantitative trait loci in experimental populations,” in Plant & Animal Genome XVII Conference, ed B. V. Kyazma (Wageningen).
Wang, X. W., Kaga, A., Toomoka, N., and Vaughan, D. A. (2004). The development of SSR markers by a new method in plants and their application to gene flow studies in azuki bean [Vigna angularis (Willd.) Ohwi & Ohashi]. Theor. Appl. Genet. 109, 352–360. doi: 10.1007/s00122-004-1634-8
Watanabe, S., Hideshima, R., Xia, Z., Tsubokura, Y., Sato, S., Nakamoto, Y., et al. (2009). Map-based cloning of the gene associated with the soybean maturity locus E3. Genetics 182, 1251–1262. doi: 10.1534/genetics.108.098772
Weller, J. L., and Ortega, R. (2015). Genetic control of flowering time in legumes. Front. Plant Sci. 6:207. doi: 10.3389/fpls.2015.00207
Wu, F. Q., Fan, C. M., Zhang, X. M., and Fu, Y. F. (2013). The phytochrome gene family in soybean and a dominant negative effect of a soybean PHYA transgene on endogenous Arabidopsis PHYA. Plant Cell Rep. 32, 1879–1890. doi: 10.1007/s00299-013-1500-8
Wurschum, T., Gross-Hardt, R., and Laux, T. (2005). APETALA2 regulates the stem cell niche in the Arabidopsis shoot meristem. Plant Cell 18, 295–307. doi: 10.1105/tpc.105.038398
Yang, K., Tian, Z., Chen, C., Luo, L., Zhao, B., Wang, Z., et al. (2015). Genome sequencing of adzuki bean (Vigna angularis) provides insight into high starch and low fat accumulation and domestication. Proc. Natl. Acad. Sci. U.S.A. 112, 13213–13218. doi: 10.1073/pnas.1420949112
Yao, Y., Cheng, X., Wang, S., Wang, L., and Ren, G. (2012). Influence of altitudinal variation on the antioxidant and antidiabetic potential of azuki bean (Vigna angularis). Int. J. Food Sci. Nutr. 63, 117–124. doi: 10.3109/09637486.2011.604629
Keywords: adzuki bean (Vigna angularis), agronomic trait, QTL, qualitative trait, SNP marker, candidate gene
Citation: Li Y, Yang K, Yang W, Chu L, Chen C, Zhao B, Li Y, Jian J, Yin Z, Wang T and Wan P (2017) Identification of QTL and Qualitative Trait Loci for Agronomic Traits Using SNP Markers in the Adzuki Bean. Front. Plant Sci. 8:840. doi: 10.3389/fpls.2017.00840
Received: 31 December 2016; Accepted: 04 May 2017;
Published: 19 May 2017.
Edited by:
Maria Carlota Vaz Patto, ITQB NOVA, PortugalReviewed by:
Liezhao Liu, Southwest University, ChinaPawel Krajewski, Institute of Plant Genetics (PAN), Poland
Copyright © 2017 Li, Yang, Yang, Chu, Chen, Zhao, Li, Jian, Yin, Wang and Wan. This is an open-access article distributed under the terms of the Creative Commons Attribution License (CC BY). The use, distribution or reproduction in other forums is permitted, provided the original author(s) or licensor are credited and that the original publication in this journal is cited, in accordance with accepted academic practice. No use, distribution or reproduction is permitted which does not comply with these terms.
*Correspondence: Ping Wan, cGluZ3dhbjNAMTYzLmNvbQ==; cGluZ3dhbkBidWEuZWR1LmNu
†These authors have contributed equally to this work.
 Yuan Li1†
 Chunhai Chen
 Jianbo Jian
 Ping Wan