 Zixun Chen
 Guoan Wang
 Yufu Jia
- College of Resources and Environmental Sciences, China Agricultural University, Beijing, China
Previous studies have suggested foliar δ13C generally increases with altitude. However, some observations reported no changes or even decreased trends in foliar δ13C. We noted that all the studies in which δ13C increased with elevation were conducted in the human regions, whereas those investigations in which δ13C did not vary or decreased were conducted in areas with water stress. Thus, we proposed that the pattern of increasing δ13C with elevation is not a general one, and that δ13C may remain unchanged or decrease in plants grown in arid environments. To test the hypothesis, we sampled plants along altitude gradients on the shady and sunny slopes of Mount Tianshan characterized by arid and semiarid climates. The measurements of foliar δ13C showed no altitudinal trends for the plants grown on either of the slopes. Therefore, this study supported our hypothesis. In addition, the present study addressed the effect of atmospheric pressure on plant δ13C by accounting for the effects of temperature and precipitation on δ13C. This study found that the residual foliar δ13C increased with increasing altitude, suggesting that atmospheric pressure played a negative role in foliar δ13C.
Introduction
The 13C isotope of atmospheric CO2 is discriminated against during photosynthetic carbon fixation. The carbon isotope ratio (δ13C) in plants depends on the ratio of intercellular to ambient CO2 concentration (ci/ca), which reflects the balance between the rate of inward CO2 diffusion, mediated by stomatal conductance (g), and the rate of CO2 assimilation (A) (Farquhar and Richards, 1984; Cernusak et al., 2013), and has been suggested as a sensitive long-term indicator of physiological changes. Considerable effort has been invested in observing and understanding the variation in δ13C along environmental gradients and the effects of environmental factors on δ13C (e.g., Diefendorf et al., 2010; Kohn, 2010; Wang et al., 2013; Broeckx et al., 2014; Xu et al., 2015; Yang et al., 2015; Čada et al., 2016).
A pattern of increasing δ13C with increasing altitude has consistently been reported previously (Körner et al., 1988, 1991; Sparks and Ehleringer, 1997; Li et al., 2009). However, exceptions to the general pattern of increasing δ13C with altitude have been observed. Friend et al. (1989), Lajtha and Getz (1993), and Van de Water et al. (2002) found that δ13C decreased with altitude; Wang et al. (2010) reported no altitudinal trends in plants δ13C. We noted that most of the studies in which a pattern of increasing δ13C with elevation were concentrated in regions where water was not a factor limiting plant growth, whereas those studies with the opposite pattern and/or no altitudinal trend were conducted in arid or semiarid regions. Thus, we argued that the pattern of increasing δ13C with elevation is not a general one, and that altitudinal variation in plants δ13C depends on soil moisture. We proposed that altitudinal variation in δ13C might be negative or unchanged for plants grown in arid or semiarid regions.
The altitudinal trend of plant δ13C is possibly attributable to variations in various environmental factors, such as temperature, precipitation, atmospheric pressure, and solar radiation. Temperature and/or precipitation have consistently been considered the main contributors. However, the contribution of atmospheric pressure is inconclusive. Körner et al. (1991), Kelly and Woodward (1995), and Zhu et al. (2010) suggested that decreasing atmospheric pressure with altitude played an important role in the altitudinal variations in plants δ13C. Sparks and Ehleringer (1997) argued that atmospheric pressure was a secondary factor even if it has an effect. Previous studies were unable to effectively segregate the influence of atmospheric pressure from the effects of precipitation and temperature. Thus, accounting for the effects of temperature and precipitation on plant δ13C may yield a reliable relationship between atmospheric pressure and δ13C.
In this study, we investigated the variation in foliar δ13C with altitude on the sunny and shady slopes of Mount Tianshan, a typical arid mountainous terrain, in Xinjiang Uygur Autonomous Region, China. The first objective was to test our hypothesis that δ13C decreases or remains unchanged for plants grown in arid and semi-arid regions. The second objective was to determine the effect of atmospheric pressure on plant δ13C through accounting for the effects of temperature and precipitation.
Materials and Methods
Study Site
Mount Tianshan, the maximal mountains in arid region all over the world, is located inside Eurasia and stretches over four countries including China, Kazakhstan, Kyrgyzstan, and Uzbekistan. In China, Mount Mountain is located in the middle of the Xinjiang Uygur Autonomous Region. It covers about 570,000 km2 and is 1,700 km long in an east-west direction and accounts for a third of the whole area of Xinjiang (Figure 1).
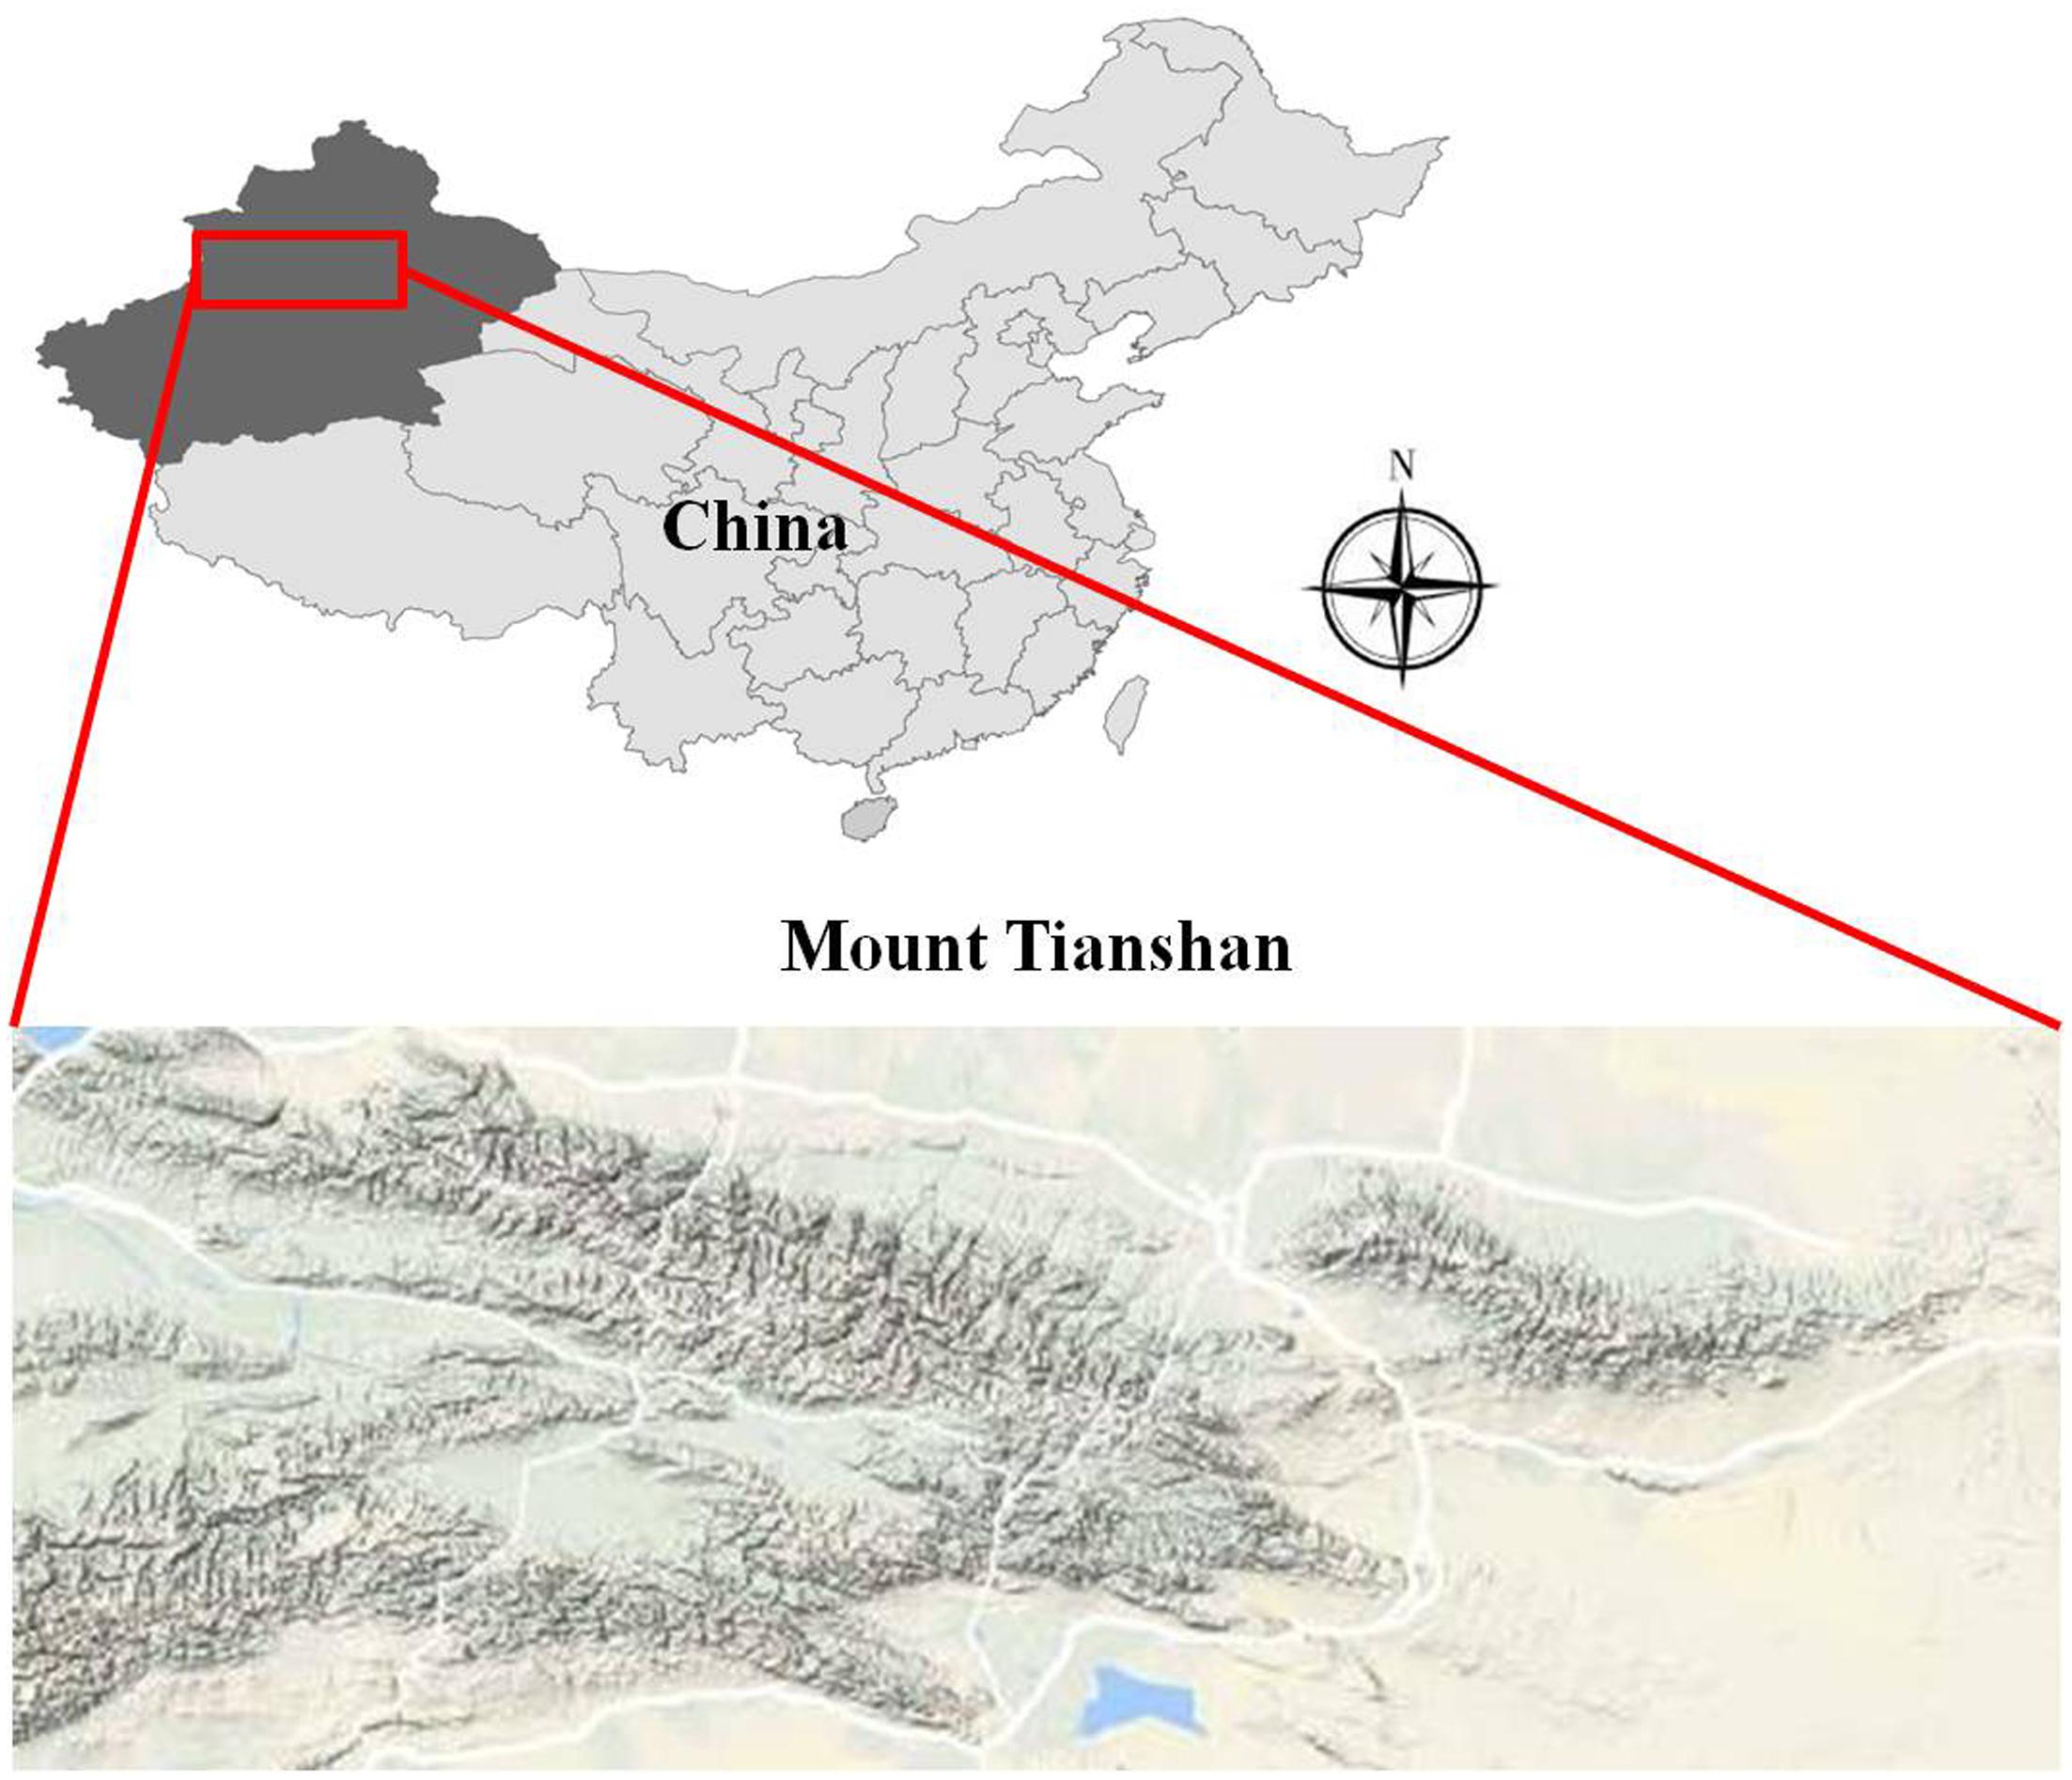
FIGURE 1. The location of the study area.
Our study site was located on eastern Mount Tianshan (42.43–43.53°N, 86.23–87.32°E) (Figure 1), along an elevation transect on the shady and sunny slopes. Mount Tianshan is characterized by a mountainous climate; vertical variations in temperature and precipitation are very pronounced, temperature decreases and precipitation increases with altitude on both slopes. The shady northern slope of Mount Mountain is controlled by air masses from the Arctic and Atlantic Ocean, so it is colder and moister than the sunny southern slope, which is warmer and more arid because the mountain hinders the humid air. The average annual mean temperature (AMT) is -1.85 and 1.03°C, and the average annual mean precipitation (AMP) is 402 and 246 mm on the shady and sunny slopes, respectively. Along our elevation transects, there were four meteorological observatories; two were on the shady slope and the other two were on the sunny slope (Table 1). The vertical distributions of vegetation and soil spectrums were also very pronounced on the two slopes. The detailed information is shown in Table 2.

TABLE 1. Data of climate from the meteorological observatories in the research area.
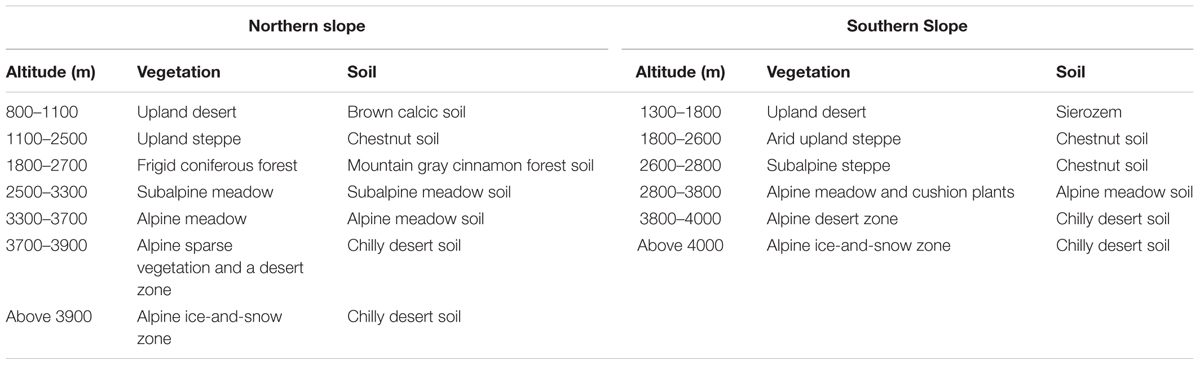
TABLE 2. The vertical distributions of vegetation and soil on Mount Tianshan.
Samplings of Plants and Soil
An altitudinal transect of 1,564–3,800 m above sea level (a.s.l.) was set on the shady slope, and 1,300–3,780 m a.s.l. on the sunny slope. Plants and soil were collected along the two transects at intervals of about 100 m. The sampling was restricted to open sites that were far from the major roads and human habitats. The sampling was conducted in July 2014. A total of 5–7 individual plants of each species were collected and the same number of leaves was sampled from each individual plant. For shrubs and herbs, the uppermost leaves of each individual plant were collected; for tree species, eight leaves were collected from each individual, two leaves were collected at each of the four cardinal directions from the positions of full irradiance, about 8–10 m above the ground. The leaves from the same species of each site were combined into one sample. A total of 105 plant samples were collected on the shady slope, belonging to 21 families and 37 genera, most of which were herbs (only 15 were woody plants); the main species were Kobresia myosuroides, Carex enervis, Poa annua, and Thalictrum aquilegifolium. One hundred and twelve samples were collected on the sunny slope, belonging to 16 families and 39 genera (only 18 were woody plants); the main plants were Stipa grandis, Stipa capillata, Achnatherum splendens; Artemisia frigida, Nitraria tangutorum, Caragana sinica, and Suaeda glauca. No C4 plants occurred on the shady slope, and only four C4 plant samples were collected on the sunny slope; thus, the altitudinal variation in C4 plant δ13C was not considered in this study. At each sampling site, we collected three surface soil samples (0–5 cm depth) using a ring after removing the litter layer within a radius of 20 m. These soil samples were used to determine soil density and water moisture.
Measurements of Foliar δ13C
Plant samples were air-dried in the field and then in the laboratory. Leaves were then ground into a fine powder using a steel ball mixer mill MM200 (Retsch GmbH, Haan, Germany). Approximately 0.35 mg leaf powder was wrapped up in a tin capsule, and was sent into an oxidation furnace of an elemental analyzer (EA) (FlashEA 1112; CE Instruments, Wigan, United Kingdom) through an autosampler. This EA was coupled with a DeltaPlus XP mass spectrometer (Thermo Scientific, Bremen, Germany). The leaf powder was combusted in the oxidation furnace at 1,020°C with chromium oxide as the oxidizing agent and silvered cobaltous oxide as the catalyst. The gaseous products of this combustion, including carbon dioxide, nitric oxide, water vapor, etc., were pulled into a reduction furnace of the EA by He, a carrier gas. In the reduction furnace, nitric oxide reacted with copper to form N2; carbon dioxide and water remained unchanged. N2, carbon dioxide, and water vapor then passed through a water trap of the EA where water vapor was absorbed by magnesium perchlorate. The remaining N2 and carbon dioxide flowed into a chromatographic column of the EA where they were separated. Finally, only CO2 was allowed to enter the DeltaPlus XP mass spectrometer where the carbon isotope of CO2 was determined. The carbon isotopic ratios were reported in the delta notation relative to the V-PDB standard. For this measurement, we obtained standard deviations of <0.15‰ for δ13C among replicate measurements of the same sample.
Measurements of Soil Water
The soil water content was determined after oven drying at 105 ± 2°C to a constant weight. The soil water content of each sample was the difference between its wet and dry weight divided by its dry weight. An error occurring during the transport from the field to laboratory resulted in an incomplete set of soil moisture data for the shady slope. However, we obtained a complete set of soil moisture data for the sunny slope. Soil moisture increased with altitude (Figure 2A) and was positively related to AMP for the soil on the sunny slope (Figure 2B). The incomplete soil moisture data of the shady slope also showed the same pattern as the soil of the sunny slope (Figures 2A,B). Although the higher elevations did not have soil water content data on the shady slope, we firmly believe the pattern of increasing soil moisture with altitude is applicable for the all the soil of the shady slope because we observed that the soil at higher elevations was clearly wetter than the soil at lower elevation during field sampling.
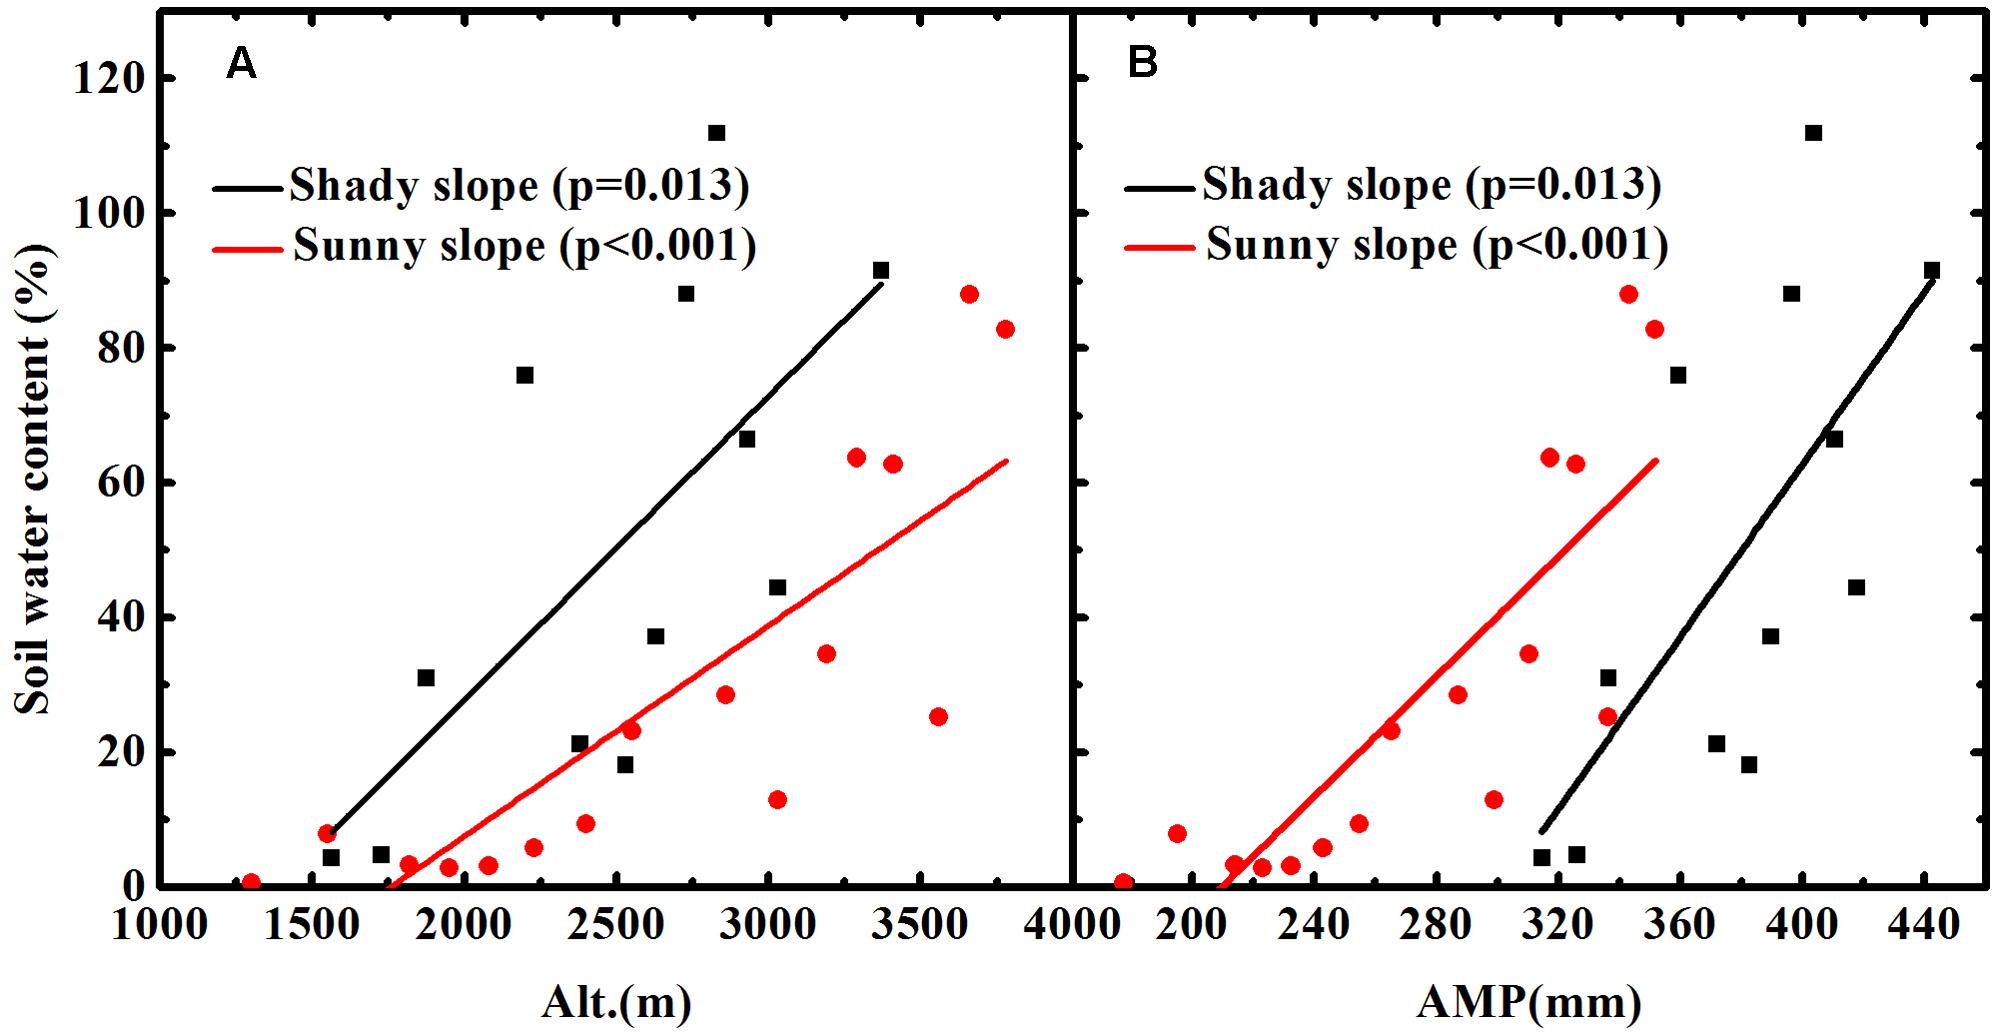
FIGURE 2. Soil water contents vary with altitude (A) and annual mean precipitation (AMP) (B) in Mount Tianshan.
Accounting for the Effects of Temperature and Precipitation on Plant δ13C
As presented in the introduction, to better understand the correlation between atmospheric pressure and plant δ13C, we have to eliminate the effects of temperature and soil water availability on plant δ13C. In this study, we used AMP to replace soil water availability to correct the influence of soil moisture based on three reasons. First is that the coefficient of plant δ13C vs. soil moisture has not previously been established to our knowledge; in contrast, the coefficient of plant δ13C vs. AMP has been reported in many previous studies. Second, as shown in Figure 2B, soil water availability generally displays a positive correlation with AMP. Third, although soil moisture is a more direct factor influencing plant δ13C compared to AMP, AMP could more fully reflect long-term soil moisture status relative to the soil moisture data derived from only one or several measurements. We assumed that the effects of temperature and precipitation are linearly additively and there are no cross effect for more than one variable. Regarding the effect of precipitation on plant δ13C, previous studies mostly suggested that it was negative (Stewart et al., 1995; Wang et al., 2008; Gebrekirstos et al., 2009; Diefendorf et al., 2010; Kohn, 2010; Sayak et al., 2015), although the coefficient of precipitation vs. δ13C obtained in previous investigations was not exactly the same. The correction of precipitation effect was conducted by using a rate of -0.4‰/100 mm reported by Wang et al. (2008). Both the present study and that of Wang et al. (2008) were conducted in northwest China; although the plant species in the two studies were not identical, the majority of plant species occurring in the study area of this investigation could be found in the place of Wang et al. (2008), because the climate, especially precipitation is very similar between the two areas. For example, about 99% of the plant samples in Wang et al. (2008) were collected from areas with an AMP from 180 to 630 mm, whereas in the present study, the AMP varied from 177 to 564 mm. Therefore, we believe that the coefficient of δ13C vs. AMP obtained in Wang et al. (2008) is suitable for the correction of precipitation in this study. In addition, even if there is a slight variation in the coefficient of δ13C vs. AMP, this will not make a significant difference in our final results. However, it is difficult to determine whether accounting for the temperature effect is necessary, and if so, how much correction should be made, because no conclusive statement of the temperature effect has been reached as yet. All three patterns, positive, negative, and no influence, have been reported (e.g., Heaton, 1999; Schleser et al., 1999; McCarroll and Loader, 2004; Treydte et al., 2007; Gebrekirstos et al., 2009; Wang et al., 2013; Trahan and Schubert, 2016). Thus, all three patterns should be taken into account when making a temperature-correction. However, we did not consider the negative and no effects based on two reasons. First, most of the previous studies showed a positive correlation between temperature and plant δ13C; second, no suitable δ13C-temperature coefficient could be used because negative coefficients were derived mostly from tree-ring δ13C series, in which only one or a few trees were used. Under the situation with the correction of positive temperature effect, we used the coefficient of δ13C-AMT of Wang et al. (2013) (0.104‰/°C). Wang et al. (2013) was conducted along a temperature gradient with 400 mm annual precipitation across China, so the effect of precipitation on δ13C was minimized. Furthermore, the coefficient of δ13C-AMT reflected the mean variation in plant δ13C with temperature covering 283 plant species including herbs, shrubs, and woods, thus having a high representation of all types. In addition, the areas along the 400 mm isopleth of annual precipitation across China are characterized by a semiarid climate analogous to that of Mount Tianshan. The values of AMT and AMP at each sampling site were obtained through linear interpolation based on climatic data from two meteorological observatories on the shady slope and two meteorological observatories on the sunny slope.
Statistical Analysis
Statistical analyses were conducted using SPSS software (SPSS for Windows, Version 20.0, Chicago, IL, United States). One-way analysis variance (ANOVA) was used to compare δ13C in all plants and herbs between shady and sunny slopes. The correlation analyses of altitude vs. the original δ13C and altitude vs. the residual δ13C after accounting for the effects of temperature and precipitation were performed to determine the effect of altitude and atmospheric pressure on plant δ13C.
Results
The δ13C values ranged from -23.33 to -28.80‰ with a mean value of -26.13‰ (n = 105) for the C3 plants on the shady slope, whereas it ranged from -22.12 to -29.06‰ with a mean value of -25.57‰ (n = 108) for the C3 plants on the sunny slope (Figure 3A). A one-way ANOVA suggested a significant difference between the two slopes for all C3 plants (p = 0.001). Considering the possible effect of life-forms on plant δ13C, the comparison between the two slopes for herb δ13C was also performed, and a one-way ANOVA showed a similar pattern to that observed for all C3 plants (Figure 3B, p = 0.008). A comparison for woody plants was not conducted owing to limited samples.
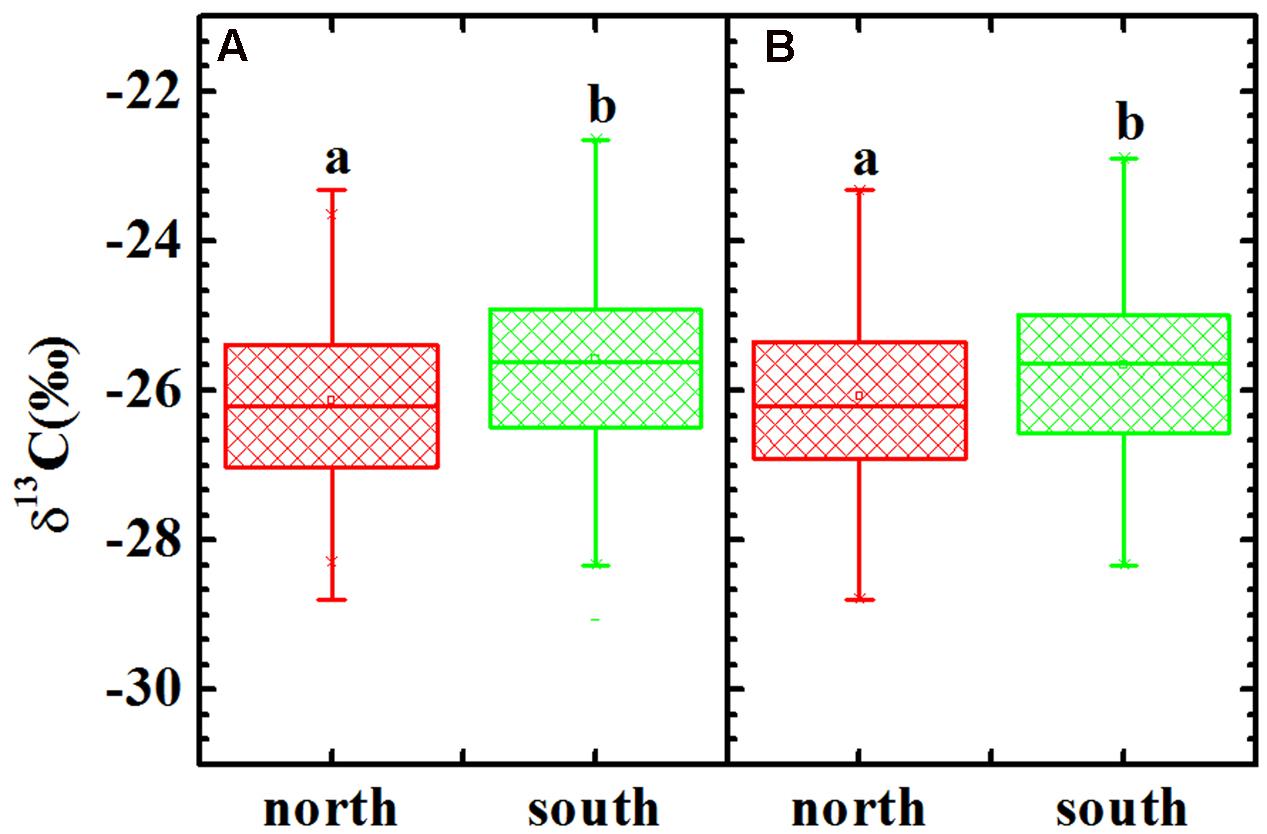
FIGURE 3. δ13C values of all C3 plants (A) and herbs (B) in the shady and sunny slopes of Mount Tianshan. Different letters indicate a significant difference (p < 0.05).
No significant relationship between altitude and δ13C was found for all plants (Figures 4A,B), herbs (Figures 4C,D) or woody plants (Supplementary Figure 1) growing on both slopes. After accounting for the combined effects of temperature and precipitation, the residual δ13C exhibited a strong positive correlation with altitude for all plants (Figures 5A,B) and herbs (Figures 5C,D). The residual δ13C increased with altitude with a coefficient of 1.09‰/km for all plants on the northern slope, 0.60‰/km for all plants on the southern slope, 0.99‰/km for the herbs on northern slope, and 0.47‰/km for the herbs on southern slope. It is well known that there is always an extremely significant relationship between air pressure and altitude (Supplementary Figure 2), although the change of air pressure is a function of temperature. Thus, the above results suggest an increase in δ13C with decreasing atmospheric pressure.
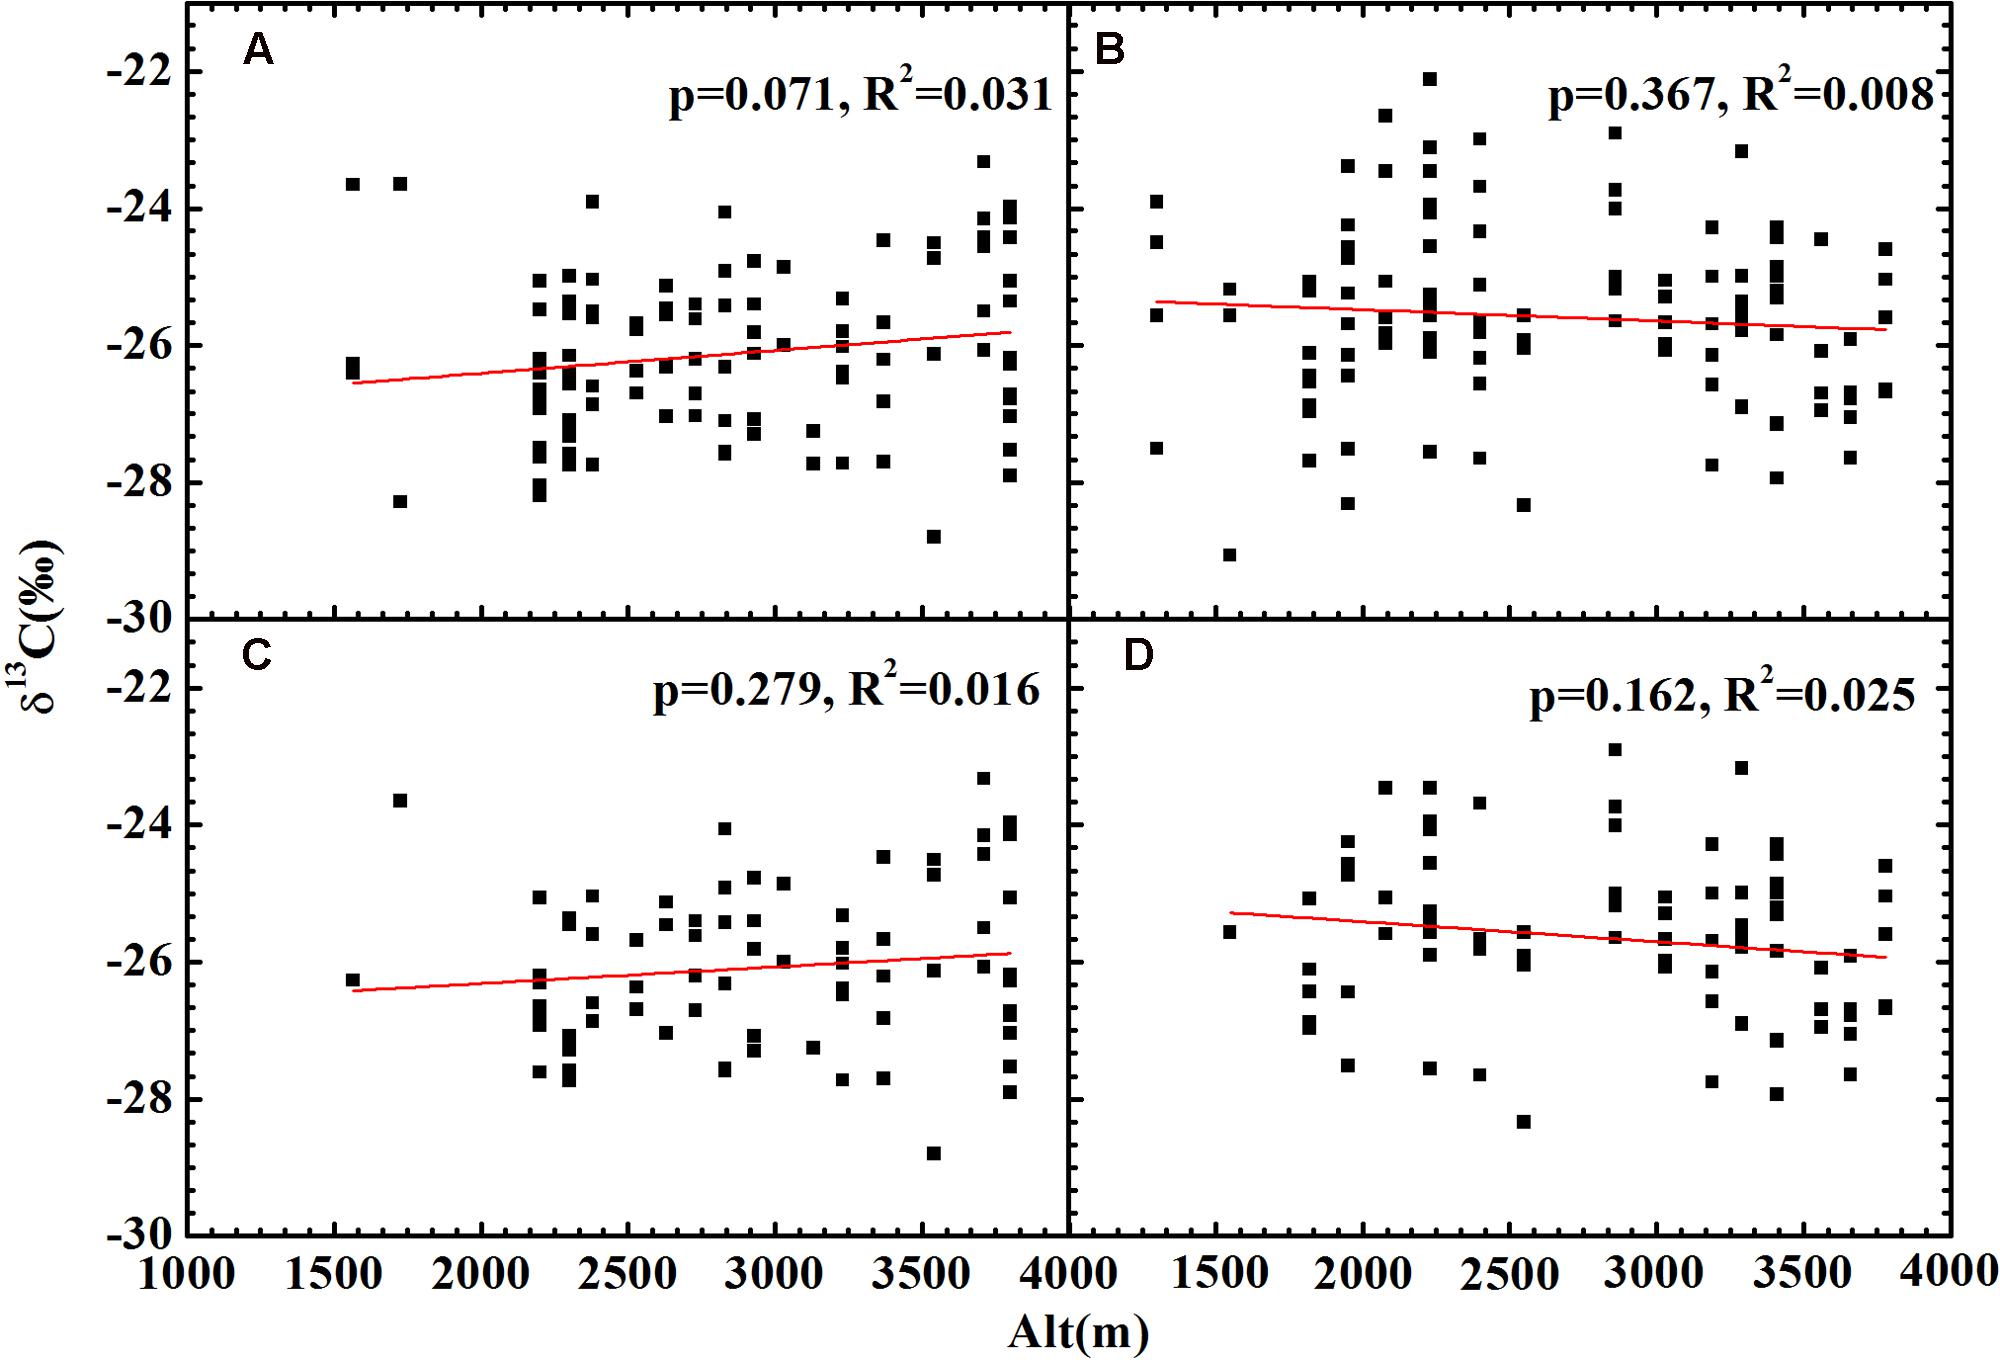
FIGURE 4. The relationships between plant δ13C and altitude. (A) All plants on the shady slope; (B) all plants on the sunny slope; (C) herbs on the shady slope; (D) herbs on the sunny slope. Correlation analyses showed no significant relationships for (A–D).
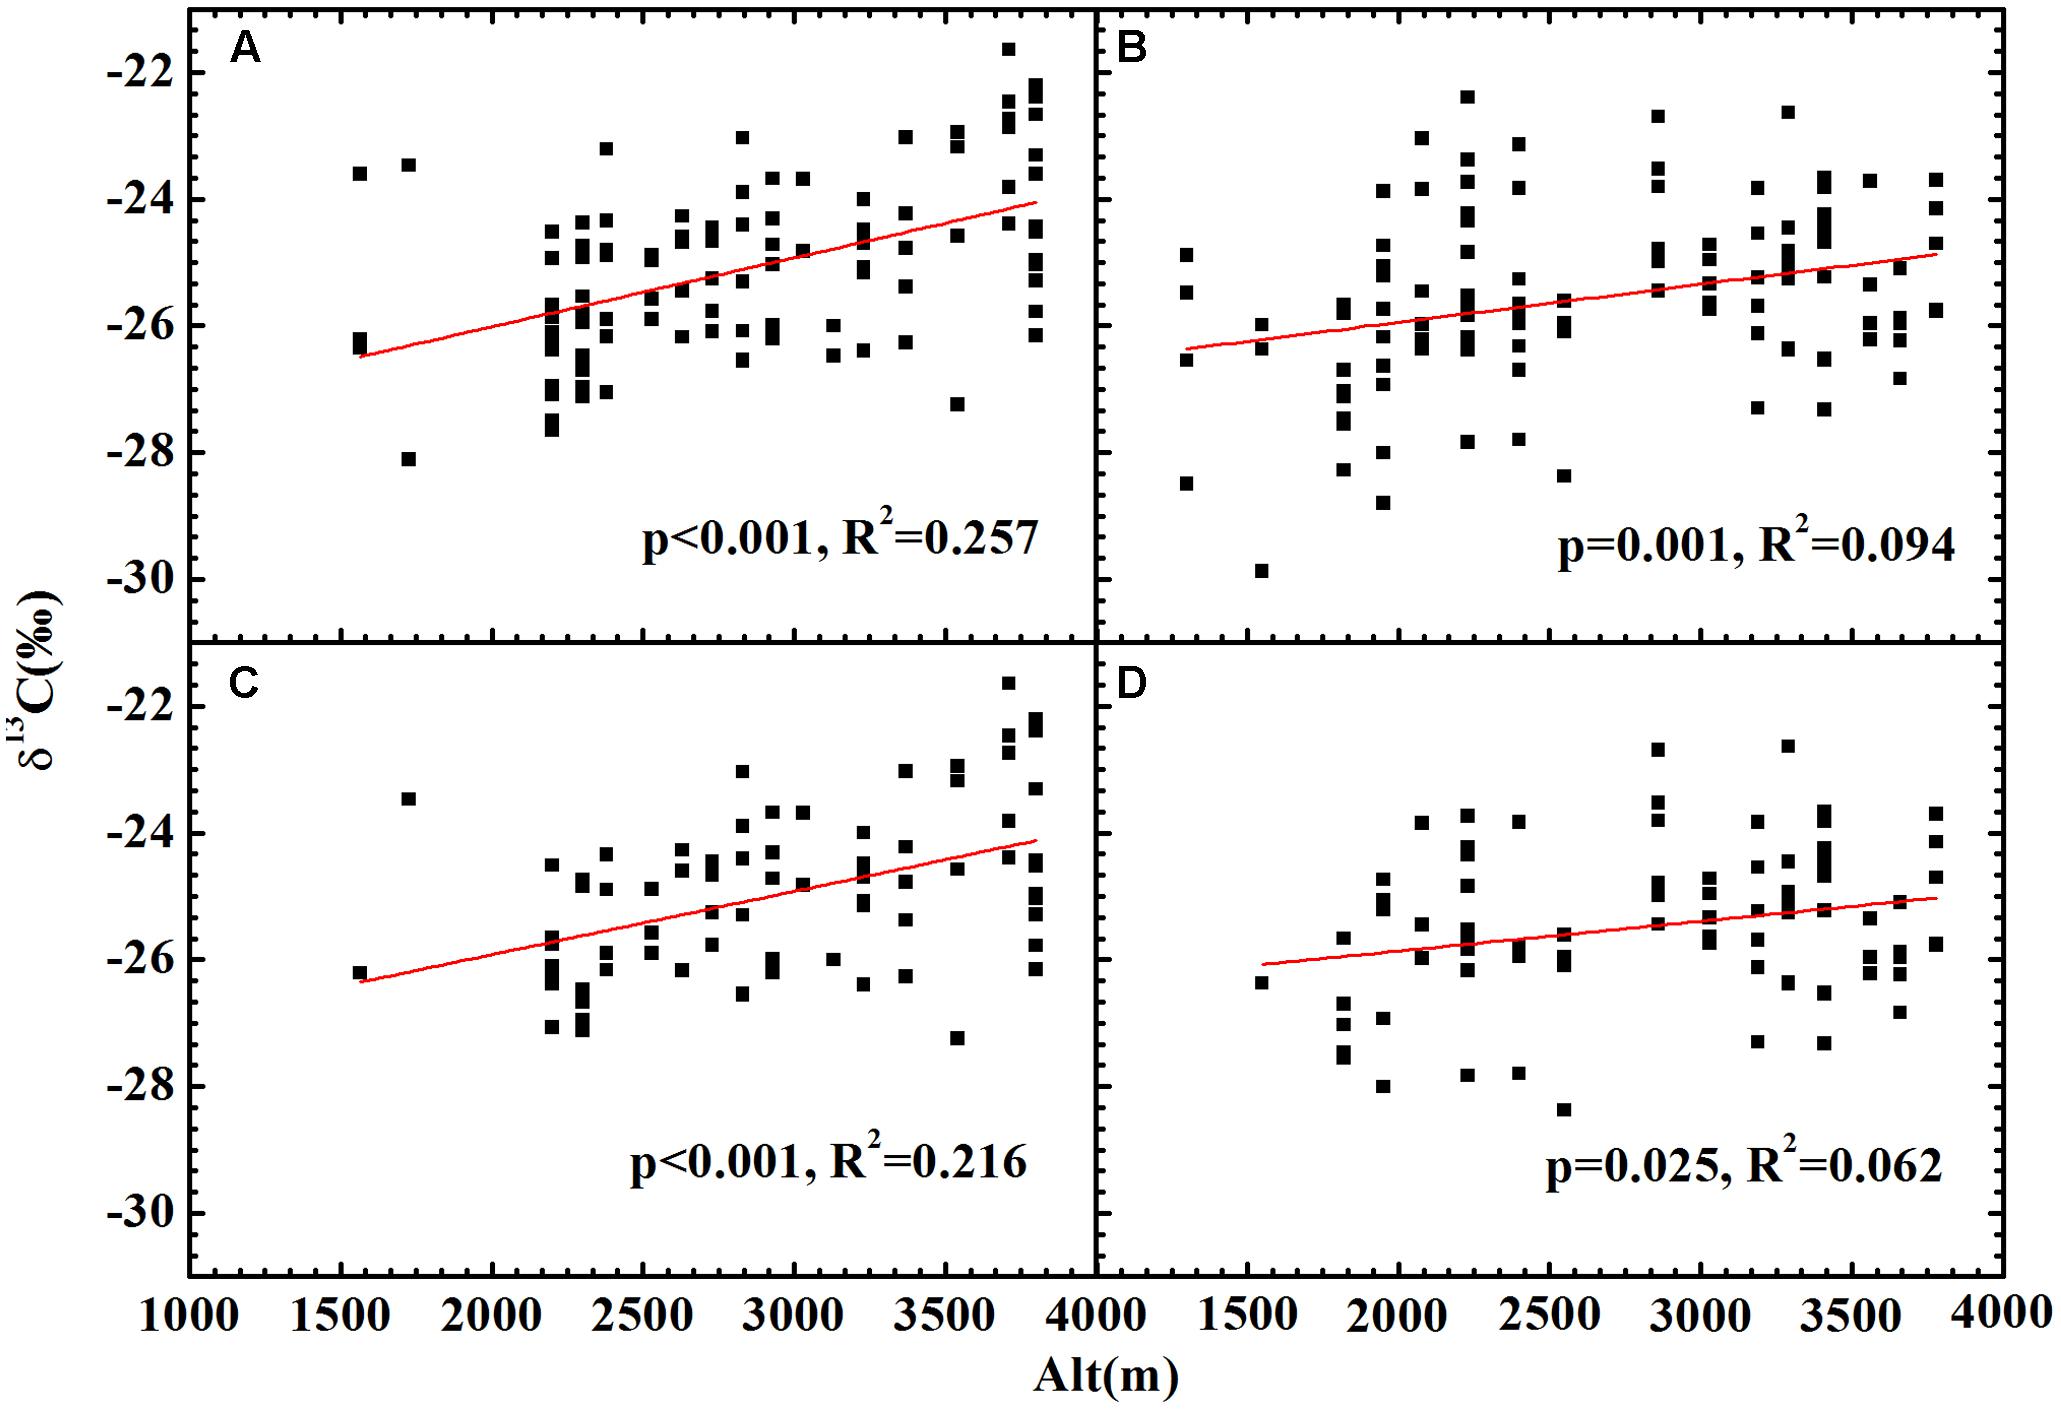
FIGURE 5. The relationships between altitude and the plants δ13C after being accounted for the effects of temperature and precipitation. (A) All plants on the shady slope (δ13C = 1.09 × 10⁻³Alt-28.19, R2 = 0.257, p < 0.001); (B) all plants on the sunny slope (δ13C = 0.60 × 10⁻³Alt-27.14, R2 = 0.094, p = 0.001); (C) herbs on the shady slope (δ13C = 0.99 × 10⁻³Alt-27.91, R2= 0.216, p < 0.001); (D) herbs on the sunny slope (δ13C = 0.45 × 10⁻³Alt-26.80, R2 = 0.062, p = 0.025).
Discussion
One-way ANOVA analyses showed that the plants grown on the sunny slope enriched more 13C than that on the shady slope; the drier and warmer climate on the sunny slope relative to the shady slope accounted for this result. δ13C did not change with altitude for all plants and herbs grown on both slopes, indicating that the pattern of no altitudinal trend of plant δ13C in arid and semi-arid regions is not dependent on microclimate and topography; furthermore, it may also be irrespective of the plant life form. The results confirmed our hypothesis. This observation, combined with previous investigations (Friend et al., 1989; Lajtha and Getz, 1993; Van de Water et al., 2002; Wang et al., 2010), strongly suggested that increasing δ13C with increasing elevation is only true for plants grown in humid regions.
The altitudinal variation in plant δ13C has been suggested to be correlated with changes in temperature, precipitation, atmospheric pressure, and solar irradiation with elevation. In humid regions, water availability is high and possibly plays a secondary role in carbon isotope discrimination (Körner et al., 1988, 1991; Sparks and Ehleringer, 1997). However, for plants in arid or semiarid habitats, soil moisture is the key growth-limiting factor. Xu et al. (2015) showed that the key growth-limiting factor is also crucial for 13C discrimination; therefore, water availability is possibly the most significant factor determining plant δ13C in regions with water stress. Thus, it could explain differences in the altitudinal pattern of plant δ13C between regions with water deficits and humid areas. Although there is a difference in precipitation between the two slopes of Mount Tianshan, soil moisture is a key growth-limiting factor for the plants on the two slopes, so the same pattern of altitudinal variations in plant δ13C was found on the sunny and shady slopes.
Except in extreme wet environments, the effect of water availability on δ13C is generally negative (e.g., Ehleringer and Cooper, 1988; Stewart et al., 1995; Wang et al., 2008; Diefendorf et al., 2010; Kohn, 2010). Precipitation increases with altitude on the northern and southern slopes in Mount Tianshan (Table 1); therefore, the altitudinal trend of precipitation should result in more negative δ13C with increasing elevation on Mount Tianshan. With more water availability, stomatal conductance increases, which leads to CO2 entering the internal leaf, and consequently the ci/ca ratio increases and thus δ13C decreases.
The effect of temperature on plant δ13C has been assessed intensively. Studies of C3 plants suggested mostly positive correlations between δ13C and temperature (e.g., Stuiver and Braziunas, 1987; Treydte et al., 2007; Wang et al., 2013; Soolanayakanahally et al., 2015; Trahan and Schubert, 2016), although some negative (Morecroft and Woodward, 1990, 1996; Sheu and Chiu, 1995; Edwards et al., 2000) and no significant (Troughton and Card, 1975; Gebrekirstos et al., 2009; Diefendorf et al., 2010) correlations have been reported. The altitudinal trend of plant δ13C is attributable mainly to the negative effect of temperature on δ13C (Körner et al., 1988, 1991; Sparks and Ehleringer, 1997). Three possible mechanisms account for the negative influence. The first is associated with changes in leaf morphology with temperature (Körner and Diemer, 1987; Körner et al., 1991). Low temperatures cause plants to increase their leaf thickness (Körner et al., 1988; Hultine and Marshall, 2000), which leads to a longer CO2 diffusion distance from the ambient to intercellular air space; as a result, the ci/ca ratios decrease and more 13C is enriched in plants (Körner and Diemer, 1987; Zhu et al., 2010); the second is that water viscosity increases with decreasing temperature and this hinders the flux of water in plants. Consequently, plant water potential decreases, resulting in partial stomatal closure and increased δ13C (Smith et al., 1984; Cernusak et al., 2013); finally, isotopic kinetic fractionation is expected to increase with decreasing temperature (Guo, 1984). In addition, several mechanisms have been proposed to account for the positive effect of temperature. A decline in temperature usually results in a reduction in enzyme activity and photosynthetic rate (Beerling, 1994), leading to decreased CO2 assimilation and consequently a lower growth rate. Under such circumstances the intercellular CO2 concentration (ci) will possibly increase if the ambient CO2 concentration (ca), stomatal conductance (gs), and mesophyll conductance (gm) all hold constant; we therefore expect a reduction in δ13C with decreasing temperature. In addition, decreasing temperature leads to a lower air-to-leaf water vapor pressure deficit, resulting in an increase in ci/ca ratios and a decrease in δ13C values owing to stomatal opening. Lower temperatures reduce dark respiration in plants. Plants enrich 13C during dark respiration; thus, lower temperatures result in less 13C enriched by plants. 13C enrichment in plants with temperature can be also explained by temperature effects on soil moisture through evaporation which is closely associated with soil moisture; relative to precipitation, soil moisture is more directly related to plant δ13C. Therefore, I argue that the above all mechanisms are reasonable, and the variations in plant δ13C with temperature reflect the combined effects of multiple mechanisms.
Irradiance can also affect carbon isotope discrimination (Δ). Plants exposed to low photon flux densities exhibit higher ci/ca and higher discrimination owing to low photosynthesis rates (Ehleringer et al., 1986). However, all sampling in the present study was carried out at unshaded sites; furthermore, the study area is characterized by abundant sunshine; the data from the Wulumuqi Meteorological Observatory (WLMQ) shows that the sunshine time is 2,645 hyr-1 and irradiance is 513.98 Jcm-2yr-1; irradiance is not the growth-limiting factor. Thus, even if variations in irradiance with elevations have a contribution to the altitudinal trend of plant δ13C, the contribution can be neglected.
Air pollutants, such as ozone or sulfur dioxide, have also been suggested to affect carbon isotope discrimination in plants. Pollution may play a role in the ci/ca ratio by inhibition of photosynthesis and/or plants’ adjustment of stomatal conductance. Darrall (1989) argued that the change of ci/ca ratio with pollution level is more complicated, because stomatal closure leads to a decrease in the ci/ca ratio, whereas inhibition of photosynthesis increases the ci/ca ratio. The net result depends on which effect is dominant. Both an increase and decrease in δ13C values have been reported in previous observations for the plants exposed to pollutants (Martin and Sutherland, 1990; Elsik et al., 1993; Saurer et al., 1995; Savard et al., 2004; Čada et al., 2016). In this study, all sampling sites were located far from cities and human habitats, with a limited effect of air pollution. Thus, the altitudinal variations in the plant δ13C after accounting for the effects of precipitation and temperature (Figure 5) mainly reflect the effect of changes in atmospheric pressure with altitude. The results suggest a negative effect of atmospheric pressure on plant δ13C.
The effect of atmospheric pressure has been examined in previous studies. Körner et al. (1991), Kelly and Woodward (1995), and Zhu et al. (2010) suggested that decreased atmospheric pressure resulted in an increase in plant δ13C, whereas the experimental investigation on Nardus stricta by Morecroft and Woodward (1990) showed a positive effect of atmospheric pressure on δ13C. Sparks and Ehleringer (1997) argued that a decrease in atmospheric pressure could not account for the altitudinal variation in plant δ13C. Relative to other field investigations, the present study may yield a more accurate relationship between atmospheric pressure and plant δ13C by accounting for the effects of precipitation and temperature.
Körner et al. (1991) proposed that atmospheric pressure affects foliar carbon isotope discrimination Δ through variations in the pCO2 (CO2 partial pressure or concentration) and pO2 (O2 partial pressure or concentration), and that the effect of atmospheric pressure is primarily attributed to pO2. Farquhar and Wong (1984) showed that Δ decreased with decreasing pO2. Decreased pO2 may reduce the oxygen inhibition in photosynthesis but exert no effect on stomatal conductance. Therefore, ci/ca ratios and Δ decrease (Körner et al., 1991). Meanwhile, decreased pO2 would also reduce the respiratory rate of plants, and cause a decline in the internal CO2 concentration derived from the respiration. As a result, ci/ca ratios and Δ decrease.
The relationship between δ13C and pCO2 has been studied intensively, and most C3 plants showed that Δ increased with increasing pCO2 (e.g., Treydte et al., 2009; Wang and Feng, 2012; Schubert and Jahren, 2013, 2015; Cui and Schubert, 2016). McCarroll et al. (2009) proposed two kinds of plant responses to increasing pCO2: passive and active responses. The passive response suggests that elevated pCO2 does not affect photosynthesis or stomatal conductance; under this case, the increment of ci equals that of ca, resulting in an increase in ci/ca values, thereby increasing Δ. The active response means that photosynthesis and/or stomatal conductance varies with pCO2, whereas the ci/ca values remain constant, and therefore, Δ remains unchanged. Wang and Feng (2012) proposed a third response in which ci stays constant with rising pCO2, resulting in a reduction in both ci/ca ratios and Δ. However, this response is used by only some plants.
Conclusion
C3 plants grown on both sunny and shady slopes of Mount Tianshan characterized by an arid and semiarid climate do not exhibit an altitudinal trend of foliar δ13C. The observation confirmed our hypothesis that altitudinal variation in δ13C may be negative or unchanged for plants grown in arid and/or semiarid regions. Water availability exerted a significant effect on plant δ13C in areas with water stress; resulting in a different altitudinal variation in plant δ13C in arid and/or semiarid regions from the general pattern observed in humid areas. After accounting for the effects of temperature and precipitation, the residual δ13C exhibited a strong positive correlation with altitude on the both slopes, which suggested that atmospheric pressure had a negative effect on plant δ13C.
Author Contributions
GW designed the study. ZC and GW wrote the paper. GW, YJ, and ZC collected the samples. ZC measured the data.
Conflict of Interest Statement
The authors declare that the research was conducted in the absence of any commercial or financial relationships that could be construed as a potential conflict of interest.
Acknowledgments
This research was supported by grants from the National Natural Science Foundation of China (no. 41272193) and the National Basic Research Program (2014CB954202). We would like to thank Ma Yan for analyzing stable carbon isotope ratios in the Isotope Laboratory at the College of Resources and Environment, China Agricultural University.
Supplementary Material
The Supplementary Material for this article can be found online at: http://journal.frontiersin.org/article/10.3389/fpls.2017.01070/full#supplementary-material
References
Beerling, D. J. (1994). Predicting leaf gas-exchange and C response to the past 30,000 years of global environmental change. New Phytol. 128, 425–433. doi: 10.1111/j.1469-8137.1994.tb02988.x
Broeckx, L. S., Fichot, R., Verlinden, M. S., and Ceulemans, R. (2014). Seasonal variations in photosynthesis, intrinsic water-use efficiency and stable isotope composition of poplar leaves in a short-rotation plantation. Tree Physiol. 34, 701–715. doi: 10.1093/treephys/tpu057
Čada, V., Šantrucková, H., Šantrucek, J., Kubištová, L., Seedre, M., and Svoboda, M. (2016). Complex physiological response of norway spruce to atmospheric pollution – decreased carbon isotope discrimination and unchanged tree biomass increment. Front. Plant Sci 7:805. doi: 10.3389/fpls.2016.0080
Cernusak, L. A., Ubierna, N., Winter, K., Holtum, J. A. M., Marshall, J. D., and Farquhar, G. D. (2013). Environmental and physiological determinants of carbon isotope discrimination in terrestrial plants. New Phytol. 200, 950–965. doi: 10.1111/nph.12423
Cui, Y., and Schubert, B. A. (2016). Quantifying uncertainty of past pCO2 determined from changes in C3 plant carbon isotope fractionation. Geochim. Cosmochim. Acta 172, 127–138. doi: 10.1016/j.gca.2015.09.032
Darrall, N. M. (1989). The effect of air pollutants on physiological processes in plants. Plant Cell Environ. 12, 1–30. doi: 10.1111/j.1365-3040.1989.tb01913.x
Diefendorf, A. F., Mueller, K. E., and Wing, S. L. (2010). Global patterns in leaf 13C discrimination and implications for studies of past and future climate. Proc. Natl. Acad. Sci. U.S.A. 107, 5738–5743. doi: 10.1073/pnas.0910513107
Edwards, T. W. D., Graf, W., Trimborn, P., Stichler, W., Lipp, J., and Payer, H. D. (2000). δ13C response surface resolves humidity and temperature signals in trees. Geochim. Cosmochim. Acta 64, 161–167. doi: 10.1016/S0016-7037(99)00289-6
Ehleringer, J. R., and Cooper, T. A. (1988). Correlations between carbon isotope ratio and microhabitat in desert plants. Oecologia 76, 62–66. doi: 10.1007/BF00397870
Ehleringer, J. R., Field, C. B., Lin, Z. F., and Kuo, C. Y. (1986). Leaf carbon isotope and mineral composition in subtropical plants along an irradiance cline. Oecologia 70, 520–526. doi: 10.1007/BF00379898
Elsik, C. G., Flagler, R. B., and Boutton, T. W. (1993). “Carbon isotope composition and gas exchange of loblolly and shortleaf pine as affected by ozone and water stress,” in Stable Isotopes and Plant Carbon-Water Relations, eds J. R. Ehleringer, A. E. Hall, and G. D. Farquhar (San Diego, CA: Academic Press),227–244.
Farquhar, G. D., and Richards, P. A. (1984). Isotopic composition of plant carbon correlates with water-use efficiency of wheat genotypes. Aust. J. Plant Physiol. 11, 539–552. doi: 10.1071/PP9840539
Farquhar, G. D., and Wong, S. C. (1984). An empirical model of stomatal conductance. Aust. J. Plant Physiol. 11, 191–210. doi: 10.1071/PP9840191
Friend, A. D., Woodward, F. I., and Switsur, V. R. (1989). Field measurements of photosynthesis, stomatal conductance, leaf nitrogen and δ13C along altitudinal gradients in Scotland. Funct. Ecol. 3, 117–122. doi: 10.2307/2389682
Gebrekirstos, A., Worbes, M., Teketay, D., Fetene, M., and Mitlöhner, R. (2009). Stable carbon isotope ratios in tree rings of co-occurring species from semi-arid tropics in Africa: patterns and climatic signals. Glob. Planet. Change 66, 253–260. doi: 10.1016/j.gloplacha.2009.01.002
Heaton, T. H. E. (1999). Spatial, species, and temporal variations in the 13C/12C ratios of C3 plants: implications for palaeodiet studies. J. Archaeol. Sci. 26, 637–649. doi: 10.1006/jasc.1998.0381
Hultine, K. R., and Marshall, J. D. (2000). Altitude trends in conifer leaf morphology and stable carbon isotope composition. Oecologia 123, 32–40. doi: 10.1007/s004420050986
Kelly, C. K., and Woodward, F. I. (1995). Ecological correlates of carbon isotope composition of leaves: a comparative analysis testing for the effects of temperature, CO2 and O2 partial pressures and taxonomic relatedness on δ13C. J. Ecol. 83, 509–515. doi: 10.2307/2261603
Kohn, M. J. (2010). Carbon isotope compositions of terrestrial C3 plants as indicators of (paleo) ecology and (paleo) climate. Proc. Natl. Acad. Sci. U.S.A. 107, 19691–19695. doi: 10.1073/pnas.1004933107
Körner, C., and Diemer, M. (1987). In situ photosynthetic responses to light, temperature and carbon dioxide in herbaceous plants from low and high altitude. Funct. Ecol. 1, 179–194. doi: 10.2307/2389420
Körner, C., Farquhar, G. D., and Roksandic, Z. (1988). A global survey of carbon isotope discrimination in plants from high altitude. Oecologia 74, 623–632. doi: 10.1007/BF00380063
Körner, C., Farquhar, G. D., and Wong, S. C. (1991). Carbon isotope discrimination by plants follows latitudinal and altitudinal trends. Oecologia 88, 30–40. doi: 10.1007/BF00328400
Lajtha, K., and Getz, J. (1993). Photosynthesis and water-use efficiency in pinyon-juniper communities along an elevation gradient in northern New Mexico. Oecologia 94, 9–101. doi: 10.1007/BF00317308
Li, J. Z., Wang, G. A., Liu, X. Z., Han, J. M., Liu, M., and Liu, X. J. (2009). Variations in carbon isotope ratios of C3 plants and distribution of C4 plants along an altitudinal transect on the eastern slope of Mount Gongga. Sci. China Ser. D Earth Sci. 52, 1714–1723. doi: 10.1007/s11430-009-0170-4
Martin, B., and Sutherland, E. K. (1990). Air pollutant in the past recorded in width and stable carbon isotope composition of annual growth rings of Douglas-fir. Plant Cell Environ. 13, 839–844. doi: 10.1111/j.1365-3040.1990.tb01101.x
McCarroll, D., Gagen, M. H., Loader, N. J., Robertson, I., Anchukaitis, K. J., Los, S., et al. (2009). Correction of tree ring stable carbon isotope chronologies for changes in the carbon dioxide content of the atmosphere. Geochim. Cosmochim. Acta 73, 1539–1547. doi: 10.1016/j.gca.2008.11.041
McCarroll, D., and Loader, N. J. (2004). Stable isotopes in tree rings. Quat. Sci. Rev. 23, 771–801. doi: 10.1016/j.quascirev.2003.06.017
Morecroft, M. D., and Woodward, F. I. (1990). Experimental investigations on the environmental determination of δ13C at different altitude. J. Exp. Bot. 41, 1303–1308. doi: 10.1093/jxb/41.10.1303
Morecroft, M. D., and Woodward, F. I. (1996). Experiments on the causes of altitudinal differences in leaf nutrient contents, age and 13C of Alchemilla alpina. New Phytol. 134, 471–479. doi: 10.1111/j.1469-8137.1996.tb04364.x
Saurer, M., Maurer, S., Matyssek, R., Landolt, W., Günthardt-Goerg, M. S., and Siegenthaler, U. (1995). The influence of ozone and nutrition on 13C in Betula pendula. Oecologia 103, 397–406. doi: 10.1007/BF00328677
Savard, M. M., Begin, C., Parent, M., Smirnoff, A., and Marion, J. (2004). Effects of smelter sulfur dioxide emissions: a spatiotemporal perspective using carbon isotopes in tree rings. J. Environ. Qual. 33, 13–26. doi: 10.2134/jeq2004.1300
Sayak, B., Shailesh, A., Prasanta, S., Poritosh, M., Satyam, K., and Anindya, S. (2015). Carbon isotopic ratios of modern C3–C4 plants from the Gangetic Plain, India and its implications to paleovegetational reconstruction. Palaeogeogr. Palaeoclimatol. Palaeoecol. 440, 22–32. doi: 10.1016/j.palaeo.2015.08.012
Schleser, G. H., Helle, G., Lucke, A., and Vos, H. (1999). Isotope signals as climate proxies: the role of transfer functions in the study of terrestrial archives. Quat. Sci. Rev. 18, 927–943. doi: 10.1016/S0277-3791(99)00006-2
Schubert, B. A., and Jahren, A. H. (2013). Reconciliation of marine and terrestrial carbon isotope excursions based on changing atmospheric CO2 levels. Nat. Commun. 4, 1653. doi: 10.1038/ncomms2659
Schubert, B. A., and Jahren, A. H. (2015). Global increase in plant carbon isotope fractionation following the last glacial maximum caused by increase in atmospheric pCO2. Geology 43, 435–438. doi: 10.1130/G36467.1
Sheu, D. D., and Chiu, C. H. (1995). Evaluation of cellulose extraction procedures for stable carbon isotope measurement in tree ring research. Int. J. Environ. Anal. Chem. 59, 59–67. doi: 10.1080/03067319508027636
Smith, W. K., Young, D. R., Carter, G. A., Hadley, J. L., and McNaughton, G. M. (1984). Autumn stomatal closure in six conifer species of the Central Rocky Mountains. Oecologia 63, 237–242. doi: 10.1007/BF00379883
Soolanayakanahally, R. Y., Guy, R. D., Street, N. R., Robinson, K. M., Silim, S. N., Albrectsen, B. R., et al. (2015). Comparative physiology of allopatric Populus species: geographic clines in photosynthesis, height growth, and carbon isotope discrimination in common gardens. Front. Plant Sci. 6:528. doi: 10.3389/fpls.2015.00528
Sparks, J. P., and Ehleringer, J. R. (1997). Leaf carbon isotope discrimination and nitrogen content for riparian trees along elevational transects. Oecologia 109, 362–367. doi: 10.1007/s004420050094
Stewart, G. R., Turnbull, M. H., Schmidt, S., and Erskine, P. D. (1995). 13C Natural abundance in plant communities along a rainfall gradient: a biological integrator of water availability. Aust. J. Plant Physiol. 22, 51–55. doi: 10.1071/PP9950051
Stuiver, M., and Braziunas, T. F. (1987). Tree cellulose 13C/12C isotope ratios and climate change. Nature 327, 58–60. doi: 10.1038/328058a0
Trahan, M. W., and Schubert, B. A. (2016). Temperature-induced water stress in high-latitude forests in response to natural and anthropogenic warming. Glob.Change Biol. 22, 782–791. doi: 10.1111/gcb.13121
Treydte, K., Frank, D., Esper, J., Andreu, L., Bednarz, Z., Berninger, F., et al. (2007). Signal strength and climate calibration of a European tree-ring isotope network. Geophys. Res. Lett. 34, 1–6. doi: 10.1029/2007GL031106
Treydte, K., Frank, D., Saurer, M., Helle, G., Schleser, G., and Esper, J. (2009). Impact of climate and CO2 on a millennium-long tree-ring carbon isotope record. Geochim. Cosmochim. Acta 73, 4635–4647. doi: 10.1016/j.gca.2009.05.057
Troughton, J. H., and Card, K. A. (1975). Temperature effects on the carbon isotope ratio of C3, C4 and crassulacean-acid metabolism (CAM) plants. Planta 123, 185–190. doi: 10.1007/BF00383867
Van de Water, P. K., Leavitt, S. W., and Betancourt, J. L. (2002). Leaf δ13C variability with elevation, slope aspect and precipitation in the southwest United States. Oecologia 132, 332–343. doi: 10.1007/s00442-002-0973-x
Wang, G. A., and Feng, X. (2012). Response of plants’ water use efficiency to increasing atmospheric CO2 concentration. Environ. Sci. Technol. 46, 8610–8620. doi: 10.1021/es301323m
Wang, G. A., Feng, X., Han, J., Zhou, L., Tan, W., and Su, F. (2008). Paleovegetation reconstruction using δ13C of soil organic matter. Biogeosciences 5, 1325–1337. doi: 10.5194/bg-5-1325-2008
Wang, G. A., Li, J. Z., Liu, X. Z., and Li, X. Y. (2013). Variations in carbon isotope ratios of plants across a temperature gradient along the 400 mm isoline of mean annual precipitation in north China and their relevance to paleovegetation reconstruction. Quat. Sci. Rev. 63, 83–90. doi: 10.1016/j.quascirev.2012.12.004
Wang, G. A., Zhou, L. P., Liu, M., Han, J. M., Guo, J. H., Faiia, A., et al. (2010). Altitudinal trends of leaf δ13C follow different patterns across a mountainous terrain in north China characterized by a temperate semi-humid climate. Rapid Commun. Mass Spectrom. 24, 1557–1564. doi: 10.1002/rcm.4543
Xu, M., Wang, G. A., Li, X. L., Cai, X. B., Li, X. L., Christie, P., et al. (2015). The key factor limiting plant growth in cold and humid alpine areas also plays a dominant role in plant carbon isotope discrimination. Front. Plant Sci. 6:961. doi: 10.3389/fpls.2015.00961
Yang, Y., Siegwolf, R. T. W., and Körner, C. (2015). Species specific and environment induced variation of δ13C and δ15N in alpine plants. Front. Plant Sci. 6:423. doi: 10.3389/fpls.2015.00423
Keywords: plant δ13C, altitude, atmospheric pressure, temperature, arid mountainous terrain
Citation: Chen Z, Wang G and Jia Y (2017) Foliar δ13C Showed No Altitudinal Trend in an Arid Region and Atmospheric Pressure Exerted a Negative Effect on Plant δ13C. Front. Plant Sci. 8:1070. doi: 10.3389/fpls.2017.01070
Received: 27 December 2016; Accepted: 02 June 2017;
Published: 04 July 2017.
Edited by:
Boris Rewald, University of Natural Resources and Life Sciences, Vienna, AustriaReviewed by:
Giovanni Di Matteo, Council for Agricultural Research and Economics/Research Unit for Climatology and Meteorology applied to Agriculture - Forest Acllimation Lab, ItalySema Kale Celik, Suleyman Demirel University, Kazakhstan
Copyright © 2017 Chen, Wang and Jia. This is an open-access article distributed under the terms of the Creative Commons Attribution License (CC BY). The use, distribution or reproduction in other forums is permitted, provided the original author(s) or licensor are credited and that the original publication in this journal is cited, in accordance with accepted academic practice. No use, distribution or reproduction is permitted which does not comply with these terms.
*Correspondence: Guoan Wang, Z2F3YW5nQGNhdS5lZHUuY24=