 Hemasundar Alavilli
 Hyoungseok Lee
 Mira Park
 Byeong-ha Lee
- 1Department of Life Science, Sogang University, Seoul, South Korea
- 2Division of Life Sciences, Korea Polar Research Institute, Incheon, South Korea
Polytrichastrum alpinum is one of the moss species that survives extreme conditions in the Antarctic. In order to explore the functional benefits of moss genetic resources, P. alpinum multiprotein-bridging factor 1c gene (PaMBF1c) was isolated and characterized. The deduced amino acid sequence of PaMBF1c comprises of a multiprotein-bridging factor (MBF1) domain and a helix-turn-helix (HTH) domain. PaMBF1c expression was induced by different abiotic stresses in P. alpinum, implying its roles in stress responses. We overexpressed PaMBF1c in Arabidopsis and analyzed the resulting phenotypes in comparison with wild type and/or Arabidopsis MBF1c (AtMBF1c) overexpressors. Overexpression of PaMBF1c in Arabidopsis resulted in enhanced tolerance to salt and osmotic stress, as well as to cold and heat stress. More specifically, enhanced salt tolerance was observed in PaMBF1c overexpressors in comparison to wild type but not clearly observable in AtMBF1c overexpressing lines. Thus, these results implicate the evolution of PaMBF1c under salt-enriched Antarctic soil. RNA-Seq profiling of NaCl-treated plants revealed that 10 salt-stress inducible genes were already up-regulated in PaMBF1c overexpressing plants even before NaCl treatment. Gene ontology enrichment analysis with salt up-regulated genes in each line uncovered that the terms lipid metabolic process, ion transport, and cellular amino acid biosynthetic process were significantly enriched in PaMBF1c overexpressors. Additionally, gene enrichment analysis with salt down-regulated genes in each line revealed that the enriched categories in wild type were not significantly overrepresented in PaMBF1c overexpressing lines. The up-regulation of several genes only in PaMBF1c overexpressing lines suggest that enhanced salt tolerance in PaMBF1c-OE might involve reactive oxygen species detoxification, maintenance of ATP homeostasis, and facilitation of Ca2+ signaling. Interestingly, many salt down-regulated ribosome- and translation-related genes were not down-regulated in PaMBF1c overexpressing lines under salt stress. These differentially regulated genes by PaMBF1c overexpression could contribute to the enhanced tolerance in PaMBF1c overexpressing lines under salt stress.
Introduction
In the Antarctic landscape, mosses constitute the dominant flora. They are capable of coping with multiple abiotic stress factors such as low temperatures, high radiation, high salts, strong winds and prolonged desiccation, and unpredictable cycles of freezing and thawing (Turetsky et al., 2012; Zuniga-Gonzalez et al., 2016). Polytrichastrum alpinum (Hedw.) G.L.Sm., also known as alpine haircap moss, is distributed over a large area of arctic, sub-arctic and montane temperate regions (Bhattarai et al., 2009; Bell and Hyvonen, 2010; Victoria et al., 2013). Despite its strong stress tolerance, few reports till date have described the utilization of moss genetic resources in crop improvement.
Multiprotein bridging factor 1 (MBF1) was first purified from posterior silk gland extracts of Bombyx mori (Li et al., 1994). MBF1 proteins are highly conserved from archaea to humans. Each of the three Arabidopsis MBF1 paralogs could restore MBF1 functions in mbf1 deficient yeast (mbf1Δ) (Tsuda et al., 2004). In addition, the mbf1Δ yeast were also rescued by expressing human or silkworm MBF1 (Takemaru et al., 1997), suggesting conservation of MBF1 gene function. MBF1 proteins function as a non-DNA binding transcriptional co-activators (Aravind and Koonin, 1999; Kabe et al., 1999) that are involved in diverse physiological and developmental processes (Brendel et al., 2002; Liu et al., 2003).
In plants, MBF1 genes are known to be involved in abiotic and biotic stress tolerance. MBF1 expression in Solanum tuberosum (StMBF1) is induced by wounding (Godoy et al., 2001) and pathogen attack in tubers (Arce et al., 2006). Expression levels of Vitis vinifera MBF1 (VvMBF1) were increased in leaf tissues in response to ABA and dehydration stress, and overexpression of VvMBF1 in Arabidopsis resulted in enhanced drought stress tolerance (Yan et al., 2014); also, ectopic expression of Triticum aestivum MBF1c (TaMBF1c) in rice improved its thermal tolerance under vegetative and reproductive stages (Qin et al., 2015). However, MBF1 overexpression does not always appear to result in improved stress tolerance in plants. When the AtMBF1a and AtMBF1b homolog, Capsicum annum MBF1 (CaMBF1) was overexpressed in Arabidopsis, the resulting transgenic plants produced large leaves but displayed reduced tolerance to abiotic stress (Guo et al., 2014).
The model plant Arabidopsis thaliana has three MBF1 paralogs – AtMBF1a, AtMBF1b, and AtMBF1c. Phylogenetic analysis suggests that AtMBF1a and AtMBF1b are more closely related, while AtMBF1c belongs to a separate group (Tsuda and Yamazaki, 2004). Overexpression of the AtMBF1a gene enhanced salt tolerance, glucose insensitivity and fungal resistance in transgenic Arabidopsis plants (Kim et al., 2007). Compared to the other two Arabidopsis MBF1s, AtMBF1c was highly induced in response to pathogen infection, dehydration, high salt, methyl viologen, hydrogen peroxide (H2O2), and heat treatment (Rizhsky et al., 2002; Tsuda and Yamazaki, 2004; Suzuki et al., 2005). The Arabidopsis mbf1 triple knock-down mutant (mbf1 abc-) was hypersensitive to oxidative and osmotic stress agents such as methyl viologen, H2O2 and high concentrations of sorbitol. These mbf1 abc- mutant stress-sensitive phenotypes were either partially or fully restored by AtMBF1c cDNA overexpression, implicating the predominance of AtMBF1c gene function in stress tolerance (Arce et al., 2010). Overexpression of the AtMBF1c gene in Arabidopsis also enhanced tolerance to bacterial infection as well as to heat and osmotic stress (Suzuki et al., 2005). In fact, functionality of the AtMBF1c gene is well established in plant heat stress response; it controls heat stress-related gene expression to improve basal heat tolerance during heat stress (Suzuki et al., 2011).
In order to investigate the functional benefits of moss genetic resources, we have isolated the stress responsive PaMBF1c gene from a P. alpinum cDNA library and examined its functions under salt and other abiotic stress by overexpression and RNA-Seq profiling.
Materials and Methods
Conserved Domain Analysis and Phylogenetic Analysis
The MBF protein homologs sequences from diverse species were retrieved from GenBank database and Phytozome database1 (Goodstein et al., 2012) with BlastP using PaMBF1c amino acid sequences as a query. Multiple sequence alignment was performed using ClustalW (Thompson et al., 1994; Kumar et al., 2016). Conserved domains in each sequence were identified using NCBI conserved domain finder2. The phylogenetic tree was constructed with MEGA7 software (Thompson et al., 1994; Kumar et al., 2016) from the data sets by using the maximum likelihood method based on the JTT matrix-based model. The initial tree for the heuristic search was obtained by applying the neighbor-joining method to a matrix of pair-wise distances, estimated using a JTT model. Supports for internal branches were tested by bootstrap analyses of 1000 replications.
Plant Material and Growth Conditions
Polytrichastrum alpinum (Hedw.) G.L.Sm. samples were collected from the King Sejong Antarctic station (62°14′29′′S; 58°44′18′′W), at the Barton Peninsula of King George Island. In vitro culture was carried out on BCD solid media (Ashton and Cove, 1977), which are successfully being used in a model moss Physcomitrella patens culture (Du et al., 2016), in a growth room operating at 23°C with 16-h light/8-h dark light cycle with a light intensity of 150 μmol m-2S-1.
The plates were placed in a growth chamber that operates at 22 ± 1°C and 70% relative humidity with continuous light (80–100 μmol m-2S-1). The seeds planted on soil (Sungro propagation mixture, Canada) were maintained in a controlled growth chamber that operates with 16-h light/8-h dark cycle. All seeds were stratified for at least 2 days at 4°C before being transferred to the growth chamber. When necessary, seedlings raised on MS were transferred to soil pots in a growth chamber at 22 ± 1°C and 50–70% relative humidity programmed with 16-h light/8-h dark light cycle (the light intensity of 80–100 μmol m-2S-1).
Cloning of PaMBF1c Gene and Generation of Transgenic Arabidopsis Plants
Polytrichastrum alpinum first strand cDNA was synthesized from total RNA with MMLV reverse transcriptase (Enzynomics, South Korea) and oligo(dT) primer. Full-length PaMBF1c coding sequences were amplified using gene specific primers (Supplementary Table S1). The resulting PCR products were cloned into the pENTR/D/TOPO entry vector (Invitrogen, United States) and sequenced using M-13 primers. After sequencing confirmation, the entry plasmids were LR-recombined with the gateway compatible binary destination vector, pMDC32 (Curtis and Grossniklaus, 2003), which resulted in the overexpression construct, pMDC32-35s:PaMBF1c. The construct was then transferred into Agrobacterium tumefaciens strain GV3101 via electroporation. Agrobacterium-mediated transformation of Arabidopsis thaliana (Col-0) with the PaMBF1c gene was performed through the floral dipping method (Clough and Bent, 1998). For selection of PaMBF1c-OE lines, T1 seeds were harvested from floral-dipped plants and selected on MS/agar plates containing hygromycin (25 μg/mL). Using hygromycin selection and transgene detection, homozygotes for the PaMBF1c transgene of two independent events were selected at T2 generation after segregation analysis at T3 generation (PaMBF1c-OE1 and PaMBF1c-OE2). Hygromycin resistance from each line at T2 generation was segregated to a 3:1 ratio of resistant-to-sensitive, indicating a single locus of insertion.
Stress Treatment and Analysis of Stress Tolerance in Plants
Polytrichastrum alpinum gametophores were transferred onto fresh agar plates of BCD medium containing mannitol (150, 300 mM) or NaCl (75, 150 mM), respectively, and incubated at 15°C for 6 h. Heat treatment was carried out by transferring colonies grown at 15°C to chambers of 37 or 42°C for 2 h.
For Arabidopsis thaliana germination experiments, at least 100–120 seeds of each genotype were planted in a media with or without stress agents and germination trends were recorded from the day after planting until all the seeds in control plates were germinated. The number of germinated seeds was expressed as the percentage of total number of seeds plated. For root growth experiments, the seeds were planted in vertical MS plates with 0.6% gelrite and allowed to grow for 4 days. Seedlings with a 1–1.5 cm long root were transferred onto a second MS vertical plate supplemented with different concentrations of salts or stress agents. For survival index under NaCl and LiCl, the shoot phenotypes of seedlings were observed every day after transferring seedlings from the control medium. Hypocotyl elongation under heat stress was assessed as previously described (Hong and Vierling, 2000). The malondialdehyde (MDA), chlorophyll, and anthocyanin content in control and stress treated plants were also determined as previously described (Heath and Packer, 1968; Lichtenthaler, 1987; Neff and Chory, 1998).
Measurement of Electrolyte Leakage
Fully expanded fourth or fifth rosette leaf with petiole from 3-week-old seedlings was placed in a 15 mL test tube containing 100 μL of deionized water and placed at 0°C in a refrigerated circulating bath (Gaon Science Instrument, South Korea). The remaining steps were carried out according to methods described previously (Lee et al., 2002). Conductivity was measured using a conductivity meter (Control Company, United States) before and after autoclaving, and electrolyte leakage was expressed as a percentage of conductivity before autoclaving over conductivity after autoclaving.
Gene Expression Analysis
Total RNAs were isolated from plant materials using an RNA purification kit (NanoHelix, South Korea) and treated with RNase free DNase I (Qiagen, Germany). For semi-quantitative one step RT-PCR, total RNAs were added to the Hi-pure one step RT-PCR master mix (Genepole, South Korea) and the PCR reaction was performed according to manufacturer instructions. Protein phosphatase 2A (At1g13320) was used as an internal control. Quantitative real-time PCR was performed using KAPA SYBR FAST qPCR kit (Kapa Biosystems, United States) according to manufacturer instructions and run on the ABI 7500 system (Applied Biosystems, United States). The relative expression of PaMBF1c in P. alpinum was calculated by normalizing expression values with those of the housekeeping gene PaTubulin. For the Arabidopsis qRT experiment, AtClathrin gene (At4g24550) was used as an internal control. The ΔΔCt method was adapted to calculate relative gene expression (Livak and Schmittgen, 2001). The primer pairs used for amplification are shown in Supplementary Table S1.
RNA Sequencing
RNA-sequencing was carried out using total RNA from 2-week-old WT, two independent PaMBF1c-OE lines (two events) and two independent AtMBF1c-OE lines (two events) under normal and salt stressed conditions (300 mM NaCl, 6 h). We used this salt stress condition because 300 mM NaCl treatment for 4–6 h in Arabidopsis brought about maximum expression of a very well characterized stress inducible gene, RD29A (Ishitani et al., 1997). Total RNAs were extracted from at least 25–30 plants of each genotype and treatment using Pure Helix total RNA purification kit (NanoHelix, South Korea) and RNase free DNase I (Qiagen, Germany). Three different biological replicates were prepared. The integrity and concentration of RNA was determined using Bioanalyzer (RIN > 6) and Qubit® RNA BR assay kit (Life Technologies, United States). To construct the sequencing library, 1.5 μg of total RNA of each sample was used as input for the TruSeq RNA sample prep kit v2 (Illumina, United States). The libraries were validated and quantified by Bioanalyzer and qPCR quantification method, and then multiplexed with equal ratio and loaded on the flowcell of the Illumina MiSeq Reagent Kit v3 (150 cycles). Afterward, sequencing was performed on a MiSeq Sequencer system (Illumina, United States) and total 3 Gb (40M paired end reads) of sequencing data was generated (Q30 > 98%). The RNA-Seq data have been deposited to the Sequence Read Archive (SRA3) under accession number SRP110226.
Transcriptomic Data Analysis
Basically all analyses were performed using the CLC Genomics Workbench v7 module (Qiagen, Germany). After quality and adapter trimming, raw reads were mapped to the Arabidopsis gene model annotation file of the Gene Ontology Consortium (released at August 8th, 2014). The expression values were measured in FPKM (Fragments per Kilobase of exon model per Million mapped reads) normalized values in gene level (Mortazavi et al., 2008). For statistical analysis, t-test and Baggerley’s test were performed using original and normalized read counts, and several relevant values for analysis (p-value, FDR corrected p-value, test-statistic, etc.) were calculated using the “multi-group comparison” option of the program. Through statistical analysis, differentially expressed genes were determined from a cutoff value (p-value < 0.05, corrected p-value of FDR < 0.05 and absolute value of fold change > 1.5) from pairwise comparison of normalized FPKM values between samples. Gene ontology (GO) enrichment analysis was performed using the PANTHER overrepresentation test (PANTHER version 104) (Mi et al., 2013, 2016). Arabidopsis thaliana was selected as a reference organism with default settings and Bonferroni correction for multiple testing was used (p < 0.05).
Statistical Analysis
All statistical comparisons between variants were determined by ANOVA (analysis of variance) and least significant differences (LSD) between variants were calculated using Statistix 8.1 computation software. Statistically significant mean values were denoted as ∗ (p-value ≤ 0.05).
Results
Sequence and Phylogenetic Analysis of PaMBF1c
The Polytrichastrum alpinum DNA sequence encoding multi-protein bridging factor 1c (MBF1c) protein was retrieved from our unpublished transcriptome data, based on its sequence homology with AtMBF1c. The gene was designated PaMBF1c and its sequence was submitted to GenBank (Accession number, KM978992). The total length of the 432 nucleotide coding sequence comprise of 143 deduced amino acids with an estimated molecular mass of 15.7 kDa and an isoelectric point of 10.08 predicted by ExPasy bioinformatics tools for protein structure analysis5. It contains two distinctive conserved domains – an MBF1 domain at the N-terminal region and a helix-turn-helix (HTH) domain at the C-terminal region (Figure 1A). PaMBF1c shares 86% identity with its homolog from Physcomitrella patens (XP_001771731), 64% with Medicago truncatula (AES76734), 66% with Arabidopsis thaliana (NP_189093), 59% with Triticum aestivum (ACU43593), and 59% identity with Oryza sativa (NP_001057974). Sequence alignment analysis of PaMBF1c also suggests the presence of glutamic acid (E) at the 115th amino acid position in the HTH domain (Figure 1A). This particular amino acid is reportedly conserved across the plant species and is essential for the binding to TATA-box binding protein (Liu et al., 2007).
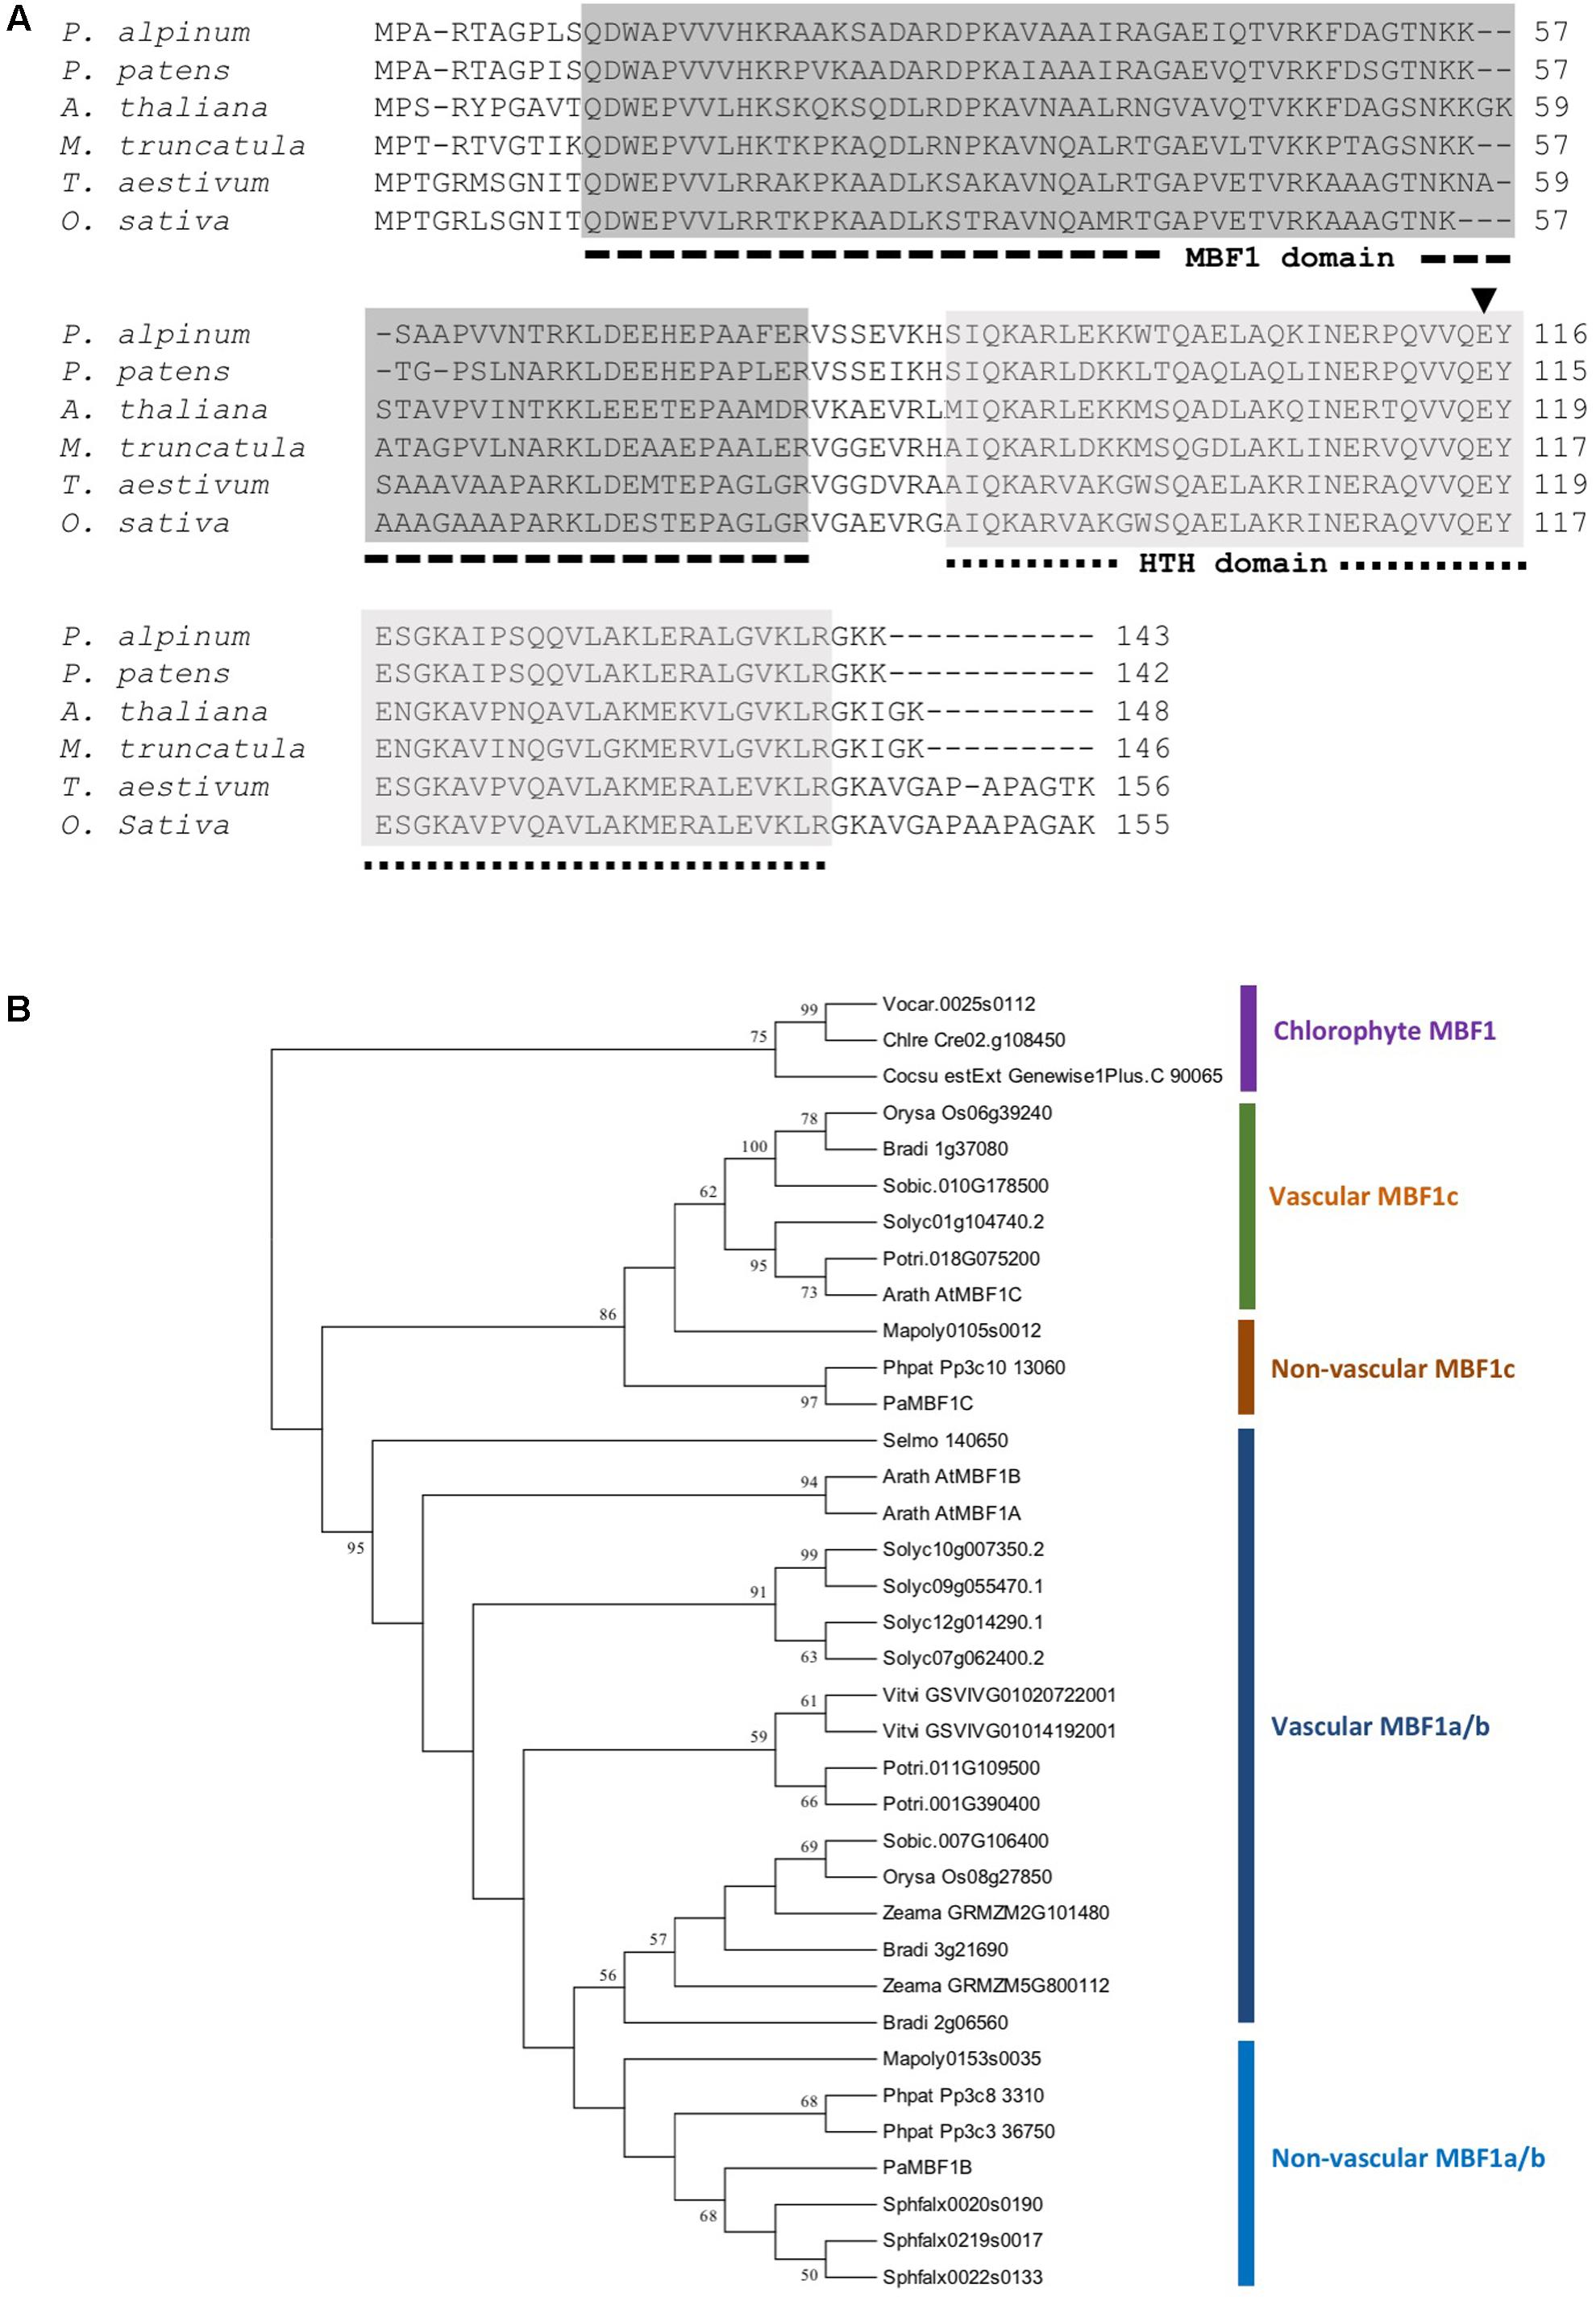
FIGURE 1. Sequence alignment and phylogenetic analysis of PaMBF1c. (A) Amino acid sequences of PaMBF1c protein (AJG41867) and homologs from Physcomitrella patens (XP_001771731), Oryza sativa (NP_001057974), Medicago truncatula (AES76734), Triticum aestivum (ACU43593), and Arabidopsis thaliana (NP_189093) were used for amino acid sequence alignment. The dotted lines below the sequence alignment indicate multiprotein bridging factor 1 (MBF1) domain and helix-turn-helix (HTH) domain. In the HTH domain, the amino acid residue glutamic acid (E) (arrow head) is conserved among all plant MBF1 proteins. (B) Phylogenetic tree of MBF1 proteins from diverse species. MBF1 proteins from mosses (Polytrichastrum alpinum; Phpat, Physcomitrella patens; Sphfalx, Sphagnum fallax; Mapoly, Marchantia polymorpha), Lycophyte (Selmo, Selaginella moellendorffii), algae (Chlre, Chlamydomonas reinhardtii; Cocsu, Coccomyxa subellipsoidea; Vocar, Volvox carteri), monocots (Zeama, Zea mays; Bradi, Brachypodium distachyon; Orysa, Oryza sativa; Sobic, Sorghum bicolor), and dicots (Arath, Arabidopsis thaliana; Vitvi, Vitis vinifera; Solyc, Solanum lycopersicum; Potri, Populus trichocarpa) were included. The phylogenetic tree was constructed using the Neighbor-Joining method.
The PaMBF1c protein sequence was queried against proteome datasets of various plants and chlorophytes in Phytozome6 to better understand the phylogenetic relations of MBF1 family proteins in plants. The phylogenetic analysis demonstrated a clear divergence of MBF1c proteins from other MBF1 family proteins (MBF1a/b) (Figure 1B). Interestingly, algae have only one MBF1 gene while most land plants contain at least two types MBF1 genes (Figure 1B), suggesting a gene duplication event early in the evolution of land plant. Within the MBF1c clade, MBF1c orthologs of all non-vascular plant species were clustered together away from those of vascular plant (Figure 1B) implying MBF1c differentiation among land plants.
Expression of PaMBF1c Gene in P. alpinum under Abiotic Stress
A number of MBF1 group genes in various species were reported to be differentially induced by various abiotic stresses (Rizhsky et al., 2002; Tsuda and Yamazaki, 2004; Kim et al., 2007). We examined PaMBF1c transcript abundance under salt, osmotic, and heat stress conditions in P. alpinum. To this end, quantitative real-time PCR (qRT-PCR) analysis was carried out using RNA isolated from P. alpinum gametophores treated with NaCl (75 mM or 150 mM for 6 h), mannitol (150 or 300 mM for 6 h), or high temperature (37 or 42°C for 2 h). The results revealed that PaMBF1c transcript levels were increased in response to various abiotic stress treatments (Figure 2); thus, we concluded that PaMBF1c is a heat, salt, and osmotic stress-responsive gene in P. alpinum.
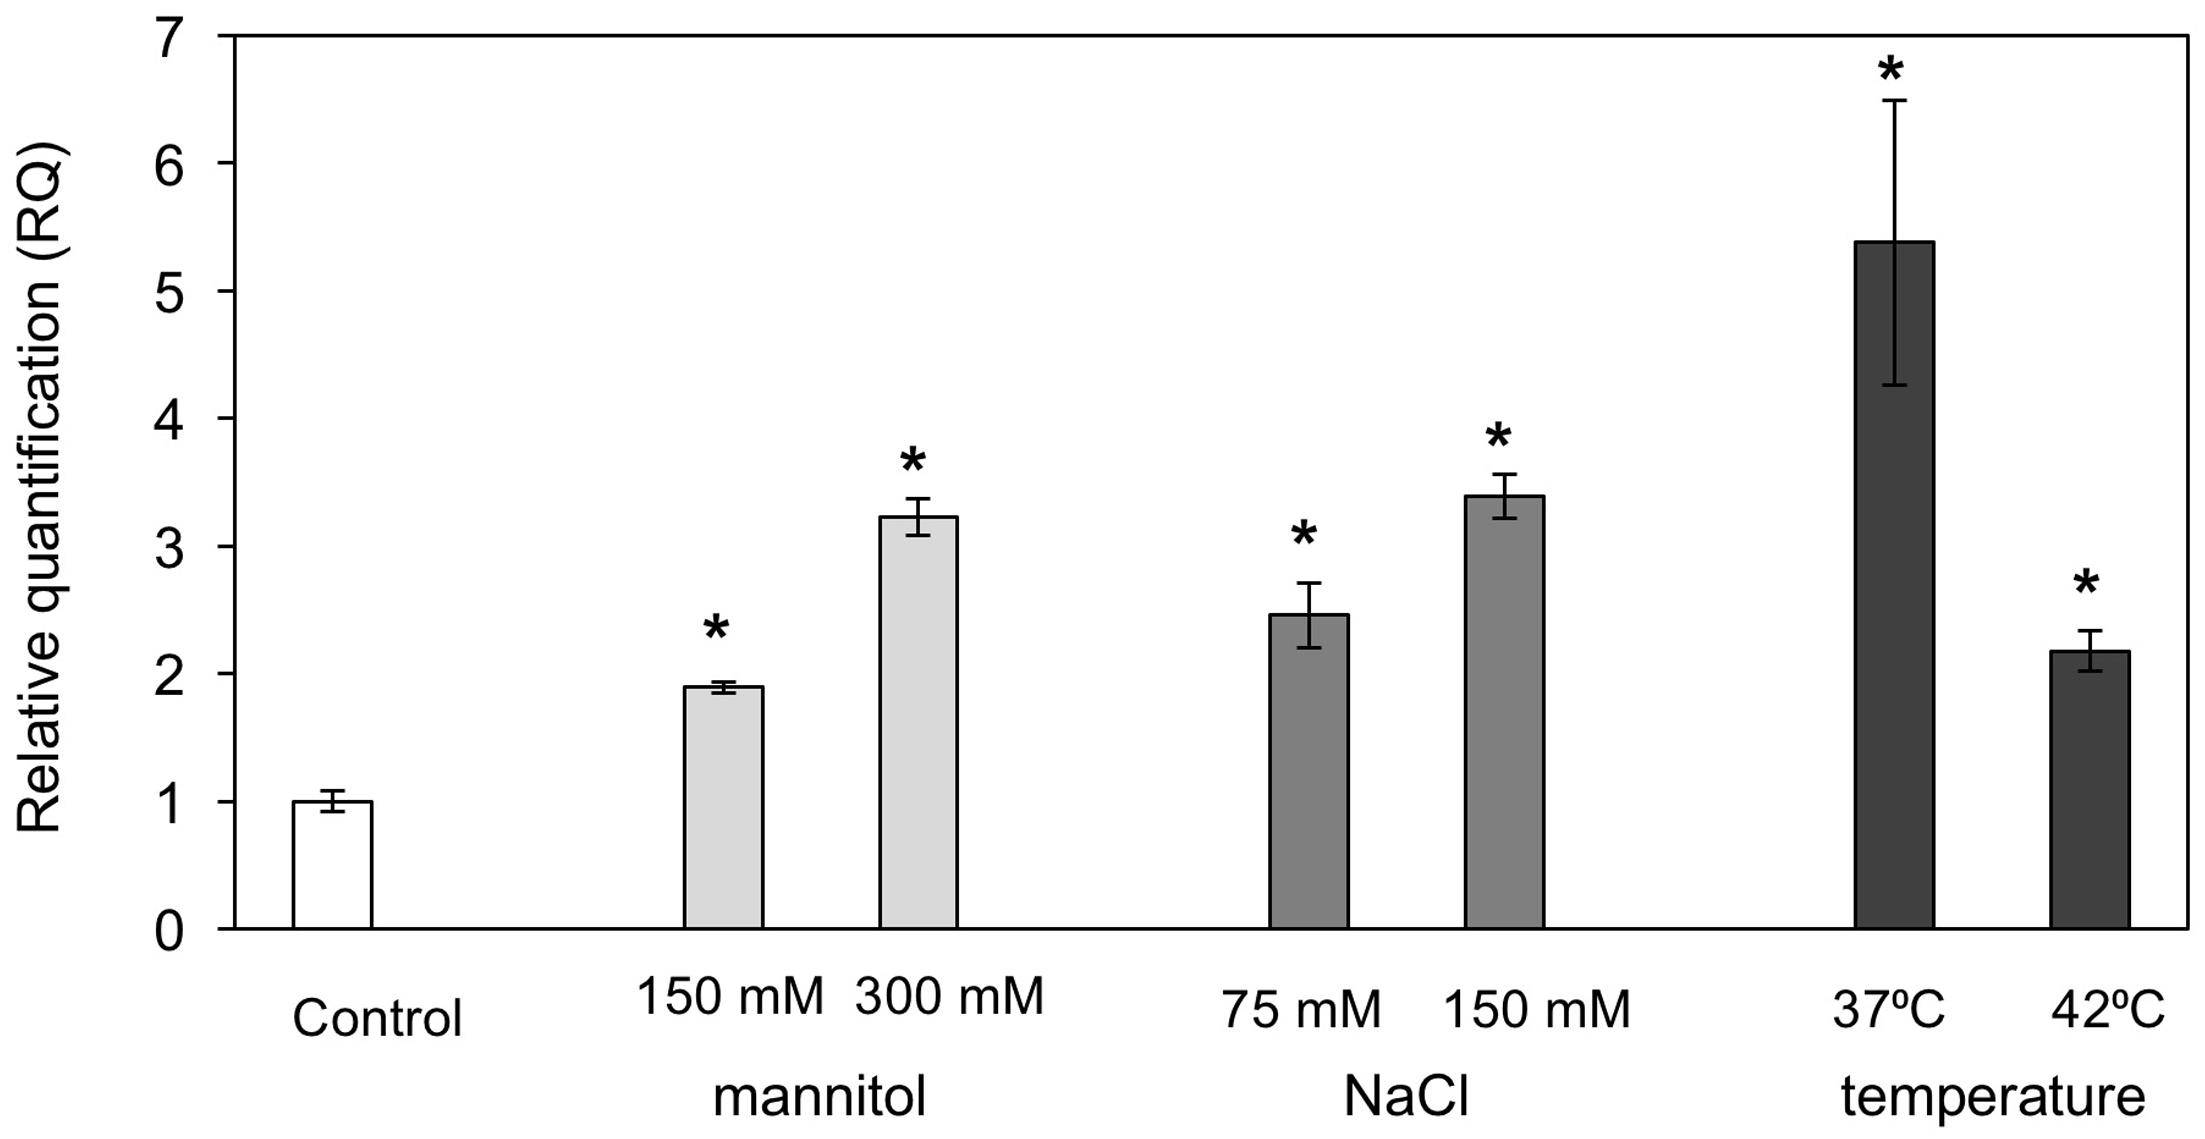
FIGURE 2. Expression of PaMBF1c in P. alpinum under various abiotic stress conditions. The PaMBF1c expression levels were measured by quantitative real-time PCR with total RNA from P. alpinum gametophores under osmotic stress (150 mM or 300 mM mannitol for 6 h), salt stress (75 or 150 mM NaCl for 6 h) or heat stress (37 or 42°C for 2 h). The P. alpinum tubulin gene was used as an internal control for normalization. The expression level of PaMBF1c grown on normal BCD was used as a control (calibrator for quantification) and was assumed as 1. Error bars represents standard deviation of means (n = 3). Asterisks indicate statistical significance in LSD test (p < 0.05).
Generation and Growth Phenotype of PaMBF1c Overexpressing Lines
To further investigate the functional roles of PaMBF1c in plants, we generated transgenic lines overexpressing the PaMBF1c gene under control of the 35S cauliflower mosaic virus promoter (35S:PaMBF1c). Using hygromycin resistance selection and the presence of the 35S:PaMBF1c transgene, we selected stable homozygous transgenic lines for 35S:PaMBF1c in the T4 generation (hereafter referred to as PaMBF1c-OE lines, where OE stands for overexpressing). Semi-quantitative RT-PCR analysis for PaMBF1c transcripts indeed confirmed that PaMBF1c-OE lines overexpressed PaMBF1c, as PaMBF1c transcripts were highly accumulated in transgenic plants (Figure 3A). With confirmed lines, we examined the growth and development of PaMBF1c-OE plants. Two-week old PaMBF1c-OE plants displayed better growth and development than WT plants under normal growth conditions. Fresh weight of 2-week-old transgenic plants was about 16–17 mg/seedling while that of WT was about 11 mg/seedling (Figures 3B,C). In addition, PaMBF1c-OE lines bolted 1–2 days earlier than did WT (Figures 3D,E).
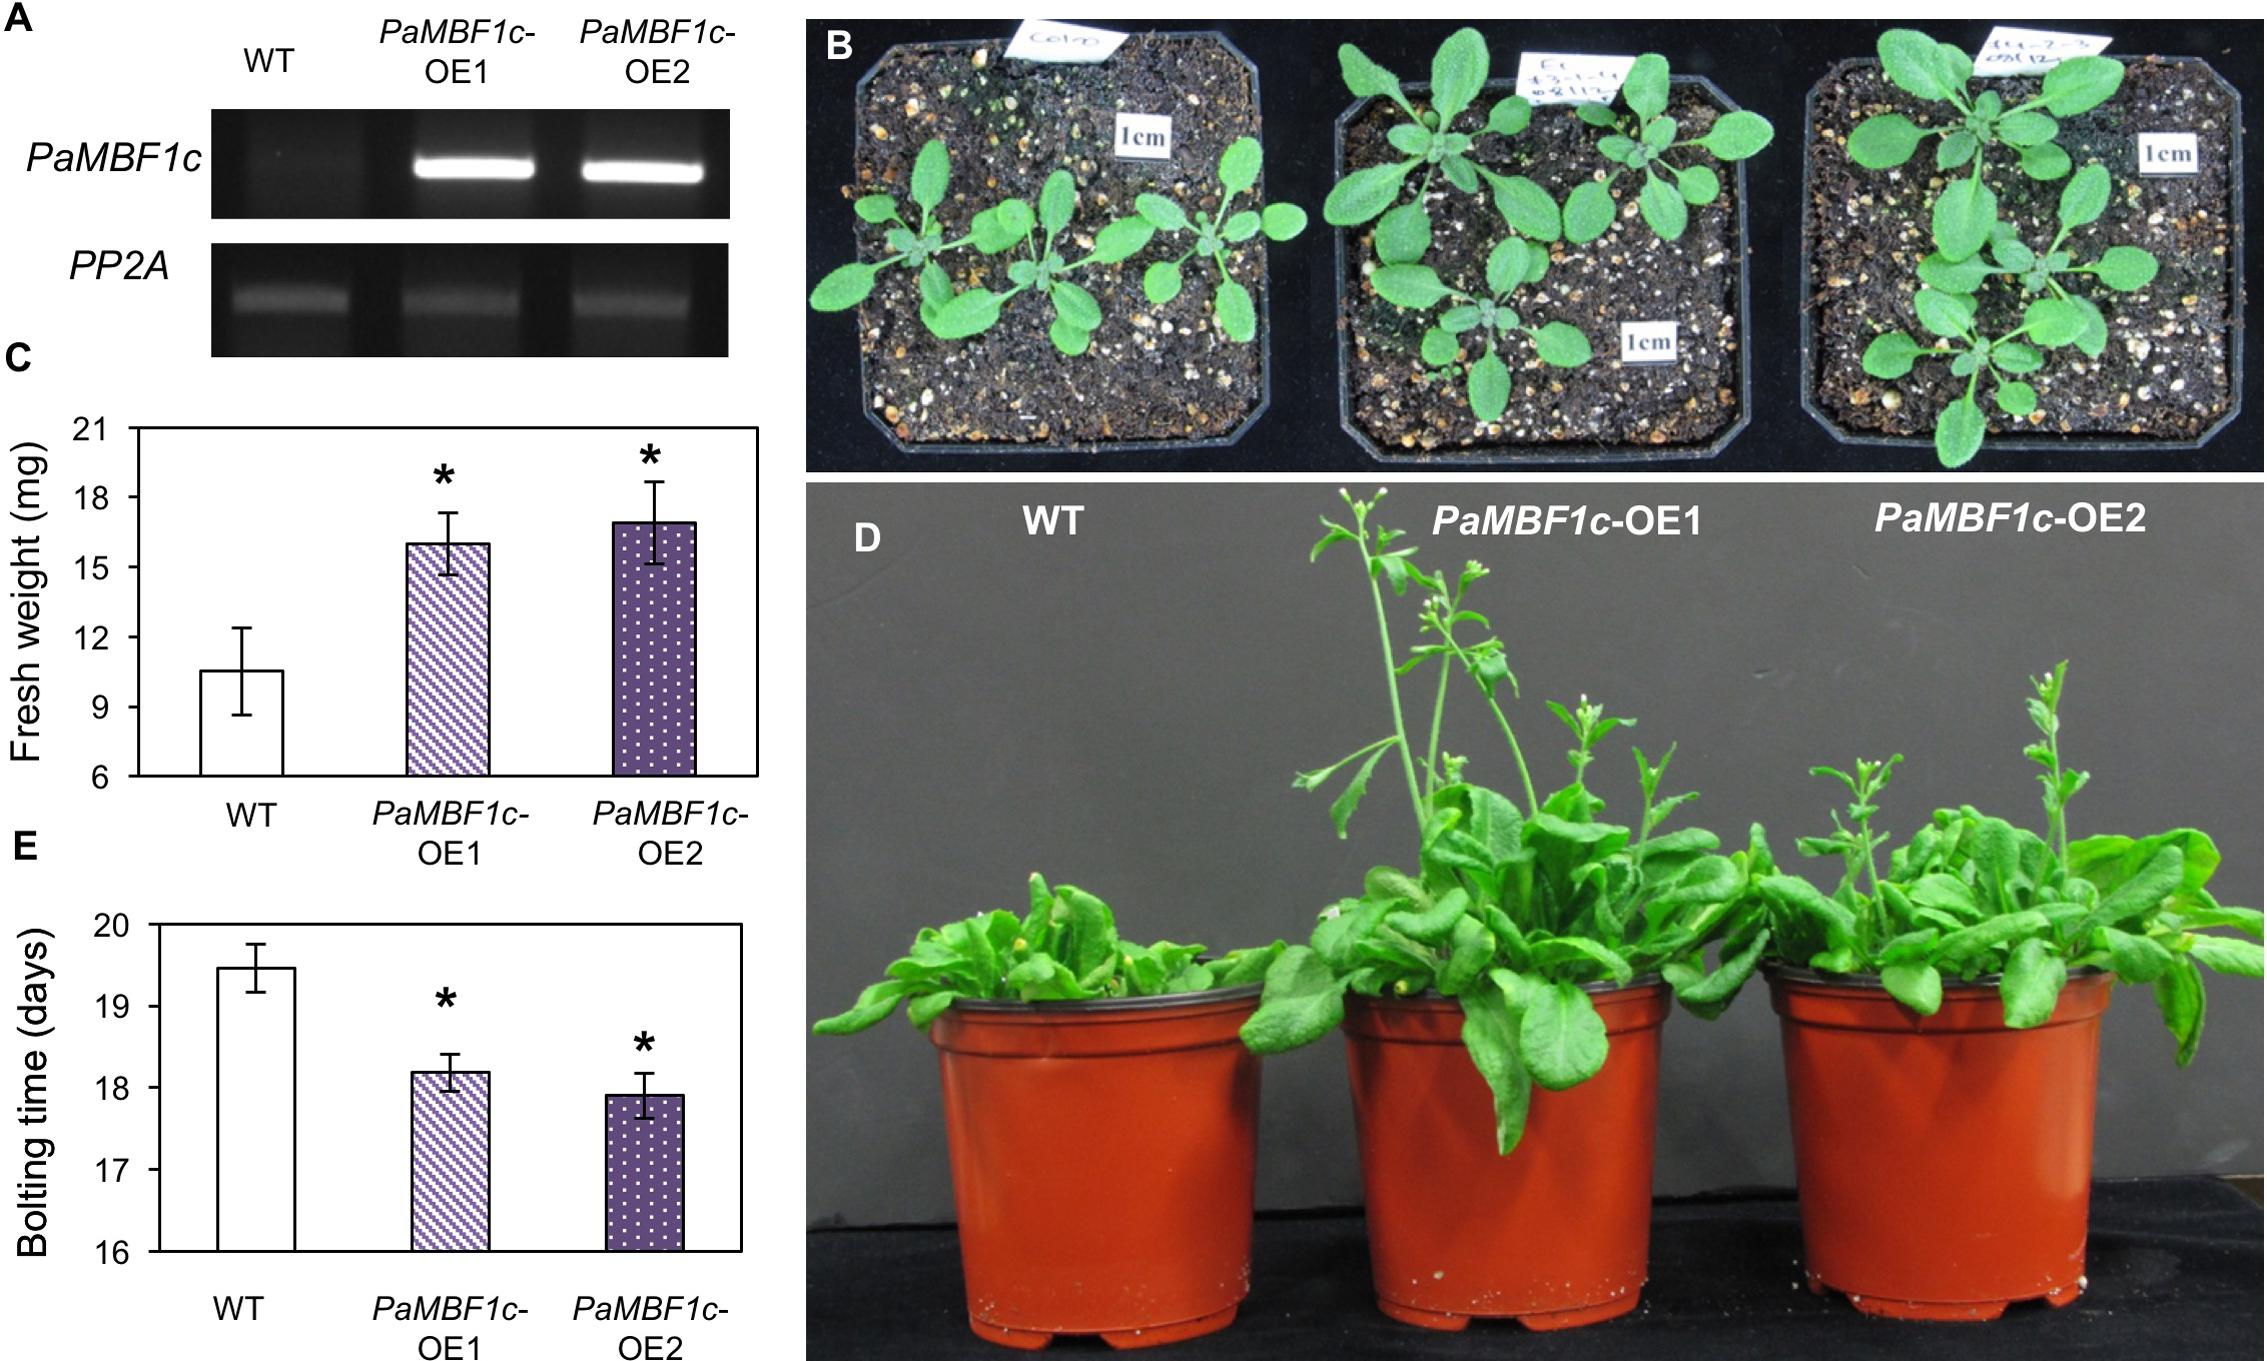
FIGURE 3. Growth and development of PaMBF1c-OE lines. (A) Higher accumulation of transgene transcripts in PaMBF1c-OE lines were confirmed by semi-quantitative RT-PCR. (B) The size of PaMBF1c-OE lines was bigger than WT. Pictures were taken 12 days after germination. (C) Measurement of fresh weights per seedling revealed a better growth of PaMBF1c-OE lines in comparison to WT. (D,E) PaMBF1c-OE lines bolted earlier than WT. Error bars represents standard deviation of means (n = 20). Asterisks indicate statistical significance in LSD test (p < 0.05).
Evaluation of PaMBF1c Overexpressing Lines under Various Abiotic Stress Conditions
To study the responses of PaMBF1c-OE plants to abiotic stress conditions, two PaMBF1c-OE lines from two independent transgenic events were subjected to different stress treatments. Germination of each line was tested on MS medium containing different kinds of stress agents: salt stress (200 mM NaCl), ionic stress (15 mM LiCl) or osmotic stress (200 mM mannitol). On the control medium, all lines germinated with percentages of 95–100% after 2–3 days of planting (Supplementary Figure S1). On mediums supplemented with 200 mM NaCl, the germination ratio of WT was decreased to 35.8%, whereas PaMBF1c-OE lines displayed 72.9–86.4% germination ratios (Figure 4A). Similarly, PaMBF1c-OE lines displayed 94–94.5% germination ratios on 15 mM LiCl MS medium, whereas WT germination ratio was reduced to 62.2% (Figure 4A). In the medium containing 200 mM mannitol, PaMBF1c-OE lines displayed slightly better germination than in WT (Figure 4A). Taken together, the results showed that PaMBF1c-OE lines germinate better than WT under salt, ionic, and osmotic stress.
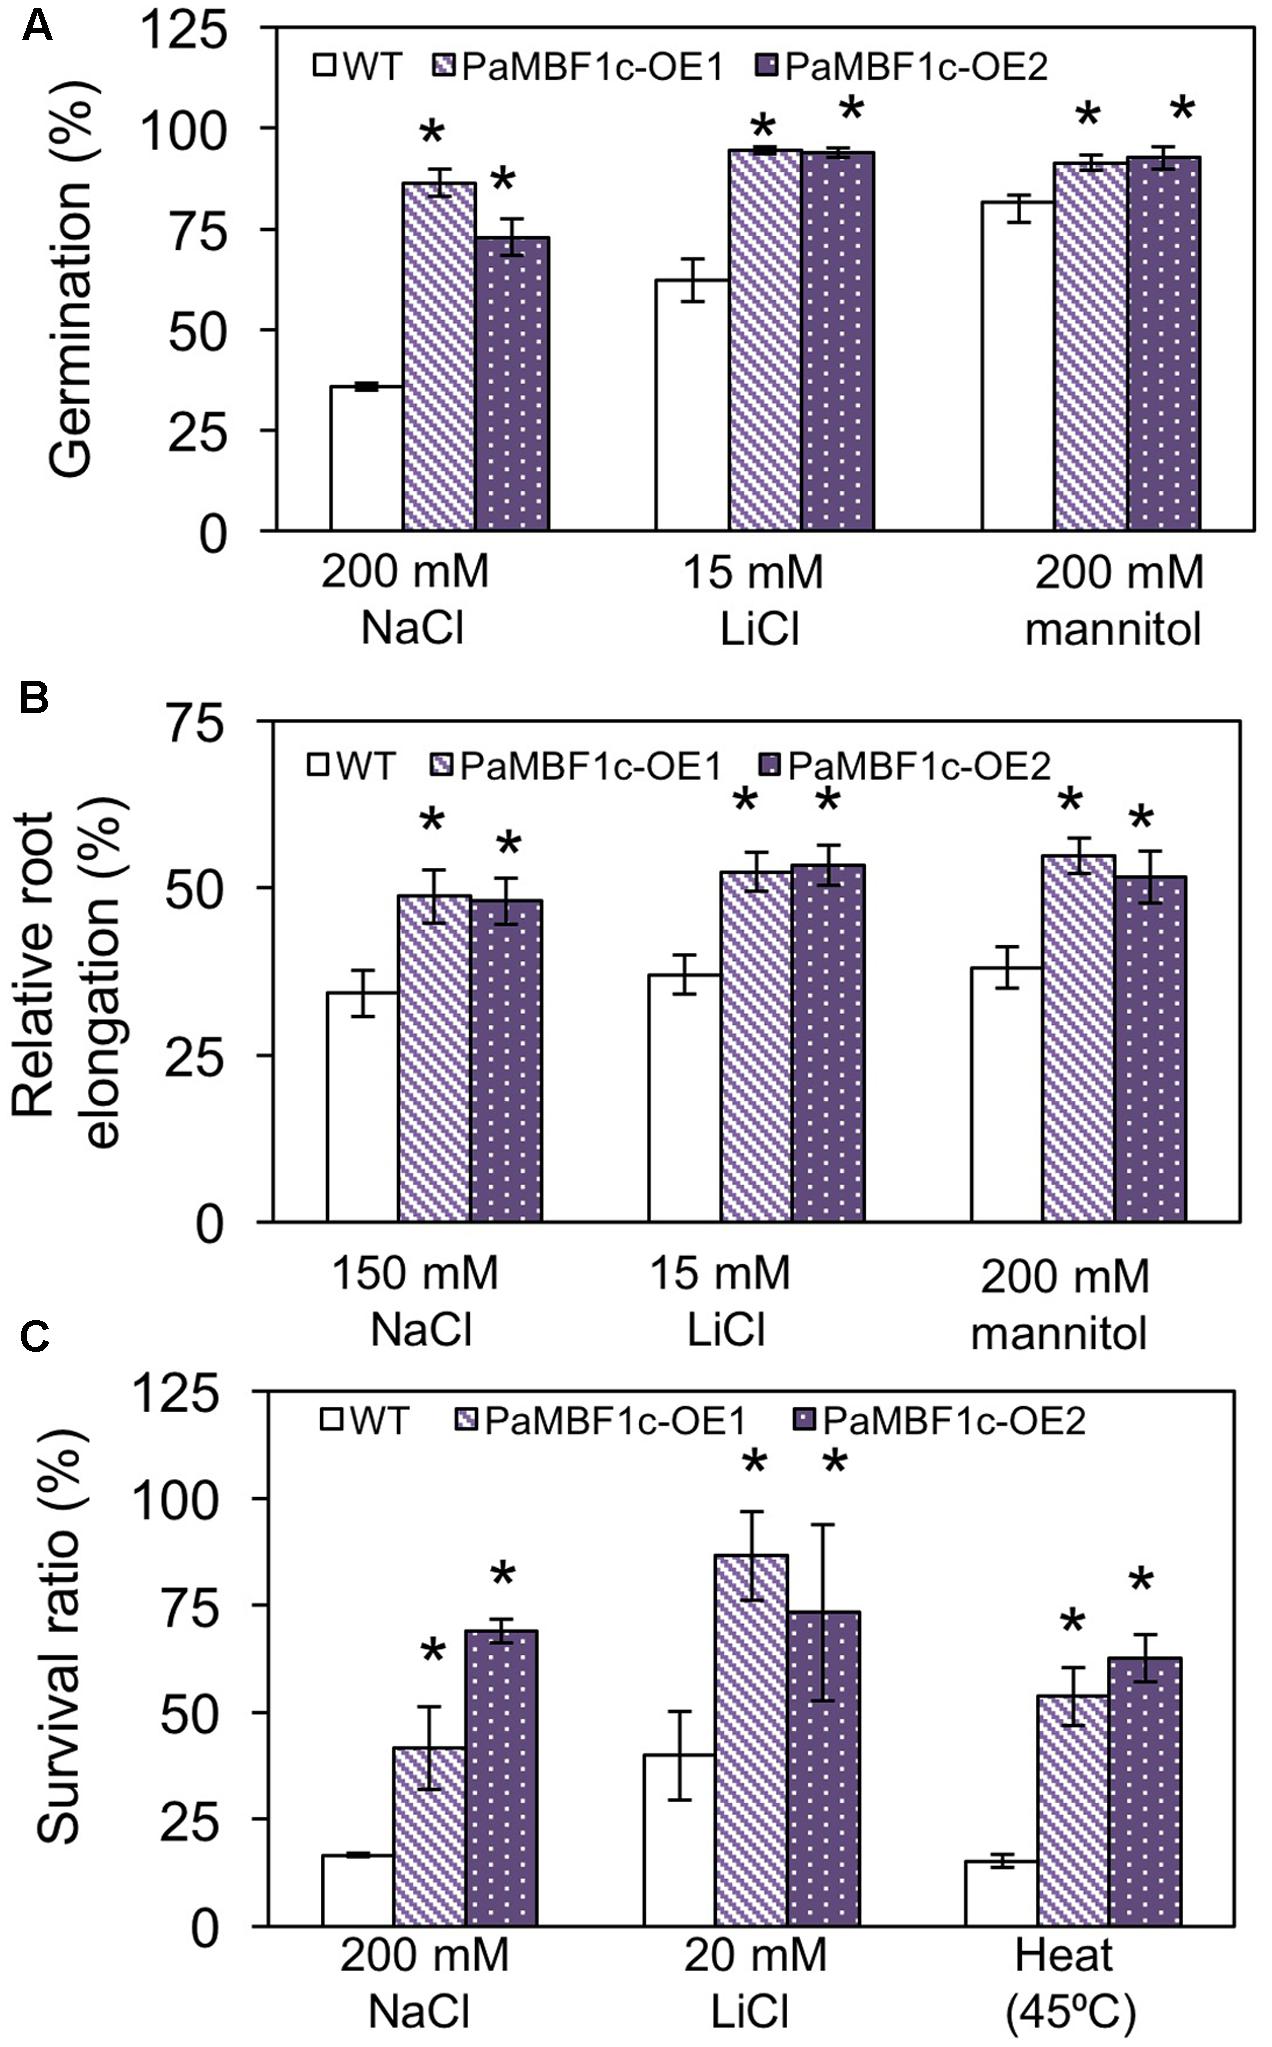
FIGURE 4. Evaluation of PaMBF1c-OE lines under different abiotic stress conditions. (A) PaMBF1c-OE lines germinated better than did WT under salt stress (200 mM NaCl), ionic stress (15 mM LiCl), and osmotic stress (200 mM mannitol). The number of germinated seeds was expressed as a percentage of total number of seeds planted (n ≥ 100). Radicle emergence was considered germination and the germination was scored after 4 days of planting. (B) Roots of PaMBF1c-OE lines elongated longer than that of WT under salt stress (150 mM NaCl), ionic stress (15 mM LiCl), and osmotic stress (200 mM mannitol). Root growth was scored after 6 days of transfer of seedlings from normal medium to stress medium. Root elongation of seedlings under stress conditions was expressed as a percentage of each stress control grown on normal MS medium after 6 days of transfer (n ≥ 10). (C) PaMBF1c-OE lines survived better than WT under salt stress (200 mM NaCl), ionic stress (20 mM LiCl) and heat stress (45°C for 60 min) (n ≥ 15). Error bars represents standard deviation of the mean values of three independent experiments. Asterisks indicate statistical significance in LSD test (p < 0.05).
Root growth is affected by various stress conditions and is often considered an index for stress sensitivity (Lee et al., 2006). Thus, we examined levels of stress tolerance by analyzing root growth of PaMBF1c-OE lines. Similarly sized seedlings (3- to 4-day-old) grown under normal condition were transferred to MS medium for salt stress (150 mM NaCl), ionic stress (15 mM LiCl), or osmotic stress (200 mM mannitol); and root elongation was measured 6 days after transfer. All lines showed similar root lengths in the control MS media (Supplementary Figure S2); however, relative root elongation in PaMBF1c-OE lines was significantly greater in the presence of 150 mM NaCl (48–48.7% vs. 34.2%), 200 mM mannitol (51.5–54.8% vs. 38.1%), or 15 mM LiCl (52.3–53.3% vs. 37%) when compared to WT (Figure 4B). Additionally, seedling survival was examined under stress conditions. Three- to four-day-old seedlings grown under normal conditions were transferred to MS medium supplemented with 200 mM NaCl for salt stress or 20 mM LiCl for ionic stress. For heat stress, 8-day-old seedlings grown on MS plates were heat treated at 45°C (Figure 4C and Supplementary Figures S3A,B). The PaMBF1c-OE lines showed significantly better survival than did WT under the presence of 200 mM NaCl (41–69% vs. 16.6%), 20 mM LiCl (73–86% vs. 40%), or heat (53–62% vs. 15%) (Figure 4C and Supplementary Figures S3C–E). We also investigated responses to cold stress in PaMBF1c-OE lines by measuring ion leakage after freezing stress treatment. At -6°C, both WT and PaMBF1c-OE showed similar ion leakage levels (Supplementary Figure S4); however, PaMBF1c-OE lines showed lower ion leakage at -9 and -12°C than WT, suggesting enhanced freezing tolerance in PaMBF1c-OE lines (Supplementary Figure S4).
Examination of Salt Stress Tolerance in PaMBF1c Overexpressing Lines
We examined in detail the tolerance phenotypes of PaMBF1c-OE under salt stress by analyzing chlorophyll content, lipid peroxidation level, and anthocyanin accumulation. Chlorophyll (Chl) degradation is among the manifestations caused by salt and osmotic stress (Claeys et al., 2014; Alavilli et al., 2016). To further examine the effect of salt stress, we measured Chl content in WT and PaMBF1c-OE lines with or without salt stress. No notable differences were observed between WT and PaMBF1c-OE grown under control condition (Figures 5A,B); however, stress treatment with 75 mM or 150 mM NaCl showed that PaMBF1c-OE lines maintained higher Chl content than that of WT, as also evidenced by visual phenotypes (i.e., leaf bleaching) (Figures 5A,B). Abiotic stresses usually lead to lipid peroxidation of cell membranes which can cause irreversible damage to its functionality. MDA is considered an indicator of lipid peroxidation level (Heath and Packer, 1968). After salt stress (120 mM NaCl), the MDA content of PaMBF1c-OE lines was significantly lower in than that of WT, which suggests lower lipid peroxidation in PaMBF1c-OE (Figure 5C). Anthocyanin accumulation is known to be associated with improved drought and salt stress tolerance (Oh et al., 2011; Nakabayashi et al., 2014). Accordingly, 10-day-old PaMBF1c-OE lines grown under salt stress medium (150 mM NaCl) exhibited higher anthocyanin accumulation than WT (Figure 5D and Supplementary Figure S5). Taken all together, these results clearly demonstrated the higher salt-stress tolerance of PaMBF1c-OE lines than WT.
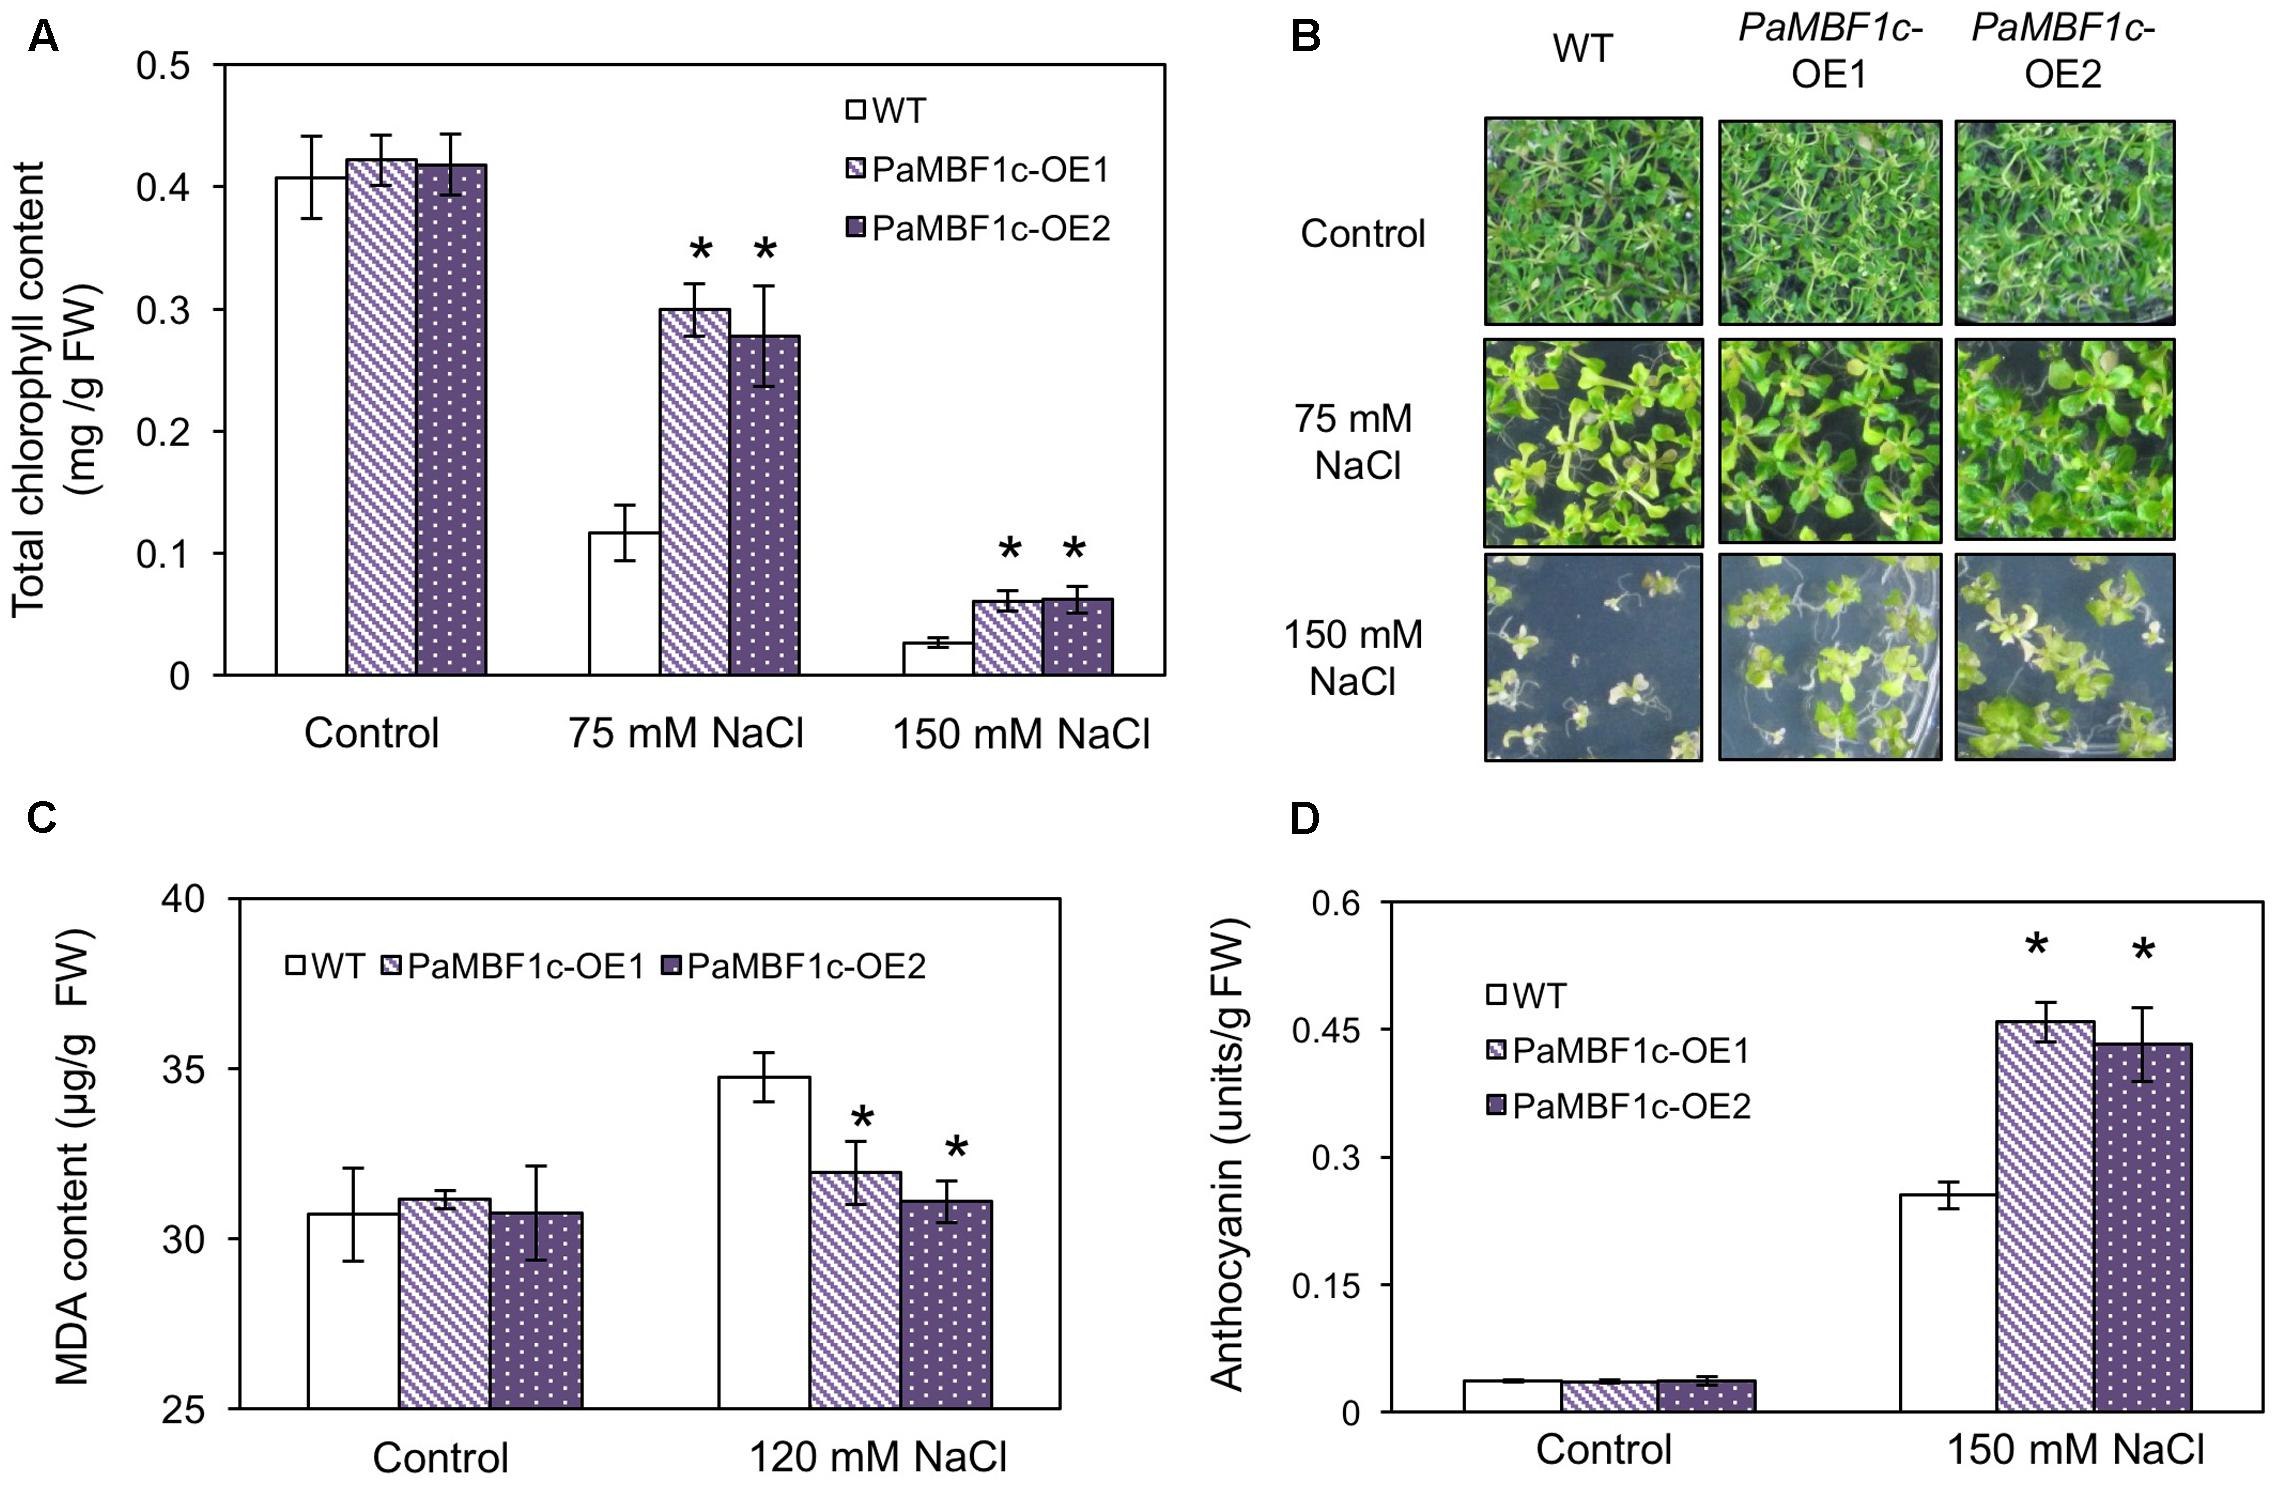
FIGURE 5. Chlorophyll, malondialdehyde (MDA), and anthocyanin levels in PaMBF1c-OE lines. (A,B) PaMBF1c-OE lines retained more chlorophyll content than WT at 75 and 150 mM NaCl. (C) PaMBF1c-OE lines showed lower MDA level than WT. MDA levels were examined with 21-day-old seedlings grown on MS plates with 0 or 120 mM NaCl. (D) PaMBF1c-OE lines accumulated higher amount of anthocyanin than WT. Anthocyanin content was measured with 10-day-old seedlings grown on MS plates with 0 or 150 mM NaCl. Error bars represents standard deviation of mean values of at least three independent experiments (n = 25 seedlings per each treatment). Asterisks indicate statistical significance in LSD test (p < 0.05).
Comparison of Stress Tolerance between PaMBF1c and AtMBF1c Overexpressing Lines
AtMBF1c overexpression in Arabidopsis resulted in improved heat and osmotic stress tolerance (Suzuki et al., 2005). AtMBF1c-OE lines appeared to exhibit tolerance at only low levels of salt stress (50 mM NaCl) when compared to WT (Suzuki et al., 2005). Thus, we compared the stress tolerance phenotypes of our PaMBF1c-OE lines and the AtMBF1c-OE lines under our experimental conditions. We first assessed heat tolerance with two independent lines for each overexpressor. The hypocotyl elongation assay makes use of the characteristic heat inhibition of hypocotyl elongation (Hong and Vierling, 2000). PaMBF1c-OE lines showed higher hypocotyl elongation than did WT at both 41 and 43°C (Figure 6A), suggesting hyposensitivity to heat stress in PaMBF1c-OE. Similarly, AtMBF1c-OE lines displayed higher hypocotyl elongation when compared to WT in agreement with previous reports (Suzuki et al., 2005). Hypocotyl lengths of both OE lines were comparable after heat treatment suggesting that both PaMBF1c and AtMBF1c have similar levels of increased heat tolerance (Figure 6A).
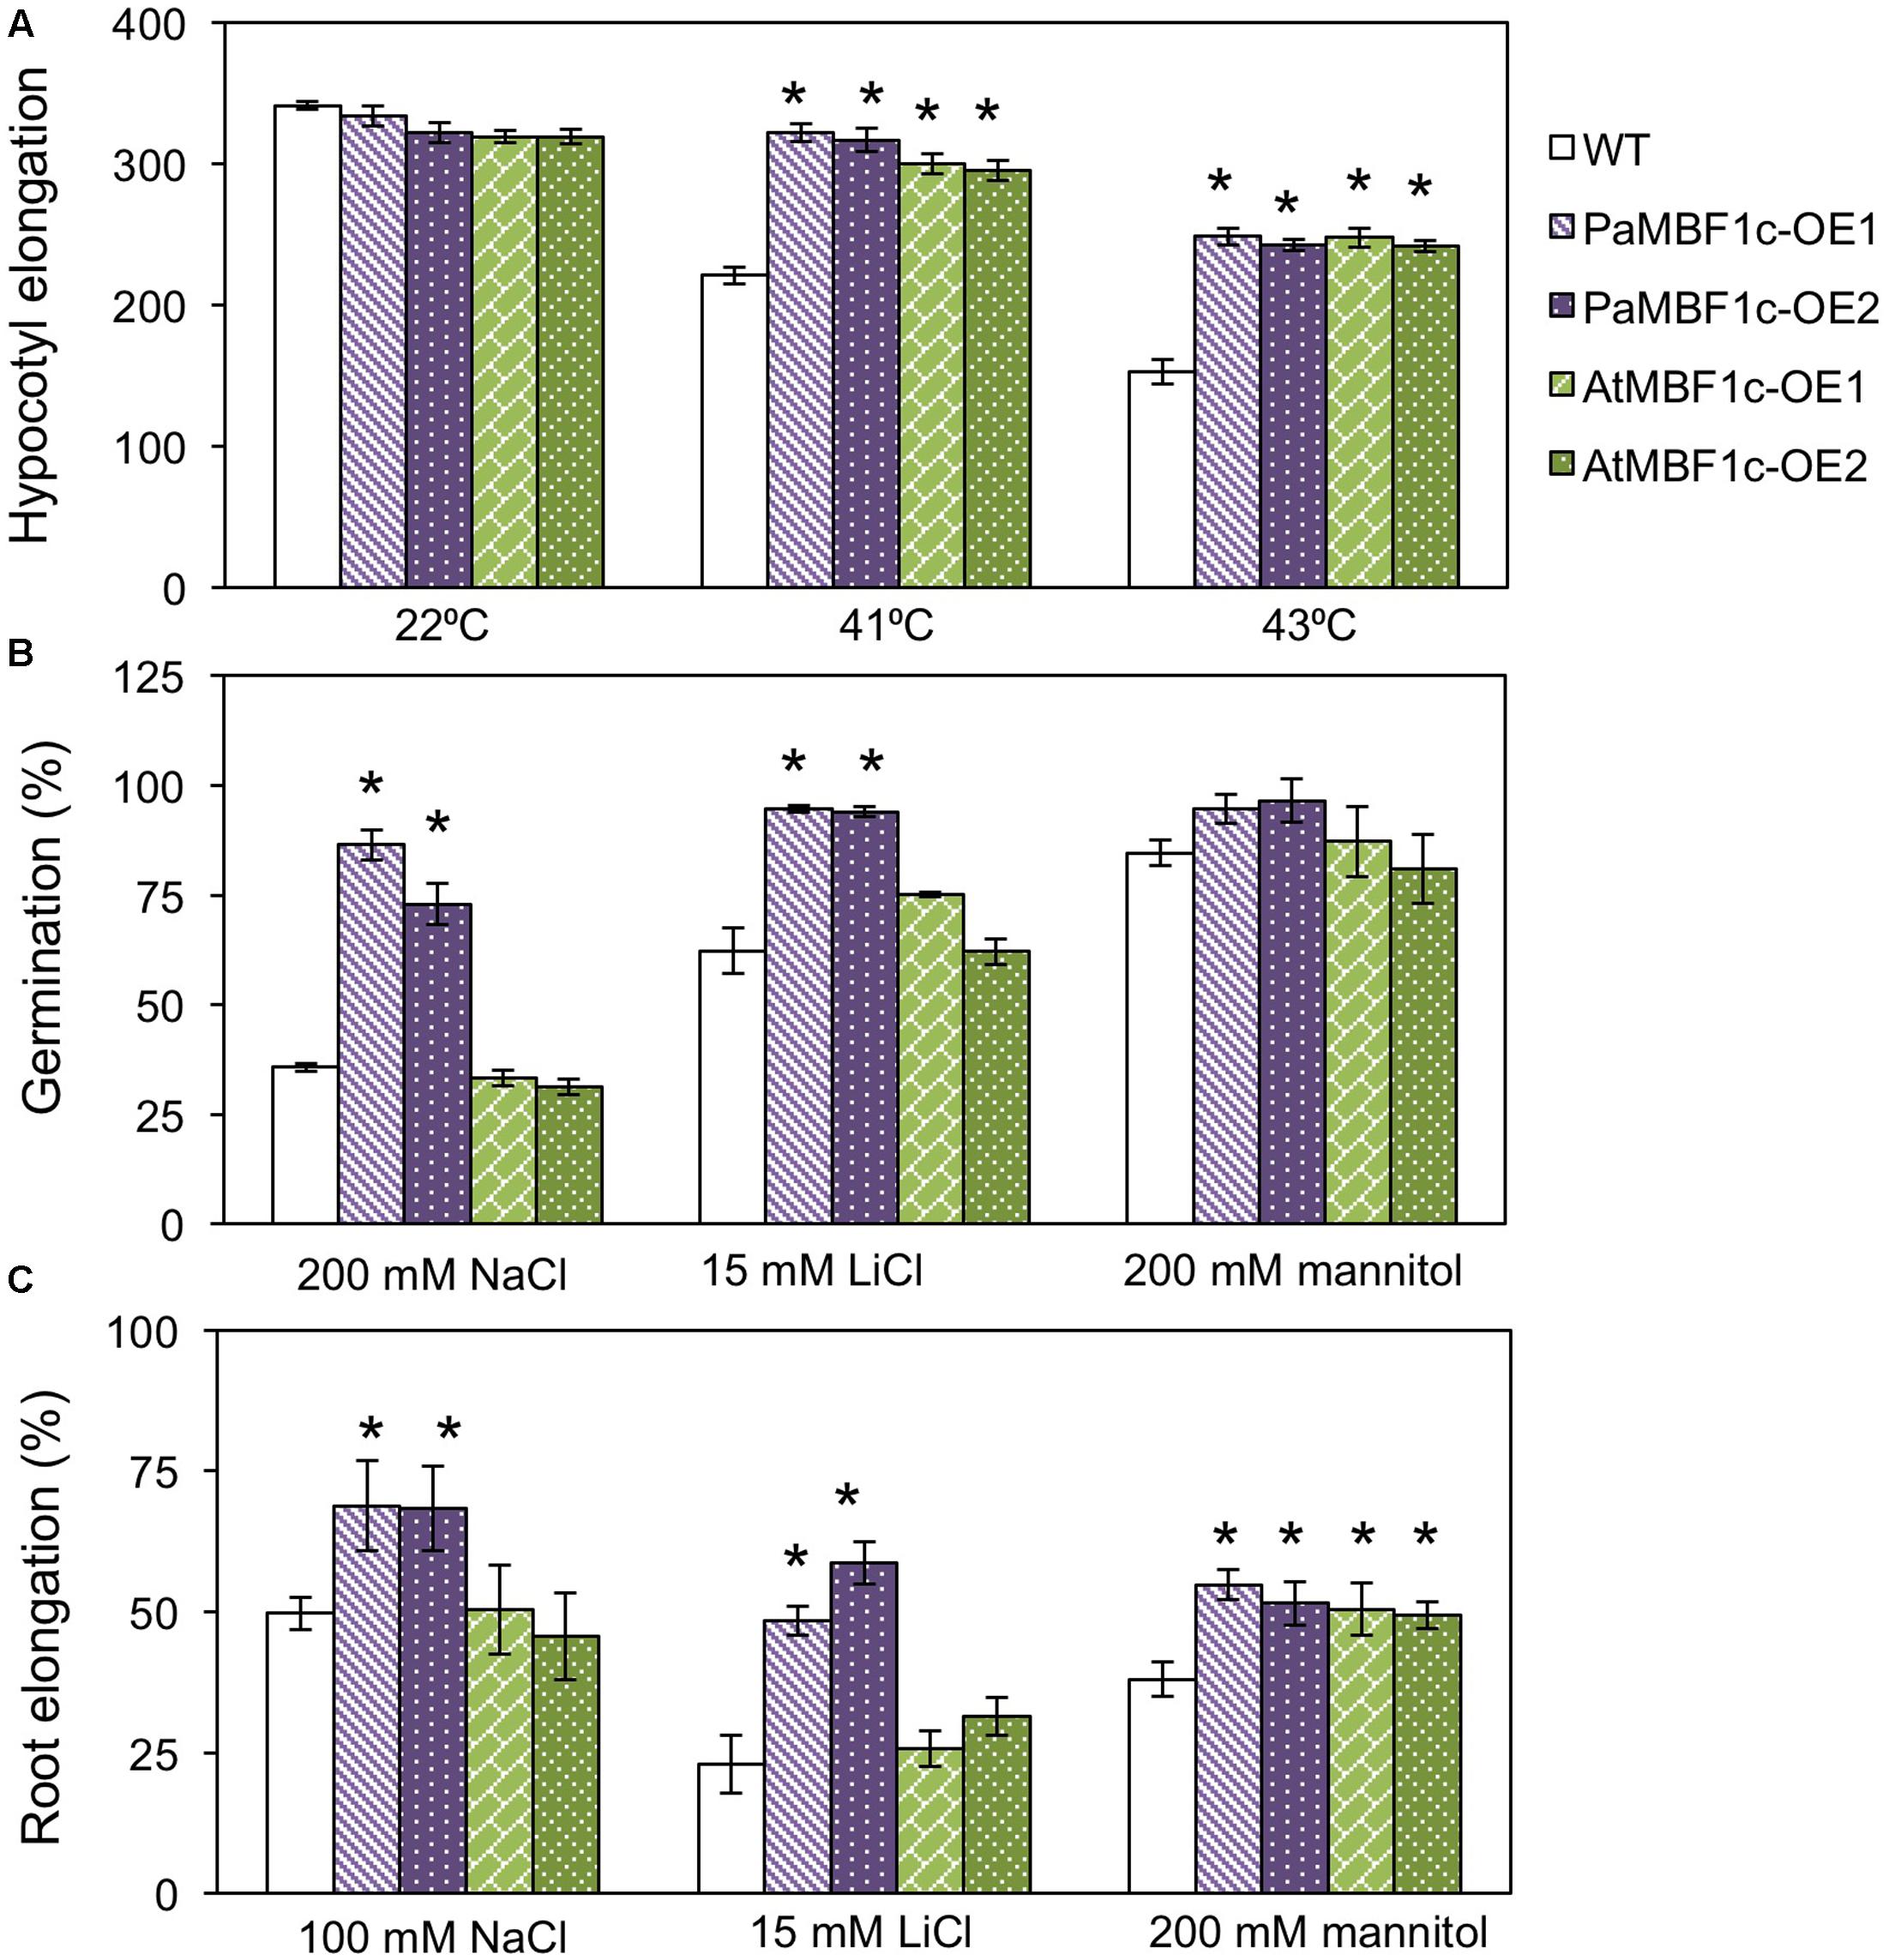
FIGURE 6. Comparison of stress tolerance between PaMBF1c-OE lines and AtMBF1c-OE lines under various abiotic stress conditions. (A) Comparison of hypocotyl elongation between PaMBF1c-OE and AtMBF1c-OE lines under heat stress. Both OE lines showed similar levels of heat tolerance but higher than WT (n ≥ 10). (B) Comparison of germination between PaMBF1c-OE and AtMBF1c-OE lines under salt stress (200 mM NaCl), ionic stress (15 mM LiCl), and osmotic stress (200 mM mannitol). PaMBF1c-OE displayed higher germination ratio than WT and AtMBF1c-OE lines under salt and ionic stresses (n ≥ 100). (C) Comparison of root elongation between PaMBF1c-OE and AtMBF1c-OE lines under salt stress (100 mM NaCl), ionic stress (15 mM LiCl), and osmotic stress (200 mM mannitol). PaMBF1c-OE showed higher root elongation than AtMBF1c-OE and WT under salt and ionic stresses (n ≥ 10). Error bars represents standard deviation of the mean values of three independent experiments. Asterisks indicate statistical significance in LSD test (p < 0.05).
We further extended the comparison to other types of stress. We treated PaMBF1c-OE and AtMBF1c-OE lines with salt (100–200 mM NaCl), ionic (15 mM LiCl) and osmotic stress (200 mM mannitol) at germination and post-germination stages. Under salt stress, PaMBF1c-OE lines consistently displayed higher germination ratios than WT, whereas AtMBF1c-OE lines germinated at almost the same ratio as WT (Figure 6B). In addition, the germination of PaMBF1c-OE lines was better than those of WT and AtMBF1c-OE lines under ionic stress (15 mM LiCl) (Figure 6B). However, germination of each line at osmotic stress (200 and 400 mM mannitol) were largely comparable, with one PaMBF1c-OE line demonstrating a slightly higher germination ratio than the other genotypes (Figure 6B and Supplementary Figure S6). These results suggest that PaMBF1c-OE performs better in terms of germination than WT or even AtMBF1c-OE, particularly under salt and ionic stress.
Root growth comparisons also revealed that the root of PaMBF1c-OE lines grew longer under salt and ionic stresses than that of both WT and AtMBF1c-OE (Figure 6C). AtMBF1c-OE lines exhibited root growth similar to that of WT under salt and ionic stresses (Figure 6C). Under osmotic stress (200 mM mannitol), root elongation was similar between PaMBF1-OE and AtMBF1c-OE lines but was significantly enhanced in comparison with WT (Figure 6C). Improved osmotic stress tolerance in the AtMBF1c-OE line was consistent with previous reports (Suzuki et al., 2005). These results revealed that except for germination under osmotic stress, PaMBF1c-OE lines showed enhanced tolerance at both germination and post-germination stage under all tested conditions including stress conditions in which AtMBF1c did not show increased tolerance. Conclusively, these results implicate PaMBF1c as an MBF1c allele which affords better coping against multiple stresses than AtMBF1c.
Transcriptome Analysis of PaMBF1c Overexpressing Lines under Salt Stress Conditions
In order to understand the gene expression patterns of PaMBF1c-OE lines in salt stress response and identify genes important for PaMBF1c-specific stress tolerance, we carried out RNA-Seq analysis. After sequencing with total RNA from salt-treated samples, we first defined salt-regulated genes in WT as the genes with statistically altered expression in WT under salt stress. A total of 5,360 genes were salt-regulated with 1,845 genes up-regulated and 3,515 down-regulated (Figure 7A and Supplementary Table S2). Among these salt-regulated genes, we then identified the up- or down-regulated genes in PaMBF1c-OE and AtMBF1c-OE lines under normal condition. We found that 10 genes in the PaMBF1c-OE line were already up-regulated, which included three genes that were also already up-regulated in the AtMBF1c-OE line (Table 1 and Figure 7B). We validated the expression of several genes in Table 1 by real-time PCR and found that gene expression of all tested genes was consistent with RNA-Seq results (Supplementary Figure S7).
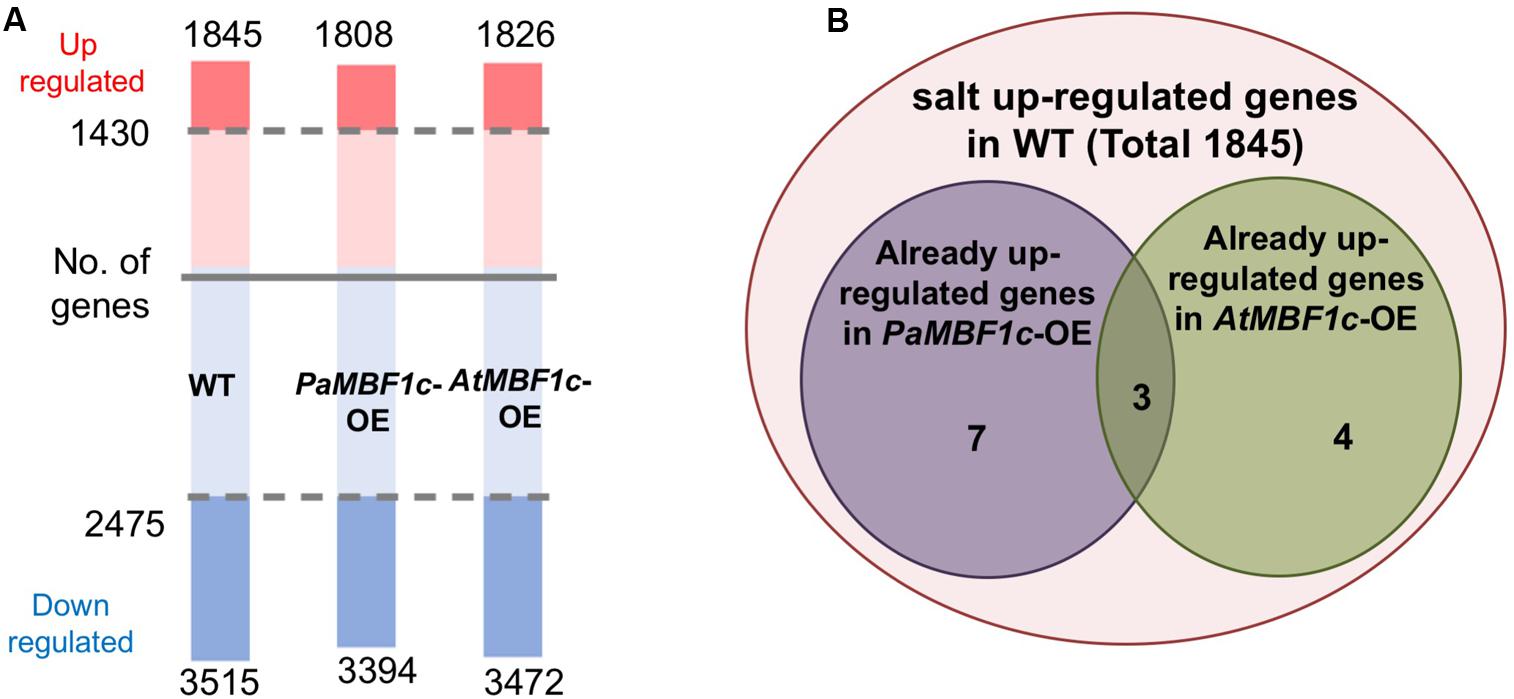
FIGURE 7. Transcriptome analysis of WT, PaMBF1c-OE, and AtMBF1c-OE lines. (A) Numbers of salt-regulated genes (p-value < 0.05, FDR corrected p-value < 0.05, absolute value of fold change > 1.5) in WT, PaMBF1c-OE, and AtMBF1c-OE lines. Shaded regions indicate genes commonly regulated by salt in all three lines. Numbers above the pink bars denote the total number of up-regulated genes and ones below the blue bars indicate the total number of down-regulated genes in each genotype. Numbers by the shaded regions in the middle of the bar are the total number of genes that were commonly up-/down-regulated in all variants. (B) Venn diagram showing 10 salt up-regulated genes that were already up-regulated in PaMBF1c-OE and 7 genes in AtMBF1c-OE plants under normal conditions.
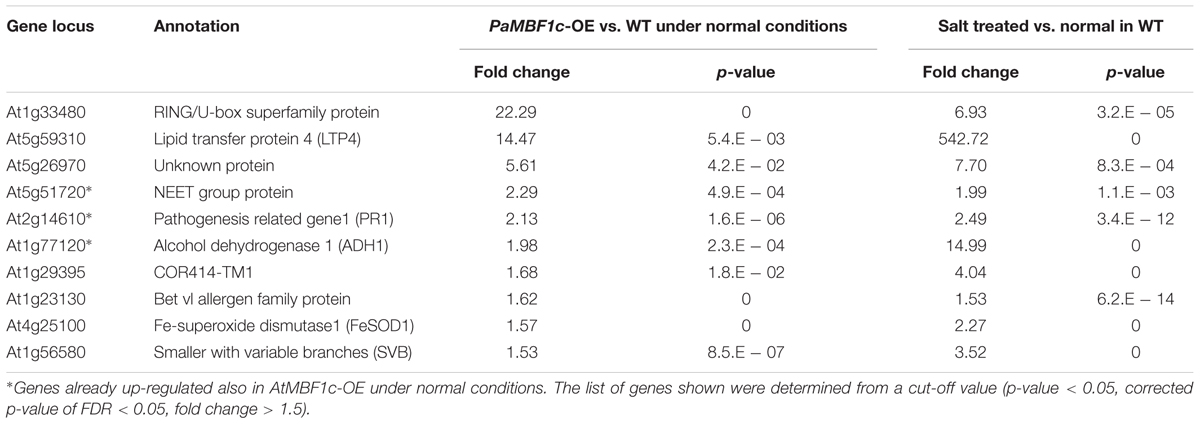
TABLE 1. Salt up-regulated genes that were already up-regulated in the PaMBF1c-OE lines under normal conditions.
None of the salt down-regulated genes were found already down-regulated in either PaMBF1c or AtMBF1c overexpressing lines (data not shown). The already up-regulated genes, particularly PaMBF1c-OE specific genes, might elicit quicker response to salt stress in PaMBF1c-OE lines, resulting in enhanced salt tolerance in overexpressors. Among the already up-regulated genes in PaMBF1c-OE, the FeSOD1 gene (At4g25100) was identified in a transcriptome comparison study by Taji et al. (2004) in which 77 genes were identified that showed higher expression under normal conditions in a halophyte Thellungiella halophila than in Arabidopsis. This suggests that early establishment of FeSOD1-mediated detoxification of reactive oxygen species (ROS) in PaMBF1c-OE might be an important step in the enhanced tolerance to salt stress which usually causes secondary oxidative stress.
We also compared profiles of salt-regulated genes from WT, PaMBF1c-OE and AtMBF1c-OE lines. The two overexpressors showed similar numbers of genes with altered expression under salt stress as did wild type (1,808 and 1,826up-regulated genes in PaMBF1c-OE and AtMBF1c-OE, respectively; 3,394 and 3,472 down-regulated genes in PaMBF1c-OE and AtMBF1c-OE, respectively) (Figure 7A and Supplementary Table S3). Expression of the majority of these genes was commonly regulated by salt stress in all genotypes; i.e., WT, PaMBF1c-OE, and AtMBF1c-OE lines each possessed the same set of 1,430 up-regulated and 2,475 down-regulated genes out of a total of 1845, 1,808 and 1,826 up-regulated and 3515, 3,394 and 3,472 down-regulated genes in WT, PaMBF1c-OE and AtMBF1c-OE, respectively (Figure 7A and Supplementary Table S3). At least in part, the genes with altered expression unique to PaMBF1c-OE might contribute to the enhanced salt tolerance of the PaMBF1c-OE lines.
Gene ontology enrichment analysis within the category ‘biological processes’ was conducted with salt-regulated genes using the whole Arabidopsis genome set as reference. The overall distribution pattern of salt-regulated genes in GO terms was well conserved among WT, PaMBF1c-OE, and AtMBF1c-OE lines under salt stress conditions (Figure 8A). The terms RNA metabolic process, response to stress, response to stimulus, DNA metabolic process, and carbohydrate metabolic process were significantly over- or under-represented in all three plants compared to the Arabidopsis genome (p-value of the Bonferroni correction for multiple testing < 0.05) (Figure 8A). The term protein metabolic process was significantly over-represented only in WT plants but not in PaMBF1c-OE or AtMBF1c-OE, suggesting that protein metabolism is a major biological process affected in WT plants under salt stress.
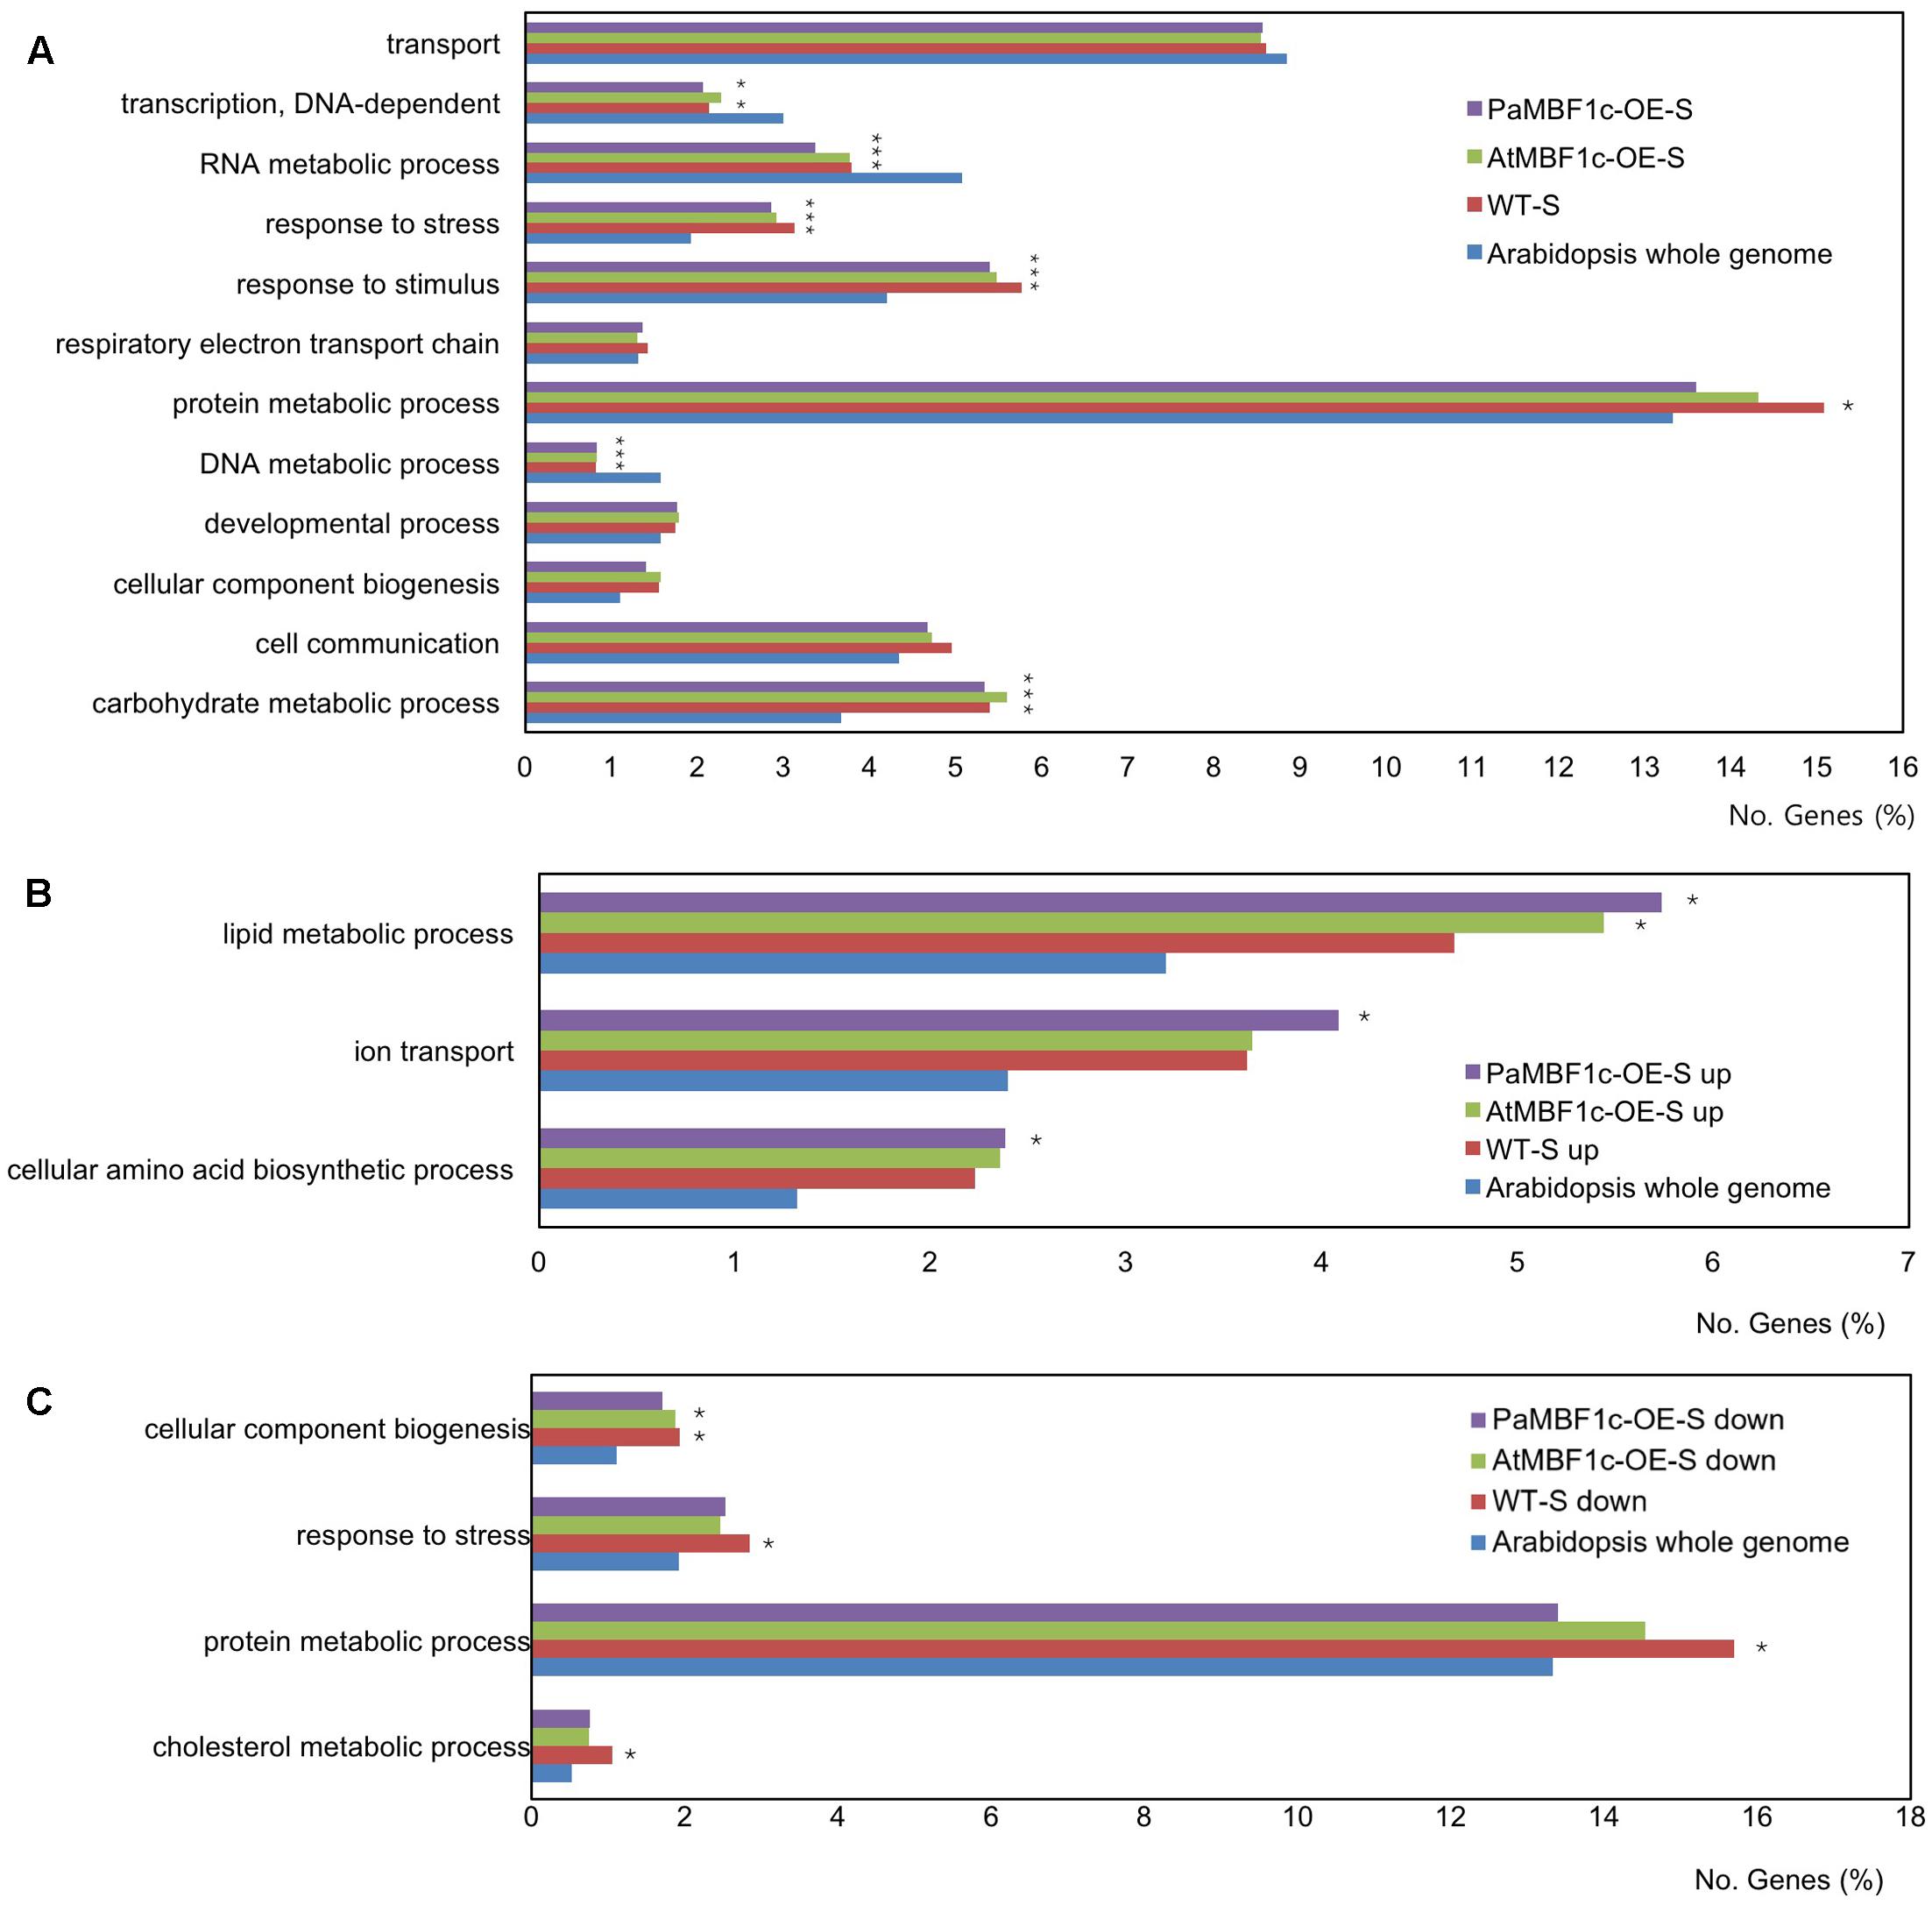
FIGURE 8. Gene ontology enrichment analysis of salt regulated genes in WT, PaMBF1c-OE, and AtMBF1c-OE lines. (A) Gene Ontology (GO) terms with significance (corrected p-value of Bonferroni correction < 0.05) from the GO enrichment analysis with salt-regulated genes using Arabidopsis whole genome as a comparison reference. (B) Functional GO classification of genes salt up-regulated genes based on plant GO slim terms. (C) Functional GO classification of genes salt down-regulated genes based on plant GO slim terms. Only GO terms with significance (corrected p-value of Bonferroni correction < 0.05) from the GO enrichment analysis were presented. For suffix of each line in the graph legends, “-S” indicates “salt-treated,” “up” and “down” mean “up-regulated” and “down-regulated,” respectively. Asterisks indicate statistical significance.
To increase the resolution of GO enrichment analysis, we divided salt-regulated genes into salt up-regulated and salt down-regulated groups and conducted separate GO enrichment analyses for each with the whole Arabidopsis genome as reference. For salt up-regulated genes, GO terms in biological processes that were significantly over-represented in PaMBF1c-OE plants were ‘lipid metabolic process,’ ‘ion transport,’ and ‘cellular amino acid biosynthetic process’ (Figure 8B). The corresponding salt up-regulated genes included in these terms were listed in Supplementary Table S4. Given the possibility that improved salt tolerance in PaMBF1c-OE might be mainly due to enhanced ionic stress tolerance, we manually surveyed genes for the term ‘ion transport’ that were significantly up-regulated in PaMBF1c-OE only. Notably, genes involved in ATP production and transport (Mitochondrial phosphate transporter [At3g48850] and ADP/ATP carrier 3 [At4g28390]) as well as ATP-dependent Ca2+ pumping (ECA1 [At1g07810]) were among the PaMBF1c-OE specific salt up-regulated genes (Supplementary Table S4) (Liang et al., 1997; Wu et al., 2002). Thus, enhanced salt tolerance in PaMBF1c-OE might be caused in part by promotions of ATP synthesis and Ca2+ signaling.
For salt down-regulated genes, the GO terms ‘cellular component biogenesis,’ ‘response to stress,’ ‘protein metabolic process,’ and ‘cholesterol metabolic process’ were significantly over-represented in WT plants under salt-stress condition but not so in PaMBF1c-OE or AtMBF1c-OE plants with the exception of ‘cellular component biogenesis’ which was over-represented in both WT and AtMBF1c-OE plants (Figure 8C). Salt down-regulated genes in these GO terms were listed in Supplementary Table S5. We reasoned that among the genes of these GO terms, those that are either salt up-regulated or not down-regulated only in PaMBF1c-OE lines would be more highly associated with enhanced salt stress tolerance in PaMBF1c-OE. And thus, we manually surveyed those groups of genes. Among the interesting findings that we noticed was that many ribosome and translation-related genes were not salt down-regulated only in PaMBF1c-OE (Supplementary Table S5), which suggests that PaMBF1c might function in promoting protein synthesis processes particularly to acquire enhanced salt stress tolerance.
Discussion
Developing crop plants with inbuilt tolerance for multiple stresses is a requisite for mitigating damage to global agriculture productivity. So far, numerous efforts have been made to clone novel genes from a diverse array of species acclimated to various adverse environments. Our study demonstrated that ectopic expression of PaMBF1c enhanced the adaption of transgenic Arabidopsis to various abiotic stresses and in particular, to salt stress.
Phylogenetic analysis of PaMBF1c and MBF1s from other plant species ranging from algae to dicot plants suggested a clear divergence between MBF1c and MBF1a/b (MBF1a and MBF1b) proteins among both vascular and non-vascular plants (Figure 1B). Other studies have also concluded the same (Tsuda and Yamazaki, 2004; Liu et al., 2007). This denotes that MBF1c proteins of plants might possess non-redundant functions which differ from those of MBF1a/b proteins despite sharing similar conservative domains among the MBF1 family proteins.
Another interesting finding was the general maintenance of MBF1c as a single gene versus the variability of MBF1a or MBF1b group genes depending on species (Figure 1B). Phylogenetic analysis revealed that this divergence between MBF1a/b and MBF1c is apparent in both vascular and non-vascular plants. Algae species (i.e., Chlamydomonas reinhardtii, Coccomyxa subellipsoidea, and Volvox carteri) contain only one MBF1 gene while most land plants possess two (MBF1a/b and MBF1c), suggesting that gene duplication occurred early in land plant emergence. In some species such as Marchantia polymorpha, Oryza sativa, and Sorghum bicolor, only two copies of MBF1 genes (one MBF1a or MBF1b, and one MBF1c) exist. Species such as A. thaliana, Populus trichocarpa, Physcomitrella patens, and Brachypodium distachyon appeared to have experienced a single round of recent gene duplication in the MBF1a/b gene which resulted in three MBF1 genes including the MBF1c gene.
Thus, it is likely that MBF1c is functionally distinct from MBF1a/b since its evolution and mainly function in stress tolerance regulation. This notion has been supported by many studies including our own; PaMBF1c-OE demonstrated similar enhanced stress tolerance to heat and osmotic stress as AtMBF1c-OE (Suzuki et al., 2005). In addition, PaMBF1c overexpression brought about enhanced salt stress tolerance which was not observed in the case of AtMBF1c overexpression. Thus, PaMBF1c may have obtained additional function during evolution to cope with the high salt conditions of Antarctic soil (see below).
Consistent with its function, expression of MBF1c was highly induced by different abiotic stresses in plants. For example, transcript levels of TaMBF1c was increased under drought, H2O2, and heat stress conditions in Triticum aestivum (Qin et al., 2015). Similarly, expression of PaMBF1c was induced by mannitol, NaCl, and heat treatment (Figure 2). In Arabidopsis, expression of AtMBF1c was also induced in response to heat and drought or a combination of both heat and osmotic stress (Suzuki et al., 2005). In contrast, the expression of AtMBF1a and AtMBF1b was not altered by abiotic stress, but rather developmentally regulated (Tsuda and Yamazaki, 2004). These observations suggest that MBF1 genes have evolved not only at the coding sequence level, but also at the level of regulatory sequence for the diversification of function.
In addition to their functions in abiotic stress responses, PaMBF1c and AtMBF1c appear to have some role in development. In comparison to WT, both PaMBF1c-OE and AtMBF1c-OE displayed higher fresh weight and flowered earlier. The enhanced growth by MBF1 overexpression was also reported in a CaMBF1 overexpression study even in cases showing stress sensitive phenotypes (Guo et al., 2014). This robust growth of MBF1 overexpression plants might be due to elevated endoreduplication and promotion of cell expansion throughout the leaves (Tojo et al., 2009). These observations indicate the functional similarity of PaMBF1c and AtMBF1c during development. Thus, the fact that enhanced salt stress tolerance was achieved only by PaMBF1c overexpression, despite these similarities between PaMBF1c and AtMBF1c, underscores a broader functional spectrum of PaMBF1c from the polar moss.
Adverse effects of salt stress on plants are the combined result of osmotic stress and ionic stress. Ionic stress tolerance was enhanced only in PaMBF1c-OE at 15–20 mM LiCl, while similar levels of osmotic stress tolerance was measured in PaMBF1c-OE and AtMBF1c-OE at 200 mM mannitol (Figure 6). This indicates that the PaMBF1c gene might cope better against ionic stress imposed by salt treatment in comparison with the AtMBF1c gene. The moss P. alpinum was collected from Antarctic soils which contain characteristically high contents of soluble salts (i.e., sulfates, chlorides, nitrates, potassium, calcium, and magnesium) resulting from chemical weathering of rocks, marine salt deposits and sedimentary rock leaching (Claridge and Campbell, 1977). Thus, PaMBF1c might have evolved to function better in the high salt conditions of Antarctic, probably through optimization of amino acid residues. We found that there are 14 amino acid residues in PaMBF1c different from in Triticum aestivum MBF1c (ACU43593) and AtMBF1c (NP_189093) whose functions were shown to be involved in abiotic stress tolerance (Suzuki et al., 2005; Qin et al., 2015). However, we cannot rule out the possibility that foreign gene (i.e., PaMBF1c) overexpression could have escaped from the endogenous gene regulation system of Arabidopsis to outperform endogenous gene (i.e., AtMBF1c) overexpression in stress response. Still, it cannot be denied that the case of PaMBF1c shows a good example of the advantage of using foreign genes to improve stress tolerance in plants. A question may arise as to whether the stress tolerance phenotypes in PaMBF1c-OE might be due to its enhanced growth; however, bigger sized plants do not always result in improved stress tolerance. For example, CaMBF1 overexpression resulted in Arabidopsis with large leaves but with reduced stress tolerance to cold and salt stress (Guo et al., 2014). In our PaMBF1c-OE lines, we did not observe enhanced root growth under normal conditions (Supplementary Figure S2) despite the fact that PaMBF1c-OE lines showed longer root length under stress conditions than WT and, in some cases, both WT and AtMBF1c-OE (Figures 4, 6). In addition, analysis of germination, MDA content, and anthocyanin content, which normally are not directly related to enhanced growth, suggested improved salt tolerance in PaMBF1c-OE. It should be noted that germination, MDA content and anthocyanin content were very similar among the tested lines under control conditions. Therefore, we believe that improved stress tolerance by PaMBF1c overexpression is not likely due to enhanced growth.
Thus, how does PaMBF1c, but not AtMBF1c, mechanistically bring about enhanced salt stress tolerance? A simple answer to this question would be that the genes with salt-altered expression only in PaMBF1c-OE account for the beneficial PaMBF1c function. According to this view, attention needs to be given to the genes involved in the over-represented GO terms of lipid metabolic process, ion transport, and cellular amino acid biosynthetic process among salt up-regulated genes in PaMBF1c-OE (Figure 8B). Another candidate gene group for better salt tolerance in PaMBF1c-OE could be the salt-regulated genes that are already up-regulated under normal conditions (Table 1). Ten and seven salt-induced genes were already highly expressed in PaMBF1c-OE and AtMBF1c-OE under normal conditions, respectively (Table 1 and Figure 7B). The 10 up-regulated genes in PaMBF1c-OE included three genes that were also up-regulated in AtMBF1c-OE (Table 1 and Figure 7B).
Thus, these already up-regulated genes in PaMBF1c-OE might prime the OE lines for quicker responses to salt stress resulting in enhanced salt tolerance in the PaMBF1c-OE lines. One such rapid response could be the salt-induced removal of ROS by FeSOD1 (At4g25100) whose expression was already high under normal conditions also in the salt cress T. halophila (Taji et al., 2004). It is known that salt stress induces oxidative stress (Hernández et al., 1993). Also, oxidative stress is shown to cause ATP depletion (Tiwari et al., 2002). Thus, given the fact that ATP production and transport genes (At3g48850, At4g28390) and ATP-dependent Ca2+ pump, ECA1 (At1g07810) were uniquely salt up-regulated only in PaMBF1c-OE (Supplementary Table S4), the enhancement of salt tolerance in PaMBF1c-OE could involve ROS detoxification, maintenance of ATP homeostasis, and facilitation of Ca2+ signaling. Additionally, PaMBF1c-OE function in salt stress might be associated with protein synthesis, given that many ribosome and translation-related genes, which were otherwise down-regulated by salt, were shown not down-regulated solely in PaMBF1c-OE lines. Indeed, several studies have reported that some ribosome- and translation-related genes were shown to be involved in abiotic stress responses; for example, knock-down of eukaryotic translation initiation factor 5A (eIF5A) in Arabidopsis brought about hypersensitivity to heat, oxidative and osmotic stresses, while overexpression of eIF5A resulted in osmotic stress tolerance (Ma et al., 2010; Xu et al., 2011). In addition, Arabidopsis mutants defective in cytosolic 60S ribosomal maturation factor REIL displayed cold-sensitive phenotypes (Schmidt et al., 2013). Further molecular and physiological studies will be needed to uncover if and how these genes function in PaMBF1c-mediated salt tolerance.
Author Contributions
HL and B-hL conceived and designed the research; HA and MP performed the experiments; HA, HL, and B-hL discussed the results and wrote the paper.
Funding
This work was supported by Next-Generation BioGreen21 Program (PJ011006) to B-hL, Rural Development Administration, South Korea, and Polar Genomics 101 Project (PE17080) to HL, the Korea Polar Research Institute.
Conflict of Interest Statement
The authors declare that the research was conducted in the absence of any commercial or financial relationships that could be construed as a potential conflict of interest.
Acknowledgment
The authors thank Dr. Ron Mittler (University of North Texas, United States) for the AtMBF1c overexpressing lines.
Supplementary Material
The Supplementary Material for this article can be found online at: http://journal.frontiersin.org/article/10.3389/fpls.2017.01206/full#supplementary-material
FIGURE S1 | Germination of WT, PaMBF1c-OE, and AtMBF1c-OE lines on the control media for each stress treatment. All lines showed near 100% germination levels on the control media. The control MS/agar plates were prepared separately for each stress treatment.
FIGURE S2 | Root elongation of WT, PaMBF1c-OE, and AtMBF1c-OE lines on the control media for each stress treatment. Root growth on control media (MS only) for (A) salt stress (NaCl), (B) ionic stress (LiCl) and (C) osmotic stress (mannitol). All lines showed similar root elongation on the control media (average of 2.56 ± 0.22 cm on 6 days after transfer). The control MS/agar plates were prepared separately for each stress treatment.
FIGURE S3 | Survival test of WT and PaMBF1c-OE lines under different abiotic stress conditions. (A) Seedlings on MS/agar plates before heat stress treatment. (B) Seedlings on MS/agar plates after heat stress treatment (45°C for 60 min). (C) Seedlings on control MS/agar plates for salt and ionic stress treatments. (D) Seedlings on 200 mM NaCl plates (salt stress). (E) Seedlings on 20 mM LiCl plates (ionic stress).
FIGURE S4 |PaMBF1c-OE lines showed lower ion leakage than WT at low temperatures. Fully expanded fourth or fifth rosette leaves with petiole from 3-week-old seedlings were used for the experiment. Ion leakage was expressed as a percentage of total electrolytes at a given temperature. Error bars represents standard deviation of the mean values of five independent experiments.
FIGURE S5 | Anthocyanin accumulation under salt stress. (A) Ten-day-old seedlings grown on control and 150 mM NaCl plates (salt stress) (B) Quantification of anthocyanin accumulation in each line. Error bars represents standard deviation (n = 25 seedlings per each treatment). Asterisks indicate statistical significance in LSD test (p < 0.05).
FIGURE S6 | Comparison of germination between PaMBF1c-OE and AtMBF1c-OE lines under different concentrations of mannitol. Error bars represents standard deviation of the mean values of three independent experiments.
FIGURE S7 | Validation of the gene expression profiles obtained in RNA-sequencing by qRT-PCR. Relative expression levels of selected genes were determined by qRT-PCR using the cDNA synthesized from RNA isolated from the 14-day-old seedlings treated to high salt stress (300 mM NaCl for 6 h). (A) RING/U-box super family protein (At1g33480); (B) lipid transfer protein 4 (At5g59310); (C) Fe-superoxide dismutase (At4g25100); (D) hypothetical protein (At5g26970). Arabidopsis Clathrin (At4g24550) gene was used as an internal control for normalization of different cDNA samples. Three biological replicates were averaged and error bars represent standard deviation.
Footnotes
- ^ https://phytozome.jgi.doe.gov/pz/portal.html
- ^ http://www.ncbi.nlm.nih.gov/Structure/cdd/wrpsb.cgi
- ^ www.ncbi.nlm.nih.gov/sra/
- ^ http://pantherdb.org/
- ^ http://web.expasy.org/compute_pi
- ^ http://www.phytozome.net
References
Alavilli, H., Awasthi, J., Rout, G., Sahoo, L., Lee, B.-H., and Panda, S. (2016). Overexpression of a barley aquaporin gene, HvPIP2;5 confers salt and osmotic stress tolerance in yeast and plants. Front. Plant Sci. 7:1566. doi: 10.3389/fpls.2016.01566
Aravind, L., and Koonin, E. V. (1999). DNA-binding proteins and evolution of transcription regulation in the archaea. Nucleic Acids Res. 27, 4658–4670. doi: 10.1093/nar/27.23.4658
Arce, D. P., Godoy, A. V., Tsuda, K., Yamazaki, K., Valle, E. M., Iglesias, M. J., et al. (2010). The analysis of an Arabidopsis triple knock-down mutant reveals functions for MBF1 genes under oxidative stress conditions. J. Plant Physiol. 167, 194–200. doi: 10.1016/j.jplph.2009.09.003
Arce, D. P., Tonon, C., Zanetti, M. E., Godoy, A. V., Hirose, S., and Casalongue, C. A. (2006). The potato transcriptional co-activator StMBF1 is up-regulated in response to oxidative stress and interacts with the TATA-box binding protein. J. Biochem. Mol. Biol. 39, 355–360. doi: 10.5483/bmbrep.2006.39.4.355
Ashton, N. W., and Cove, D. J. (1977). The isolation and preliminary characterisation of auxotrophic and analogue resistant mutants of the moss, Physcomitrella patens. Mol. Gen. Genet. 154, 87–95. doi: 10.1007/BF00265581
Bell, N. E., and Hyvonen, J. (2010). Phylogeny of the moss class Polytrichopsida (BRYOPHYTA): generic-level structure and incongruent gene trees. Mol. Phylogenet. Evol. 55, 381–398. doi: 10.1016/j.ympev.2010.02.004
Bhattarai, H. D., Paudel, B., Lee, H. K., Oh, H., and Yim, J. H. (2009). In vitro antioxidant capacities of two Benzonaphthoxanthenones: ohioensins F and G, isolated from the antarctic moss Polytrichastrum alpinum. Z. Naturforsch. C 64, 197–200. doi: 10.1515/znc-2009-3-408
Brendel, C., Gelman, L., and Auwerx, J. (2002). Multiprotein bridging factor-1 (MBF-1) is a cofactor for nuclear receptors that regulate lipid metabolism. Mol. Endocrinol. 16, 1367–1377. doi: 10.1210/mend.16.6.0843
Claeys, H., Van Landeghem, S., Dubois, M., Maleux, K., and Inze, D. (2014). What is stress? dose-response effects in commonly used in vitro stress assays. Plant Physiol. 165, 519–527. doi: 10.1104/pp.113.234641
Claridge, G. G. C., and Campbell, I. B. (1977). THE salts in antarctic soils, their distribution and relationship to soil processes. Soil Sci. 123, 377–384. doi: 10.1097/00010694-197706000-00006
Clough, S. J., and Bent, A. F. (1998). Floral dip: a simplified method for Agrobacterium-mediated transformation of Arabidopsis thaliana. Plant J. 16, 735–743. doi: 10.1046/j.1365-313x.1998.00343.x
Curtis, M. D., and Grossniklaus, U. (2003). A gateway cloning vector set for high-throughput functional analysis of genes in planta. Plant Physiol. 133, 462–469. doi: 10.1104/pp.103.027979
Du, J., Wang, L., Zhang, X., Xiao, X., Wang, F., Lin, P., et al. (2016). Heterologous expression of two Physcomitrella patens group 3 late embryogenesis abundant protein (LEA3) genes confers salinity tolerance in arabidopsis. J. Plant Biol. 59, 182–193. doi: 10.1007/s12374-016-0565-7
Godoy, A. V., Zanetti, M. E., San Segundo, B., and Casalongue, C. A. (2001). Identification of a putative Solanum tuberosum transcriptional coactivator up-regulated in potato tubers by Fusarium solani f. sp eumartii infection and wounding. Physiol. Plant. 112, 217–222. doi: 10.1034/j.1399-3054.2001.1120210.x
Goodstein, D. M., Shu, S. Q., Howson, R., Neupane, R., Hayes, R. D., Fazo, J., et al. (2012). Phytozome: a comparative platform for green plant genomics. Nucleic Acids Res. 40, D1178–D1186. doi: 10.1093/nar/gkr944
Guo, W. L., Chen, R. G., Du, X. H., Zhang, Z., Yin, Y. X., Gong, Z. H., et al. (2014). Reduced tolerance to abiotic stress in transgenic Arabidopsis overexpressing a Capsicum annuum multiprotein bridging factor 1. BMC Plant Biol. 14:138. doi: 10.1186/1471-2229-14-138
Heath, R. L., and Packer, L. (1968). Photoperoxidation in isolated chloroplasts. Arch. Biochem. Biophys. 125, 189–198. doi: 10.1016/0003-9861(68)90654-1
Hernández, J. A., Corpas, F. J., Gómez, M., Del Río, L. A., and Sevilla, F. (1993). Salt-induced oxidative stress mediated by activated oxygen species in pea leaf mitochondria. Physiol. Plant. 89, 103–110. doi: 10.1111/j.1399-3054.1993.tb01792.x
Hong, S. W., and Vierling, E. (2000). Mutants of Arabidopsis thaliana defective in the acquisition of tolerance to high temperature stress. Proc. Natl. Acad. Sci. U.S.A. 97, 4392–4397. doi: 10.1073/pnas.97.8.4392
Ishitani, M., Xiong, L., Stevenson, B., and Zhu, J. K. (1997). Genetic analysis of osmotic and cold stress signal transduction in Arabidopsis: interactions and convergence of abscisic acid-dependent and abscisic acid-independent pathways. Plant Cell 9, 1935–1949. doi: 10.1105/tpc.9.11.1935
Kabe, Y., Goto, M., Shima, D., Imai, T., Wada, T., Morohashi, K., et al. (1999). The role of human MBF1 as a transcriptional coactivator. J. Biol. Chem. 274, 34196–34202. doi: 10.1074/jbc.274.48.34196
Kim, M. J., Lim, G. H., Kim, E. S., Ko, C. B., Yang, K. Y., Jeong, J. A., et al. (2007). Abiotic and biotic stress tolerance in Arabidopsis overexpressing the Multiprotein bridging factor 1a (MBF1a) transcriptional coactivator gene. Biochem. Biophys. Res. Commun. 354, 440–446. doi: 10.1016/j.bbrc.2006.12.212
Kumar, S., Stecher, G., and Tamura, K. (2016). MEGA7: molecular evolutionary genetics analysis version 7.0 for bigger datasets. Mol. Biol. Evolut. 33, 1870–1874. doi: 10.1093/molbev/msw054
Lee, B. H., Kapoor, A., Zhu, J. H., and Zhu, J. K. (2006). STABILIZED1, a stress-upregulated nuclear protein, is required for pre-mRNA splicing, mRNA turnover, and stress tolerance in Arabidopsis. Plant Cell 18, 1736–1749. doi: 10.1105/tpc.106.042184
Lee, B.-H., Lee, H., Xiong, L., and Zhu, J.-K. (2002). A mitochondrial complex i defect impairs cold-regulated nuclear gene expression. Plant Cell 14, 1235–1251. doi: 10.1105/tpc.010433
Li, F. Q., Ueda, H., and Hirose, S. (1994). Mediators of activation of Fushi-Tarazu Gene-transcription by Bmftz-F1. Mol. Cell. Biol. 14, 3013–3021. doi: 10.1128/MCB.14.5.3013
Liang, F., Cunningham, K. W., Harper, J. F., and Sze, H. (1997). ECA1 complements yeast mutants defective in Ca2+ pumps and encodes an endoplasmic reticulum-type Ca2+-ATPase in Arabidopsis thaliana. Proc. Natl. Acad. Sci. U.S.A. 94, 8579–8584. doi: 10.1073/pnas.94.16.8579
Lichtenthaler, H. K. (1987). Chlorophyll fluorescence signatures of leaves during the autumnal chlorophyll breakdown. J. Plant Physiol. 131, 101–110. doi: 10.1016/S0176-1617(87)80271-7
Liu, Q. X., Jindra, M., Ueda, H., Hiromi, Y., and Hirose, S. (2003). Drosophila MBF1 is a co-activator for tracheae defective and contributes to the formation of tracheal and nervous systems. Development 130, 719–728. doi: 10.1242/dev.00297
Liu, Q. X., Nakashima-Kamimura, N., Ikeo, K., Hirose, S., and Gojobori, T. (2007). Compensatory change of interacting amino acids in the coevolution of transcriptional coactivator MBF1 and TATA-box-binding protein. Mol. Biol. Evol. 24, 1458–1463. doi: 10.1093/molbev/msm073
Livak, K. J., and Schmittgen, T. D. (2001). Analysis of relative gene expression data using real-time quantitative PCR and the 2-ΔΔCT method. Methods 25, 402–408. doi: 10.1006/meth.2001.1262
Ma, F., Liu, Z., Wang, T.-W., Hopkins, M. T., Peterson, C. A., and Thompson, J. E. (2010). Arabidopsis eIF5A3 influences growth and the response to osmotic and nutrient stress. Plant Cell Environ. 33, 1682–1696. doi: 10.1111/j.1365-3040.2010.02173.x
Mi, H. Y., Muruganujan, A., Casagrande, J. T., and Thomas, P. D. (2013). Large-scale gene function analysis with the PANTHER classification system. Nat. Protoc. 8, 1551–1566. doi: 10.1038/nprot.2013.092
Mi, H. Y., Poudel, S., Muruganujan, A., Casagrande, J. T., and Thomas, P. D. (2016). PANTHER version 10: expanded protein families and functions, and analysis tools. Nucleic Acids Res. 44, D336–D342. doi: 10.1093/nar/gkv1194
Mortazavi, A., Williams, B. A., Mccue, K., Schaeffer, L., and Wold, B. (2008). Mapping and quantifying mammalian transcriptomes by RNA-Seq. Nat. Methods 5, 621–628. doi: 10.1038/nmeth.1226
Nakabayashi, R., Yonekura-Sakakibara, K., Urano, K., Suzuki, M., Yamada, Y., Nishizawa, T., et al. (2014). Enhancement of oxidative and drought tolerance in Arabidopsis by overaccumulation of antioxidant flavonoids. Plant J. 77, 367–379. doi: 10.1111/tpj.12388
Neff, M. M., and Chory, J. (1998). Genetic interactions between phytochrome A, phytochrome B, and cryptochrome 1 during Arabidopsis development. Plant Physiol. 118, 27–36. doi: 10.1104/pp.118.1.27
Oh, J. E., Kim, Y. H., Kim, J. H., Kwon, Y. R., and Lee, H. (2011). Enhanced level of anthocyanin leads to increased salt tolerance in Arabidopsis PAP1-D plants upon sucrose treatment. J. Korean Soc. Appl. Biol. Chem. 54, 79–88. doi: 10.3839/jksabc.2011.011
Qin, D., Wang, F., Geng, X., Zhang, L., Yao, Y., Ni, Z., et al. (2015). Overexpression of heat stress-responsive TaMBF1c, a wheat (Triticum aestivum L.) Multiprotein Bridging Factor, confers heat tolerance in both yeast and rice. Plant Mol. Biol. 87, 31–45. doi: 10.1007/s11103-014-0259-9
Rizhsky, L., Liang, H. J., and Mittler, R. (2002). The combined effect of drought stress and heat shock on gene expression in tobacco. Plant Physiol. 130, 1143–1151. doi: 10.1104/pp.006858
Schmidt, S., Dethloff, F., Beine-Golovchuk, O., and Kopka, J. (2013). The REIL1 and REIL2 proteins of Arabidopsis thaliana are required for leaf growth in the cold. Plant Physiol. 163, 1623–1639. doi: 10.1104/pp.113.223925
Suzuki, N., Rizhsky, L., Liang, H. J., Shuman, J., Shulaev, V., and Mittler, R. (2005). Enhanced tolerance to environmental stress in transgenic plants expressing the transcriptional coactivator multiprotein bridging factor 1c. Plant Physiol. 139, 1313–1322. doi: 10.1104/pp.105.070110
Suzuki, N., Sejima, H., Tam, R., Schlauch, K., and Mittler, R. (2011). Identification of the MBF1 heat-response regulon of Arabidopsis thaliana. Plant J. 66, 844–851. doi: 10.1111/j.1365-313X.2011.04550.x
Taji, T., Seki, M., Satou, M., Sakurai, T., Kobayashi, M., Ishiyama, K., et al. (2004). Comparative genomics in salt tolerance between Arabidopsis and Arabidopsis-related halophyte salt cress using Arabidopsis microarray. Plant Physiol. 135, 1697–1709. doi: 10.1104/pp.104.039909
Takemaru, K., Li, F. Q., Ueda, H., and Hirose, S. (1997). Multiprotein bridging factor 1 (MBF1) is an evolutionarily conserved transcriptional coactivator that connects a regulatory factor and TATA element-binding protein. Proc. Natl. Acad. Sci. U.S.A. 94, 7251–7256. doi: 10.1073/pnas.94.14.7251
Thompson, J. D., Higgins, D. G., and Gibson, T. J. (1994). CLUSTAL W: improving the sensitivity of progressive multiple sequence alignment through sequence weighting, position-specific gap penalties and weight matrix choice. Nucleic Acids Res. 22, 4673–4680. doi: 10.1093/nar/22.22.4673
Tiwari, B. S., Belenghi, B., and Levine, A. (2002). Oxidative stress increased respiration and generation of reactive oxygen species, resulting in ATP depletion, opening of mitochondrial permeability transition, and programmed cell death. Plant Physiol. 128, 1271–1281. doi: 10.1104/pp.010999
Tojo, T., Tsuda, K., Yoshizumi, T., Ikeda, A., Yamaguchi, J., Matsui, M., et al. (2009). Arabidopsis MBF1s control leaf cell cycle and its expansion. Plant Cell Physiol. 50, 254–264. doi: 10.1093/pcp/pcn187
Tsuda, K., Tsuji, T., Hirose, S., and Yamazaki, K. (2004). Three Arabidopsis MBF1 homologs with distinct expression profiles play roles as transcriptional co-activators. Plant Cell Physiol. 45, 225–231. doi: 10.1093/pcp/pch017
Tsuda, K., and Yamazaki, K. (2004). Structure and expression analysis of three subtypes of Arabidopsis MBF1 genes. Biochim. Biophys. Acta 1680, 1–10. doi: 10.1016/j.bbaexp.2004.08.004
Turetsky, M. R., Bond-Lamberty, B., Euskirchen, E., Talbot, J., Frolking, S., Mcguire, A. D., et al. (2012). The resilience and functional role of moss in boreal and arctic ecosystems. New Phytol. 196, 49–67. doi: 10.1111/j.1469-8137.2012.04254.x
Victoria, F. D., De Albuquerque, M. P., Pereira, A. B., Simas, F. N. B., Spielmann, A. A., and Schaefer, C. E. G. R. (2013). Characterization and mapping of plant communities at Hennequin Point, King George Island, Antarctica.Polar Res. 32, 19261. doi: 10.3402/polar.V32i0.19261
Wu, Z., Liang, F., Hong, B., Young, J. C., Sussman, M. R., Harper, J. F., et al. (2002). An endoplasmic reticulum-bound Ca2+/Mn2+ pump, ECA1, supports plant growth and confers tolerance to Mn2+ Stress. Plant Physiol. 130, 128–137. doi: 10.1104/pp.004440
Xu, J., Zhang, B., Jiang, C., and Ming, F. (2011). RceIF5A, encoding an eukaryotic translation initiation factor 5A in Rosa chinensis, can enhance thermotolerance, oxidative and osmotic stress resistance of Arabidopsis thaliana. Plant Mol. Biol. 75, 167–178. doi: 10.1007/s11103-010-9716-2
Yan, Q., Hou, H. M., Singer, S. D., Yan, X. X., Guo, R. R., and Wang, X. P. (2014). The grape VvMBF1 gene improves drought stress tolerance in transgenic Arabidopsis thaliana. Plant Cell Tissue Organ Cult. 118, 571–582. doi: 10.1007/s11240-014-0508-2
Keywords: stress tolerance, salt stress, MBF1c, RNA sequencing, Antarctic moss, Polytrichastrum alpinum
Citation: Alavilli H, Lee H, Park M and Lee B-h (2017) Antarctic Moss Multiprotein Bridging Factor 1c Overexpression in Arabidopsis Resulted in Enhanced Tolerance to Salt Stress. Front. Plant Sci. 8:1206. doi: 10.3389/fpls.2017.01206
Received: 31 March 2017; Accepted: 26 June 2017;
Published: 11 July 2017.
Edited by:
Bernd Mueller-Roeber, University of Potsdam, GermanyReviewed by:
Dirk K. Hincha, Max Planck Institute of Molecular Plant Physiology (MPG), GermanyNarendra Singh Yadav, Ben-Gurion University of the Negev, Israel
Copyright © 2017 Alavilli, Lee, Park and Lee. This is an open-access article distributed under the terms of the Creative Commons Attribution License (CC BY). The use, distribution or reproduction in other forums is permitted, provided the original author(s) or licensor are credited and that the original publication in this journal is cited, in accordance with accepted academic practice. No use, distribution or reproduction is permitted which does not comply with these terms.
*Correspondence: Byeong-ha Lee, Ynllb25naGFAc29nYW5nLmFjLmty