 Mengjie Xu1,2
 Qingsong Shao
- 1State Key Laboratory of Subtropical Silviculture, Zhejiang A & F University, Hangzhou, China
- 2The Department of Traditional Chinese Medicine, Zhejiang A & F University, Hangzhou, China
- 3Jinhua Academy of Agricultural Sciences, Jinhua, China
- 4Jinhua Jinglong Biological Technology Co., Ltd., Jinhua, China
- 5Zhejiang Jiangkang Agricultural Science and Technology Co., Ltd., Jinhua, China
This study used MAE and RSM to extract phenolic compounds from Anoectochilus roxburghii, and the optimum conditions defined by the model to give an optimum yield of 1.31%. The antioxidant activity in vitro showed when the concentration of phenolic compounds was reached 1 mg mL-1, the clearance rates were 82.58% for DPPH and 97.62% for ABTS+. In vivo antioxidant experiments used D-galactose to build oxidative damage in healthy Kunming mice. The result showed that the extractions of A. roxburghii can improve the antioxidant ability and the medium and low dose groups had better ability to scavenge free radicals. The UPLC-Q-TOF-MS/MS was developed to identify 21 kinds of phenolic compounds by molecular mass, ms/ms fragmentation, as well as retention time. The result showed that the phenolic compounds of A. roxburghii had significant potential as a natural antioxidant to promote health and to reduce the risk of disease.
Introduction
Oxidative stress, a result of imbalance between the antioxidant defense system and the formation of reactive oxygen species (ROS), may induce damage to cellular biomolecules such as proteins, enzymes, carbohydrates, and lipids through oxidative modification and contributing to the pathogenesis of human diseases. However, many synthetic antioxidants, such as butylated hydroxytoluene (BHT), butylated hydroxyanisole (BHA), tertbutylhydroquinone (TBHQ) and propyl gallate (PG), may accumulate in the body, resulting in liver damage and carcinogenesis (Mukhopadhyay et al., 2006; Galano et al., 2011). On account of this, more attention has been paid to extract natural non-toxic antioxidants in an effort to protect the human body from free radicals and retard the progress of many chronic diseases (Adams and Ghaly, 2007). Phenolic compounds are an important group of natural antioxidants that are distributed in medicinal plants, vegetables, fruits, and spices. Most phenolic compounds reported to be present in plants are quercetin, gallic acid, catechin, galuteolin, chlorogenic acid, ferulic acid, and kaempferol. Many researchers have shown much great interest in natural products because of their safety and their wide acceptance by consumers (Ranic et al., 2014).
Anoectochilus roxburghii is a perennial herb of the Orchidaceae family, which is mainly distributed in Southern China, Japan, India, Sri Lanka, Nepal, and Southeast Asian countries (Lv et al., 2015). Because of its unique medicinal properties, A. roxburghii has been called “the king of medicines” in China (Du et al., 2008; Cui et al., 2013; Shao et al., 2014). It has been used to treat diabetes, tumors, hyperliposis, and hepatitis. The studies on the chemical compounds of A. roxburghii were conducted, including phenolic, polysaccharides, triterpenoids, amino acids, etc. In preliminary study, we confirmed that A. roxburghii was rich in phenolic compounds. Phenolic compounds were considered to have many functions, such as removing active oxygen, preventing hemal sclerosis, improving nutrition for tissue, antiaging, and preventing aging dementia (Xi and Wang, 2013; Chen et al., 2015). However, few studies reported the extraction process optimization and antioxidant activity of A. roxburghii systematically. Thus, this study contains three objectives (1) to optimize the microwave-assisted extraction (MAE) process by response surface methodology, (2) to identify the phenolic compounds from A. roxburghii by UPLC-Q-TOF-MS/MS, and (3) to explore the antioxidant activity of the extractions of A. roxburghii and explored the mechanism of the antioxidant defense system.
Materials and Methods
Plant Materials and Chemicals
Anoectochilus roxburghii samples were identified by Professor Runhuai Hu at Zhejiang Agriculture and Forestry University, Lin’an City, Hangzhou, Zhejiang Province. The fresh herb of A. roxburghii were dried in a blast oven at 60°C to a stable moisture content of less than 5%, processed in a high-speed rotary cutting mill, and finally screened to produce a fraction containing particles as large as 100 mesh (149 μm). The powder was stored at 4°C in airtight bags until analysis. Total superoxide dismutase (T-SOD), glutathione peroxidase (GSH-Px), malondialdehyde (MDA), and commercial protein assay kits were obtained from Nanjing Jiancheng Bioengineering Institute (Nanjing, China). Folin–Ciocalteu reagent was obtained from Solarbio (Beijing, China). Gallic acid, 2,2-diphenyl-1-picrylhydrazyl radical (DPPH), and 2,2′-azinobis-(3-ethylbenzthiazoline-6-sulfonate) (ABTS) were obtained from Sigma-Aldrich. Chlorogenic acid, caffeic acid, L-epicatechin, ferulic acid, rutin, luteolin, quercetin, kaempferol, and apigenin were purchased from the National Institute for the Control of Pharmaceutical and Biological Products (Beijing, China). Acetonitrile and acetic acid of HPLC grade were purchased from Fisher Scientific (Pittsburgh, PA, United States). Ultrapure water was purified with a Milli-Q system (Millipore, Billerica, MA, United States). All other chemicals were of analytical grade and were obtained from Sinopharm Chemical Reagent, Co. Ltd (Shanghai, China).
Extraction Process Optimization
A portion of A. roxburghii powder was carefully weighed (1.0 g) and added to a 150 ml round-bottom flask. The flask was placed in the microwave apparatus and was fitted with a water condenser. The method analyzed four factors of extraction time (5–65 min), microwave power (100–500 W), solid–liquid ratio (1:40 to 1:80), and ethanol concentration (65–85%). After extraction, the supernatant was collected and the residue was extracted again. The combined supernatants were concentrated in a rotary evaporator, and stored at 4°C for later use. Response surface methodology was used to determine the optimal combination of process parameters, which varied on four factors and five levels. The selected extraction time, microwave power, solid–liquid ratio, and ethanol concentration were used as independent variables and total phenolics yield was used as a response value in a response surface experiment. The experimental data were analyzed using Design-Expert 8.0.6 trial software and determine the best microwave extraction conditions for total phenolics of A. roxburghii.
Antioxidant Activity In Vitro
The DPPH radical scavenging activity of the A. roxburghii extracts were determined according to the literature method (Dolinsky et al., 2015) with minor modifications. VC standard and sample solutions were prepared in a concentration series. The three tubes were marked A, B, and C. Group A: 2 mL of sample (VC) solution and 2 mL of DPPH solution; Group B: 2 mL of sample (VC) and 2 mL of absolute ethanol; Group C: 2 mL of 50% ethanol and 2 mL of DPPH solution. Sample (VC) is same for group A and group B. The reaction liquid was placed in darkness at room temperature for 30 min, and the absorbance at 517 nm was measured (n = 3).
The antioxidant activities of A. roxburghii extracts against the stable ABTS radical cation were determined according to the method of Shao et al. (2014) with slight modification. ABTS standard solution (7 mmol L-1) and potassium persulfate solution (140 mmol L-1) were prepared separately. ABTS solution (5 ml) was mixed with potassium persulfate solution (88 μL) and placed in darkness for 12–16 h. An ABTS working solution was also prepared by diluting the ABTS solution with ethanol to adjust the absorbance to 0.7 at 734 nm. Samples and VC reference standard were prepared at various concentrations and were to tubes (A, B, or C). Tube A contained sample solution (1 mL) or VC solution (1 mL) and ABTS working liquid (3 ml); tube B tube contained sample or VC solution (1 mL) and anhydrous ethanol (3 mL); tube C contained sample or VC solution (1 mL) and ABTS working solution (3 mL). The reaction liquid was placed in darkness at room temperature for 20 min, and the absorbance at 734 nm was recorded (n = 3). The antioxidant activity was calculated according to the equation as follow: where A0 is the absorbance of group C; A1 is the absorbance of group A; A2 is the absorbance of group B.
Antioxidant Activity In Vivo
Animals and Experimental Design
The experimental study followed the guidelines for the care and use of laboratory animals for the assessment of antioxidative health function, which was part of the food inspection and evaluation technical standards (2012 edition). The experimental animals were 60 healthy male Kunming mice (22 ± 2 g), which were obtained from the Zhejiang Academy of Medical Sciences. Ethics approval for this research was obtained from the committee of college of forestry and biotechnology, Zhejiang A & F University which is the University’s authority responsible for providing ethics approval for research involving animals. No further approval was required as per the University’s guidelines and national regulations. Animals were maintained under standard conditions (temperature 22 ± 1°C, humidity 45–55%, 12 h light per day). The mice were fed adaptively for 1 week, and randomly assigned into six groups (10 in each group). The animals were given ad libitum access to food and water. Animals in the five experimental groups were injected once daily with D-galactose (1.2 g kg-1, injection volume 0.1 mL⋅10 g-1) in hypodemic of hackles for 6 weeks, while animals in the normal control (NC) group were administered normal saline. For the VC positive control group (PC), mice were irrigated with VC solution (100 mg kg-1 day-1), which was dissolved in normal saline. Mice in the treatment groups were fed with extraction of A. roxburghii at different doses. The treatment groups were divided into three groups: (1) high dose (HD) group: 200 mg kg-1 day-1; (2) medium dose (MD) group: 100 mg kg-1 day-1; (3) low dose (LD) group: 50 mg kg-1 day-1. In addition, the NC group and model control (MC) group used the same method to get an equal volume of saline solution. In the meantime, continued to offer D-galactose except normal group, for 6 weeks.
Biochemical Assays
Twenty-four hours after the final drug administration, all mice were fasted. Blood samples were collected by enucleation and centrifuged at 4000 rpm for 10 min to give the serum. The mice were killed by cervical dislocation the liver tissue was quickly removed, washed, and homogenized in ice-cold physiological saline to prepare a 10% (w⋅v-1) homogenate. The homogenate was centrifuged at 4000 rpm for 10 min to remove cellular debris, and the supernatant was collected for analysis. The levels of T-SOD, GSH-Px and MDA levels were determined following the manufacturer’s instructions.
Identification of Phenolic Compounds
The stock solutions were appropriately diluted to prepare a series of standard working solutions. The solutions were brought to room temperature and filtered through 0.22 μm membrane filters before qualitative analysis. The identification of total phenolics of A. roxburghii was carried out using an ACQUITY Ultra Performance LC system equipped with a mass detector G2 Q-TOF micro mass spectrometer (Waters, Manchester, United Kingdom) equipped with an electrospray ionization (ESI) source operating in negative mode. Separations of individual phenolic compounds were performed on a UPLC BEH C18 column (100 mm × 2.1 mm, 1.7 μm) at 30°C. The mobile phase consisted of solvent A (0.5% acetic acid) and solvent B (100% acetonitrile). A gradient elution procedure was used: 0–10 min, 5–10% B; 10–18 min, 10–80% B; 18–24 min, 80–5% B. The flow rate was kept at 0.2 mL min-1, and the injection volume was 2 μL. The nebulizer gas was set to 500 L h-1 at a temperature of 350°C under negative ion mode. The cone gas was set to a flow rate of 50 L h-1, and the source temperature was set to 120°C. The capillary voltages were set to 2.5 kV, and the cone voltages were set to 15 V. The TOF data being collected between m/z 250 and the MS/MS experiments were performed using high collision energy of 45 V for fragment ion information. The composition for the precursor ions and for the fragment ions were calculated using the MassLynx 4.1 software incorporated in the instrument.
Statistical Analysis
The data were expressed as mean ± standard error. Significant difference was assessed by analysis of variance (ANOVA) and the Bonferroni multiple comparison test using SPSS (Statistical Package for the Social Science) statistical software (version 17.0, SPSS, Chicago, IL, United States).
Results
Modeling and Fitting the Model
The experimental design and corresponding response data for the content of total phenolics from A. roxburghii are presented in Table 1. Design Expert Software was used to plan the test and choose extraction time (A), microwave power (B), solid–liquid ratio (C), and alcohol concentration (D) as independent variables and the extraction yield of polyphenols from A. roxburghii (Y) was used as the response value (Table 1). The number 1–24 is factorial experiment. Quadratic regression analysis of data in the table, regression equation is obtained as follows (Khuri and Mukhopadhyay, 2010).
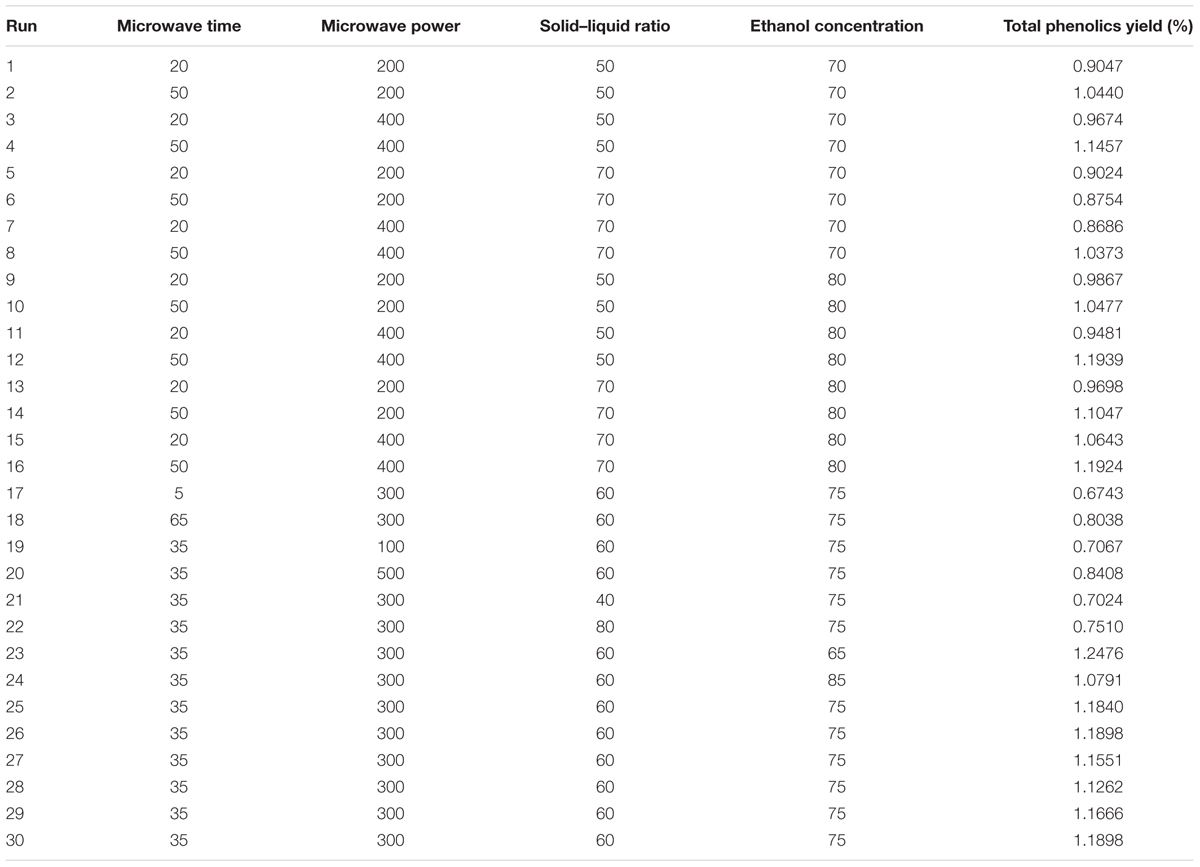
TABLE 1. Experimental design and results for microwave extracting of Anoectochilus roxburghii.
The absolute values of coefficients directly reflect the impact of each factor on the response value from the equation, while the sign (positive or negative) of the coefficient reflects the orientation. The formula shows that time and microwave power has an equally strong effect on the extraction of total phenolics from A. roxburghii. Solid–liquid ratio has less effect, while the ethanol concentration has the least effect (Zheng et al., 2009).
Validity of the Regression Model and Significance
The total phenolics yield was expressed as the percent ratio. It can be seen from Table 1 that the measured polyphenols yields varied from 0.6743 to 1.2476% for the 30 experiments. The design matrix and the ANOVA results for the quadratic regression equation, and the influence of the various factors on the yield of total phenolics (Table 2). The model F-value of 3.11 implies the model terms are highly significant. There is only a 1.85% chance that a “model F-Value” this large could occur due to noise. According to the P-value, factors A2, B2, C2 are very significantly different (P < 0.01), the A is significantly different (P < 0.05). In addition, the variance of the quadratic regression model yielded a determination coefficient (R2) of 0.7435 and the coefficient of variation (CV) reflects the confidence level of the model was 11.82%. These values indicate the polynomial equation is generally adequate to describe the experimental results. “Adeq Precision” measures the signal to noise ratio. A ratio greater than 4 is desirable. The Adeq Precision of 6.771 indicates an adequate signal. This model can be used to navigate the design space (Liyana-Pathirana and Shahidi, 2005; Lin et al., 2015).
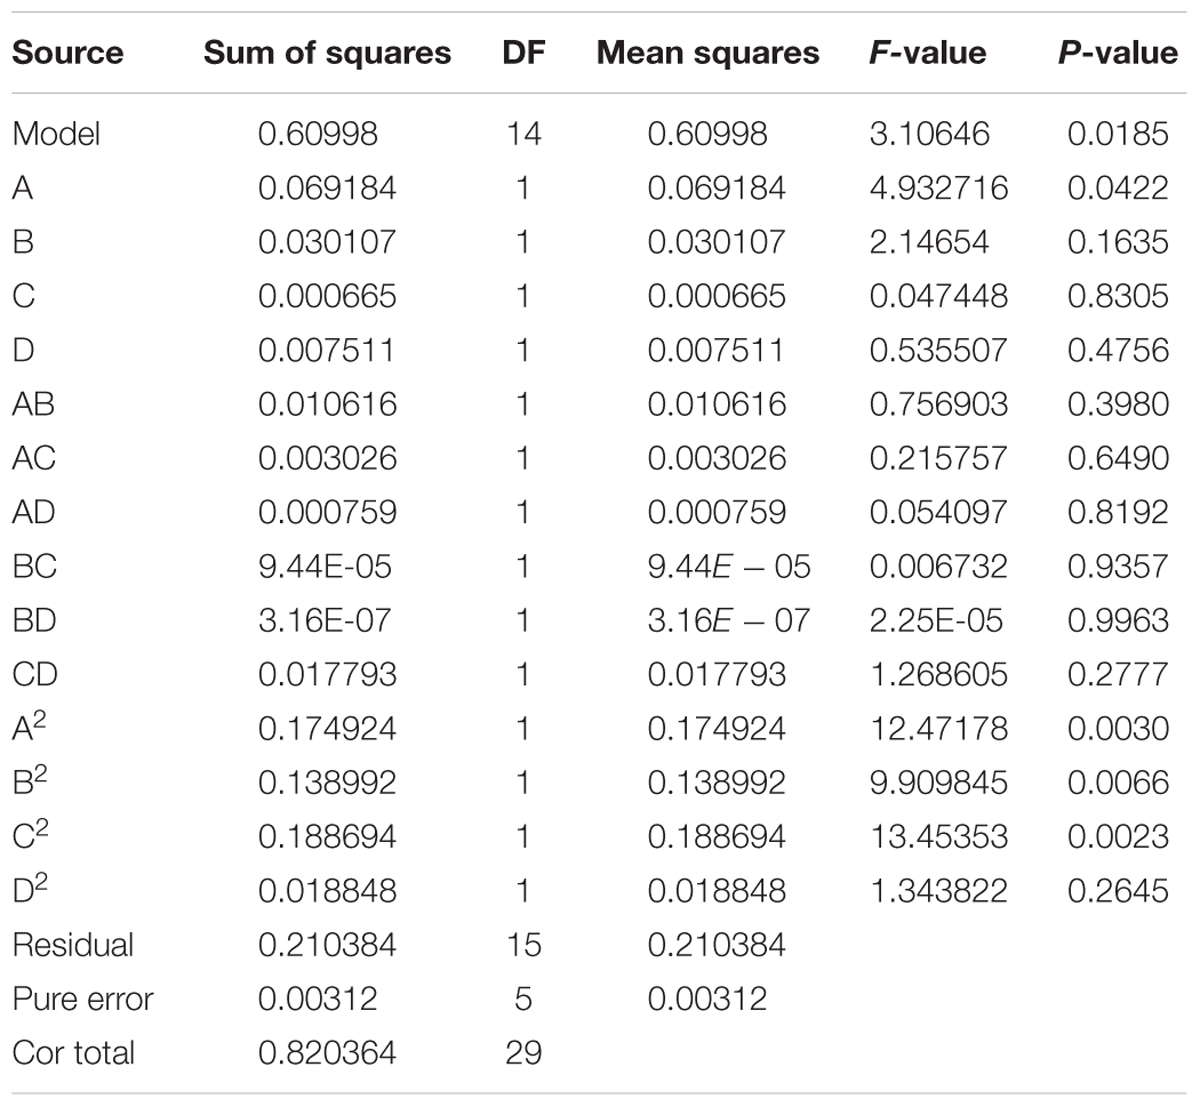
TABLE 2. Analysis regression model of relationship between variables and independent variable.
Analysis of Response Surfaces
To illustrate the interactive effects of the independent variables and their mutual interaction on the extraction of total phenolics, three-dimensional response surface profiles of multiple non-linear regression models were plotted (Figure 1). Figures 1A–C depicts the interactions between the ethanol concentration and each of the other three factors based on the recovery of total phenolics. Figure 1A shows the extraction yield of total phenolics initially increased with increased extraction time and microwave power, and then decreased. The two curves have the same trend, and the contour lines show that these two factors have the same impact on total phenolics yield. Microwave power directly influences the molecular disruption, and allows total phenolics to dissolve quickly. Excessive microwave power will cause the extraction to overheat and cause phenolic compounds to decompose, thereby lowering the rate of total phenolics extraction. Prolonged microwave treatment is likely to damage total phenolics structure, and this would also reduce the extraction yield of total phenolics. Figure 1B shows that when the solid–liquid ratio was not constant, the total phenolics ratio increased over time and then dropped slightly, characterized by steep surfaces. When extraction time did not change, the total phenolics rate first increased and then decreased with increasing solid–liquid ratio, which gave a gentle performance curve. When the solid–liquid ratio was too high, the concentration of total phenolics gradient dropped so that there was little driving force for total phenolics to go into solution. The contours show that altering the extraction time is more efficient than altering the solid–liquid ratio to improve the extraction yield. When the ethanol concentration increased from 65 to 85% (Figure 1C), the extraction yield increased gradually as the extraction time increased, and reached a peak at about 40 min. Beyond this time, the yield began falling. This yield trend is attributed to increased extraction time. Figure 1D shows that adjustment of microwave power is more efficient than adjusting the solid–liquid ratio in optimizing extraction total phenolics extraction. Figures 1E,F shows that the influence of microwave power and solid–liquid ratio were more obvious than ethanol concentration. The yield of total phenolics increased with alcohol concentration, and reached a peak which the microwave power was 300–400 W and the solid–liquid ratio ranged between 1:50 and 1:60, after which the yield began to fall.
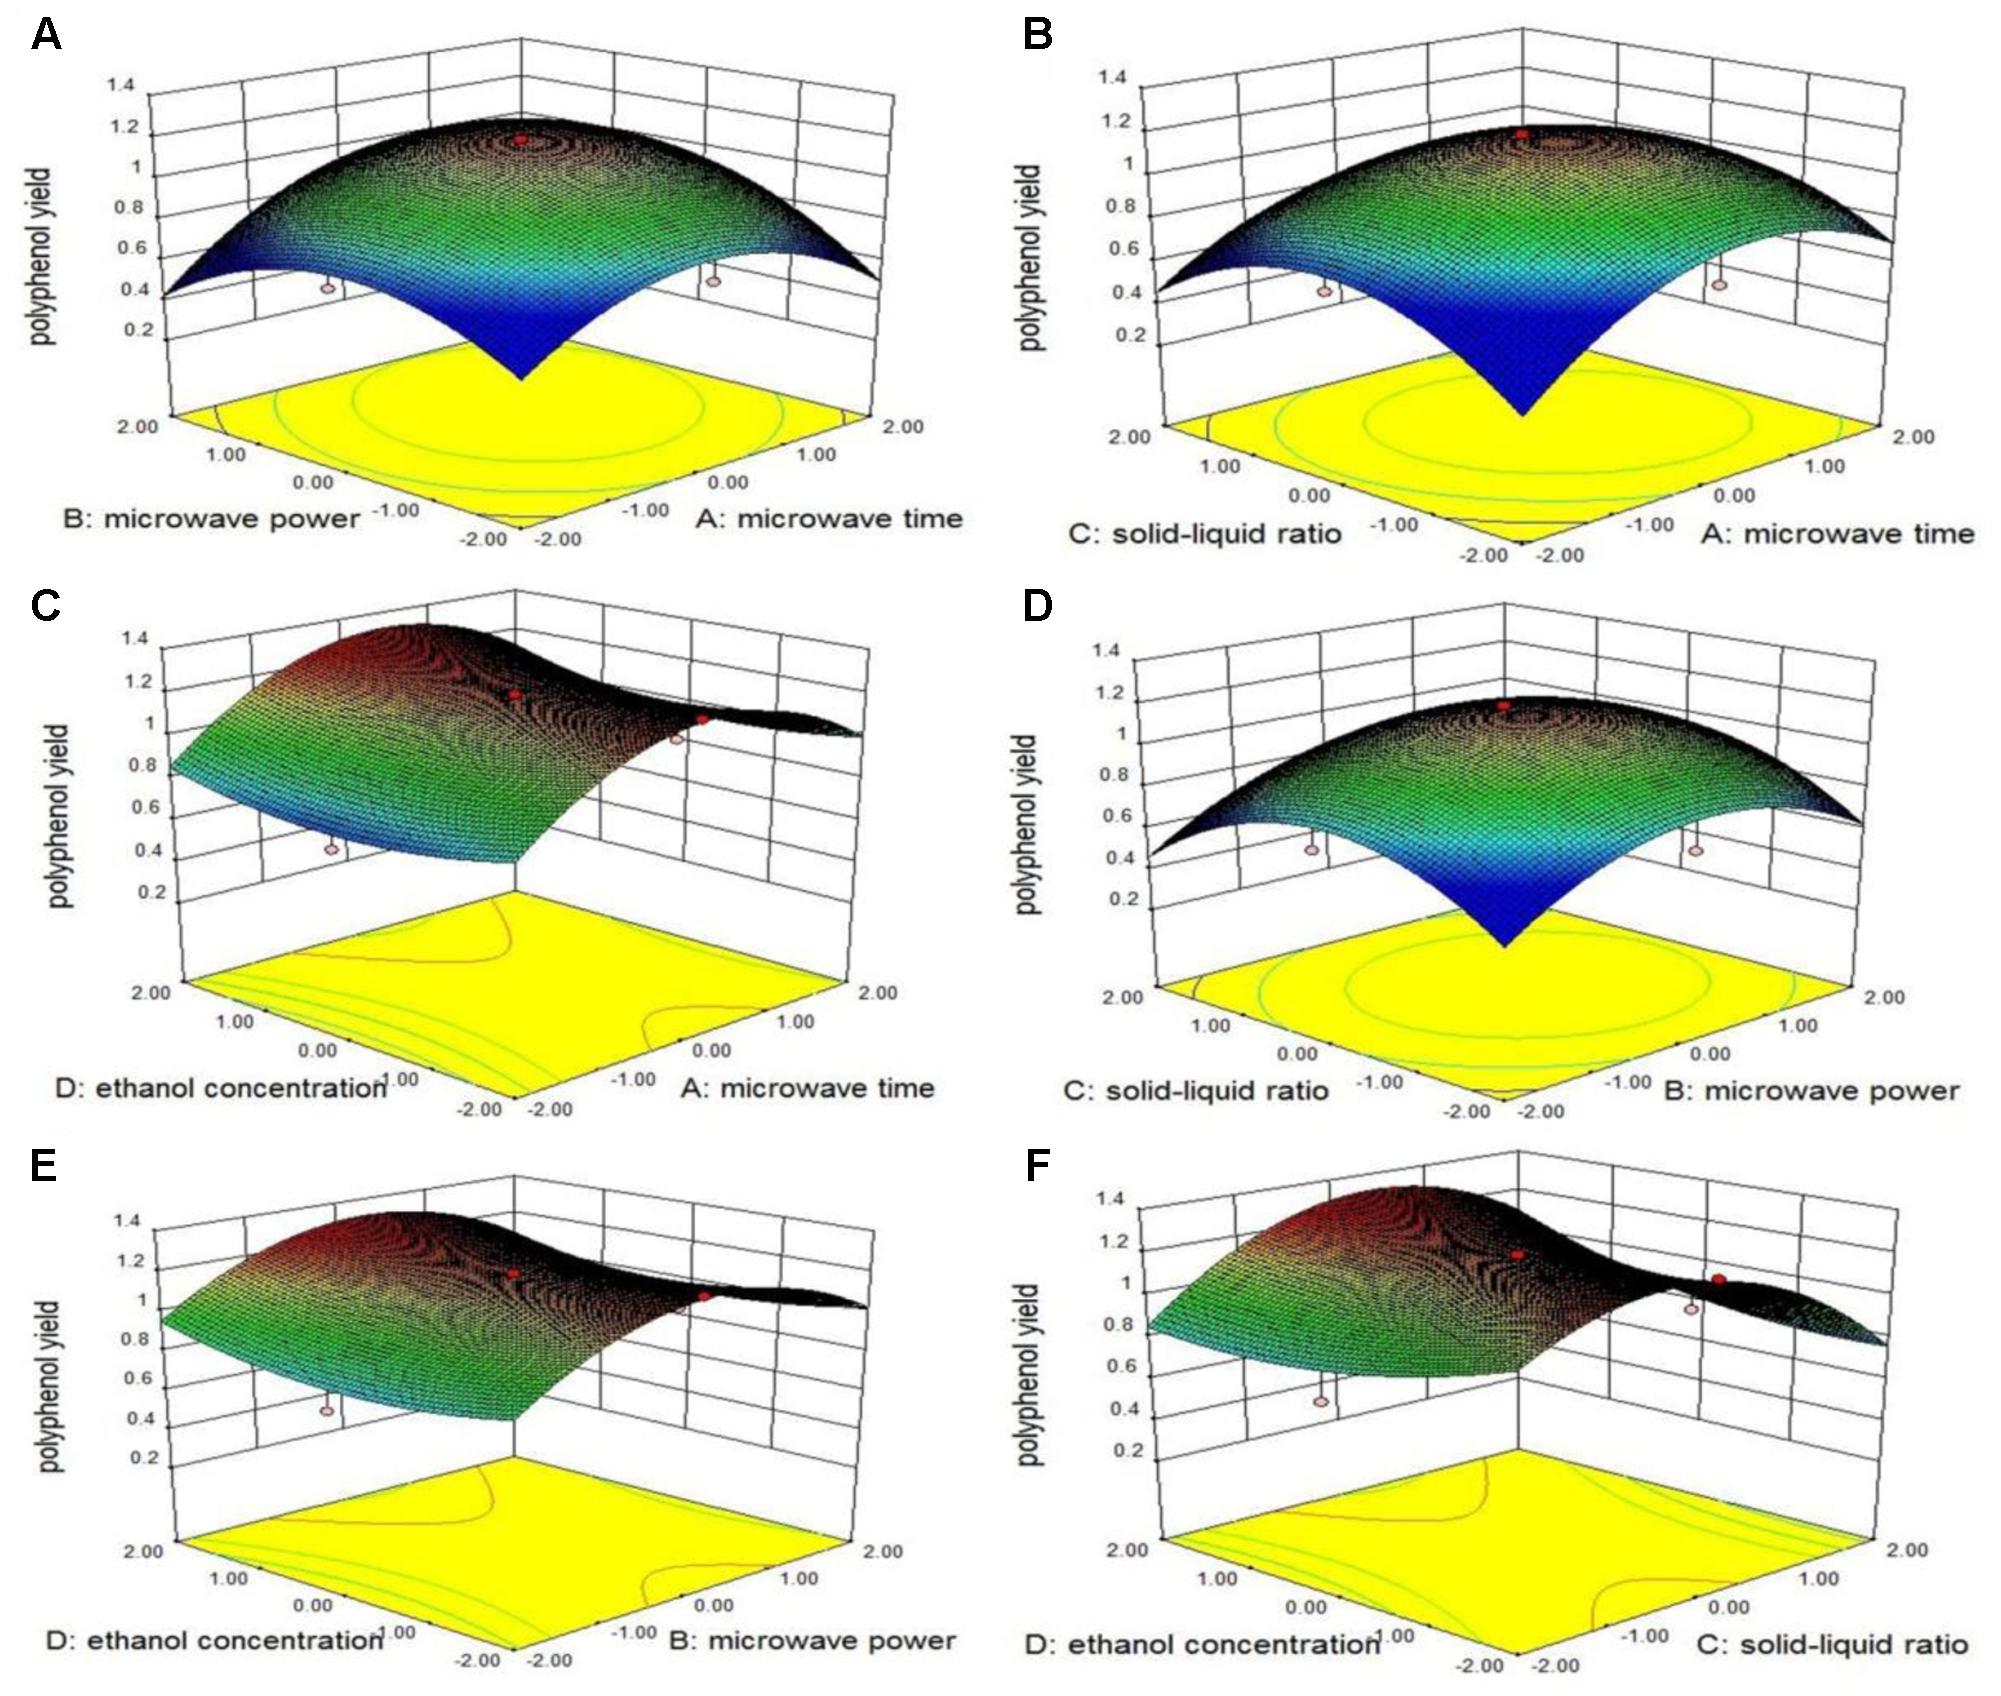
FIGURE 1. Response surface plots show the interaction among extraction time, microwave power, solid–liquid ratio, alcohol concentration and their effect on the extraction yield of A. roxburghii.
Verification Experiments
The quadratic regression modes to predict that the optimal extraction conditions for MAE of A. roxburghii were: time, 37.55 min; microwave power, 320 W; solid–liquid ratio, 1:65.50; ethanol concentration, 83.90%. The theoretical total phenolics extraction yield under these conditions was 1.31%. These conditions were also used to predict the values of the responses using the model equation. The mean extraction yield of polyphenols was 1.31%, which is in good agreement with the predicted value, and confirms the adequacy of the model (Maran et al., 2013; Mat Nor and Arof, 2016).
Antioxidant Activity In Vitro
The scavenging capacity of A. roxburghii extract on DPPH free radical had been showed in Figure 2A. At the same concentration, the VC solution has more scavenging power against the DPPH free radical than the total phenolics solution of A. roxburghii, although both showed increased activity with increased concentration. The DPPH scavenging activity of VC reached 93.04% at the concentration of 0.01 mg mL-1, while the activity reached 95.52% at the concentration of 0.50 mg mL-1. The scavenging capacity of A. roxburghii increased rapidly up to 0.10 mg mL-1, but then increased more slowly. The clearance rates were 82.19 and 82.58% when the concentrations were 0.50 and 1.00 mg mL-1, respectively, indicating a balance point.
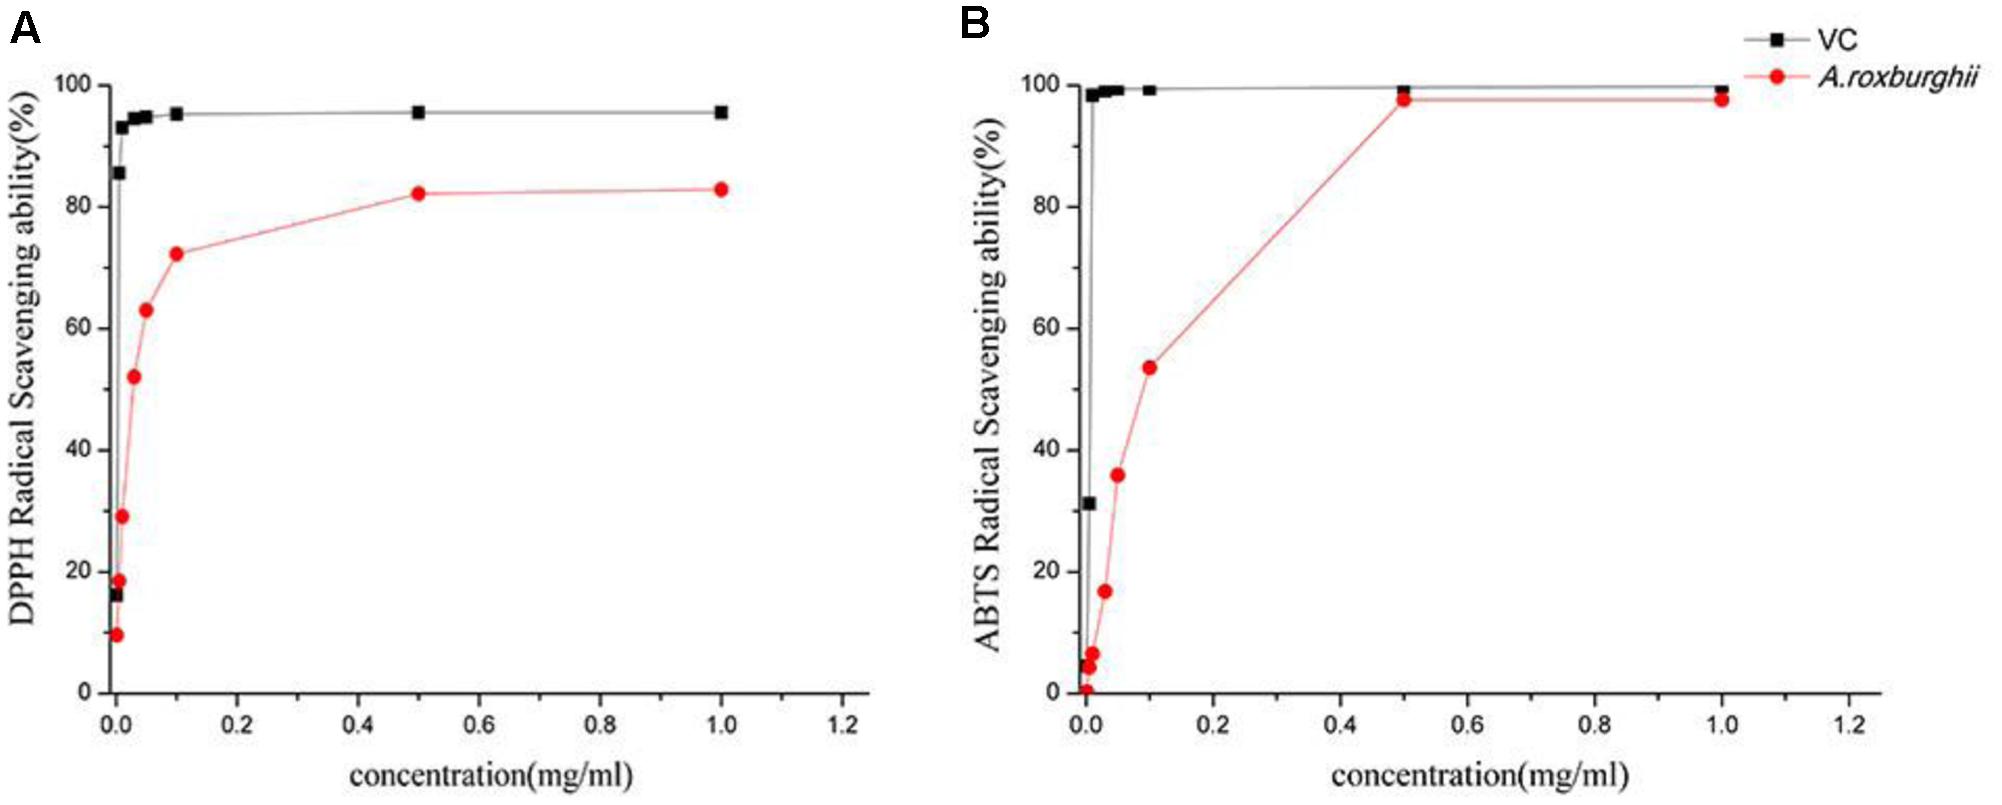
FIGURE 2. Scavenging capacity of DPPH (A) and ABTS (B).
The total phenolics solution of A. roxburghii and VC all can clear the ABTS free radical which is shown in Figure 2B (Aprotosoaie et al., 2015) the solutions showed strong antioxidant activity, and radical clearance increased with increasing concentration. The antioxidant capacity of VC increased rapidly to 98.38% at a concentration of 0.01 mg mL-1, whereas the ABTS+ clearance rate of the A. roxburghii polyphenol solution rose relatively slowly. At 0.5 mg mL-1, the clearance reached 97.63% and later achieved equilibrium. The antioxidant level of A. roxburghii polyphenols was very close to that of VC until it reached equilibrium.
Antioxidant Activity In Vivo
The total phenolics extraction of A. roxburghii had some effect on serum and liver tissues of mice, as reflected by the activities of T-SOD and GSH-Px and the content of MDA (Figure 3). The content of MDA was significantly increased, and the activities of T-SOD and GSH-Px were obviously reduced, indicating that some lipid molecules had been attacked by free radicals. At the same time, the antioxidant enzymes had been consumed because of the excessive production of free radicals. While this result illustrated the validity of the oxidative damage model, compared with the model group, three different dose groups of total phenolics extraction from A. roxburghii all reduced the content of MDA in serum and liver tissue. In particular, the medium-dose and low-dose groups showed significant drops, and the enzyme activity of T-SOD and GSH-Px showed large increased. The MDA content reached 6.68 nmol mL-1 in serum while the low-dose and medium-dose groups reached 4–5 nmol mL-1. The MDA content reached 26.53 nmol mL-1 in liver tissue while the low dose-group reached 15.34 nmol mL-1. Each dose increased the activities of T-SOD and GSH-Px to different levels in serum and liver tissue. The T-SOD activity of liver tissue in the medium-dose group reached 188.05 U mL-1. The GSH-Px activities for the low-dose and medium-dose groups were all more than 25 U mL-1 in serum, and the activity in liver tissue for the low-dose group was stronger than the others (19.03 U mL-1). These results indicated that the total phenolics extracted yield could improve the antioxidant ability in mice. The extract showed significant antioxidant activity in the body, as indicated by MDA and GSH-Px, particularly for the low-dose group. The results for T-SOD suggest that the middle-dose group was the best choice, but there results between the low-dose and middle-dose groups for T-SOD in the liver were not obviously different. For the high-dose group, the T-SOD and GSH-Px activities were lower in serum and liver homogenate and MDA content was higher than in the other two dose groups.
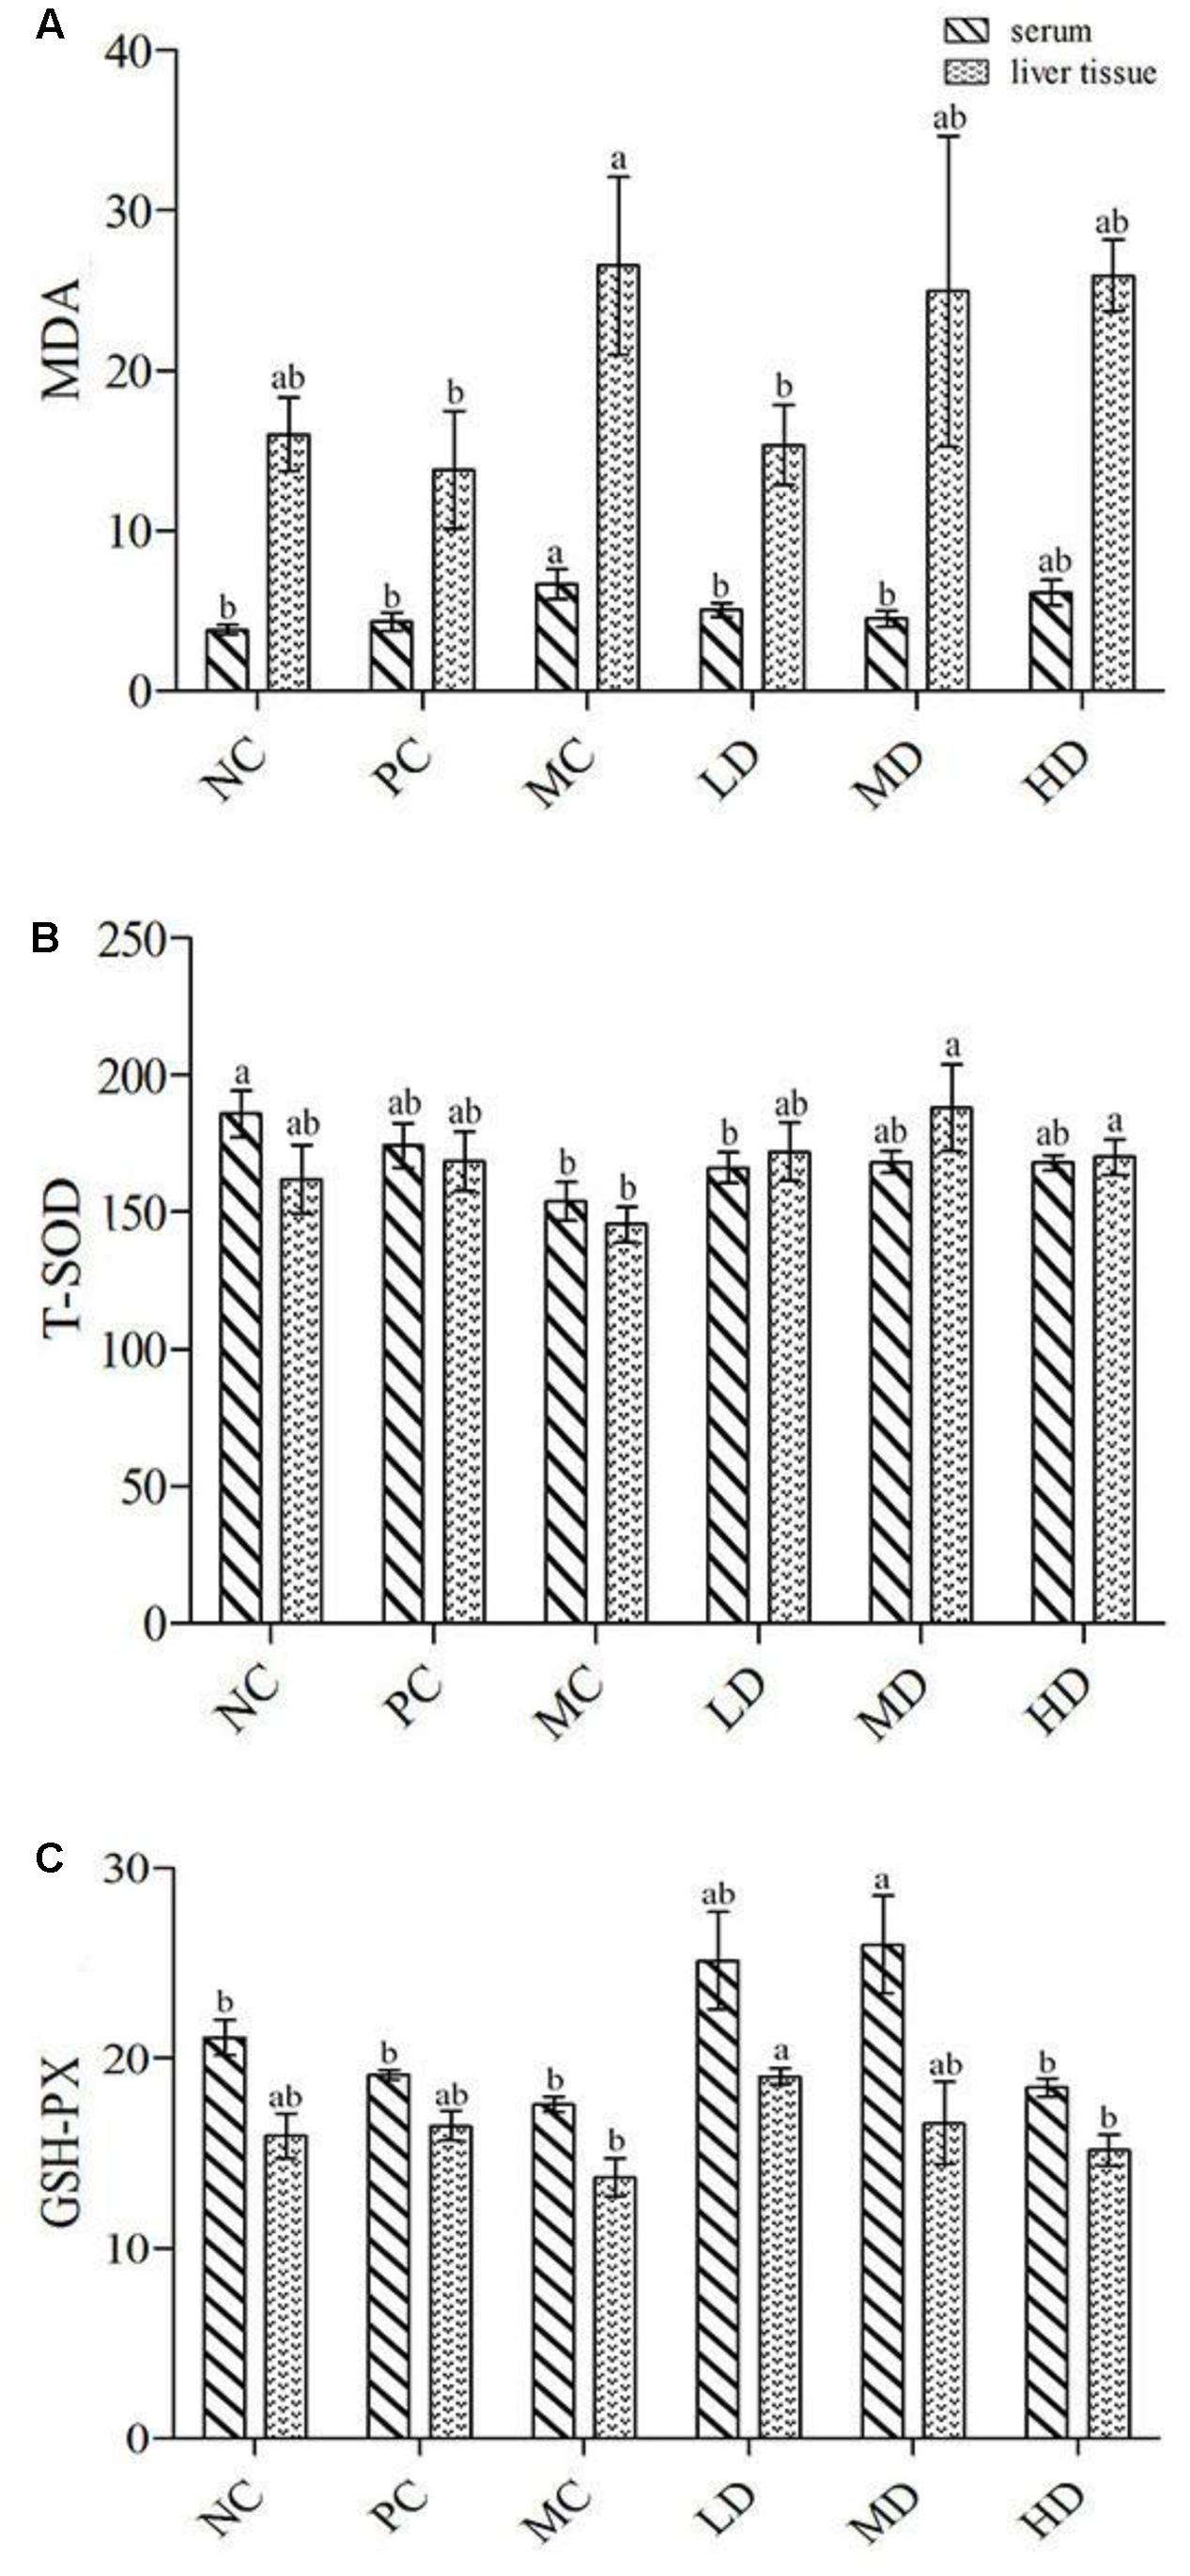
FIGURE 3. The value of (A) MDA, (B) T-SOD, and (C) GSH-PX from serum and liver tissue.
Identification of Phenolic Compounds
UPLC systems however are designed to use columns with smaller particle sizes at higher pressures while Q-TOF is superior to make mass measurement with accuracy below 5 ppm for small molecules, thus facilitating greater resolution, sensitivity and speed when analyzing extracts from A. roxburghii. The identification and characterization of compounds was done by comparison of their retention times, UV spectrum and MS/MS data with isolated reference compounds and information available in literature. The phenolic compounds of A. roxburghii were characterized in negative ion modes. The negative ion mode of MS/MS analysis of extracts of A. roxburghii showed deprotonated [M-H]- molecules (Figure 4). The identified phenolic compounds of A. roxburghii were listed in Table 3. Figure 5 shows a representative example of the identity of phenolic compounds confirmed based on MS2 fragmentation pattern (rutin fragmentation pathway in negative ion modes). MS data revealed a molecular ion at 609 m/z, and MS2 data showed two fragment ions at m/z 301 [M-C12H21O9]- and 309 [C12H21O9]-, which represented the quercetin and rutinose fragmentations of compound, respectively. The compound was identified as rutin by comparison to the authentic standard. In the present work, 21 phenolic compounds have been identified in A. roxburghii by using the combination of MS and MS/MS data and the information previously reported in the literature. The phenolic compounds such as rutin, quercetin, gallic acid, chlorogenic acid, and kaempferol detected in A. roxburghii are widely accepted as medicinally important compounds (Dai and Mumper, 2010). From the result, A. roxburghii possesses medicinally important polyphenols.
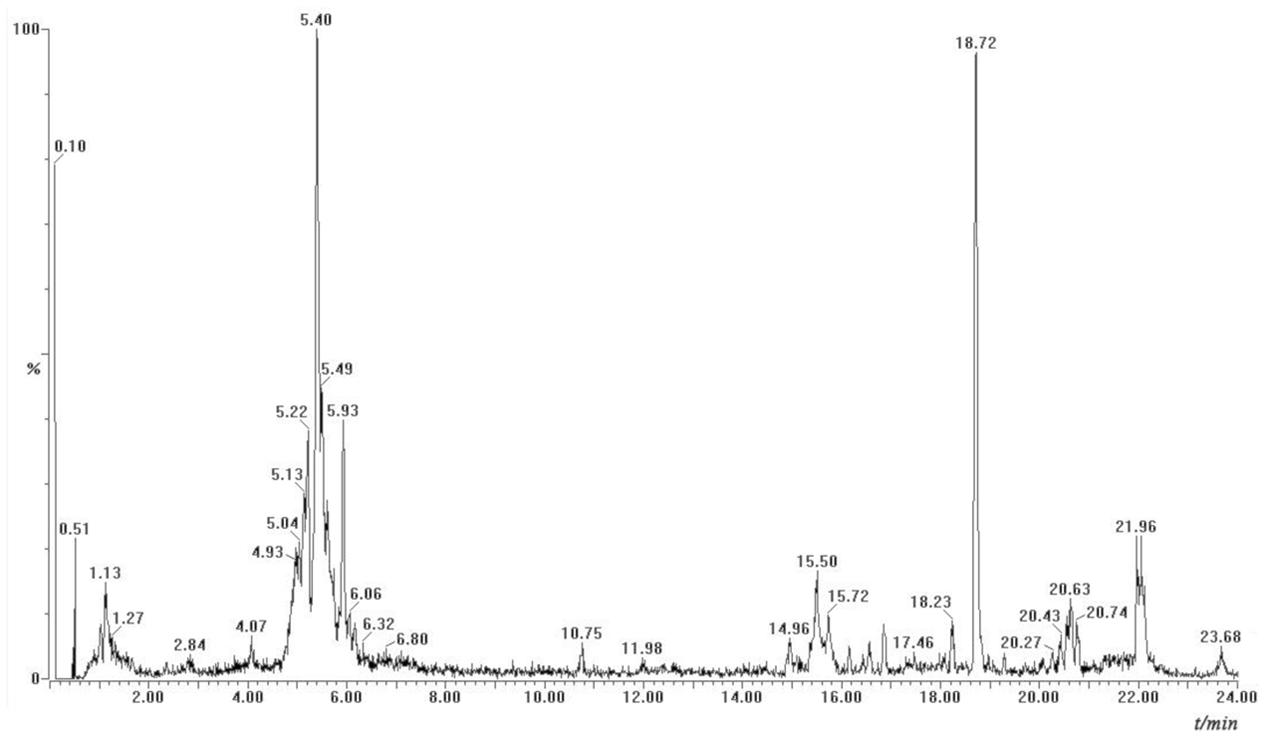
FIGURE 4. UPLC mass chromatogram in negative ion modes.
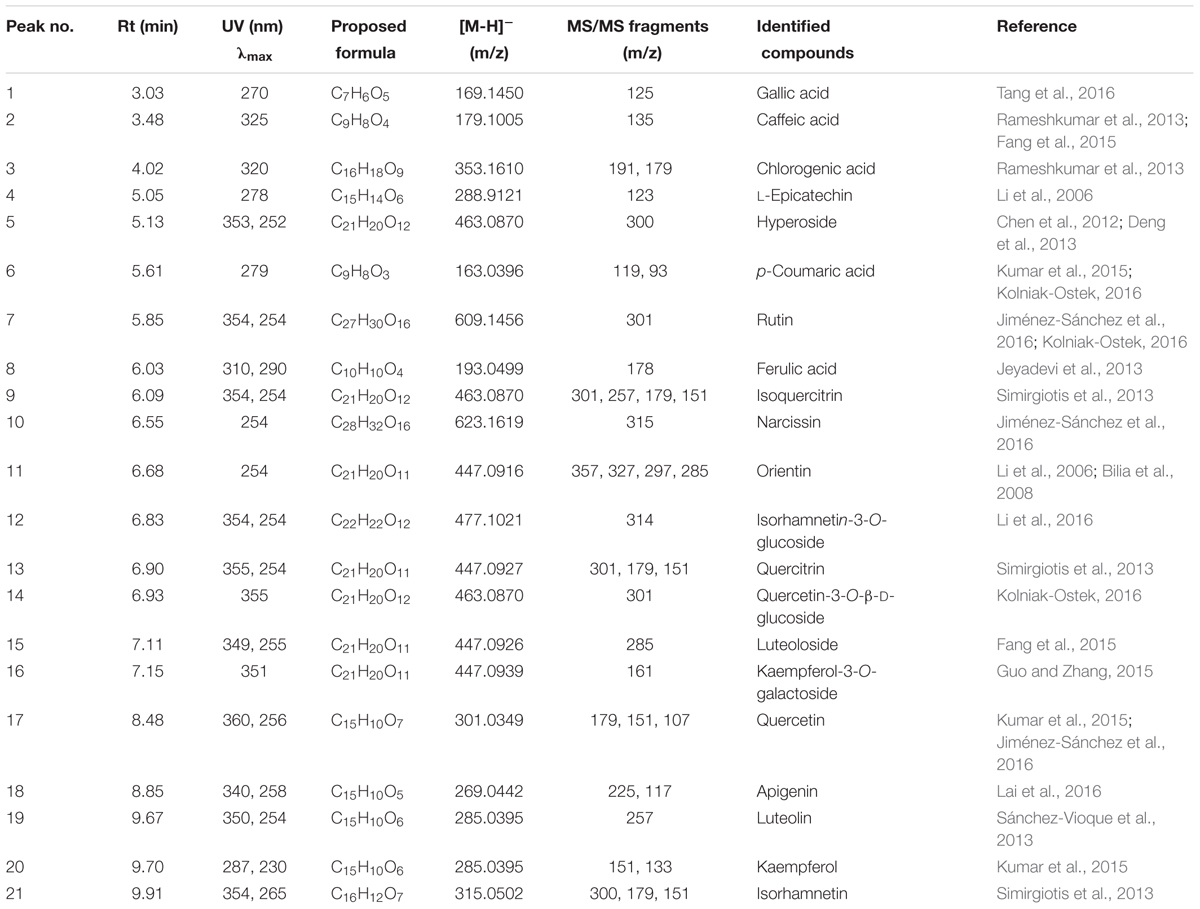
TABLE 3. The components identified by UPLC-Q-TOF-MS/MS in A. roxburghii.
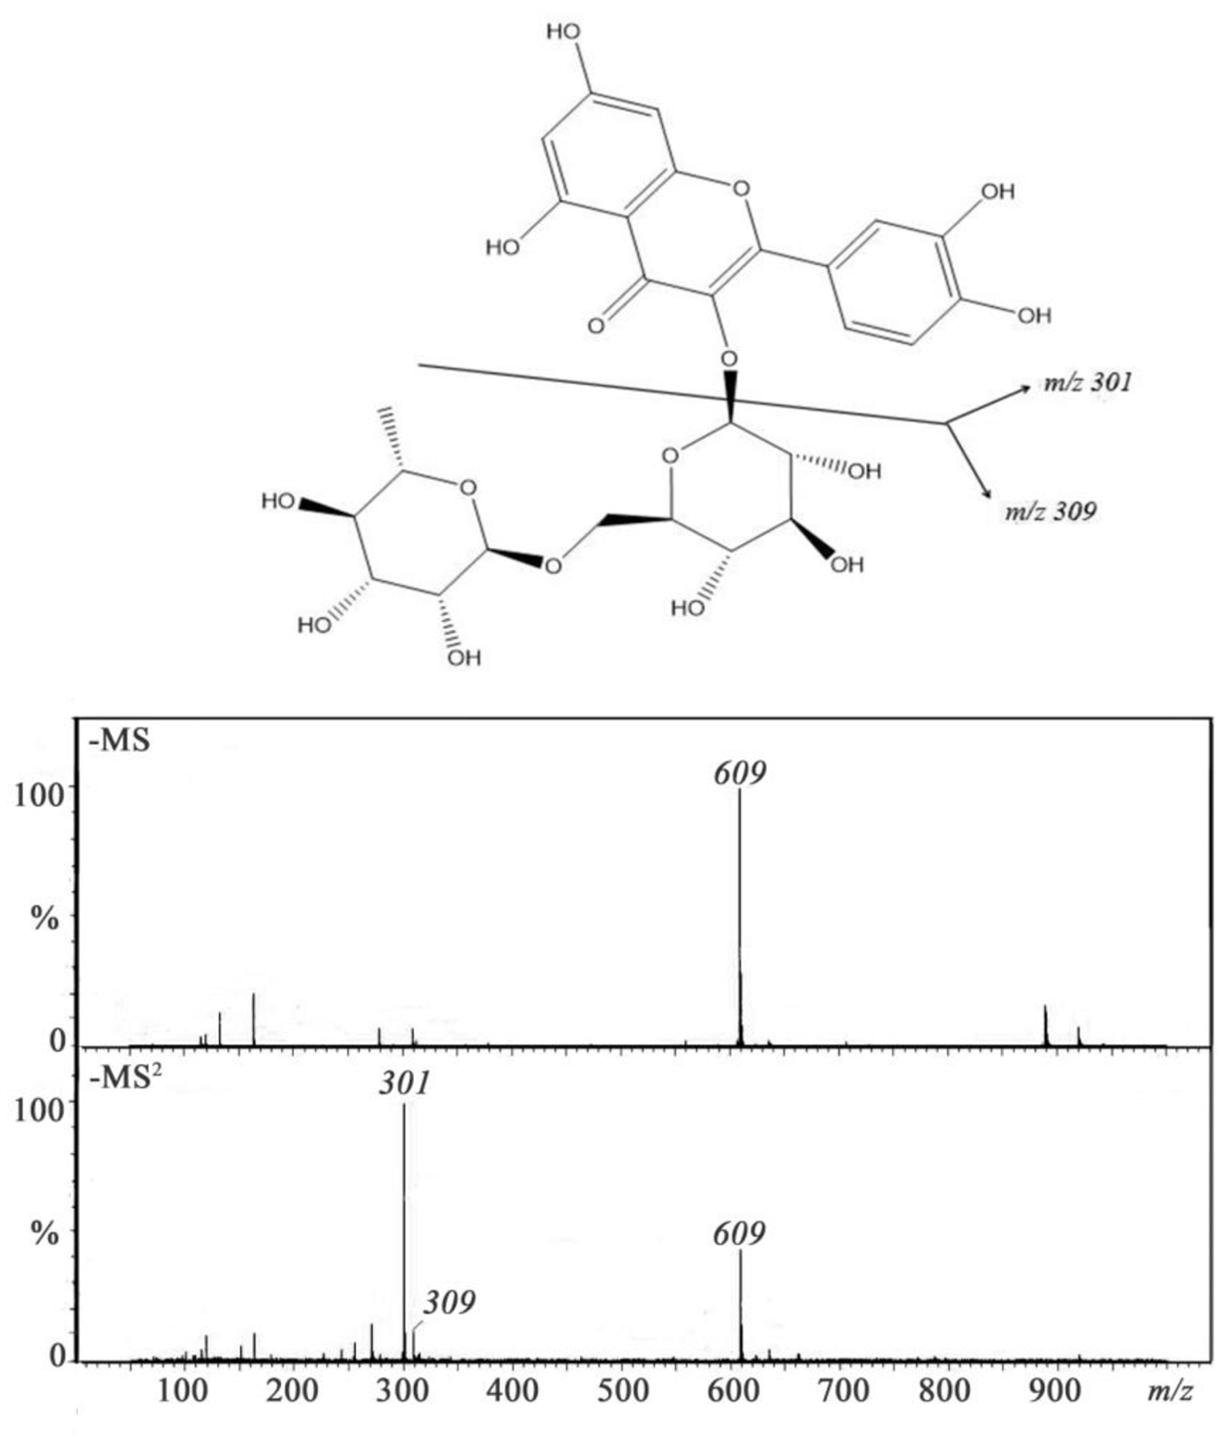
FIGURE 5. Mass spectra (MS and MS2) of rutin and possible fragmentation pathway.
Discussion
To maximize the extraction of active ingredients from plants, the choice of extraction method is very important. In recent years, considerable efforts have been made by researchers from diverse backgrounds to optimize the extraction process (Pan et al., 2003). At present, MAE, a new extraction technology that combines microwave treatment with traditional extraction methods, is widely used to extract the active ingredients in plants (Jafarifar et al., 2005). On a macroscopic level, microwave energy penetrates evenly into the extraction mixture, and, microscopically, microwave heating generates an electromagnetic field that can accelerate the diffusion of analytes and increase the efficiency of the extraction (Chen et al., 2015). The four factors were extraction time (5–65 min), microwave power (100–500 W), solid–liquid ratio (1:40 to 1:80), and ethanol concentration (65–85%) which could reduce the extraction cost and time that compared with the traditional extraction method.
Expected the extraction method, the choice of analysis methods is also crucial. RSM is applied to each neighborhood as a new analysis method to extract the flavonoids, polyphenols, and polysaccharides in plants or herbs. Therefore, it had been found by some test and verify that the response surface methodology is a highly accurate and good optimization effect, which is suitable for popularization and application in the optimization of process parameters. Some research both at home and abroad has attempted to optimize the extraction of A. roxburghii, to obtain the effective components, but mainly through orthogonal experimental design rather than RSM (Zhao et al., 2008; Zeng et al., 2016). Some studies on optimization of A. roxburghii have used RSM for aqueous extraction, but studies on ethanol extraction have not been reported. Orthogonal test design focused on how to arrange reasonably and to take into account several factors to determine the best combination, but a clear regression over a wide range of conditions is not achieved. Only discrete data can be analyzed and accuracy and predictability are not high. This study only need 30 experimental groups to reach a conclusion that the optimum extraction conditions for MAE of A. roxburghii are: time, 37.55 min; microwave power, 320 W; solid–liquid ratio, 1:65.50; ethanol concentration, 83.90%, and the total phenolics extraction yield is 1.31%.
Researchers have performed preliminary studies on the chemical compounds of A. roxburghii, including phenolic, polysaccharides, triterpenoids, amino acids, etc. In our preliminary study, we confirmed that A. roxburghii was rich in phenolic compounds. Phenolic compounds are considered to have many functions, such as removing active oxygen, preventing hemal sclerosis, improving nutrition for tissue, antiaging and preventing aging dementia. However, limited studies explored the mechanism by which the compounds regulate the antioxidant defense system in vivo and in vitro.
In this experiment, antioxidant activity in vitro was determined by DPPH and ABTS methods. DPPH free radical is commonly used to screen free radical scavengers and evaluate the antioxidant capacity (Singh et al., 2016). The electronic structure of DPPH free radical gives a dark color in ethanol solution, but combination with a lone electron of an antioxidant lightens the color significantly. Accordingly, the degree of color change can be used to assess the antioxidant activity. Determine the absorbance which showed a strong antioxidant activity, when the concentration of A. roxburghii was 0.5 mg mL-1 the clearance rate was reached 82.19%. DPPH method is widely used in the determination of antioxidant activity in vitro, and in some article we could find that Cordyceps mycelium scavenging effect on DPPH only reached 70% when the concentration of alcohol extraction was 16 mg mL-1 (Li et al., 2010). Another research reported that Ganoderma lucidum extraction on the scavenging rate of DPPH radical; it can be seen that when the concentration was 0.5 mg mL-1, the scavenging capacity was 60%, and when the concentration was reached 1 mg mL-1, the scavenging capacity was more than 80%. Even when the concentration of Ganoderma atrum was reached 1 mg mL-1, it reached more than 90% (Gong et al., 2006). The extract from A. roxburghii although did not reach more than 90% of the removal rate, but compared with these precious medicinal materials, the antioxidant capacity of A. roxburghii also has broad prospects. ABTS is one of the common antioxidant indexes in vitro, and the principle is that ABTS+ will produce a stable free radical with a bluish-green color in an oxidizing environment. After combination with radical scavenger, the solution color weakens, and the decline in color can be used to evaluate antioxidant activity against ABTS+ free radical. We can see from the results that ABTS+ exhibited stronger scavenging activity which has reached the level of 97.63% when the concentration of 0.5 mg mL-1. So the antioxidant capacity of the extract of A. roxburghii need further study and deep measurement.
MDA, T-SOD, GSH-Px are the main index in vivo antioxidant assay. MDA is a lipid peroxide that is formed by enzymatic and non-enzymatic reaction to produce oxygen free radicals to attack polyunsaturated fatty acids and cause the lipid peroxidation in the body. The content of MDA can reflect the degree of lipid peroxidation in the body and can be used to infer the degree of damage to the cellular structure (Liao et al., 2014). T-SOD plays a very important role in regulating the balance of in vivo oxidation. This enzyme can protect cells from free radicals and its activity is an indicator of the body’s antioxidant level. This also provides a measure of aging and closeness to death (Cui et al., 2013). GSH-Px exists in many organisms to catalyze the decomposition of hydrogen peroxide in the body and thereby prevent damage to cell membrane. This enzyme plays an important role in maintaining cell viability (Shen et al., 2016). In the previous study, the method has been determined the antioxidant in vivo only for water extraction, alcohol extraction has not been studied (Cui et al., 2013). Therefore, this method is adjusted and modified according to its method and other related methods for in vivo antioxidant assay. This paper results were similar to other studies that the higher of MDA content, the more serious of injury in mice, and the higher T-SOD and GSH-Px value showed that the mice had improved oxidative damage in some extent. So it could be found in this study that the low and medium dose groups of A. roxburghii had improved oxidative stress condition. On the other hand, the high dose group may have increased damage due to excessive blood concentration or excess antioxidants (Abdelgawad et al., 2016). Therefore, our body needs a small amount of antioxidants, should not be too much.
This is the first report on phenolic compounds detected by UPLC-Q-TOF-MS/MS analysis for A. roxburghii. In the present work, 21 phenolic compounds had been identified in A. roxburghii. Compared with other analytical methods, possible active substances were obtained more quickly (Singh et al., 2016). Due to the lack of relevant standard products, other substances mainly speculate the possible structure by the fragmentation law of ion fragments of the one level and two levels mass spectra. The results obtained can provide a reference and direction for further research on oxidized monomers.
Conclusion
The RSM is utilized to optimize the process condition on yield of MAE are 37.55 min, 320 W, 1:65.5, and 83.90%, and the total phenolics yield was 1.31%. DPPH maximum clear rate reached 82.58% and ABTS+ was 97.63% which could be drawn a conclusion that A. roxburghii had a strong antioxidant impression. Serum and liver homogeneous (10%) of mouse were detected as MDA, T-SOD, and GSH-PX the middle and low-dose groups had high ability to clear free radicals. In short, total phenolics extracted from A. roxburghii showed a strong antioxidant activity both in chemical simulation system and in vivo–in vitro assays systems. An improved method utilizing UPLC-Q-TOF-MS/MS was developed for the simultaneous identification the compound in A. roxburghii. The developed method identified 21 phenolic compounds in A. roxburghii. This could provide reference for the development of A. roxburghii as food additives and nature antioxidants in the future.
Compliance with Ethical Standards
All applicable international, national, and institutional guidelines for the care and use of animals were followed. This article does not contain any studies with humans performed by any of the authors.
Author Contributions
The first author MX mainly responsible for the operation of the whole experiment and the writing of the paper. SY, SL, and YL mainly responsible for assisting the first author in the experiment. QS, MD, and MW mainly responsible for providing technical guidance and experimental materials.
Conflict of Interest Statement
The authors declare that the research was conducted in the absence of any commercial or financial relationships that could be construed as a potential conflict of interest.
Acknowledgments
This work was supported by the National Natural Science Foundation of China (81303167, 81673531), the Key Research and Development Plan Project of Zhejiang Province (2017C02012, 2017C02019). We thank the anonymous reviewers for carefully reviewing our manuscript and making many valuable suggestions.
References
Abdelgawad, H., Zinta, G., Hegab, M. M., Pandey, R., Asard, H., and Abuelsoud, W. (2016). High salinity induces different oxidative stress and antioxidant responses in maize seedlings organs. Front. Plant Sci. 7:276. doi: 10.3389/fpls.2016.00276
Adams, M., and Ghaly, A. E. (2007). Maximizing sustainability of the Costa Rican coffee industry. J. Clean. Prod. 15, 1716–1729. doi: 10.1016/j.jclepro.2006.08.013
Aprotosoaie, A. C., Mihai, C. T., Vochita, G., Rotinberg, P., Trifan, A., Luca, S. V., et al. (2015). Antigenotoxic and antioxidant activities of a polyphenolic extract from European Dracocephalum moldavica L. Ind. Crop. Prod. 79, 248–257. doi: 10.1016/j.indcrop.2015.11.004
Bilia, A. R., Giomi, M., Innocenti, M., Gallori, S., and Vincieri, F. F. (2008). HPLC-DAD-ESI-MS analysis of the constituents of aqueous preparations of verbena and lemon verbena and evaluation of the antioxidant activity. J. Pharm. Biomed. Anal. 46, 463–470. doi: 10.1016/j.jpba.2007.11.007
Chen, A. R., Wang, S. X., Zhang, L. B., and Peng, J. H. (2015). Optimization of the microwave roasting extraction of palladium and rhodium from spent automobile catalysts using response surface analysis. Int. J. Miner. Process. 143, 18–24. doi: 10.1016/j.minpro.2015.08.007
Chen, S., Fang, L. H., Xi, H. F., Guan, L., Fang, J. B., Liu, Y. L., et al. (2012). Simultaneous qualitative assessment and quantitative analysis of flavonoids in various tissues of lotus (Nelumbo nucifera) using high performance liquid chromatography coupled with triple quad mass spectrometry. Anal. Chim. Acta 724, 127–135. doi: 10.1016/j.aca.2012.02.051
Cui, S. C., Yu, J., Zhang, X. H., Cheng, M. Z., Yang, L. W., and Xu, J. Y. (2013). Antihyperglycemic and antioxidant activity of water extract from Anoectochilus roxburghii in experimental diabetes. Exp. Toxicol. Pathol. 65, 485–488. doi: 10.1016/j.etp.2012.02.003
Dai, J., and Mumper, R. J. (2010). Plant phenolics: extraction, analysis and their antioxidant and anticancer properties. Molecules 15, 7313–7352. doi: 10.3390/molecules15107313
Deng, J., Chen, S., Yin, X. J., Wang, K., Liu, Y. L., Li, S. H., et al. (2013). Systematic qualitative and quantitative assessment of anthocyanins, flavones and flavonols in the petals of 108 lotus (Nelumbo nucifera) cultivars. Food Chem. 139, 307–312. doi: 10.1016/j.foodchem.2013.02.010
Dolinsky, M., Agostinho, C., Ribeiro, D., Rocha, G. D. S., Barroso, S. G., Ferreira, D., et al. (2015). Effect of different cooking methods on the polyphenol concentration and antioxidant capacity of selected vegetables. J. Cult. Sci. Technol. 14, 1–12. doi: 10.1080/15428052.2015.1058203
Du, X. M., Irino, N., Furusho, N., Hayashi, J., and Shoyama, Y. (2008). Pharmacologically active compounds in the Anoectochilus and Goodyera species. J. Nat. Med. 62, 132–148. doi: 10.1007/s11418-007-0169-0
Fang, X. S., Wang, J. H., Hao, J. F., Li, X. K., and Guo, N. (2015). Simultaneous extraction, identification and quantification of phenolic compounds in Eclipta prostrata using microwave-assisted extraction combined with HPLC-DAD-ESI-MS/MS. Food Chem. 188, 527–536. doi: 10.1016/j.foodchem.2015.05.037
Galano, A., Tan, D. X., and Reiter, R. J. (2011). Melatonin as a natural ally against oxidative stress: a physicochemical examination. J. Pineal Res. 51, 1–16. doi: 10.1111/j.1600-079X.2011.00916.x
Gong, X. F., Xie, M. Y., and Chen, Y. (2006). Comparison of the anti-oxidative effects of extracts from Ganoderma atrum and Ganoderma lucidum. Food Sci. 27, 44–46.
Guo, L. Q., and Zhang, L. L. (2015). Chemical constituents of flavonoids from Lysimachia barystachys bunge. Biomass Chem. Eng. 49, 40–44.
Jafarifar, D., Daryanavard, M. R., and Sheibani, S. (2005). Ultra fast microwave-assisted leaching for recovery of platinum from spent catalyst. Hydrometallurgy 78, 166–171. doi: 10.1016/j.hydromet.2005.02.006
Jeyadevi, R., Sivasudha, T., Rameshkumar, A., and Dinesh, K. L. (2013). Anti-arthritic activity of the Indian leafy vegetable Cardiospermum halicacabum in Wistar rats and UPLC–QTOF–MS/MS identification of the putative active phenolic components. Inflamm. Res. 62, 115–126. doi: 10.1007/s00011-012-0558-z
Jiménez-Sánchez, C., Lozano-Sánchez, J., Rodríguez-Pérez, C., Segura-Carretero, A., and Fernández-Gutiérrez, A. (2016). Comprehensive, untargeted, and qualitative RP-HPLC-ESI-QTOF/MS2 metabolite profiling of green asparagus (Asparagus officinalis). J. Food Compost. Anal. 46, 78–87. doi: 10.1016/j.jfca.2015.11.004
Khuri, A. I., and Mukhopadhyay, S. (2010). Response surface methodology. Wires Comput. Stat. 2, 128–149. doi: 10.1002/wics.73
Kolniak-Ostek, J. (2016). Identification and quantification of polyphenolic compounds in ten pear cultivars by UPLC-PDA-Q/TOF-MS. J. Food Compost. Anal. 49, 65–77. doi: 10.1016/j.jfca.2016.04.004
Kumar, S., Chandra, P., Bajpai, V., Singh, A., Srivastava, M., Mishra, D. K., et al. (2015). Rapid qualitative and quantitative analysis of bioactive compounds from Phyllanthus amarus using LC/MS/MS techniques. Ind. Crop. Prod. 69, 143–152. doi: 10.1016/j.indcrop.2015.02.012
Lai, L. C., Lin, Y. Y., Chen, F. L., and Lai, X. P. (2016). Analysis of main active components in Desmodii Styraciflii Herba by HPLC-QTOF-MS and HPLC-DAD. Chin. Tradit. Herb. Drugs 47, 3578–3585.
Li, J., Wang, Y., Huang, W. Y., Gu, M. T., Ji, Y. Y., and Zhang, W. M. (2016). Antioxidant activity assay and HPLC-MS analysis of polyphenols constituents of baisha green tea. Chin. J. Trop. Crop. 37, 829–834.
Li, X. L., Zhao, J., Gao, C. C., and Li, D. (2010). Antioxidant activity of Cordyceps ethanol extracts and manufacture of health alcohol. Sci. Technol. Food Ind. 31, 229–231.
Li, X. Q., Xiong, Z. L., Ying, X. X., Cui, L. C., Zhu, W. L., and Li, F. M. (2006). A rapid ultra-performance liquid chromatography-electrospray ionization tandem mass spectrometric method for the qualitative and quantitative analysis of the constituents of the flower of Trollius ledibouri Reichb. Anal. Chim. Acta 580, 170–180. doi: 10.1016/j.aca.2006.07.069
Liao, W. Z., Ning, Z. X., Chen, L. Y., Wei, Q. Y., Yuan, E. D., Yang, J. G., et al. (2014). Intracellular antioxidant detoxifying effects of diosmetin on 2,2-azobis(2-amidinopropane) dihydrochloride (AAPH)-induced oxidative stress through inhibition of reactive oxygen species generation. J. Agric. Food Chem. 62, 8648–8654. doi: 10.1021/jf502359x
Lin, G., Hu, T., Peng, J. H., Yin, S. H., Zhang, L. B., Guo, W. Q., et al. (2015). Optimization of experiments for microwave drying of hydrometallurgy mud using response surface methodology. Arab. J. Sci. Eng. 41, 1–8.
Liyana-Pathirana, C., and Shahidi, F. (2005). Optimization of extraction of phenolic compounds from wheat using response surface methodology. Food Chem. 93, 47–56. doi: 10.1016/j.foodchem.2004.08.050
Lv, T. W., Teng, R. D., Shao, Q. S., Wang, H. Z., Zhang, W. S., Li, M. Y., et al. (2015). DNA barcodes for the identification of Anoectochilus roxburghii and its adulterants. Planta 242, 1167–1174. doi: 10.1007/s00425-015-2353-x
Maran, J. P., Manikandan, S., Thirugnanasambandham, K., Nivetha, C. V., and Dinesh, R. (2013). Box–Behnken design based statistical modeling for ultrasound-assisted extraction of corn silk polysaccharide. Carbohydr. Polym. 92, 604–611. doi: 10.1016/j.carbpol.2012.09.020
Mat Nor, N. A., and Arof, A. K. (2016). Optimization of extraction parameters for anthocyanin from Ixora siamensis by response surface methodology. Opt. Quant. Electron. 48:204. doi: 10.1093/acrefore/9780199381135.013.4577
Mukhopadhyay, S., Luthria, D. L., and Robbins, R. J. (2006). Optimization of extraction process for phenolic acids from black cohosh (Cimicifuga racemosa) by pressurized liquid extraction. J. Sci. Food Agric. 86, 156–162. doi: 10.1002/jsfa.2326
Pan, X. J., Niu, G. G., and Liu, H. Z. (2003). Microwave-assisted extraction of tea polyphenols and tea caffeine from green tea leaves. Chem. Eng. Process. 42, 129–133. doi: 10.1016/S0255-2701(02)00037-5
Rameshkumar, A., Sivasudha, T., Jeyadevi, R., Sangeetha, B., Aseervatham, G. S. B., and Maheshwari, M. (2013). Profiling of phenolic compounds using UPLC–Q-TOF-MS/MS and nephroprotective activity of Indian green leafy vegetable Merremia emarginata (Burm. f.). Food Res. Int. 50, 94–101. doi: 10.1016/j.foodres.2012.09.035
Ranic, M., Nikolic, M., Pavlovic, M., Buntic, A., Siler-Marinkovic, S., and Dimitrijevic-Brankovic, S. (2014). Optimization of microwave-assisted extraction of natural antioxidants from spent espresso coffee grounds by response surface methodology. J. Clean. Prod. 80, 69–79. doi: 10.1016/j.jclepro.2014.05.060
Sánchez-Vioque, R., Polissiou, M., Astraka, K., Mozos-Pascual, M., Tarantilis, P., Herraiz-Peñalver, D., et al. (2013). Polyphenol composition and antioxidant and metal chelating activities of the solid residues from the essential oil industry. Ind. Crop. Prod. 49, 150–159. doi: 10.1016/j.indcrop.2013.04.053
Shao, Q. S., Deng, Y. M., Liu, H. B., Zhang, A. L., Huang, Y. Q., Xu, G. Z., et al. (2014). Essential oils extraction from Anoectochilus roxburghii using supercritical carbon dioxide and their antioxidant activity. Ind. Crop. Prod. 60, 104–112. doi: 10.1016/j.indcrop.2014.06.009
Shen, Y. B., Zhang, H., Cheng, L. L., Wang, L., Qian, H. F., and Qi, X. G. (2016). In vitro and in vivo antioxidant activity of polyphenols extracted from black highland barley. Food Chem. 194, 1003–1012. doi: 10.1016/j.foodchem.2015.08.083
Simirgiotis, M. J., Bórquez, J., and Schmeda-Hirschmann, G. (2013). Antioxidant capacity, polyphenolic content and tandem HPLC-DAD-ESI/MS profiling of phenolic compounds from the South American berries Luma apiculata and L. chequén. Food Chem. 139, 289–299. doi: 10.1016/j.foodchem.2013.01.089
Singh, G., Passsari, A. K., Leo, V. V., Mishra, V. K., Subbarayan, S., Singh, B. P., et al. (2016). Evaluation of phenolic content variability along with antioxidant, antimicrobial, and cytotoxic potential of selected traditional medicinal plants from India. Front. Plant Sci. 7:407. doi: 10.3389/fpls.2016.00407
Tang, T. X., Zheng, H., Liu, Y., and Qiu, X. H. (2016). Determination of water extracts of Melastoma candidum and Melastoma normale by HPLC-DAD-ESI-MS/MS. Strait Pharm. J. 28, 46–48.
Xi, J., and Wang, B. S. (2013). Optimization of ultrahigh-pressure extraction of polyphenolic antioxidants from green tea by response surface methodology. Food Bioprocess. Techol. 6, 2538–2546. doi: 10.1007/s11947-012-0891-9
Zeng, B. Y., Su, M. H., Chen, Q. X., Qiang, C., Wei, W., and Li, H. H. (2016). Antioxidant and hepatoprotective activities of polysaccharides from Anoectochilus roxburghii. Carbohydr. Polym. 153, 391–398. doi: 10.1016/j.carbpol.2016.07.067
Zhao, B. F., Zhang, Z. X., and Xu, G. L. (2008). Extraction technology of total flavonoids of Anoectochilus roxburghii (wall.) Lindl. J. Baoshan Teach. Coll. 5, 59–60.
Keywords: Anoectochilus roxburghii, microwave-assisted extraction, response surface methodology, phenolic compounds, antioxidant activity
Citation: Xu M, Shao Q, Ye S, Li S, Wu M, Ding M and Li Y (2017) Simultaneous Extraction and Identification of Phenolic Compounds in Anoectochilus roxburghii Using Microwave-Assisted Extraction Combined with UPLC-Q-TOF-MS/MS and Their Antioxidant Activities. Front. Plant Sci. 8:1474. doi: 10.3389/fpls.2017.01474
Received: 17 May 2017; Accepted: 08 August 2017;
Published: 24 August 2017.
Edited by:
Fumiya Kurosaki, University of Toyama, JapanReviewed by:
Hock Eng Khoo, Universiti Putra Malaysia, MalaysiaFlorent Allais, AgroParisTech Institut des Sciences et Industries du Vivant et de L’environnement, France
Copyright © 2017 Xu, Shao, Ye, Li, Wu, Ding and Li. This is an open-access article distributed under the terms of the Creative Commons Attribution License (CC BY). The use, distribution or reproduction in other forums is permitted, provided the original author(s) or licensor are credited and that the original publication in this journal is cited, in accordance with accepted academic practice. No use, distribution or reproduction is permitted which does not comply with these terms.
*Correspondence: Qingsong Shao, c3FzempmY0AxMjYuY29t