 Alexandra Bähring
 Andreas Fichtner
 Uta Friedrich1
 Goddert von Oheimb
 Werner Härdtle
- 1Institute of Ecology, Leuphana University of Lüneburg, Lüneburg, Germany
- 2Institute of General Ecology and Environmental Protection, Technische Universität Dresden, Tharandt, Germany
The effects of atmospheric nitrogen (N) deposition on ecosystem functioning largely depend on the retention of N in different ecosystem compartments, but accumulation and partitioning processes have rarely been quantified in long-term field experiments. In the present study we analysed for the first time decadal-scale flows and allocation patterns of N in a heathland ecosystem that has been subject to airborne N inputs over decades. Using a long-term 15N tracer experiment, we quantified N retention and flows to and between ecosystem compartments (above-ground/below-ground vascular biomass, moss layer, soil horizons, leachate). After 9 years, about 60% of the added 15N-tracer remained in the N cycle of the ecosystem. The moss layer proved to be a crucial link between incoming N and its allocation to different ecosystem compartments (in terms of a short-term capture, but long-term release function). However, about 50% of the 15N captured and released by the moss layer was not compensated for by a corresponding increase in recovery rates in any other compartment, probably due to denitrification losses from the moss layer in the case of water saturation after rain events. The O-horizon proved to be the most important long-term sink for added 15N, as reflected by an increase in recovery rates from 18 to 40% within 8 years. Less than 2.1% of 15N were recovered in the podzol-B-horizon, suggesting that only negligible amounts of N were withdrawn from the N cycle of the ecosystem. Moreover, 15N recovery was low in the dwarf shrub above-ground biomass (<3.9% after 9 years) and in the leachate (about 0.03% within 1 year), indicating still conservative N cycles of the ecosystem, even after decades of N inputs beyond critical load thresholds. The continuous accumulation of reactive forms of airborne N suggests that critical load-estimates need to account for cumulative effects of N additions into ecosystems.
Introduction
Atmospheric inputs of reactive nitrogen (comprising all N species with the exeption of N2; Galloway and Cowling, 2002) have tripled since the nineteenth century, resulting in unprecedented impacts on the N status of ecosystems (Galloway and Cowling, 2002; De Schrijver et al., 2011). Since N is the most limiting nutrient in many natural and semi-natural environments, high N loads may affect important ecosystem functions such as biomass production and the complex interplays within and between plant species, but also their susceptibility to abiotic and biotic stressors such as drought, frost events and herbivory (Bobbink et al., 2010). As a consequence, atmospheric N deposition constitutes one of the most substantial threats to biodiversity today (Sala et al., 2000; Phoenix et al., 2012). This pertains to N-limited ecosystems with conservative N cycles in particular, because many species that are typical of these environments are physiologically adapted to low N availability, for example due to high N use efficiency or mycorrhizal associations (Aerts, 1999; Bobbink et al., 2002; Phoenix et al., 2012).
European heathland ecosystems are typically low-N environments (Härdtle et al., 2006). These heathlands host a huge proportion of the plant and animal diversity typical of open acidic sites, but also provide a wide range of ecosystem services (e.g., groundwater recharge, C-storage, recreation; De Graaf et al., 2009; Fagúndez and Izco, 2016). Agricultural intensification and elevated atmospheric N inputs, however, have contributed to a distinct decline in European heathland area over recent decades (Rose et al., 2000; Fagúndez, 2012; Southon et al., 2012), and nowadays remaining areas are protected by several international protection acts (such as the Natura2000 Habitat Council Directive 92/43/EEC) (Rose et al., 2000; Vandvik et al., 2005; Southon et al., 2012).
Many lowland heaths of NW Europe are characterised by the dominance of the dwarf shrub Calluna vulgaris (L.) Hull (henceforth referred to as Calluna). This species is competitively superior to grasses (e.g., Molinia caerulea, Deschampsia flexuosa) under low-N conditions, but becomes less competitive with increasing N availability (Alonso et al., 2001; Friedrich et al., 2011a; Fagúndez, 2012). At N-fertilised sites, a succession towards grass dominance is observable when the dwarf shrub canopy opens as a result of overaging, heather beetle outbreaks or frost and drought damage (Berdowski and Zeilinga, 1987; Bobbink et al., 2010). This process accelerates under increasing N availability, attributable to faster rates of N cycling and plant growth, and finally, shortened life-cycles of Calluna (Berendse, 1990; Power et al., 1998; Carroll et al., 1999). Surprisingly, dwarf shrub growth still is N-limited in some heathlands, despite decadal N inputs above critical loads (von Oheimb et al., 2010; Friedrich et al., 2011b). Such findings could be related to both time- and space-dependent allocation and storage processes of airborne N loads, or to underestimated N losses from the N pool of the ecosystem. It is, for example, conceivable that the spodic horizon (B-horizon) of podzols can accumulate considerable amounts of N in organic compounds (fulvic and humic acids; Nielsen et al., 2000; Friedrich et al., 2011b), all of which are to a large extent insoluble and not readily bio-available (Hagedorn et al., 2005). In this way, N inputs might be (at least partly) withdrawn from the N cycle and thus become biologically inactive. However, we still have limited evidence for the long-term efficacy of atmospheric N loads on the functioning of heathlands as well as other ecosystems. In addition, decadal-scale patterns of N flows and sequestration have rarely been quantified, restricting a mechanistic understanding of N-fertilisation effects on ecosystem functions. This in turn emphasises the value of long-term studies that trace the allocation of N to or between ecosystem compartments on a decadal scale (Silvertown et al., 2010).
Many N-budget calculations from long-term fertilisation experiments have provided valuable knowledge about shifts in N stores of different ecosystem compartments (Power et al., 1998; Pilkington et al., 2005; von Oheimb et al., 2010), but were unable to quantify the origin of N gains and losses over time and, thus, N flows between ecosystem compartments such as plant biomass, organic layers or mineral soil horizons. 15N tracer studies have the potential to overcome this problem and allow for a temporal quantification of N flows (Kleinebecker et al., 2009), as has been demonstrated for grassland and forest ecosystems (Gerzabek et al., 2004; Nadelhoffer et al., 2004). Quantitative analyses of the fate of airborne N loads including different ecosystem compartments are important for an understanding of ecosystem responses to long-term N inputs at the individual plant and community level, but may also provide insights into mechanisms underlying shifts in species composition and losses (Friedrich et al., 2011b). Such information can further help to develop adaptive management strategies for semi-natural N-limited ecosystems and the species they host, particularly in the face of ongoing N inputs and their contribution to biodiversity loss (Maskell et al., 2010).
The objective of the present study was to quantify decadal-scale patterns of N accumulation and partitioning in an N-limited environment that has been subject to high airborne N inputs over decades. We analysed N flows (in terms of 15N tracer enrichment and recovery) to and between different ecosystem compartments, using an experiment that was established in a heathland ecosystem in 2007 (Friedrich et al., 2011b) and continued until 2015. We were particularly interested in the impact of the moss layer on the N cycle of the ecosystem, because this compartment is considered an important sink for incoming N (Proctor, 2008), but also might release N to other compartments, for example via downward transports in the soil profile. In this way, the moss layer could contribute to N enrichment in deeper soil horizons (Aldous, 2002; Proctor, 2008; Startsev et al., 2008). Moreover, we asked whether there are indications of N-saturation, or whether ecosystem-internal sinks for N or unknown pathways of N losses might counteract an accumulation of airborne N inputs. We hypothesised that (i) the moss layer constitutes a crucial component of the N cycle of the ecosystem, based on its capture-release-function for airborne N, (ii) the podzol-B-horizon serves as an important long-term sink for N, and (iii) the heathlands studied still have a high capacity to sequester pollutant N.
Materials and Methods
Study Site and Experimental Design
Our study site is located in the Lüneburg Heath nature reserve in NW Germany (Lower Saxony, Schneverdingen, 53°15′N, 9°58É, 105 m a.s.l.), the site of the largest complex of heathlands (about 5,000 ha) in NW Germany. The study sites is characterised by Pleistocene sandy deposits with a weak relief and nutrient-poor podzol soils. Topsoil-pHH2O values range between 3.3 and 3.5 (Härdtle et al., 2006). The climate is of a humid sub-oceanic type (mean precipitation: 811 mm year−1, annual mean temperature: 8.4°C; Niemeyer et al., 2005)., Heathlands of the nature reserve are dominated by the dwarf shrub Calluna (cover >80%). The soil surface is covered by mosses (mean cover 93%), with Hypnum judlandicum and Pleurozium schreberi being the prevailing species. The current background atmospheric N deposition in the study area amounts to 23 kg ha−1 year−1 (von Oheimb et al., 2010 for more detailed information on the quantity of different N-forms deposited in NW Germany and in the study area see Gauger et al. (2000) and Niemeyer et al. (2005), respectively).
The present study made use of the experimental setup of Friedrich et al. (2011b) established in 2007. The experiment comprises a total of seven randomly selected plots, each of which was divided into two subplots (2 × 4 m in size). At the beginning of the experiment (June 2007), in one subplot (per plot) a 15N tracer was added in liquid form (pulse labeling with 100 mg 15NO3 (98 at.%) using a special spray bottle that allowed for a fine nebulisation of the liquid applied), and the corresponding subplot was used to determine the natural 15N abundance (these subplots are henceforth referred to as labelled and non-labelled subplots, respectively). Labelled and non-labelled subplots were separated by a buffer zone 1 m in width to avoid cross contamination after 15N tracer addition (for a detailed description of the 15N application procedure see Friedrich et al., 2011b).
All analyses performed during the present study refer to a time span of 7 years, with all samples collected between 2009 and 2015 (with the exception of one plot, which was sampled from 2008 to 2015, as well as litter and leachate samples; see description below). To present a complete overview of N flows and partitioning since the setup of the experiment in 2007, we included analyses of Friedrich et al. (2011b) in the present study (i.e., analyses from 2007 to 2008). In this way, we were able to document compartment-related shifts in 15N abundance, enrichment and recovery for a 9-year timespan (2007–2015).
N Allocation Patterns in Biomass and Soil
To quantify N allocation patterns in the biomass and soil we sampled the following ecosystem compartments annually: above-ground biomass of Calluna (current year and 1- to 2-year-old shoots), moss layer, and the soil O-, A- and B-horizons (with the latter two representing the albic and spodic horizons, respectively, both of which are typical of podzol soils; nomenclature according to the IUSS Working Group WRB, 2015) in labelled and non-labelled subplots in each August from 2008 to 2015, corresponding to the flowering period of Calluna. Twenty randomly chosen current year shoots as well as 1- to 2-year-old shoots of Calluna from the top of randomly chosen Calluna plants were cut with scissors and were pooled to one sample per subplot. Six randomly chosen squares of the moss layer (2 × 2 cm in size) were sampled and bulked to one sample per subplot. Organic soil samples (O-horizon; mean thickness: 2.7 cm) were cut with knives (six squares of 2 × 2 cm of the entire horizon depth per subplot) and separated from fresh fallen litter. Mineral soil samples were taken from the A- and B-horizon with a soil auger (Pürckhauer, EcoTech, Bonn, Germany) from six randomly chosen spots per subplot and bulked to one sample each mean thickness of A- and B-horizons: 7.1 cm and 7.5 cm, respectively). The annual litter production of Calluna was quantified in labelled and non-labelled subplots by means of fine-mesh nets stretched under one randomly selected plant per subplot and sampled during winter between the end of February and the beginning of April (depending on the duration of snow cover) from 2008 to 2016.
To obtain an overview of the quantities of 15N accumulated in older Calluna twigs and stem wood (age >2 years) and Calluna below-ground biomass (i.e., roots), but to avoid an interference of plant growth in plots, these compartments were sampled only twice, in August 2014 and 2015. To this end, six randomly chosen stems of Calluna per subplot were cut with clippers at ground level (excluding current year and 1- to 2-year-old shoots). For root analysis, we sampled the O-horizon at six randomly selected sites per subplot (3 × 3 cm samples from across the entire organic layer).
Soil and root samples were stored in a freezer (−18°C) until analysis. Prior to analysis, above-ground biomass and soil samples were air-dried, and the latter one sorted and sieved (2 mm). Root samples were washed using a 0.2 mm sieve to remove soil particles and then dried (48 h at 80°C). All samples were ground with a mixer mill (MM 400, Retsch, Haan, Germany) and re-dried at 105°C for weighing. Total N contents and δ15N were determined with a continuous flow elemental analyser-isotopic ratio mass spectrometer (vario EL cube, Elementar, Hanau, Germany, coupled to an Isoprime IRMS, Isoprime Ltd., Cheadle Hulme, UK; note that total N analyses of soils hence included microbial biomass N).
N Losses via Leaching
N losses via leaching were quantified by means of four pairs of lysimeters, one of which was labelled with 100 mg 15NO3 m−2 in 2007 (analogous to the labelling of subplots), and one which received a corresponding amount of deionised water (non-labelled lysimeter; for a detailed description of the setup of lysimeters see Friedrich et al., 2011b). Since the collection and analysis of leachate was very laborious and 15N leaching losses (in terms of inorganic N and DON) proved to be negligible at the beginning of the experiment, leaching losses of 15N were only quantified on 20 occasions in the period from June 2014 to May 2015 (weekly in June 2014, once every 2 weeks from July to August 2014 and monthly from September 2014 to June 2015). The leachate which accumulated between the sampling occasions was extracted with a temporarily connected vacuum pump. The quantity of leachate per lysimeter was recorded and a subsample of 500 ml was filtered and stored in a freezer (−18°C) for analysis. Samples were carefully defrosted and analysed with a UV/Vis scanning spectrophotometer (UV-3100PC, VWR, Radnor, PA, USA) using the method of Hagedorn and Schleppi (2000). In order to determine δ15N values, samples were prepared following the diffusion method of Sebilo et al. (2004) modified according to Friedrich et al. (2011b).
Calculation of N Pools and Leaching Losses
To calculate 15N tracer recovery, the mass of N pools in each ecosystem compartment must be known. Therefore, the total N content of a compartment in labelled subplots was multiplied by its mean N pool mass. Pool masses for the moss and soil compartments were taken from Friedrich et al. (2011b). Calluna plants were 10–12 years old at the beginning of the experiment (i.e., early mature phase of life-history; Gimingham, 1972). The continuous increment of Calluna above-ground biomass (i.e., total above-ground biomass and total biomass of current year and 1- to 2-year-old shoots) was calculated on the basis of age-dependent growth rates of Calluna in the nature reserve, derived from our own measurements (based on biomass harvests at six randomly chosen sites adjacent to the experimental plots and comparisons with data from Friedrich et al., 2011b) in the Lüneburg Heath and complemented by literature data (Gimingham, 1972; Milne et al., 2002). Calluna below-ground biomass was also quantified in mature stands adjacent to our plots (at six randomly selected sites, 15 soil samples per site taken with a soil auger 8 cm in diameter and to a soil depth of 15 cm; following the procedure for root analyses described above).
N leaching losses were calculated from the total amount of leachate multiplied by the total N contents (Ninorg and DON) of the leachate from labelled lysimeters (Friedrich et al., 2011b).
Calculation of 15N Abundance, 15N Enrichment and 15N Tracer Recovery
15N abundance, 15N enrichment and 15N tracer recovery were calculated according to Fry (2006). 15N abundance and the natural 15N abundance in labelled and non-labelled subplots, respectively, are represented in the δ notation:
where Rsample and Rstandard are the 15N/14N ratio of the sample and the N2 of the atmosphere, which is used as standard, respectively.
15N enrichment [‰] represents the isotopic enrichment of a sample from a labelled subplot (δ15Nsample) compared to a sample in a non-labelled subplot (δ15Nref):
15N recovery [g N m−2] is the mass of 15N tracer recovered in the different ecosystem compartments (biomass, soil horizons, and leachate) in labelled subplots and was calculated as follows:
where mpool is the amount of N in a respective compartment [g N m−2], at.%15Npool and at.%15Nref are the at.%15N in the N pool of the samples (or in the leachate) of labelled and non-labelled subplots, respectively, and at.%15Ntracer is the at.%15N of the added 15N tracer (Nadelhoffer et al., 2004).
Statistical Analysis
Differences between 15N abundances of labelled and 15N natural abundances from non-labelled subplots were tested by means of pairwise comparisons of δ15N values of each compartment and for each sampling occasion using a Student's t-test (α = 0.05). We applied generalised additive mixed models (GAMM) with a log link function and gamma distribution to assess the effects of ecosystem compartments and time (2007–2015) on 15N enrichment. Ecosystem compartments were stratified into five main compartments: above-ground biomass of Calluna (including current year shoots, 1- to 2-year-old shoots, and current year litter), moss layer, and O-, A- and B-horizons of the soil. To address the skewed response of the 15N enrichment data, a gamma probability distribution was preferred, because it retains the structure of the data while accounting for a heteroscedastic error structure (Zuur et al., 2014). We added a value of 0.001 to the 15N enrichment data to ensure convergence of the fitting algorithm. The non-linear time effect was modelled using a cubic regression spline with four degrees of freedom to allow some complexity in the 15N enrichment function, while avoiding over-fitting the data (Wood, 2006). We used plot as random factor to account for between-plot variability, and a first-order autocorrelation structure (AR-1) nested within plot to account for temporal correlation (Zuur et al., 2009). The resulting GAMM is:
where ENij is the 15N enrichment of sample j in plot i and ENij is assumed to follow a Gamma distribution with a log link. α is the intercept, f is a smoothing function (cubic regression spline) of the time effect and β is a parametric coefficient of the compartment effect. bi is a normally distributed random intercept for the plot effect accounting for any dependency between samples from the same plot. The residuals at time s are modelled as a function of the residuals of time s−1 along with noise (as εs = ρ εs−1 + ηs, in which ρ is the temporal correlation parameter to be estimated; Zuur et al., 2009). The importance of variables for 15N enrichments was assessed by fitting various candidate models accounting for the main effects and their interaction (as f(Timeij) x Comaprtmentij) using maximum likelihood estimation (ML). Model selection was based on the Akaike Information Criterion (AIC) and the model with the smallest AIC and highest Akaike weights (wi) was identified as the minimum-adequate model (Burnham and Anderson, 2002). Parameter estimates of the minimum-adequate model were based on the restricted maximum likelihood (REML) method (Zuur et al., 2009). Model assumptions were visually assessed following Zuur et al. (2010). We found no trends in the residuals. To avoid biased parameter estimates, we omitted extreme values (outliers, <2% of the data) for the analyses. Outliers were visually identified by Cleveland dotplots (Zuur et al., 2010). All analyses were conducted in R 3.3.1 (http://www.R-project.org) with the packages nlme (Pinheiro et al., 2016), mgcv (Wood, 2006), and MuMIn (Bartón, 2016).
Results
15N Abundances and 15N Enrichment in Biomass and Soil
δ15N values (natural abundance) varied between −8.0 and +8.7‰ across compartments and were lowest in Calluna biomass (range between −8.0 and −5.3‰). The moss layer showed δ15N values between −6.8 and −5.9‰. In the soils, δ15N values increased continuously with soil depth (organic layer: between −4.9 and −3.5‰, A-horizon: between 3.5 and 5.3‰ and B-horizon: between 6.1 and 8.7‰; Table 1).
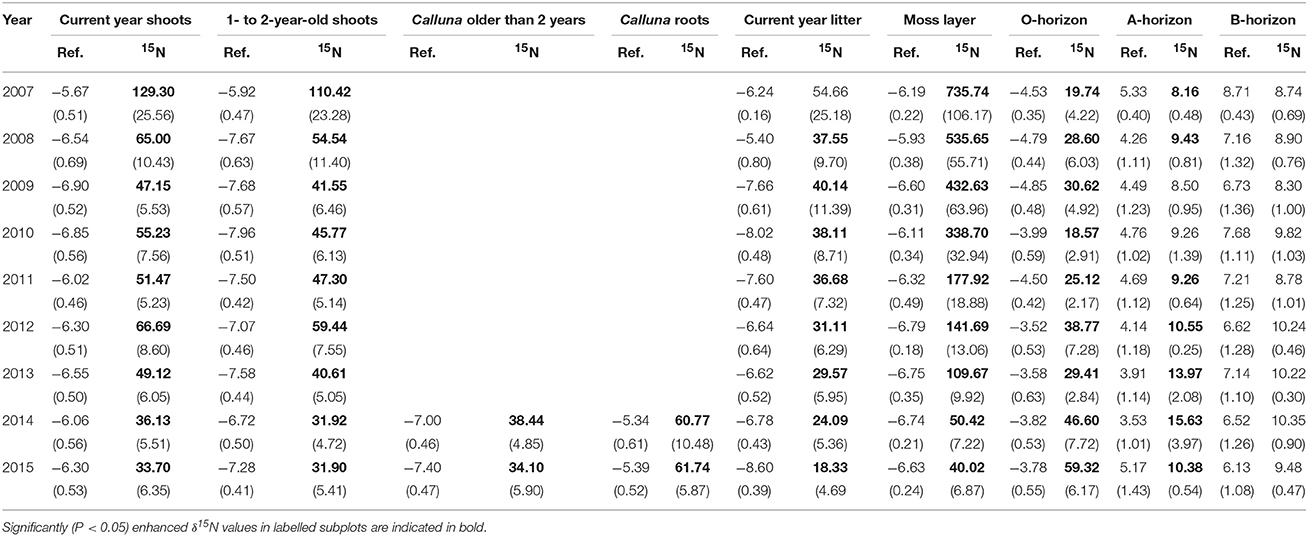
Table 1. 15N abundance (δ15N in ‰) in non-labelled (Ref.) and labelled subplots (15N) of the ecosystem compartments analysed (means, 1 SE (standard error of the mean) in brackets, n = 7 samples) during the study period 2007–2015.
As was to be expected, most compartments showed a significant (P < 0.05) increase in δ15N values (enrichment) after tracer addition (exceptions were the B-horizon, some measurements of the A-horizon and the litter samples in the first year of the experiment). The highest enrichment values were found for the moss layer and Calluna shoots (Table 1).
The direction and magnitude of temporal changes in 15N enrichment distinctly varied among compartments (Figure 1), as indicated by the strong support for interacting effects of time and compartment (Akaike model weight of 1.0; Table 2). 86 % of the variation in 15N enrichment was explained by the interaction between time and compartment, whereas compartment or time effects explained 45 and 7% of the variance, respectively (Table 2). The partial effects of the above-ground biomass of Calluna and the moss layer on 15N enrichment showed a significant decrease over time (P < 0.001 for both compartments; Table 3; Figure 1), while a significant increase of 15N enrichment was observed in the soil (O- and B-horizon: P < 0.001; A-horizon: P < 0.01; Table 3; Figure 1). 15N enrichment in the A-horizon also increased within the course of the experiment, but decreased in 2015 (Table 1).
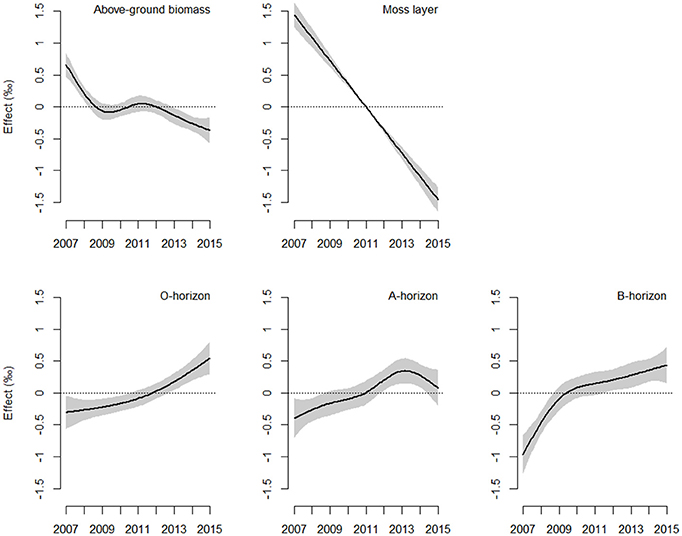
Figure 1. Estimated smoother for time-related shifts in 15N enrichment in the ecosystem compartments analysed. The solid line corresponds to fitted relationships of generalised additive mixed models, with shaded areas showing the 95% confidence interval range. The y-axis indicates the contribution of the smoother (effect, ‰) to the fitted values of 15N enrichment (see Equation 4 and Table 3; n = 7 per compartment and year).
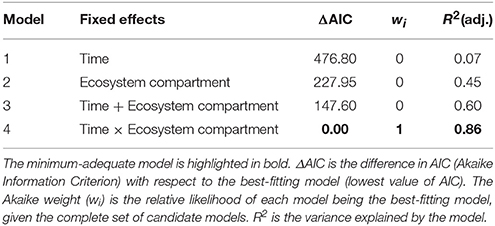
Table 2. Model selection statistics for four candidate models describing 15N enrichment as a function of ecosystem compartment (above-ground biomass, moss layer, O-, A-, and B-horizons) and time (2007–2015).
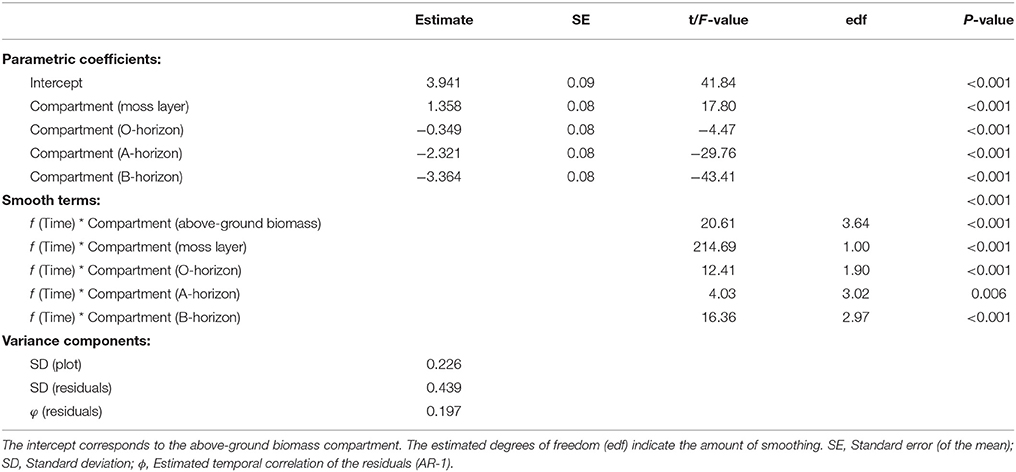
Table 3. Minimum-adequate generalised mixed-effects model (GAMM) for the effects of ecosystem compartment and time on 15N enrichment.
15N Tracer Recovery
Total 15N recovery was highest in the first year (about 93%); it then (almost linearly) decreased until 2010 to a value of about 54% (Figure 2; Table 4). Interestingly, recovery rates remained largely constant in subsequent years and achieved values between 49 and 54% until 2015. The recovery rates calculated increase by about 7% if the compartments which were not sampled annually are taken into account: “Calluna biomass older than 2 years” (about 2.5%), and “Calluna roots” (about 4.2%; means across sampling years; Table 4).
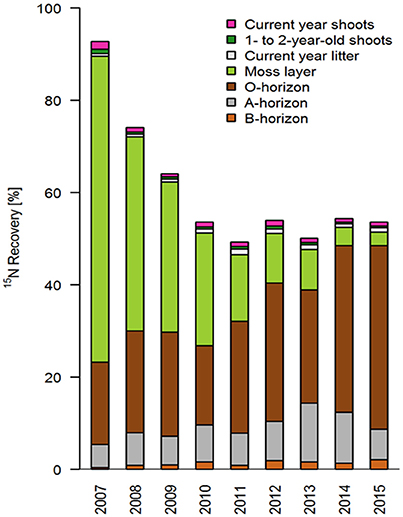
Figure 2. Temporal variation (2007–2015) of relative 15N recovery (% of the total 15N tracer applied) in different ecosystem compartments (n = 7 per compartment and year).
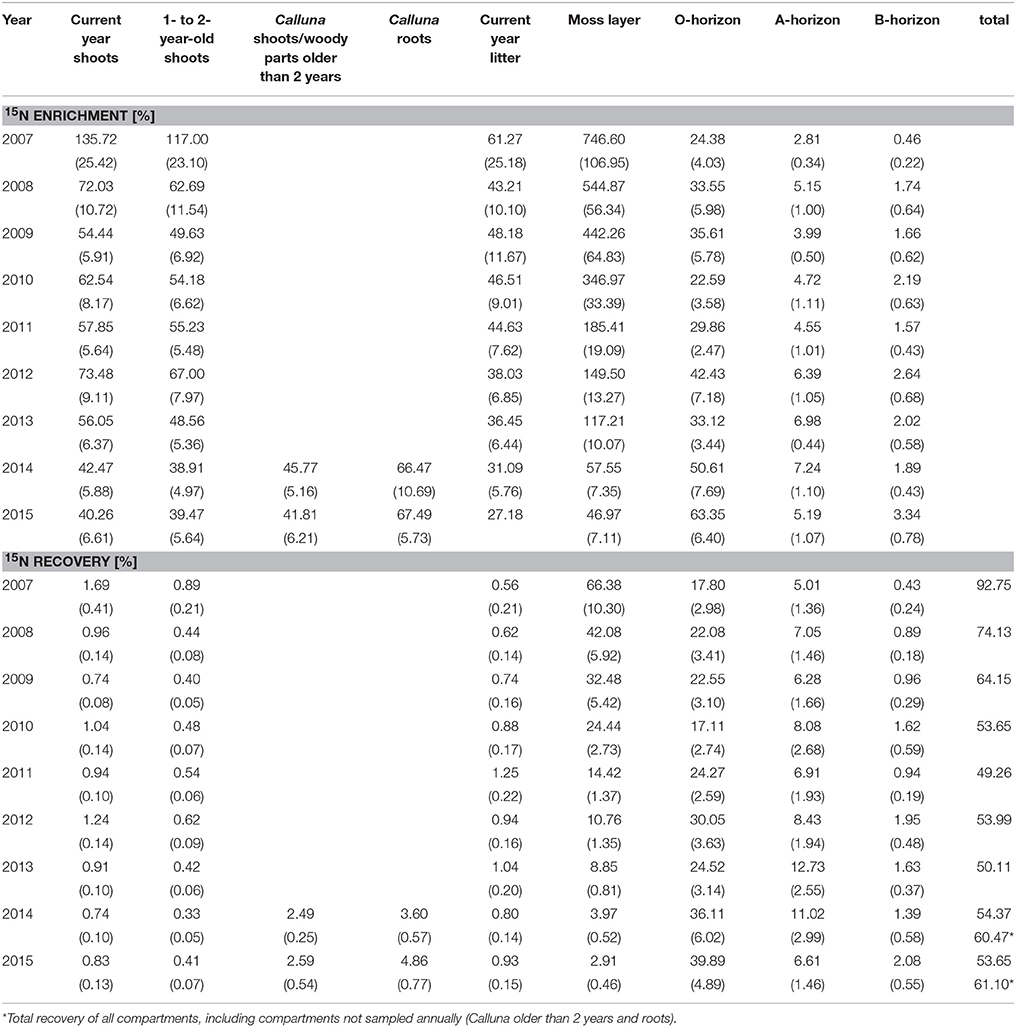
Table 4. 15N enrichment [‰] and 15N recovery [% of the total 15N applied] of the sampled ecosystem compartments (means, 1 SE in brackets) during the study period 2007–2015.
The moss layer proved to be the most important short-term sink and longer-term source for applied 15N, and showed a distinct decrease in recovery rates within the first 5 years (from 66% in 2007 to 14% in 2011; Figures 2, 3). This loss of 15N from the moss layer was not compensated for by a corresponding increase in recovery rates in any other compartment (Figure 3). We did find increasing recovery rates in the O- and A-horizons in the course of the experiment (e.g., from 18 to 40% for the O-horizon). This increase corresponded to about 50% of the total 15N losses from the moss layer between 2007 and 2015 (Figure 2). For the B-horizon, we found a slight but continuous increase in 15N recovery, with a maximum of 2.1% in the last year of the experiment.
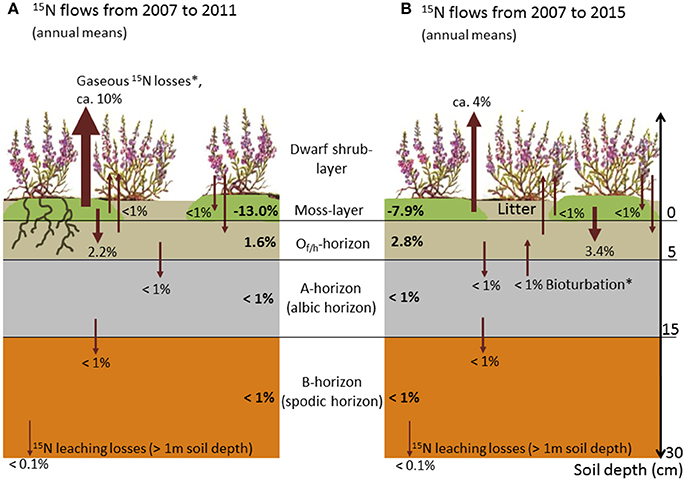
Figure 3. Schematic illustration of annual mean flows of 15N tracer between ecosystem compartments (arrows) and related annual shifts in 15N recovery (bold numbers; positive and negative values indicate annual gains and losses, respectively; all numbers in % of the total amount of tracer applied). (A) Annual mean flows for the time span 2007–2011, and (B) annual mean flows for the time span 2007–2015. The thickness of arrows roughly indicates the mass of between-compartment transported 15N tracer (* = hypothesized flows based on quantified 15N mass balances).
Recovery rates in both the current year and 1- to 2-year-old shoots of Calluna were negligibly low in all study years, with values below 2%, and in most years even below 1% (Figures 2, 3, Table 4). Accordingly, we also found low recovery rates for the annual litter of Calluna, which amounted to ≤1%. In addition, leaching losses of 15N proved to be very low, as indicated by an annual recovery of 0.03% of the total 15N applied. Thus, leaching losses were even lower than at the beginning of the experiment (0.05% in 2007).
Discussion
Decadal-Scale Allocation Patterns of N
Our findings support our first hypothesis that the moss layer acts as both an important short-term sink and a longer-term source of captured 15N tracer. The moss layer thus represents a crucial link between airborne N inputs and the allocation of N to the heathland's N cycle (in term of its capture-release function). The moss layer's ability to store incoming N in the short term may be related to the fact that mosses represent ectohydric plants that absorb dissolved nutrients at the cell surface (Proctor, 2008). The decadal-scale availability and release of N could be attributable to a longer-term sequestration of N due to N assimilation by mosses and the microbial community associated with the moss phytomass (Gordon et al., 2001; Tye et al., 2005).
An important finding in terms of the N balance of the ecosystem was that, during the first 4 years of the experiment, 15N losses from the moss layer were not compensated for by a corresponding increase in recovery rates in any other compartment. These losses accounted for more than 30% of the total 15N applied and suggest that N losses from the moss layer in gaseous forms are very likely (Startsev and Lieffers, 2007; for a further discussion of this aspect see paragraph ‘Leaching losses and putative flows’ below). In contrast, the largely constant recovery rates found from 2010 onwards point to a conservative N cycling with marginal 15N losses from the N pool of the ecosystem in the long term (Tye et al., 2005).
Our second hypothesis was not confirmed, since the O-horizon (and not the B-horizon; see discussion below) proved to be an important long-term sink for sequestered 15N. In this horizon, recovery rates more than doubled in the course of the experiment. Several mechanisms may explain the N-flow to this compartment: Firstly, a passive downward transport of N from the moss to the organic layer via leaching might have taken place (Startsev et al., 2008), particularly at the beginning of the experiment. Secondly, decomposition processes of the lower and dead segments of the bryophytes, which sequestered 15N in biomass after tracer addition in 2007, are likely to have contributed to an increase in 15N recovery in the O-horizon over time (Aldous, 2002). Thirdly, processes such as mineralisation of Calluna litter and leaking bryophyte cells (as a result of desiccation-rehydration processes) could have contributed to increasing 15N recovery rates in the O-horizon (Bates, 2008; Friedrich et al., 2011b). Downward allocation processes of N (both as particular and dissolved organic matter) in the soil profile also explain an increasing recovery of 15N in the A-horizon. These findings coincide with observations in grasslands and forests, which showed the upper soil horizons (and the O-horizons in particular) to be important long-term sinks for airborne N loads (Gerzabek et al., 2004; Nadelhoffer et al., 2004; Templer et al., 2012; Gurmesa et al., 2016). High N retention in the O-horizon was also reported from heathland studies (although not based on tracer analyses; Kristensen and McCarty, 1999; Kristensen, 2001; Schmidt et al., 2004; Pilkington et al., 2005), and mainly attributed to an immobilisation of N by the microbial biomass present in these horizons (Jonasson et al., 1996; Nordin et al., 2004). A reverse trend in N recovery in the O- and A-horizons observed in the last 2 years of the experiment suggests that upward transports of N in the soil profile are also possible, probably due to bioturbation via root growth or soil invertebrates (Gabet et al., 2003).
Despite a continuous increase in 15N enrichment and recovery in the podzol's B-horizon, we found no clear support for our assumption that considerable quantities of N were sequestered in this horizon. We consider a decadal-scale recovery of about 2% too low to cause an ecologically relevant N withdrawal from the N cycle (which would be related to an N storage in insoluble and not readily bio-available forms; Hagedorn et al., 2005). Since the formation of a podzol spodic horizon is assumed to take centuries (Brady and Weil, 2008), an accumulation of N up to one ton per ha in this horizon (as found for our study area; Friedrich et al., 2011b) might require timespans far beyond the observation time of the present study. This assumption would be backed by the observed 15N accumulation rates, given that these could be extrapolated to a centennial scale.
Recovery of 15N in above- and below-ground biomass of Calluna was very low compared to recovery rates in the moss and organic layer. We hypothesise that soil microbes in the organic layer were the superior competitors for N (Andresen et al., 2008), and only small amounts of 15N remained available for plant uptake (Schimel and Bennett, 2004). This was demonstrated by Larsen et al. (2012) in a subarctic heathland, where 65% of the applied 15N was sequestered by soil microbes. In this context, it is important to note that high immobilisation rates by soil microbes are also indicative of a low N saturation level (Curtis et al., 2005).
Leaching Losses and Putative Flows
15N losses via leaching proved to be negligibly low. This is an important indication of conservative N cycles (Tye et al., 2005) and contradicts the notion that the heathlands of the study area have achieved an advanced stage of N saturation (Aber et al., 1998), despite decades of N inputs beyond critical load thresholds. Obviously, the sites analysed still have a high capacity to sequester pollutant N (Choudhary et al., 2016), suggesting that a constant proportion of incoming N enters the heathland's N cycle and contributes to a slow but steady increase in the N level (De Schrijver et al., 2011). This confirms our third hypothesis.
In contrast to the observed accumulation of N, the first 4 years of the experiment (2007–2010) also exhibited a considerable loss of 15N. Tracer mass balances suggest that this loss was attributable to a leak of N from the moss layer in gaseous forms (Startsev and Lieffers, 2007). High N losses from bryophyte layers due to denitrification have been found for different species and ecosystems, and increase with increasing humidity (e.g., with water saturation of the moss layer after precipitation events), temperature, and N deposition (Laverman et al., 2000; Opelt and Berg, 2004; Lenhart et al., 2015). As a consequence, gaseous N losses from moss carpets are considered to have significant impacts on ecosystem N budgets (Fang et al., 2015), and also contribute to global nitrous oxide emissions from terrestrial ecosystems (Lenhart et al., 2015). For example, Calvo-Fernández et al. (2015) found high N losses as a result of denitrification in Cantabrian Mountain heathlands, when soils were water-saturated during winter. Fang et al. (2015) concluded that the effects of denitrification losses on ecosystem N balances are often underestimated. NH3 volatilisation might also have contributed to 15N losses from the moss layer (Mahendrappa and Ogden, 1973; Startsev et al., 2008). Further mechanisms of N losses could be lateral N transport by mycorrhiza or soil fauna. However, since the natural 15N abundances in non-labelled subplots remained unchanged in the course of the experiment, we consider these losses (including conceivable lateral transports due to surface run-off) to be of minor importance. Low lateral transports also might be related to high absorption rates of ammonium, which is the prevailing Ninorg form at podzol sites with strongly acidic soil condition (cf. study site description). Due to the avoidance of destructive sampling, N contents of roots below a soil depth of 15 cm were not quantified. Since Calluna is considered a shallow-rooted plant (with more than 90% of root biomass being located in the humus horizons; Gimingham, 1972), and CN ratios of deep rooting woody roots are exceptionally high (>120; own unpublished data), we consider the N pool related to this compartment to be very low. We also rule out a significant effect of N deposition on 15N recovery patterns, since N deposition is evenly distributed across the study area, and thus between-plot differences in N deposition are low (including differences in N forms and isotope signatures; cf. deposition measurements of Niemeyer et al., 2005).
In conclusion, we found evidence that about 60% of the added 15N remained in the N cycle of the ecosystem at least for about one decade. In this context moss layers may play a crucial functional role for the N cycle of ecosystems: On the one hand, moss layers may contribute to high N losses by fostering denitrification processes (particularly under oceanic to sub-oceanic climates), and thus may decelerate N eutrophication processes in ecosystems. On the other hand, mosses represent a considerable short-term sink for incoming N which is released to the N cycle of an ecosystem in the long term. As a result, a considerable proportion of airborne N inputs can accumulate in different ecosystem compartments. Since the O-horizon proved to be an important long-term sink, it is likely that N captured by this horizon remains bio-available in the long term.
This has important implications for both critical load estimates and the development of management strategies to counteract airborne N inputs. A continuous accumulation of bio-available N (even under low N inputs) would implicate that critical load revisions need to account for cumulative effects of (low) N additions into ecosystems (Payne et al., 2011; Phoenix et al., 2012; Bähring et al., 2017). Mitigation strategies (in terms of management) should comprise high-intensity measures (e.g., choppering and sod-cutting; Härdtle et al., 2006; Frouz et al., 2009) as an important means to achieve balanced N budgets in the long term, because only these measures affect upper soil horizons with high contents of accumulated N.
Author Contributions
UF, WH, and GvO conceived of the study. All authors contributed to the field and lab work, the analysis and interpretation of data, and the writing of the manuscript. All authors approved the final version of the manuscript.
Conflict of Interest Statement
The authors declare that the research was conducted in the absence of any commercial or financial relationships that could be construed as a potential conflict of interest.
Acknowledgments
We would like to thank the Verein Naturschutzpark e.V. for permission to conduct this study in the Lüneburg Heath nature reserve.
References
Aber, J., McDowell, W., Nadelhoffer, K., Magill, A., Berntson, G., Kamakea, M., et al. (1998). Nitrogen saturation in temperate forest ecosystems-Hypotheses revisited. Bioscience 48, 921–934. doi: 10.2307/1313296
Aerts, R. (1999). Interspecific competition in natural plant communities: mechanisms, trade-offs and plant-soil feedbacks. J. Exp. Bot. 50, 29–37. doi: 10.1093/jxb/50.330.29
Aldous, A. R. (2002). Nitrogen translocation in Sphagnum mosses: effects of atmospheric nitrogen deposition. New Phytol. 156, 241–253. doi: 10.1046/j.1469-8137.2002.00518.x
Alonso, I., Hartley, S. E., and Thurlow, M. (2001). Competition between heather and grasses on Scottish moorlands: interacting effects of nutrient enrichment and grazing regime. J. Vegetation Sci. 12, 249–260. doi: 10.2307/3236609
Andresen, L. C., Jonasson, S., Ström, L., and Michelsen, A. (2008). Uptake of pulse injected nitrogen by soil microbes and mycorrhizal and non-mycorrhizal plants in a species-diverse subarctic heath ecosystem. Plant Soil 313, 283–295. doi: 10.1007/s11104-008-9700-7
Bähring, A., Fichtner, A., Ibe, K., Schütze, G., Temperton, V. M., von Oheimb, G., et al. (2017). Ecosystem functions as indicators for heathland responses to nitrogen fertilization. Ecol. Indic. 72, 183–195. doi: 10.1016/j.ecolind.2016.08.013
Bartón, K. (2016). MuMIn: Multi-Model Inference. R package version 1.15.6. Available online at: https://CRAN.R-project.org/package=MuMIn
Bates, J. W. (2008). “Mineral nutrition and substratum ecology,” in Bryophyte Ecology, 2nd Edn., eds B. Goffinet and A. J. Shaw (Cambridge: Cambridge University Press), 299–356.
Berdowski, J. J. M., and Zeilinga, R. (1987). Transition from heathland to grassland: damaging effects of the heather beetle. J. Ecol. 75, 159–175. doi: 10.2307/2260542
Berendse, F. (1990). Organic matter accumulation and nitrogen mineralization during secondary succession in heathland ecosystems. J. Ecol. 78, 413–427. doi: 10.2307/2261121
Bobbink, R., Ashmore, M., Braun, S., Flückiger, W., and van den Wyngaert, I. J. J. (2002). Empirical Nitrogen Critical Loads for Natural and Semi-natural Ecosystems: 2002 Update (Berne: Swiss Agency for Environment, Forest and Landscape SAEFL), 1–128.
Bobbink, R., Hicks, K., Galloway, J., Spranger, T., Alkemade, R., Ashmore, M., et al. (2010). “Review and revision of empirical critical loads and dose-response relationships,” Proceedings of an Expert Workshop, Noordwijkerhout, 23-25 June 2010, eds R. Bobbink and J.-P. Hettelingh (Noordwijkerhout), 246.
Brady, N. C., and Weil, R. R. (2008). The Nature and Properties of Soils, 14th Edn. Upper Saddle River, NJ: Pearson/Prentice Hall.
Burnham, K. P., and Anderson, D. R. (2002). Model Selection and Multimodel Inference: A Practical Information-Theoretic Approach. New York, NY: Springer Science+Business Media.
Calvo-Fernández, J., Marcos, E., Calvo, L., and Härdtle, W. (2015). Allocation patterns of airborne nitrogen in mountainous heathlands – A 15N tracer study in the Cantabrian Mountains (NW Spain). Ecol. Eng. 84, 128–135. doi: 10.1016/j.ecoleng.2015.07.027
Carroll, J. A., Caporn, S. J. M., Cawley, L., Read, D. J., and Lee, J. A. (1999). The effect of increased deposition of atmospheric nitrogen on Calluna vulgaris in upland Britain. New Phytol. 141, 423–431. doi: 10.1046/j.1469-8137.1999.00358.x
Choudhary, S., Blaud, A., Osborn, A. M., Press, M. C., and Phoenix, G. K. (2016). Nitrogen accumulation and partitioning in a High Artic tundra ecosystem from extreme atmospheric N deposition events. Sci. Total Environ. 554, 303–310. doi: 10.1016/j.scitotenv.2016.02.155
Curtis, C. J., Emmett, B. A., Grant, H., Kernan, M., Reynolds, B., and Shilland, E. (2005). Nitrogen saturation in UK moorlands: the critical role of bryophytes and lichens in determining retention of atmospheric N deposition. J. Appl. Ecol. 42, 507–517. doi: 10.1111/j.1365-2664.2005.01029.x
De Graaf, M. C. C., Bobbink, R., Smits, N. A. C., van Diggelen, R., and Roelofs, J. G. M. (2009). Biodiversity, vegetation gradients and key biogeochemical processes in the heathland landscape. Biol. Conserv. 142, 2191–2201. doi: 10.1016/j.biocon.2009.04.020
De Schrijver, A., de Frenne, P., Ampoorter, E., van Nevel, L., Demey, A., Wuyts, K., et al. (2011). Cumulative nitrogen input drives species loss in terrestrial ecosystems. Glob. Ecol. Biogeogr. 20, 803–816. doi: 10.1111/j.1466-8238.2011.00652.x
Fagúndez, J. (2012). Heathlands confronting global change: drivers of biodiversity loss from past to future scenarios. Ann. Bot. 111, 151–172. doi: 10.1093/aob/mcs257
Fagúndez, J., and Izco, J. (2016). Spatial analysis of heath toponymy in relation to present-day heathland distribution. Int. J. Geogr. Inform. Sci. 30, 51–60. doi: 10.1080/13658816.2015.1017729
Fang, Y. T., Koba, K., Makabe, A., Takahashi, C., Zhu, W. X., Hayashi, T., et al. (2015). Microbial denitrification dominates nitrate losses from forest ecosystems. Proc. Natl. Acad. Sci. U.S.A. 112, 1470–1474. doi: 10.1073/pnas.1416776112
Friedrich, U., von Oheimb, G., Dziedek, C., Kriebitzsch, W. U., Selbmann, K., and Härdtle, W. (2011a). Mechanisms of purple moor-grass (Molinia caerulea) encroachment in dry heathland ecosystems with chronic nitrogen inputs. Environ. Pollut. 159, 3553–3559. doi: 10.1016/j.envpol.2011.08.010
Friedrich, U., Falk, K., Bahlmann, E., Marquardt, T., Meyer, H., Niemeyer, T., et al. (2011b). Fate of airborne nitrogen in heathland ecosystems: a 15N tracer study. Glob. Chang. Biol. 17, 1549–1559. doi: 10.1111/j.1365-2486.2010.02322.x
Frouz, J., van Diggelen, R., Pizl, V., Stary, J., Hanel, L., Tajovsky, K., et al. (2009). The effect of topsoil removal in restored heathland on soil fauna, topsoil microstructure, and cellulose decomposition: implications for ecosystem restoration. Biodivers. Conserv. 18, 3963–3978. doi: 10.1007/s10531-009-9692-5
Gabet, E. J., Reichmann, O. J., and Seabloom, E. W. (2003). The effects of bioturbation on soil processes and sediment transport. Ann. Rev. Earth Planet. Sci. 31, 249–273. doi: 10.1146/annurev.earth.31.100901.141314
Galloway, J. N., and Cowling, E. B. (2002). Reactive nitrogen and the world: 200 years of change. Ambio 31, 64–71. doi: 10.1579/0044-7447-31.2.64
Gauger, T., Köble, R., and Anshelm, F. (2000). Kritische Luftschadstoff-Konzentrationen und Eintragsraten sowie ihre Überschreitung für Wald und Agrarökosysteme sowie naturnahe waldfreie Ökosysteme. Federal Environmental Agency Report No. 29785079, (Berlin).
Gerzabek, M. H., Haberhauer, G., Stemmer, M., Klepsch, S., and Haunold, E. (2004). Long-term behaviour of 15N in an alpine grassland ecosystem. Biogeochemistry 70, 59–69. doi: 10.1023/B:BIOG.0000049336.84556.62
Gordon, C., Wynn, J. M., and Woodin, S. J. (2001). Impacts of increased nitrogen supply on high Arctic heath: the importance of bryophytes and phosphorus availability. New Phytol. 149, 461–471. doi: 10.1046/j.1469-8137.2001.00053.x
Gurmesa, G. A., Lu, X., Gundersen, P., Mao, Q., Zhou, K., Fang, Y., et al. (2016). High retention of 15N-labeled nitrogen deposition in a nitrogen saturated old-growth tropical forest. Glob. Chang. Biol. 22, 3608–3620. doi: 10.1111/gcb.13327
Hagedorn, F., Maurer, S., Bucher, J. B., and Siegwolf, R. T. W. (2005). Immobilization, stabilization and remobilization of nitrogen in forest soils at elevated CO2: A 15N and 13C tracer study. Glob. Chang. Biol. 11, 1816–1827. doi: 10.1111/j.1365-2486.2005.01041.x
Hagedorn, F., and Schleppi, P. (2000). Determination of total dissolved nitrogen by persulfate oxidation. J. Plant Nutrit. Soil Sci. 163, 81–82. doi: 10.1002/(SICI)1522-2624(200002)163:1<81::AID-JPLN81>3.0.CO;2-1
Härdtle, W., Niemeyer, M., Niemeyer, T., Assmann, T., and Fottner, S. (2006). Can management compensate for atmospheric nutrient deposition in heathland ecosystems? J. Appl. Ecol. 43, 759–769. doi: 10.1111/j.1365-2664.2006.01195.x
IUSS Working Group WRB (2015). World Reference Base for Soil Resources 2014, Updated 2015. International Soil Classification System for Naming Soils and Creating Legends for Soil Maps, Vol. 106. (Rome: FAO).
Jonasson, S., Michelsen, A., Schmidt, I. K., Nielsen, E. V., and Callaghan, T. V. (1996). Microbial biomass C, N and P in two arctic soils and responses to addition of NPK fertilizer and sugar: implications for plant nutrient uptake. Oecologia 106, 507–515. doi: 10.1007/BF00329709
Kleinebecker, T., Schmidt, S. R., Fritz, C., Smolders, A. J. P., and Hölzel, N. (2009). Prediction of δ13C and δ15N in plant tissues with near-infrared reflectance spectroscopy. New Phytol. 184, 732–739. doi: 10.1111/j.1469-8137.2009.02995.x
Kristensen, H. L. (2001). High immobilization of in Danish heath soil related to succession, soil and nutrients: implications for critical loads of N. Water Air Soil Pollut. 1, 211–230. doi: 10.1023/A:1011588007257
Kristensen, H. L., and McCarty, G. W. (1999). Mineralization and immobilization of nitrogen in heath soil under intact Calluna, after heather beetle infestation and nitrogen fertilization. Appl. Soil Ecol. 13, 187–198. doi: 10.1016/S0929-1393(99)00036-0
Larsen, K. S., Michelsen, A., Jonasson, S., Beier, C., and Grogan, P. (2012). Nitrogen uptake during fall, winter and spring differs among plant functional groups in a subarctic heath ecosystem. Ecosystems 15, 927–939. doi: 10.1007/s10021-012-9555-x
Laverman, A. M., Zoomer, H. R., Engelbrecht, D., Berg, M. P., van Straalen, N. M., van Verseveld, H. W., et al. (2000). Soil layer-specific variability in net nitrification and denitrification in an acidic coniferous forest. Biol. Fertil. Soils 32, 427–434. doi: 10.1007/s003740000274
Lenhart, K., Werber, B., Elbert, W., Steinkamp, J., Clough, T., Crutzen, P., et al. (2015). Nitrous oxide and methane emissions from cryptogamic covers. Glob. Chang. Biol. 21, 3889–3900. doi: 10.1111/gcb.12995
Mahendrappa, M. K., and Ogden, E. D. (1973). Patterns of ammonia volatilization from forest soil. Plant Soil 38, 257–265. doi: 10.1007/BF00779010
Maskell, L. C., Smart, S. M., Bullock, J. M., Thompson, K., and Stevens, C. J. (2010). Nitrogen deposition causes widespread loss of species richness in British habitats. Glob. Chang. Biol. 16, 671–679. doi: 10.1111/j.1365-2486.2009.02022.x
Milne, J. A., Pakeman, R. J., Kirkham, F. W., Jones, I. P., and Hossell, J. E. (2002). Biomass production of upland vegetation types in England and Wales. Grass Forage Sci. 57, 373–388. doi: 10.1046/j.1365-2494.2002.00339.x
Nadelhoffer, K. J., Colman, B. P., Currie, W. S., Magill, A., and Aber, J. D. (2004). Decadal-scale fates of 15N tracers added to oak and pine stands under ambient and elevated N inputs at the Harvard Forest (USA). For. Ecol. Manage. 196, 89–107. doi: 10.1016/j.foreco.2004.03.014
Nielsen, K. E., Hansen, B., Ladekarl, U. L., and Nørnberg, P. (2000). Effects of N-deposition on ion trapping by B-horizons of Danish heathlands. Plant Soil 223, 265–276. doi: 10.1023/A:1004853802637
Niemeyer, T., Niemeyer, M., Mohamed, A., Fottner, S., and Härdtle, W. (2005). Impact of prescribed burning on the nutrient balance of heathlands with particular reference to nitrogen and phosphorus. Appl. Vegetat. Sci. 8, 183–192. doi: 10.1111/j.1654-109X.2005.tb00644.x
Nordin, A., Schmidt, I. K., and Shaver, G. R. (2004). Nitrogen uptake by arctic soil microbes and plants in relation to soil nitrogen supply. Ecology 85, 955–962. doi: 10.1890/03-0084
Opelt, K., and Berg, G. (2004). Diversity and antagonistic potential of bacteria associated with bryophytes from nutrient-poor habitats of the Baltic Sea coast. Appl. Environ. Microbiol. 70, 6569–6579. doi: 10.1128/AEM.70.11.6569-6579.2004
Payne, R. J., Stevens, C. J., Dise, N. B., Gowing, D. J., Pilkington, M. G., Phoenix, G. K., et al. (2011). Impacts of atmospheric pollution on the plant communities of British acid grasslands. Environ. Pollut. 159, 2602–2608. doi: 10.1016/j.envpol.2011.06.009
Phoenix, G. K., Emmett, B. A., Britton, A. J., Caporn, S. J. M., Dise, N. B., Helliwell, R., et al. (2012). Impacts of atmospheric nitrogen deposition: responses of multiple plant and soil parameters across contrasting ecosystems in long-term field experiments. Glob. Chang. Biol. 18, 1197–1215. doi: 10.1111/j.1365-2486.2011.02590.x
Pilkington, M. G., Caporn, S. J. M., Carroll, J. A., Cresswell, N., Lee, J. A., Reynolds, B., et al. (2005). Effects of increased deposition of atmospheric nitrogen on an upland moor: nitrogen budgets and nutrient accumulation. Environ. Pollut. 138, 474–485. doi: 10.1016/j.envpol.2005.04.011
Pinheiro, J., Bates, D., DebRoy, S., and Sarkar, D. (2016). nlme: Linear and Nonlinear Mixed Effects Models. R package version 3.1–121.
Power, S. A., Ashmore, M. R., and Cousins, D. A. (1998). Impacts and fate of experimentally enhanced nitrogen deposition on a British lowland heath. Environ. Pollut. 102, 27–34. doi: 10.1016/S0269-7491(98)80011-0
Proctor, M. C. F. (2008). “Physiological ecology,” in Bryophyte Ecology, 2nd Edn., eds B. Goffinet and A. J. Shaw (Cambridge: Cambridge University Press), 237–268.
Rose, R. J., Webb, N. R., Clarke, R. T., and Traynor, C. H. (2000). Changes on the heathlands in Dorset, England, between 1987 and 1996. Biol. Conserv. 93, 117–125. doi: 10.1016/S0006-3207(99)00047-6
Sala, O. E., Chapin, F. S., Armesto, J. J., Berlow, E., Bloomfield, J., Dirzo, R., et al. (2000). Global biodiversity scenarios for the year 2100. Science 287, 1770–1774. doi: 10.1126/science.287.5459.1770
Schimel, J. P., and Bennett, J. (2004). Nitrogen mineralization: challenges of a changing paradigm. Ecology 85, 591–602. doi: 10.1890/03-8002
Schmidt, I. K., Tietema, A., Williams, D., Gundersen, P., Beier, C., Emmett, B. A., et al. (2004). Soil solution chemistry and element fluxes in three European heathlands and their responses to warming and drought. Ecosystems 7, 638–649. doi: 10.1007/s10021-004-0217-5
Sebilo, M., Mayer, B., Grably, M., Billion, D., and Mariotti, A. (2004). The use of the “ammonium diffusion” method for δ15N- and δ15 measurements: comparison with other techniques. Environ. Chem. 1, 99–103. doi: 10.1071/EN04037
Silvertown, J., Tallowin, J., Stevens, C., Power, S. A., Morgan, V., Emmett, B., et al. (2010). Environmental myopia: a diagnosis and a remedy. Trends Ecol. Evol. 25, 556–561. doi: 10.1016/j.tree.2010.06.015
Southon, G. E., Green, E. R., Jones, A. G., Barker, C. G., and Power, S. A. (2012). Long-term nitrogen additions increase likelihood of climate stress and affect recovery from wildfire in a lowland heath. Glob. Chang. Biol. 18, 2824–2837. doi: 10.1111/j.1365-2486.2012.02732.x
Startsev, N. A., and Lieffers, V. J. (2007). Emission of nitrogen gas, nitrous oxide, and carbon dioxide on rehydration of dry feathermosses. Soil Sci. Soc. Am. J. 71, 214–218. doi: 10.2136/sssaj2004.0376
Startsev, N. A., Lieffers, V. J., Landhäusser, S. M., and Velazquez-Martinez, A. (2008). N-transfer through aspen litter and feather moss layers after fertilization with ammonium nitrate and urea. Plant Soil 311, 51–59. doi: 10.1007/s11104-008-9657-6
Templer, P. H., Mack, M. C., Chapin, F. S., Christenson, L. M., Compton, J. E., Crook, H. D., et al. (2012). Sinks for nitrogen inputs in terrestrial ecosystems: a meta-analysis of 15N tracer field studies. Ecology 93, 1816–1829. doi: 10.1890/11-1146.1
Tye, A. M., Young, S. D., Crout, N. M. J., West, H. M., Stapleton, L. M., Poulton, P. R., et al. (2005). The fate of 15N added to high Arctic tundra to mimic increased inputs of atmospheric nitrogen released from a melting snowpack. Glob. Chang. Biol. 11, 1640–1654. doi: 10.1111/j.1365-2486.2005.01044.x
Vandvik, V., Heegaard, E., Maren, I. E., and Aarrestad, P. A. (2005). Managing heterogeneity: the importance of grazing and environmental variation on post-fire succession in heathlands. J. Appl. Ecol. 42, 139–149. doi: 10.1111/j.1365-2664.2005.00982.x
von Oheimb, G., Power, S. A., Falk, K., Friedrich, U., Mohamed, A., Krug, A., et al. (2010). N:P ratio and the nature of nutrient limitation in Calluna-dominated heathlands. Ecosystems 13, 317–327. doi: 10.1007/s10021-010-9320-y
Wood, S. N. (2006). Generalized Additive Models: An Introduction with R. London; New York, NY: Chapmann & Hall/CRC; Boca Raton.
Zuur, A. F., Fichtner, A., Ieno, E. N., and Saveliev, A. A. (2014). “Gamma GAMM applied on tree growth data,” in A beginner's Guide to Generalized Additive Mixed Models with R, eds A. F. Zuur, A. A. Saveliev, and E. N. Ieno (Newburgh, NY: Highland Statistics Ltd.,), 217–239.
Keywords: Calluna vulgaris, critical load, heathland, nitrogen cycling, nitrogen retention, nitrogen saturation
Citation: Bähring A, Fichtner A, Friedrich U, von Oheimb G and Härdtle W (2017) Bryophytes and Organic layers Control Uptake of Airborne Nitrogen in Low-N Environments. Front. Plant Sci. 8:2080. doi: 10.3389/fpls.2017.02080
Received: 22 August 2017; Accepted: 21 November 2017;
Published: 04 December 2017.
Edited by:
Uwe Rascher, Forschungszentrum Jülich, GermanyReviewed by:
Ze-Xin Fan, Xishuangbanna Tropical Botanical Garden (CAS), ChinaTobias Gebauer, Albert Ludwigs University of Freiburg, Germany
Copyright © 2017 Bähring, Fichtner, Friedrich, von Oheimb and Härdtle. This is an open-access article distributed under the terms of the Creative Commons Attribution License (CC BY). The use, distribution or reproduction in other forums is permitted, provided the original author(s) or licensor are credited and that the original publication in this journal is cited, in accordance with accepted academic practice. No use, distribution or reproduction is permitted which does not comply with these terms.
*Correspondence: Werner Härdtle, aGFlcmR0bGVAdW5pLWx1ZW5lYnVyZy5kZQ==