 Scott L. Sydenham
 Annelie Barnard
- Agricultural Research Council-Small Grain, Bethlehem, South Africa
Pre-harvest sprouting (PHS) has been a serious production constraint for over two decades, especially in the summer rainfall wheat production regions of South Africa. It is a complex genetic trait controlled by multiple genes, which are significantly influenced by environmental conditions. This complicates the accurate prediction of a cultivar's stability in terms of PHS tolerance. A number of reports have documented the presence of major QTL on chromosomes 3A and 4A of modern bread wheat cultivars, which confer PHS tolerance. In this study, the SSR marker haplotype combination of chromosomes 3A and 4A of former and current South African cultivars were compared with the aim to select for improved PHS tolerance levels in future cultivars. A total of 101 wheat cultivars, including a susceptible cultivar and five international tolerant sources, were used in this study. These cultivars and donors were evaluated for their PHS tolerance by making use of a rain simulator. In addition, five seeds of each entry were planted out into seedling trays and leaf material harvested for DNA isolation. A modified CTAB extraction method was used before progressing to downstream PCR applications. Eight SSR markers targeted from the well-characterized 3A and 4A QTL regions associated with PHS tolerance, were used to conduct targeted haplotype analysis. Additionally, recently published KASP SNP markers, which identify the casual SNP mutations within the TaPHS1 gene, were used to genotype the germplasm. The haplotype marker data and phenotypic PHS data were compared across all cultivars and different production regions. A relative change in observed phenotypic variation percentage was obtained per marker allele and across marker haplotype combinations when compared to the PHS susceptible cultivar, Tugela-DN. Clear favorable haplotypes, contributing 40–60% of the variation for PHS tolerance, were identified for QTL 3A and 4A. Initial analyses show haplotype data appear to be predictive of PHS tolerance status and germplasm can now be selected to improve PHS tolerance. These haplotype data are the first of its kind for PHS genotyping in South Africa. In future, this can be used as a tool to predict the possible PHS tolerance range of a new cultivar.
Introduction
Pre-harvest sprouting (PHS) is a common phenomenon in the wheat (Triticum aestivum L.) producing areas of South Africa and has been well-documented over the past two decades (Barnard et al., 1997; Barnard, 2001; Barnard and Bona, 2004; Barnard and Smith, 2009). It has been a serious production constraint especially in the summer rainfall regions where rain occurs frequently just prior to or during harvest time. It is well-documented that PHS negatively affects the grain quality and ultimately flour quality. As a result, the price that farmers can get for their crop at harvest is severely affected (Barnard, 2001; Liu et al., 2008).
Research has shown that extensive genotypic variation exists for PHS in South African cultivars, indicating that progress in the development of cultivars with improved sprouting tolerance is feasible (Barnard et al., 1997, 2005; Barnard, 2001). The PHS tolerance levels in South African wheat cultivars has improved significantly over the years as a result of successful breeding (Smit et al., 2010). These winter wheat cultivars can be categorized into three major groups, namely cultivars that are highly tolerant to PHS, cultivars that are highly susceptible to PHS and a third moderate group that includes cultivars that are strongly influenced by the environment (Barnard and Smith, 2009). According to Biddulph et al. (2005) environment, and specifically moisture stress, can have a large effect on dormancy expression. Drought conditions combined with high temperatures during grain filling, tend to increase dormancy in wheat (Mares and Mrva, 2014).
PHS is a complex trait controlled by multiple genes or QTL (Bailey et al., 1999; Mares et al., 2005; Yang et al., 2007) where trait expression is significantly influenced by environmental conditions (Trethowan et al., 1996; Johansson, 2002). This complicates the accurate prediction of the stability of a cultivar in terms of PHS tolerance.
In the past decade, a number of QTL for PHS tolerance have been identified and mapped across all 21 wheat chromosomes in a number of wheat cultivars from different parts of the world (Mori et al., 2005; Ogbonnaya et al., 2007; Chen et al., 2008; Mohan et al., 2009; Jaiswal et al., 2012; Singh et al., 2012; Graybosch et al., 2013). These QTL analyses in wheat led to the identification of markers linked closely with desirable alleles of different QTL (Mares et al., 2005; Chen et al., 2008; Liu et al., 2008; Fofana et al., 2009; Kulwal et al., 2010, 2012). The chromosomes containing the most common and stable major QTL for PHS tolerance are 3A (Kulwal et al., 2005) and 4A (Mares et al., 2005; Mori et al., 2005; Ogbonnaya et al., 2007; Chen et al., 2008; Imtiaz et al., 2008; Zhang et al., 2008). A number of robust reliable simple-sequence repeat (SSR) markers have been associated to a number of these specific QTL for PHS tolerance in specific cultivar backgrounds. However, the characterization and validation of the true phenotypic effects of these QTL individually or in combination in diverse germplasm remains a challenge due to the genetic complexity of the PHS tolerance trait.
The major QTL on chromosome 4A was identified and mapped in 2000 (Flintham, 2000), which is now referred to as the Phs1-A1 locus (Shorinola et al., 2016). Recently, the Phs1-A1 region was fine mapped and new tightly molecular markers with MAS potential were identified. However, the causal gene underpinning the Ph1-A1 locus is still unclear (Barrero et al., 2015; Shorinola et al., 2016). In 2008, a major QTL on chromosome 3A, named Qphs.pseru-3AS, was characterized and mapped from the white wheat cultivar Rio Blanco (Liu et al., 2008). In recent years, some important candidate genes which control PHS tolerance at these (3A and 4A) loci and others have been identified (Liu et al., 2013; Cabral et al., 2014; Barrero et al., 2015; Shorinola et al., 2016; Zhou et al., 2017). Importantly, the TaPHS1 gene, which forms an integral part of the major QTL on chromosome 3A (Qphs.pseru-3AS), which confers PHS tolerance, was cloned and characterized further. Two important, functional SNP mutations within the third and fourth exons of the TaPHS1 gene-coding region, were identified. Both SNP mutations occurred together in all PHS susceptible cultivars covering a set of diverse genetic backgrounds and are considered critical for future PHS tolerant cultivar development (Liu et al., 2013).
The aim of this study was to characterize a collection of South African wheat cultivars for their known PHS tolerance QTL on chromosomes 3A and 4A and to compare marker haplotype combinations observed with the original PHS cultivar scoring averages. In this study, we aim to validate whether these markers could be used during MAS to select for better PHS tolerant cultivars and to determine if it would be possible to predict a cultivar's potential PHS tolerant class based solely on marker haplotypes.
Materials and Methods
Wheat Cultivars and Trials
A total of 96 red wheat cultivars (Table 1) were included in this study and evaluated for their PHS tolerance or susceptibility over a 20 year-period and across six environments per year. These cultivars from three different seed companies (ARC-Small Grain, Pannar and Sensako), were commonly grown under dryland conditions in the summer rainfall dryland area, as well as under irrigation conditions in the central wheat producing areas of South Africa. Tugela-DN was used as a susceptible check, while Elands was included as a tolerant check (Barnard et al., 2005). The cultivars were planted according to a randomized complete block design (RCBD) with four replicates and accessed annually for the period that they were commercially available. Five sources of PHS tolerance namely AC Domain (Fofana et al., 2009) RL4137 (DePauw et al., 2009), Renan (Groos et al., 2002), Transvaal (Morris and DeMacon, 1994) and Rio Blanco (Liu et al., 2008), were also evaluated for their PHS characteristics over the last 3 years.
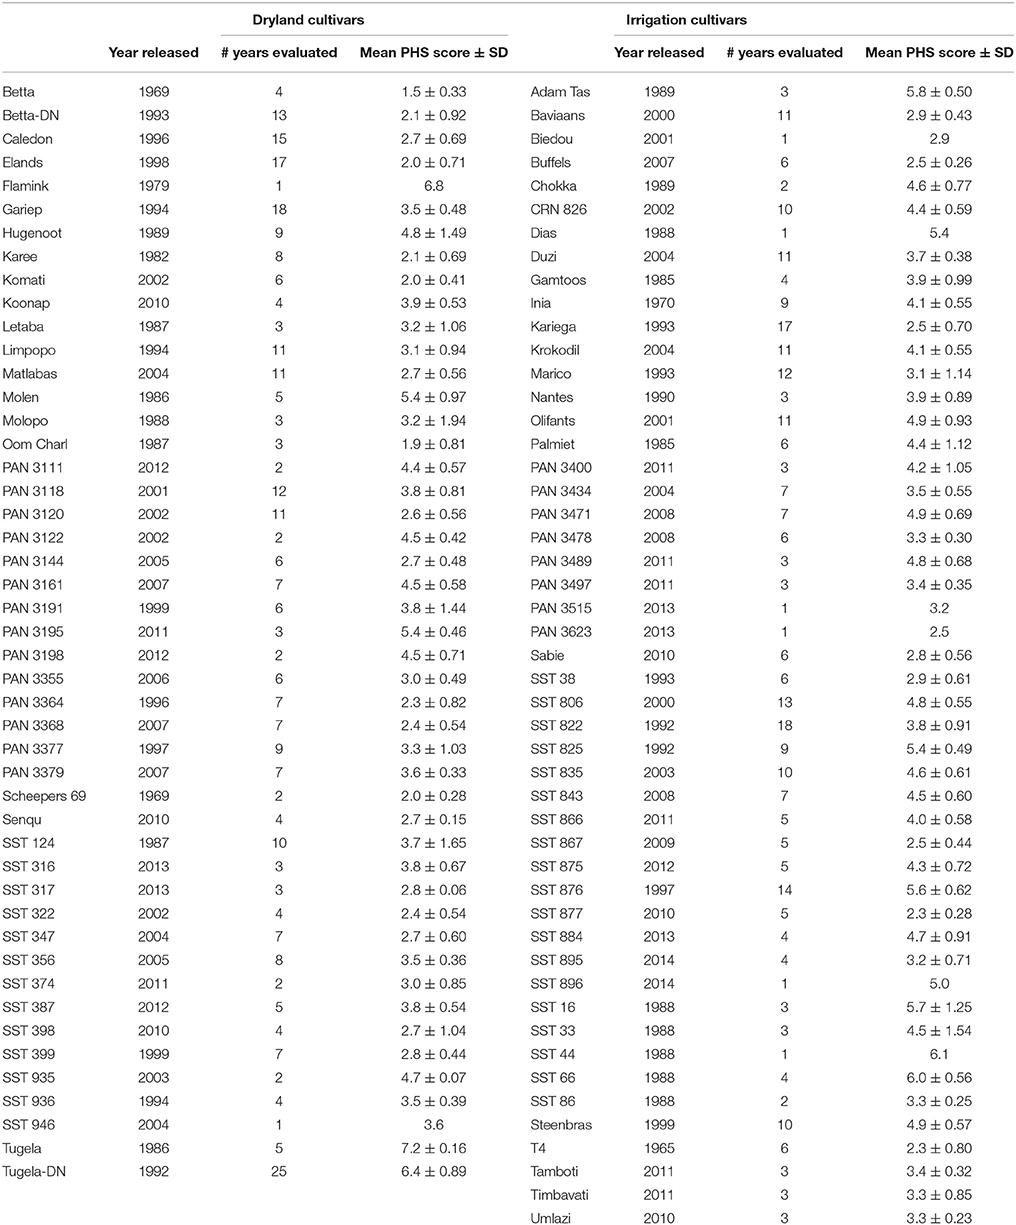
Table 1. The PHS phenotypic data of 96 wheat cultivars commonly grown in South Africa over multiple years and seasons.
Assessment of PHS
During anthesis 48 ears per cultivar were labeled to ensure that all the ears were at the same physiological stage. These ears were hand-harvested at physiological maturity and air dried at room temperature for a week. The ears were then subjected to simulated rainfall for 72 h in a rain simulator at 15°C/25°C day/night temperature with 98% humidity as described by Barnard et al. (1997). According to this technique, individual ears were evaluated on a scale from 1 to 8, where 1 represents total tolerance to PHS and 8 represents total susceptibility (Figure 1). The PHS phenotypic data collected, were averaged per cultivar.
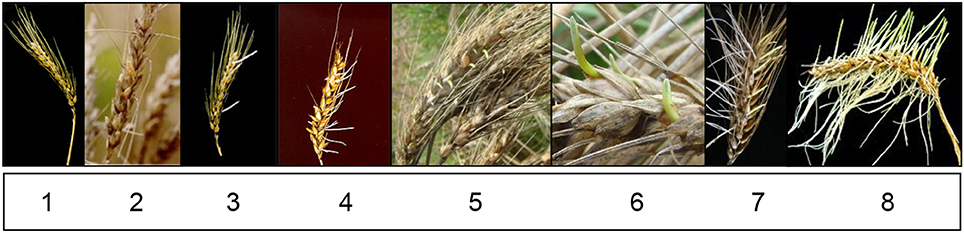
Figure 1. Evaluation scale to determine the PHS tolerant or susceptibility of cultivars.
DNA Isolation
Five seeds of each entry were planted out into seedling trays. Seven days post seedling emergence, fresh leaf material was harvested for DNA isolation. The leaf tissue was homogenized finely within 750 μl of extraction buffer for 1 min at 30 r/s with the Qiagen TissueLyser II. Genomic DNA was isolated according to a modified cetyltrimethylammonium bromide (CTAB) DNA extraction protocol by Saghai-Maroof et al. (1994) and treated with 2 μl RNase A enzyme (Inqaba Biotechnology). The quality, purity and concentration of each DNA sample was determined at 260/280 nm with a Nanodrop 2000 Spectrophotometer (Thermo Scientific Pty Ltd, USA). The DNA samples were then diluted with 1x TE (Tris-EDTA) buffer to 50 ng/μl before progressing to downstream PCR applications.
Markers Used
All SSR marker primer pairs were synthesized by Integrated DNA Technologies (www.IDTDNA.com) and ordered through Whitehead Scientific PTY (Ltd) (www.whitesci.co.za). Initially, 31 different SSR marker primer sequences and relevant PCR conditions were obtained either from Röder et al. (1998) and/or the grain genes 2.0 website (https://wheat.pw.usda.gov/GG2/). These 31 SSR markers were screened on seven local cultivars and the five international sources to identify informative polymorphic markers. Table 2 lists these SSR markers, as well as the targeted PHST QTL per chromosome, and describes whether these markers were informative or not. From the initial screening, four polymorphic SSR markers were identified for potential targeted haplotype combination analysis. These markers, namely Barc57 and Barc12 (3A QTL) and DuPw004 and Wmc650 (4A QTL) were targeted from the well-characterized 3A and 4A QTL regions associated with PHS tolerance. The 96 cultivars, as well as the five international PHS tolerant donors were genotyped with the four SSR markers.
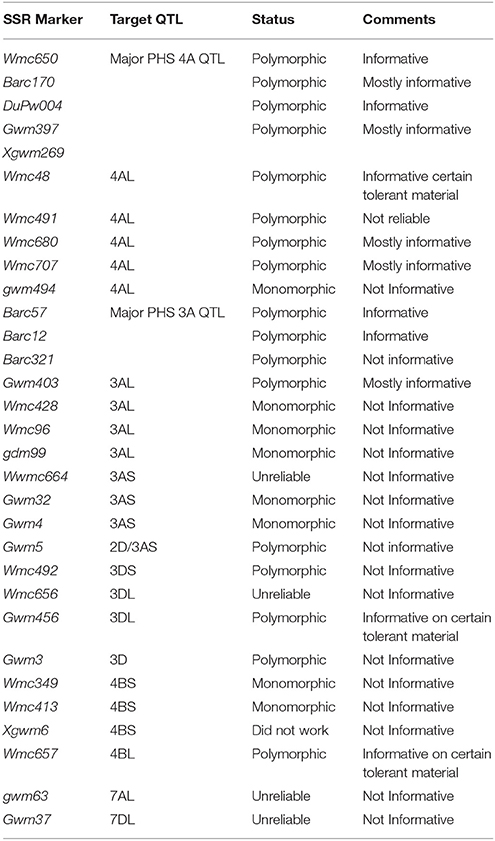
Table 2. List of the SSR markers that were used during the initial screening phase of this study, together with their targeted chromosomes.
Simple Sequence Repeat Analysis
Extracted genomic DNA, totalling a 200 ng (4 μl) concentration was used as template DNA per sample in a 20 μl final volume PCR reaction. Reaction conditions recommended for the KAPA 2X Ready Mix PCR Kit (KAPA Biosystems, Cape Town, South Africa, www.kapabiosystems.com were applied. Each PCR reaction consisted of 10 μl (1x) KAPATaq 2X Ready Mix, 0.5 μl (10 μM) per SSR primer and the remaining volume (5.0 μl) of DNAse Free water. The PCR reactions were performed in a MyCyclerTM Thermal Cycler (www.bio-rad.com) with the following cycling conditions: 3 min at 95°C, 40 cycles of 30 s at 95°C, 30 s at Tm°C, 30 s at 72°C and a final extension step of 5 min at 72°C. After amplification each specific SSR marker PCR amplicons were separated on a 3.0–3.5% (w/v) Certified Low Range Ultra Agarose high-resolution gel (Bio-Rad Laboratories, Inc. www.bio-rad.com), made up in 1x TBE with 1x GRGreen Nucleic Acid gel stain solution (Inqaba Biotechnology, www.labsupplymall.com) and run at 100–125 V for 1–4 h. SSR product sizes were determined according to 100 bp and/or 20 bp (Lonza SimplyLoad®, Lonza Rockland Inc. USA) DNA ladders. A digital gel picture under UV light exposure was taken with the Bio-Rad Molecular Imager Gel Doc™ XR Instrument. Observed SSR marker alleles were sized, recorded and analyzed per cultivar both visually and with image Lab™ gel analysis software.
KASPR Marker Genotyping
Two KASP assays, namely TaPHS1-646 (TaPHS1-SNP1 marker) and TaPHS1-666 (TaPHS1-SNP2 marker), designed during the study of Liu et al. (2013), are considered the functional SNP mutations in and around the TaPHS1 gene region on chromosome 3A. These two KASP assays were screened on the 64 cultivars that were assigned haplotypes based on SSR markers, and the five international tolerant sources. The primer sequences of each assay and PCR condition were obtained from the MAS Wheat Website (http://maswheat.ucdavis.edu/protocols/TaPHS1/index.htm). The PCR reactions and fluorescence detection were performed in an Agilent Technologies Mx3500P Real-time Thermal Cycler as recommended by LGC (http://www.kbioscience.co.uk).
The specific SNP allele for each KASP marker was recorded per cultivar. When one of the unfavorable alleles for either SNP marker was present, a cultivar was predicted as susceptible. When the allele that was present was favorable, but the other allele was missing, a cultivar was treated as unknown. When both alleles were missing, a cultivar was also treated as unknown.
Data Analyses
Four SSR markers, namely Barc57 and Barc12 (3A QTL) and DuPw004 and Wmc650 (4A QTL), were used in the final haplotype analyses of the 3A and 4A QTL. Additive allele identification was performed based on average PHS data for a particular marker haplotype combination on the comparison of mean PHS scores of the susceptible check, Tugela-DN. Mean PHS scores per SSR allele were used to calculate the percentage change in observed phenotypic variation in PHS tolerance from the susceptible check. This was done regardless of genetic background to attempt to reduce the effect that different genetic backgrounds might have on observed PHS tolerance levels. Tugela-DN was used as the susceptible check as a point of reference in the observed phenotypic variation analysis. The average PHS score per marker allele containing multiple genotypes was deducted from the average PHS score of the susceptible cultivar (Tugela-DN) and then divided by the Tugela-DN average to get an observed phenotypic variation percentage. The alleles were then classed as tolerant, moderate or susceptible based on these PHS averages.
Example: Marker 1, Allele 1 = 6.4 (Tugela-DN)–2.9 (Marker 1/Allele 1) = 3.5/6.4 = 54.7% relative observed phenotypic variation (OPV).
Results
PHS Characterization
The 96 cultivars used in this study are listed alphabetically in Table 1. These cultivars released from the late 1960's onwards were evaluated over a period of 25 years. Since new cultivars were released each year and older cultivars withdrawn from the market, it was difficult to evaluate these cultivars for similar periods of time. The number of years that the cultivars were evaluated for their PHS tolerance is therefore also shown in Table 1. Tugela-DN was released as a commercial cultivar in 1992 and has been the susceptible check since, with an average PHS value of 6.4. Elands, released in 1998, has an average PHS value of 2.0 and has been the tolerant check for the last 20 years.
The five international sources, namely AC Domain, RL4137, Rio Blanco, Transvaal and Renan, all had low PHS scores, namely 1.1, 1.2, 1.2, 1.6, and 1.1, respectively. This indicates excellent PHS tolerance.
The PHS tolerance levels of the cultivars in the study varied from excellent (scores lower than 3.0) to moderate (scores between 3.0 and 4.5) to highly susceptible (scores higher than 4.5). The cultivars adapted to dryland conditions were more tolerant to PHS with 43% of the entries having excellent tolerance to PHS, compared to the 20% of excellent tolerance in irrigation cultivars. The number of cultivars with moderate tolerance was similar in both groupings (43 and 47%, respectively, for dryland and irrigation cultivars).
Figure 2 shows the cumulative PHS data over the past 25 years. From these data in it is clear that the older cultivars (released in the previous millennium) had poorer tolerance than cultivars released after 2002. This was especially true for the dryland cultivars. The higher number of susceptible cultivars released in 2006, 2007, 2011, and 2012, were mainly irrigation cultivars.
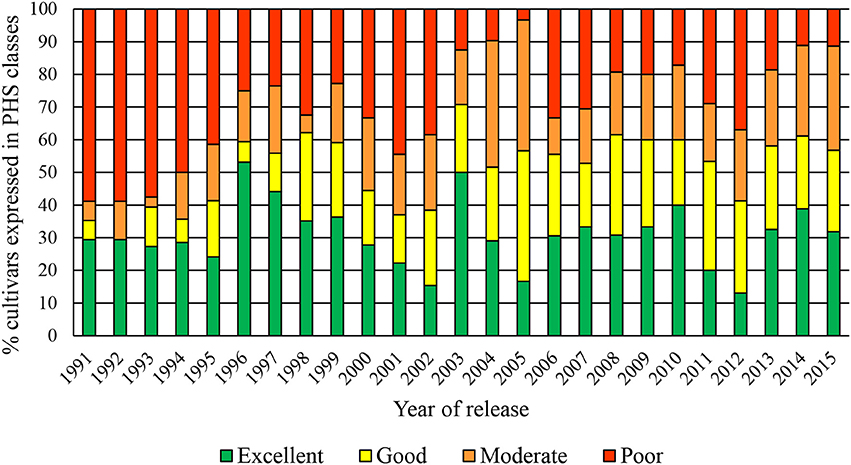
Figure 2. Evaluation scale to determine the PHS tolerant or susceptibility of cultivars.
Favorable Marker Allele Identification
Alleles were considered favorable for PHS tolerance when representative cultivars had PHS average scores of 3.0 or lower. An allele was classified as moderate if the average PHS scores ranged from 3.1 to 4.4. Finally, a marker allele was considered unfavorable for PHS tolerance if the average PHS scores of the representative cultivars were 4.5 or higher.
In Table 3 the single marker alleles for markers flanking the 3A QTL, Barc57 and Barc12, and their relative observed phenotypic variation percentage are shown.
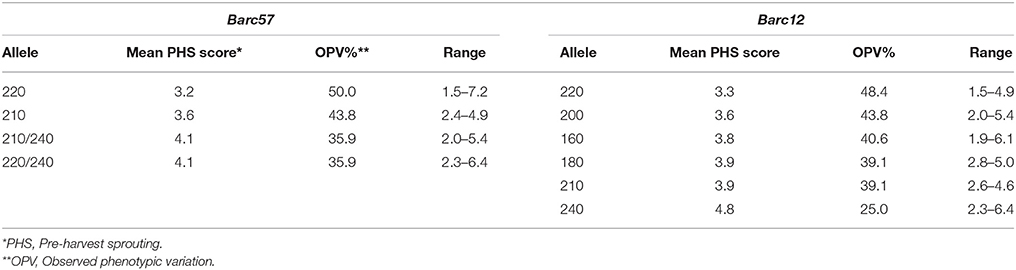
Table 3. Analysis of markers Barc57 and Barc12 that flank the 3A QTL to identify favorable alleles for PHS tolerance and the relative observed phenotypic variation (%) based on rain simulator screening of 96 wheat cultivars.
Barc57
SSR marker Barc57 amplified five different alleles across the cultivars studied (Table 3). Allele Barc57220/240 contributed 53.1% to the observed phenotypic variation (OPV), with an average PHS score of 3.0 and appears to be more favorable for PHS tolerance than alleles Barc57210/240 and Barc57210. The Barc57220 allele, with a 40.6% contribution to the OPV (%), was moderate in its contribution. The Barc57240 allele, with a 20.3% OPV across cultivars, is not favorable for PHS tolerance. Barc57220/240 and Barc57240 should, therefore, be considered for positive and negative MAS, respectively.
Barc12
SSR marker Barc12 amplified six different alleles across the cultivars studied (Table 3). Two favorable alleles for PHS tolerance, namely Barc12240 and Barc12220, were identified with 59.4 and 54.7% OVP contributions, and average PHS values of 2.6 and 2.9, respectively. The four other alleles (Barc12200, Barc12160, Barc12180, and Barc12210) are moderate contributing alleles with an OPV range of 32.8–40.6% and average PHS scores of 3.8, 3.9, 4.3, and 4.3, respectively. SSR Barc12 alleles 240 and 220 should be considered more favorable for MAS to improve PHS tolerance.
Seven and four alleles, respectively, were amplified for the respective flanking 4A QTL SSR markers Wmc650 and DuPw004 (Table 4). No clear favorable single alleles below the 3.0 PHS threshold could be identified for any of these markers.
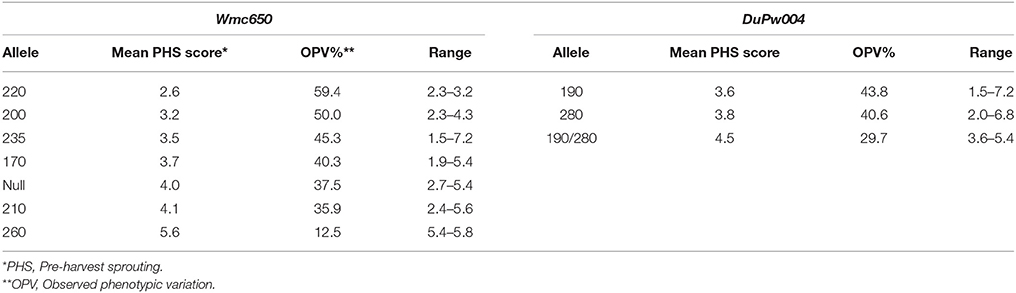
Table 4. Analysis of markers Wmc650 and DuPw004 that flank the 4A QTL to identify favorable alleles for PHS tolerance and the relative observed phenotypic variation (%) based on rain simulator screening of 96 wheat cultivars.
Wmc650
Three alleles, namely Wmc650210, Wmc650220, Wmc650235 are more favorable than the other four alleles that amplified (Table 4). These three alleles contributed between 48.4 and 51.6% to the OPV and had PHS averages of 3.3, 3.1, and 3.2, respectively. Wmc650260 contributed 12.5% OPV and cultivars with this allele present had an average PHS score of 5.6. Wmc650260 is unfavorable for PHS tolerance. Wmc650170, Wmc650200, and Wmc650null reacted moderately with PHS averages of 4.3, 3.9, and 3.6, respectively. MAS Wmc650260 should be avoided when breeding for cultivars with PHS tolerance.
DuPw004
Allele DuPw004190 is more favorable than the other three alleles of DuPw004 with an OPV contribution of 48.4% and a PHS average of 3.3 (Table 4). Alleles DuPw004280, DuPw004190/280, and DuPw004null contributed 34.4–37.5% to the OPV with PHS scores of 4.2, 4.2 and 4.0, respectively. These three alleles are not favorable for the improvement of PHS tolerance in South African germplasm.
Favorable Haplotype Identification
For the whole haplotype analysis, the particular haplotypes were classed in the same manner than the single marker alleles based on the phenotypic PHS evaluation scale (Tolerant ≤ 3.0, Moderate 3.1–4.5 and Susceptible ≥4.6). The moderate class still remains difficult to define with a relevant score threshold as environmental effects might have a bigger influence on this group of cultivars than the other two classes. Cultivars from the moderate class can, depending on season and environment, move between classes.
Favorable Haplotype Identification for the 3A QTL
After the analyses of the allelic SSR marker data across the 3A QTL region, a total of 13 different haplotypes were observed (Table 5). Haplotypes 1 and 2 are considered favorable for PHS tolerance, both with PHS averages of 3.0 and an OPV (%) range of 53.1, respectively. The moderately favorable alleles from single SSR allele analysis, namely Barc57220, Barc12220, and Barc12160, are the contributors to favorable haplotypes 1 and 2. These marker alleles contribute additively to haplotypes 1 and 2 with overall improvements in the PHS averages.
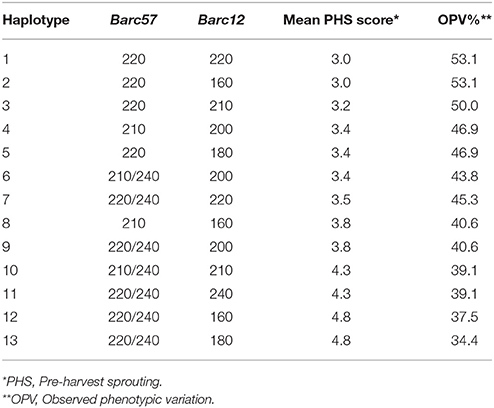
Table 5. Analyses of the haplotype combinations for the 3A QTL across markers Barc57 and Barc12 to determine favorable haplotypes for PHS tolerance and the relative observed phenotypic variation (%) based on rain simulator screening of 96 wheat cultivars.
Haplotypes 3 to 11 are considered moderate contributing haplotypes toward PHS tolerance in South African cultivars for the 3A QTL region (Table 5). Haplotype 3 is a favorable moderate haplotype with a PHS average of 3.2, consisting of two moderate marker alleles Barc57220 and less favorable moderate marker allele Barc12210, suggesting additive allele interactions. Haplotype 4 is a combination of the moderate Barc57210 allele with the moderate Barc12200 allele, while haplotype 5 is a combination of the more favorable moderate Barc57220 allele and the less favorable Barc12180 moderate allele. Haplotype 6 is a combination of the less favorable moderate Barc57210/240 and the more favorable moderate Barc12200 allele combination. Haplotypes 4, 5, and 6 had average PHS scores of 3.4 with 46.9% OVP (%). Haplotype 5, with PHS score of 3.5 and OVP (%) of 45.3% is comprised of two moderate alleles, namely the less favorable Barc57220/240 and the more favorable Barc12220 allele. Haplotypes 8 to 11 are classed as less favorable moderate haplotypes with PHS averages of 3.8, 3.8, 4.3, and 4.3, respectively. These four haplotypes are all different combinations of less favorable moderate alleles from both flanking markers.
Haplotypes 12 and 13 are susceptible haplotypes both with 4.8 PHS averages. These two haplotypes are made up of the less favorable moderate marker allele combinations Barc57220/240 and Barc12160 and Barc12180. These SSR allele combinations of haplotypes 12 and 13 appear to have negative interactions or contribute susceptibility factors as the PHS score averages are higher (indicating more susceptibility) than the single moderate contributing SSR marker alleles.
For the 3A QTL region, haplotypes 1, 2, and 3 can be considered for potential MAS to improve PHS tolerance. Haplotypes 12 and 13 can be targeted negatively in MAS and should strictly be avoided during germplasm development.
Favorable Haplotype Identification for the 4A QTL
Analyses of the allelic SSR marker data across the 4A QTL region, identified ten different haplotypes (Table 6). Haplotypes 1 and 2 are considered highly favorable tolerant haplotypes for PHS tolerance with PHS average scores of 2.2 and 2.6, respectively. Haplotype 1 is a unique combination of two strong moderate alleles Wmc650170 and DuPw004190, working additively to confer a tolerant haplotype. The change of two moderately favorable marker alleles to a favorable haplotype elucidates to strong additive effects in this 4A QTL region or across both QTL regions. Haplotype 2 is a combination of tolerant marker allele Wmc650220 and moderate allele DuPw004190 with negating contributing effects to the haplotype PHS average. Allele Wmc650220 (Table 4) shows a dominant effect on haplotype 2 with a mean PHS score of 2.6.
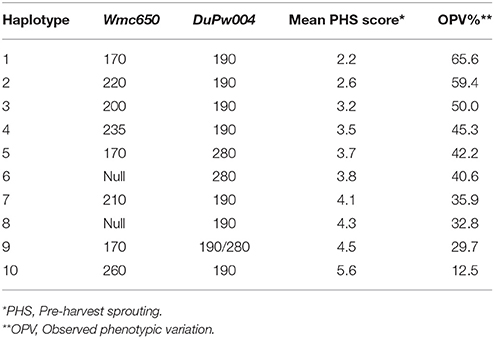
Table 6. Analyses of the haplotype combinations for the 4A QTL across markers Wmc650 and DuPw004 to determine favorable haplotypes for PHS tolerance and the relative observed phenotypic variation (%) based on rain simulator screening of 96 wheat cultivars.
Haplotypes 3 and 4, with PHS mean values of 3.2 and 3.5, respectively (Table 6), are less favorable than haplotypes 1 and 2 for the 4A QTL region and as a result are classified as moderate haplotypes. Both these haplotypes are combinations of moderate contributing alleles for both markers Wmc650 and DuPw004. Haplotypes 5 (PHS = 3.7), 6 (PHS = 3.8), 7 (PHS = 4.1), and 8 (PHS = 4.3) are less favorable moderate haplotypes. These four haplotypes consist of combinations of less favorable moderate marker alleles and contribute less favorably to PHS tolerance than haplotypes 1, 2, 3, or 4.
Haplotypes 9 and 10 are unfavorable for PHS tolerance with mean PHS scores of 4.5 and 5.6, respectively. Haplotype 9 consists of two strong moderate alleles namely Wmc650170 and DuPw004190/280 (Table 4), while haplotype 10 contains the moderately favorable DuPw004190 allele and the susceptible Wmc650260 allele.
Haplotypes 1, 2, and 3 should be considered for potential use in MAS for PHS tolerance, while haplotypes 4, 5, 6, 7, and 8 should be avoided if possible to eliminate the potential moderate PHS class as the moderate class tends to be strongly influenced by environmental factors. Haplotypes 9 and 10 can be targeted negatively for MAS when trying to improve PHS tolerance in new germplasm.
Additive Haplotype Combination Identification Across 3A and 4A QTL
When haplotype combinations for both the 3A and 4A QTL regions combined were considered, 13 different haplotypes were observed after analyses (Table 7). The majority of the cultivars (58%) were classed into haplotype combinations 1, 2, 5, 7, and 8. Two clear favorable additive (tolerant) haplotypes for PHS tolerance, namely haplotypes 1 and 2 both with PHS average scores of 2.7 and OVP (%) contributions of 57.8%, were identified. Haplotype 1 (Table 7) is comprised of the favorable 3A QTL haplotype 1 (Table 5) and the moderately favorable 4A QTL haplotype 4 (Table 6). Haplotype 2 (Table 7) is an additive combination of the 3A QTL haplotype 2 (Table 5) and 4A QTL haplotype 5 (Table 6).
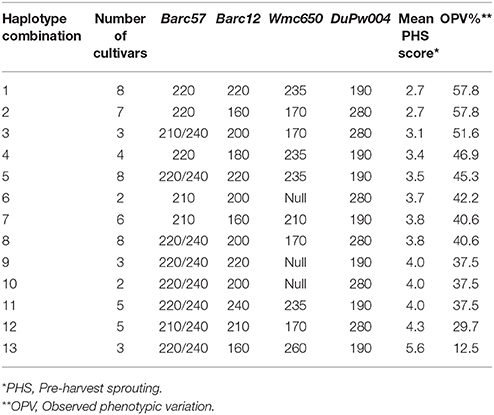
Table 7. Analyses across both 3A and 4A QTL to identify additive haplotype combinations for PHS tolerance and the relative observed phenotypic variation (%) based on rain simulator screening of 96 wheat cultivars.
Haplotypes 3, 4, and 5 are moderately favorable for PHS tolerance with PHS averages of 3.1, 3.4, and 3.5, respectively. These three haplotypes consist of different combinations of favorable and moderately favorable haplotypes. Haplotypes 3, 4 and 5 with OPV (%) in the range of 45.3–51.6% still contributed significantly to the observed phenotypic variation for PHS tolerance. Haplotypes 3, 4, and 5 (Table 7) consist of different combinations of moderate haplotypes from 3A and 4A QTL.
Haplotypes 6, 7, and 8 (Table 7) are shown to be less favorable moderate haplotypes across both the 3A and 4A QTL regions, with average PHS scores of 3.7, 3.8, and 3.8, respectively. Haplotypes 9, 10, 11, and 12 are strong moderate haplotypes with average PHS scores of 4.0, 4.0, 4.0, and 4.3, which are less favorable for PHS tolerance. The OPV (%) contribution range of 29.7–37.5%, resulted from different combinations of moderate haplotypes from both the 3A QTL and 4A QTL.
It is important to note that the susceptible haplotype 13 (Table 5) of the 3A QTL region and the strong moderate haplotype 9 (Table 6) for the 4A QTL region, did not appear regularly in any haplotype combinations across the 3A and 4A QTL region (Table 7).
The highly unfavorable susceptible haplotype 13 (Table 7) with an average PHS value of 5.6 contributed a low 12.5% toward the PHS tolerance observed. It is comprised of the susceptible haplotype combination of haplotype 12 (Table 5) for the 3A QTL and haplotype 10 (Table 6) for 4A QTL region.
PHS Class Prediction Based on SSR Marker Data
Only haplotype combinations that were present in two or more of the cultivars were considered for analysis. Haplotypes were considered unique when different combinations of the representative haplotypes in 3A and 4A QTL analysis only appeared once, or when a totally unique single SSR marker allele was present in the genotype. The results of the PHS prediction based on marker haplotypes are shown in Table 8A for dryland cultivars and Table 8B for irrigation cultivars. In these tables the cultivars with unique haplotypes were removed and were not used in the prediction. In the end, 64 cultivars of the original 96 were used in the prediction of PHS.
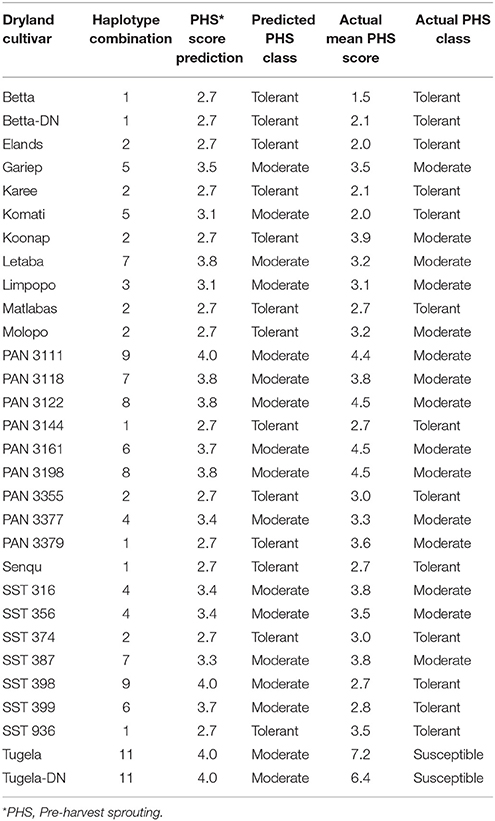
Table 8A. PHS tolerance class prediction based on molecular marker haplotype combinations across 3A and 4A QTL on the dryland cultivars used in this study.
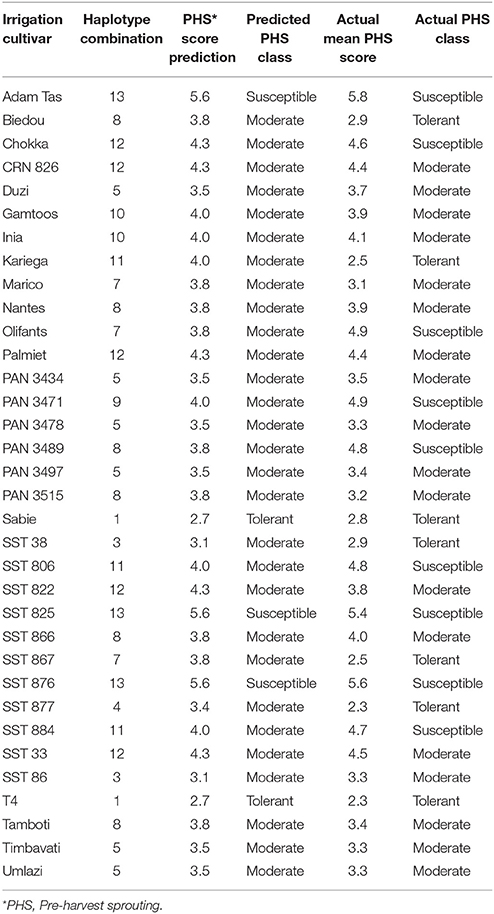
Table 8B. PHS tolerance class prediction based on molecular marker haplotype combinations across 3A and 4A QTL on the irrigation cultivars used in this study.
Dryland Cultivar Predictions
Thirty of the 47 dryland cultivars could be assigned to a specific haplotype combination (Table 8A). Seventeen cultivars had unique haplotypes and were removed from the analyses. Of the 30 cultivars that were haplotyped, only seven did not predict the correct PHS class. In 76.7% of the time, the haplotype combinations were able to predict the correct PHS class overall for the dryland cultivars. The 30 cultivars that were haplotyped, could be divided into true PHS classes, where 13 cultivars were tolerant, 15 were moderate and two cultivars were susceptible. Within the tolerant class, 10 out of the 13 cultivars (76.9%) were predicted correctly. Within the moderate class, 12 of the 15 cultivars (80.0%) were predicted correctly. Both susceptible cultivars were incorrectly predicted as moderate.
Irrigation Cultivar Predictions
Thirty-four of the 49 irrigation cultivars could be assigned to a haplotype combination (Table 8B). Fifteen cultivars have unique or unassignable haplotype combinations based on the SSR data across both the 3A and 4A QTL and were removed. The haplotype analysis on irrigation cultivars was able to predict the correct PHS class of 67.6% of the irrigation cultivars after comparison with the actual PHS average scores. Of the 34 cultivars haplotyped, seven were classed as tolerant, 18 as moderate and nine as susceptible based on the actual PHS score averages. Two of the seven tolerant cultivars (28.6%) and three of the nine (33.3%) susceptible cultivars were predicted correctly. Of the moderate classed cultivars all 18 (100%) were predicted correctly based on the relative haplotype combination analysis. This mixture of prediction accuracy could be a result of the different environmental conditions and more complex gene interactions at play under irrigation production.
TaPHS1 SNP Genotyping
The two diagnostic causal SNP mutation markers of the TaPHS1 gene region, TaPHS1-646 and TaPHS1-666, were screened on the 64 cultivars, which were successfully assigned a SSR haplotype combination across the 3A and 4A QTL regions (Tables 9A,B). Thirty-two cultivars were not considered for SNP genotyping based on the unique SSR haplotype combinations observed in those cultivars. With the nature of the SNP data only being able to reliably distinguish between tolerant and susceptible classes, an adjustment in prediction methodology was needed. For this SNP data analyses an actual PHS average score of 3.5 was considered a threshold between tolerant and susceptible classes. For the purpose of these analyses, a cultivar was considered tolerant with a PHS value ≤ 3.4 and susceptible with a PHS value ≥3.5.
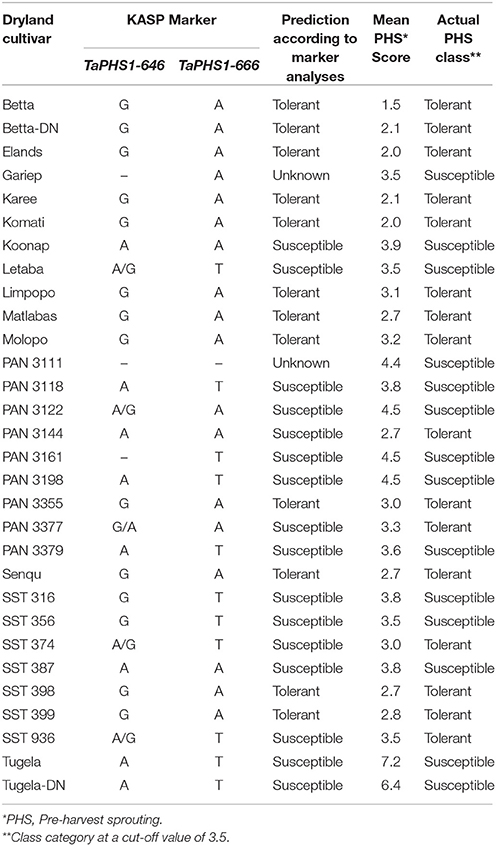
Table 9A. PHS tolerance class prediction based on KASP SNP marker analyses on the dryland cultivars used in this study.
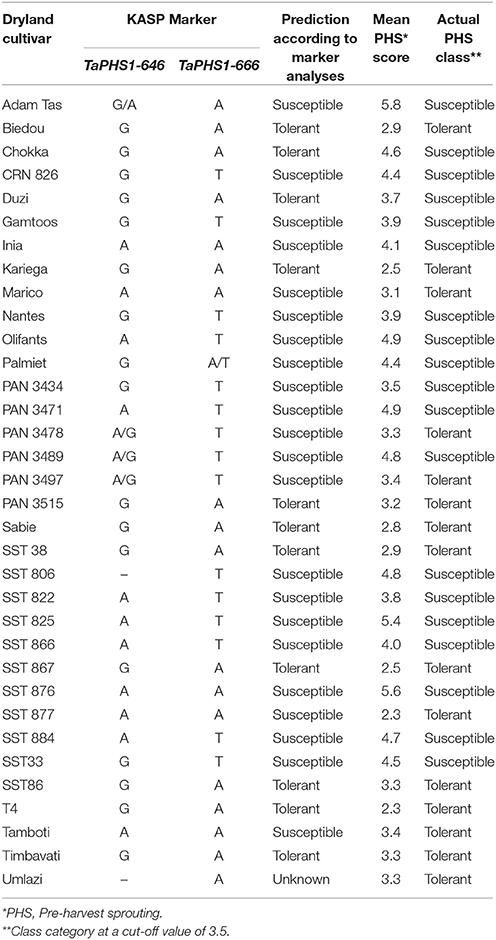
Table 9B. PHS tolerance class prediction based on KASP SNP marker analyses on the irrigation cultivars used in this study.
PHS susceptibility is based on the presence of one or both of the unfavorable alleles A (for the TaPHS1-646 marker) and T (for the TaPHS1-666 marker).
The international tolerant sources AC Domain, RL4137, Rio Blanco and Renan all amplified the favorable SNP alleles for PHS tolerance, namely the G allele for TaPHS1-646 and the A allele for TaPHS1-666. The tolerant source, Transvaal, had a mixed haplotype with the favorable SNP allele at Ta-PHS1-646, but is heterozygous with a T/A SNP allele at the TaPHS1-666. The local tolerant cultivar, Elands, contained both favorable SNP alleles for PHS tolerance. Tugela-DN, which is the local susceptible check, contained the complete susceptible haplotype across the TaPHS1 gene region, with the A allele and T allele present for TaPHS1-646 and TaPHS1-666, respectively.
Dryland Cultivar Predictions Based on TaPHS1 SNP Genotyping
Thirty dryland cultivars were screened with both SNP markers TaPHS1-646 and TaPHS1-666 (Table 9A). Some cultivars gave reliability difficulties on each of the markers. After several reaction and procedural repeats, two cultivars (Gariep and PAN 3111) still had missing data and were referred to as unknown in terms of a prediction as explained in section KASPR Marker Genotyping. According to this methodology, the cultivar PAN 3161 was predicted as susceptible based on the presence of one unfavorable allele.
From the joint SNP data of markers TaPHS1-646 and TaPHS1-666, 24 of the 28 (85.7%) cultivars were predicted into the correct PHS classes based on this analysis. This equates to a 9% improvement in prediction accuracy from the SSR haplotype predictions on the same dryland cultivars (Table 8A). Twelve of the 16 tolerant dryland cultivars were accurately predicted (75.0%) and all 12 susceptible cultivars were correctly predicted as susceptible (100%).
Irrigation Cultivar Predictions Based on TaPHS1 SNP Genotyping
The genotypic SNP data and PHS class prediction of the 34 irrigation cultivars is presented in Table 9B. These predictions are based solely on the SNP data. The cultivar Umlazi was treated as unknown in the prediction class because of unreliable and missing SNP data as discussed in section KASPR Marker Genotyping. The cultivar SST 806 was predicted as susceptible based on the presence of the unfavorable allele for the TaPHS1-666 marker according to the methodology explained previously.
Twenty-six of the remaining 33 cultivars (78.8%) were predicted correctly into tolerant or susceptible classes after comparison with the actual PHS scores. This is an 11% percent accuracy improvement from the 67.6% class prediction accuracy achieved with SSR haplotype data analysis. Nine of the 14 tolerant cultivars (64.3%) were predicted correctly and 17 of the 19 susceptible cultivars (89.5%) were accurately predicted as susceptible.
Across all cultivars, the TaPHS1 SNP data predicted 70% of the tolerant cultivars and 94% of susceptible cultivars correctly, based on the 3.5 PHS average threshold.
Discussion
The cultivars that were assessed in this study were released by three different seed companies and represented diverse genetic backgrounds and growth types. All wheat cultivars grown in South Africa are red wheat types with exceptional bread making quality characteristics (Smit et al., 2010).
The PHS tolerance levels in South African wheat cultivars has steadily improved directly or indirectly through wheat breeding over the past 25 years (Barnard et al., 2005; Smit et al., 2010). As a result of continuous evaluations and adaptations to the respective breeding programmes, the PHS tolerance of cultivars improved to such an extent that only three of the dryland cultivars that are currently commercially available, have poor PHS tolerance compared to the almost 60% of cultivars with poor PHS tolerance in 1991 (Barnard et al., 1997). It is well-known that environmental conditions during grain filling can have a large effect on the expression of dormancy (Biddulph et al., 2007). Research by Biddulph et al. (2005, 2007) has shown that drought conditions during grain filling might increase dormancy in certain cultivars (Mares and Mrva, 2014). These phenomena could explain the high variation in the PHS levels of the moderate group of cultivars, especially in the dryland production regions where sporadic periods of moisture stress and high temperatures are experienced. Opposed to the higher PHS levels in dryland cultivars, it has been shown over many years that cultivars grown under irrigated conditions in South Africa do not display the same levels of tolerance. However, in these irrigated production areas moisture stress is not a factor. Previous research by Biddulph et al. (2007) has shown that a reduction in dormancy can occur when the water supply was high during the later stages of grain filling. Therefore, the sufficient supply of water at critical growth stages might reduce dormancy, possibly explaining the lower levels of PHS observed in irrigation cultivars in South Africa.
This study was the first to investigate the distribution and effect of known major QTL for PHS tolerance in South African wheat cultivars. The well-documented 3A and 4A QTL (Kulwal et al., 2005, 2012; Mares et al., 2005; Chao et al., 2010; Cao et al., 2016) were targeted for further investigation after initial screenings with several SSR markers.
According to the data from this study, the South African PHS tolerant check, Elands, compares favorably with the international sources. Based on pedigree comparisons there are no known PHS tolerance donor to confer tolerance. Data from this study are the first indication of the underlining genetic basis of the PHS tolerance in this cultivar to be predominantly as a result of the TaPHS1 gene and other additive QTL combinations. From SSR haplotying it appears that different alleles of the contributing genes of the Phs1-A1 locus (4A QTL) might be different from the international PHS tolerant donors.
According to previous research the 3A Qphs.pseru-3AS (Kulwal et al., 2005; Liu et al., 2008, 2011) and 4A QTL regions (Flintham, 2000; Mares et al., 2005; Ogbonnaya et al., 2007; Chen et al., 2008; Zhang et al., 2008; Graybosch et al., 2013; Cabral et al., 2014) contribute significantly to the partial PHS tolerance conferred by multiple genes. Additional common and stable QTL for PHS tolerance are 2A (Mohan et al., 2009), 2B (Chao et al., 2016; Fakthongphan et al., 2016), 3B, 3D (Kulwal et al., 2004; Ogbonnaya et al., 2007; Fofana et al., 2009; Jaiswal et al., 2012), 4B (Kulwal et al., 2012; Cao et al., 2016), 5A (Groos et al., 2002), 6B and 7D (Roy et al., 1999). Similar to other genetic studies that suggest that genes linked with PHS tolerance are mostly located on chromosome 3A and 4A (Graybosch et al., 2013; Cabral et al., 2014), it became clear from the current study that the effects of the 3A and 4A QTL on the phenotypic variation of PHS of South African cultivars are most important.
The four SSR markers, Barc57, Barc12, Wmc650, and DuPw004 used to haplotype the studied material, identified clear single favorable marker alleles across diverse genetic backgrounds, which can be considered for MAS. The same markers for the 3A QTL region were used during the fine mapping and cloning of candidate gene TaPHS1 (Liu et al., 2013). These markers have also been used successfully during the positional mapping of these QTL in previous studies (Singh et al., 2012; Tyagi and Gupta, 2012; Cao et al., 2016). The allelic variation identified with the four SSR markers strongly suggests the presence of different allelic versions of candidate genes or presence of novel mutations at the 3A and 4A QTL regions. The 13 haplotypes identified for the 3A QTL, as well as the 10 haplotypes for the 4A QTL, represented cultivars from all three PHS tolerance classes (tolerant, moderate and susceptible). In other mapping studies, an explained phenotypic variation for a single allele linked to PHS tolerance ranged between 15 and 45% (Hori et al., 2010; Chang et al., 2011; Liu et al., 2011). In the current study the OPV (%) range (higher than 40%) which was calculated in nine out of the 13 haplotypes for the 3A QTL and six out of the 10 haplotypes for the 4A QTL, indicated significant contributions by favorable haplotypes toward PHS tolerance. This OPV (%) range of up to almost 60% suggests the additive effect of the contribution of candidate genes within both the 3A and 4A QTL regions. From these combined analyses, it is therefore clear that additive haplotype combinations can be targeted during MAS.
Based on SSR haplotyping, cultivars were predicted to have a certain PHS tolerance. This is the first attempt to predict PHS tolerance based on molecular data in commercially available cultivars. In the case of dryland cultivars, this methodology predicted the correct PHS class in almost 77% of the time and 68% in the irrigation cultivars. Although some of the predictions based on SSR haplotyping classed cultivars incorrectly, in these cases cultivars were always classed in the group directly following or directly prior to that specific grouping and never two groupings apart. At no stage was a susceptible cultivar wrongly classed as tolerant or a tolerant cultivar wrongly classed as susceptible. The cultivars were always wrongly grouped between moderate and tolerant or moderate and susceptible classes.
Analyses based on SNP haplotyping were different, because only two PHS classing groups (tolerant and susceptible) were considered. In this case, cultivars that were phenotypically tolerant could be predicted through SNP haplotyping as susceptible or vice versa. Importantly, the SNP predictions were based solely on the contributions made by the TaPHS1 gene of the 3A QTL. The contributions of the 4A QTL, Phs1-A1 (Barrero et al., 2015; Shorinola et al., 2016), are unknown for these predictions and warrant further investigation on this germplasm. Predictions made with SNP data were more accurate than the SSR data with an improvement of almost 10% in both dryland and irrigation cultivars. Dryland cultivars were predicted correctly in 86% of the cases, while the irrigation cultivars were correct in 78% of cases. However, markers TaPHS1-646 and TaPHS1-666 were not completely diagnostic as mentioned by Liu et al. (2013), possibly due to the fact that South African cultivars might have novel mutations in and around the TaPHS1 gene.
With the SNP data it was harder to correctly predict tolerant cultivars than susceptible cultivars, possibly due to the masking effect of moderate cultivars, as well as the unknown effects of the 4A QTL and potential susceptibility factors. The accurate predictions of moderately tolerant cultivars remains a challenge. However, the data from this study has given more insight into the genetic variation within the moderate class, further emphasizing the complexity of the PHS traits influenced by the environment (Kulwal et al., 2012; Liu et al., 2013; Mares and Mrva, 2014). The high success rate of predicted values of almost 82% on average are indicative of the possible application of this methodology in future PHS screenings. It appears that these data could be a preliminary indication of a cultivar's potential PHS class. However, the lack of a universal PHS evaluation scale, as well as the theoretical cut-off PHS score between classes, might influence the prediction outcomes.
In future, the SNP markers (TaPHS1-646 and TaPHS1-666) specific to the 3A QTL can be used to select for better PHS tolerance cultivars. The newly published diagnostic markers for the Phs1-A1 locus need to be validated on this set of cultivars. Potentially the combination of using targeted MAS for TaPHS1 (3A) and Phs1-A1 (4A) with true diagnostic markers, may improve PHS class prediction accuracy in the future. It is envisaged that this methodology will be further fine-tuned and validated with in-season phenotyping screenings and leaf material sampling to assist with PHS tolerance classification and recommendations.
The fact that the phenotypic PHS screenings of the 96 cultivars were conducted over a 25-year period and at several wheat producing localities throughout the wheat production areas of South Africa, could also have influenced the outcome of the data. It has been reported that environmental effects play a significant role in the PHS tolerance or susceptibility of certain cultivars (Barnard, 2001; Barnard et al., 2005; Barnard and Smith, 2009).
The methodology explained in this study has the potential to be applied in a MAS approach to predict the PHS tolerance class during the development of germplasm, enabling breeders to select for and release cultivars with improved PHS tolerance.
Author Contributions
Both authors have contributed to the work and agreed to be in the author list. SS is the molecular scientist and contributed molecular data and the interpretation thereof. AB, as the plant physiologist, contributed phenological PHS data and the interpretation thereof. Both authors contributed to the writing of the manuscript and preparing it for publication.
Funding
Funding for this research wasmade possible by theWinter Cereal Trust (WCT/W/2014/01) and the Agricultural Research Council (000903-Y5).
Conflict of Interest Statement
The authors declare that the research was conducted in the absence of any commercial or financial relationships that could be construed as a potential conflict of interest.
The reviewer FG and handling Editor declared their shared affiliation.
Acknowledgments
Ms Shunay Human and Ms Bongiwe Nhlapho are acknowledged for technical support.
References
Bailey, P. C., McKibbin, R. S., and Lenton, J. R. (1999). Genetic map location for orthoilogous VP1 genes in wheat and rice. Theor. Appl. Genet. 98, 281–284. doi: 10.1007/s001220051069
Barnard, A., and Smith, M. F. (2009). The effect of rainfall and temperature on the preharvest sprouting tolerance of winter wheat in the dryland production areas of the free state province. Field Crops Res. 112, 158–164. doi: 10.1016/j.fcr.2009.02.011
Barnard, A., Van Deventer, C. S., and Maartens, H. (2005). Genetic variability of preharvest sproutingthe south african situation. Euphytica 143, 291–296. doi: 10.1007/s10681-005-7885-x
Barnard, A. (2001). The genetic diversity of South African winter wheat cultivars in relation to their preharvest sprouting resistance and falling number. Euphytica 119, 109–112. doi: 10.1023/A:1017571212607
Barnard, A., and Bona, L. (2004). Sprout damage and falling number in South African and Hungarian wheats. Cer. Res. Commun. 32, 259–264.
Barnard, A., Purchase, J. L., Smith, M. F., and Van Lill, D. (1997). Determination of the preharvest sprouting resistance of South African winter wheat (Triticum aestivum L) cultivars. S. A. J. Plant Soil 14, 4–8. doi: 10.1080/02571862.1997.10635073
Barrero, J. M., Cavanagh, C., Verbyla, K. L., Tibbits, J. F. G., Verbyla, A. P., Huang, B. E., et al. (2015). Transcriptomic analysis of wheat near-isogenic lines identifies PM19-A1 and A2 as candidates for a major dormancy QTL. Genome Biol. 16, 93–111. doi: 10.1186/s13059-015-0665-6
Biddulph, T. B., Mares, D. J., Plummer, J. A., and Setter, T. L. (2005). Drought and high temperature increases preharvest sprouting tolerance in a genotype without grain dormancy. Euphytica 143, 277–283. doi: 10.1007/s10681-005-7882-0
Biddulph, T. B., Plummer, J. A., Setter, T. L., and Mares, D. J. (2007). Influence of high temperature and terminal moisture stress on dormancy in wheat (Triticum aestivum L). Field Crops Res. 103, 139–153. doi: 10.1016/j.fcr.2007.05.005
Cabral, A. L., Jordan, M. C., McCartney, C. A., You, F. M., Humphreys, D. G., MacLachlan, R., et al. (2014). Identification of candidate genes, regions and markers for pre-harvest sprouting resistance in wheat (Triticum aestivum L). BMC Plant Biol. 14, 340–352. doi: 10.1186/s12870-014-0340-1
Cao, L., Hayashi, K., Tokui, M., Mori, M., Miura, H., and Onishi, K. (2016). Detection of QTLs for traits associated with pre-harvest sprouting resistance in bread wheat (Triticum aestivum L.). Breed. Sci. 66, 260–270. doi: 10.1270/jsbbs.66.260
Chang, C., Zhang, H. P., Zhao, Q. X., Feng, J. M., Si, H. Q., Lu, J., et al. (2011). Rich allelic variations of Viviparous-1A and their associations with seed dormancy/pre-harvest sprouting of common wheat. Euphytica 179, 343–353. doi: 10.1007/s10681-011-0348-7
Chao, S., Elias, E., Benscher, D., Ishikawa, G., Huang, Y.-F., Saito, M., et al. (2016). Genetic mapping of major-effect seed dormancy quantitative trait loci on chromosome 2B using recombinant substitution lines in tetraploid wheat Crop Sci. 56, 59–72. doi: 10.2135/cropsci2015.05.0315
Chao, S., Xu, S. S., Elias, E. M., Faris, J. D., and Sorrells, M. E. (2010). Identification of chromosome locations of genes affecting preharvest sprouting and seed dormancy using chromosome substitution lines in tetraploid wheat (Triticum turgidum L.). Crop Sci. 50, 1180–1187. doi: 10.2135/cropsci2009.10.0589
Chen, C.-X., Cai, S.-B., and Bai, G.-H. (2008). A major QTL controlling seed dormancy and pre-harvest sprouting resistance on chromosome 4A in a Chinese wheat landrace. Mol. Breed. 21, 351–358. doi: 10.1007/s11032-007-9135-5
DePauw, R. M., Clarke, F. R., Fofana, B., Knox, R., Humphreys, G., and Cloutier, S. (2009). RL4137 contributes preharvest sprouting resistance to Canadian wheats. Euphytica 168, 347–361. doi: 10.1007/s10681-009-9933-4
Fakthongphan, J., Bai, G., St Amand, P., Graybosch, R. A., and Baenziger, P. S. (2016). Identification of markers linked to genes for sprouting tolerance (independent of grain color) in hard white winter wheat (HWWW). Theor. Appl. Genet. 129, 419–430. doi: 10.1007/s00122-015-2636-4
Flintham, J. E. (2000). Different genetic components control coat-imposed and embryo-imposed dormancy in wheat. Seed Sci. Res. 10, 43–50. doi: 10.1017/S0960258500000052
Fofana, B., Humphreys, D. G., Rasul, G., Cloutier, S., Brule-Babel, A., Woods, S., et al. (2009). Mapping quantitative trait loci controlling pre-harvest sprouting resistance in a red x white seeded spring wheat cross. Euphytica 165, 509–521. doi: 10.1007/s10681-008-9766-6
Graybosch, R. A., St Amand, P., and Bai, G. (2013). Evaluation of genetic markers for prediction of preharvest sprouting tolerance in hard white winter wheats. Plant Breedi. 132, 359–366. doi: 10.1111/pbr.12071
Groos, C., Gay, G., Perretant, M.-R., Gervais, L., Bernard, M., Dedryver, F., and Charmet, G. (2002). Study of the relationship between pre-harvest sprouting and grain color by quantitative trait loci analysis in a white x red grain bread-wheat cross. Theor. Appl. Genet. 104, 39–47. doi: 10.1007/s001220200004
Hori, K., Sugimoto, K., Nonoue, Y., Ono, N., Matsubara, K., Yamanouchi, U., et al. (2010). Detection of quantitative trait loci controlling pre-harvest sprouting resistance by using backcrossed populations of japonica rice cultivars. Theor. Appl. Genet. 120, 1547–1557. doi: 10.1007/s00122-010-1275-z
Imtiaz, M., Ogbonnaya, F. C., Oman, J., and Van Ginkel, M. (2008). Characterization of quantitative trait loci controlling genetic variation for preharvest sprouting in synthetic backcross-derived wheat lines. Genetics 178, 1725–1736. doi: 10.1534/genetics.107.084939
Jaiswal, V., Mir, R. R., Mohan, A., Balyan, H. S., and Gupta, P. K. (2012). Association mapping for pre-harvest sprouting tolerance in common wheat (Triticum aestivum L.) Euphytica 188, 89–102. doi: 10.1007/s10681-012-0713-1
Johansson, E. (2002). Effect of two genotypes and Swedish environment on falling number, amylase activities, and protein concentration and composition. Euphytica 126, 143–149. doi: 10.1023/A:1019646916905
Kulwal, P. L., Ishikawa, G., Benscher, D., Feng, Z., Yu, L.-X., Jadhav, A., et al. (2012). Association mapping for pre-harvest sprouting resistance in white winter wheat. Theor. Appl. Genet. 125, 793–805. doi: 10.1007/s00122-012-1872-0
Kulwal, P. L., Kumar, N., Gaur, A., Khurana, P., Khurana, J. P., Tyagi, A. K., et al. (2005). Mapping of a major QTL for pre-harvest sprouting tolerance on chromosome 3A in bread wheat. Theor. Appl. Genet. 111, 1052–1059. doi: 10.1007/s00122-005-0021-4
Kulwal, P. L., Mir, R. R., Kumar, S., and Gupta, P. L. (2010). QTL Analysis and molecular breeding for seed dormancy and pre-harvest sprouting tolerance in bread wheat. J. Plant Biol. 37, 59–74.
Kulwal, P. L., Singh, R., Balyan, H. S., and Gupta, P. K. (2004). Genetic basis of pre-harvest sprouting tolerance using single-locus and two-locus QTL analyses in bread wheat. Funct. Integr. Genomics 4, 94–101. doi: 10.1007/s10142-004-0105-2
Liu, S., Bai, G., Cai, S., and Chen, C. (2011). Dissection of genetic components of preharvest sprouting resistance in white wheat. Mol. breed. 27, 511–523. doi: 10.1007/s11032-010-9448-7
Liu, S., Cai, S., Graybosch, R. A., Chen, C., and Bai, G. (2008). Quantitative trait loci for resistance to pre-harvest sprouting in US hard white winter wheat Rio Blanco. Theor. Appl. Genet. 117, 691–699. doi: 10.1007/s00122-008-0810-7
Liu, S., Sehgal, K., Li, J., Lin, M., Tjrick, H. N., Yu, J., et al. (2013). Cloning and Characterization of a critical regulator for preharvest sprouting in wheat. Genetics 195, 263–273. doi: 10.1534/genetics.113.152330
Mares, D. J., and Mrva, K. (2014). Wheat grain preharvest sprouting and late maturity alpha-amylase. Planta 240, 1167–1178. doi: 10.1007/s00425-014-2172-5
Mares, D., Mrva, K., Cheong, J., Williams, K., Watson, B., Storlie, E., et al. (2005). A QTL located on chromosome 4A associated with dormancy in white and red- grained wheat of diverse origin. Theor. Appl. Genet. 111, 1357–1364. doi: 10.1007/s00122-005-0065-5
Mohan, A., Kulwal, P., Singh, R., Kumar, V., Mir, R. R., Kuman, J., et al. (2009). Genome-wide QTl analysis for pre-harvest sprouting tolerance in bread wheat. Euphytica 168, 319–329. doi: 10.1007/s10681-009-9935-2
Mori, M., Uchino, N., Chono, M., Kato, K., and Miura, H. (2005). Mapping QTLs for grain dormancy on wheat chromosome 3A and the group 4 chromosomes, and their combined effect. Theor. Appl. Genet. 110, 1315–1323. doi: 10.1007/s00122-005-1972-1
Morris, G. F., and DeMacon, V. L. (1994). Seed dormancy and tissue culture response in wheat. Crop Sci. 34, 1324–1329. doi: 10.2135/cropsci1994.0011183X003400050034x
Ogbonnaya, F. C., Imtiaz, M., and Depauw, R. M. (2007). Haplotype diversity of preharvest sprouting QTLs in wheat. Genome 50, 107–118. doi: 10.1139/g06-142
Röder, M. S., Korzun, V., Wendehake, K., Plaschke, J., Tixier, M.-H., Leroy, P., et al. (1998). A Microsatellite map of wheat. Genetics 149, 2007–2023.
Roy, J. K., Prasad, M., Varshney, R. K., Balyan, H. S., Blake, T. K., Dhaliwal, H. S., et al. (1999). Identification of a microsatellite on chromosomes 6B and a STS on 7D of bread wheat showing an association with preharvest sprouting tolerance. Theor. Appl. Genet. 99, 336–340. doi: 10.1007/s001220051241
Saghai-Maroof, M. A., Biyashev, R. M., Yang, G. P., Zhang, Q., and Allard, R. W. (1994). Extraordinary polymorphic microsatellite DNA in Barley: species diversity, chromosomal locations and population dynamics. Proc. Natl. Acad. Sci. U.S.A. 91, 5466–5470.
Shorinola, O., Bird, N., Simmonds, J., Berry, S., Henriksson, T., Jack, P., et al. (2016). The wheat Phs-A1 pre-harvest sprouting resistance locus delays the rate of seed dormancy loss and maps 0.3 cM distal to the PM19 genes in UK germplasm. J. Exp. Bot. 67, 4169–4178. doi: 10.1093/jxb/erw194
Singh, R., Hucl, P., Aga, M. B., and Chibbar, R. N. (2012). Validation of molecular markers for pre-harvest sprouting resistance in bread wheat. Cer. Res. Commun. 40, 194–204. doi: 10.1556/CRC.40.2012.2.3
Smit, H. A., Tolmay, V. L., Barnard, A., Jordaan, J. P., Koekemoer, F. P., Otto, W. M., et al. (2010). An overview of the context and scope of wheat (Triticum aestivum) research in South Africa from 1983 to 2008. S. A. J. Plant Soil 27, 81–96. doi: 10.1080/02571862.2010.10639973
Trethowan, R. M., Rajaram, S., and Ellison, F. W. (1996). Preharvest sprouting tolerance in wheat in the field and under rain simulation. Aust. J. Agric. Res. 47, 705–716. doi: 10.1071/AR9960705
Tyagi, S., and Gupta, P. K. (2012). Meta-analysis of QTLs involved in Pre-harvest sprouting tolerance and dormancy in bread wheat. Triticeae Genom. Genet. 3, 9–24. doi: 10.5376/tgg.2012.03.0002
Yang, Y., Zhao, X. L., Xia, L. Q., Chen, X. M., Xia, X. C., Yu, Z., et al. (2007). Development and validation of a viviparous-1 STS marker for pre-harvest sprouting tolerance in Chinese wheats. Theor. Appl. Genet. 115, 971–980. doi: 10.1007/s00122-007-0624-z
Zhang, X.-Q., Li, C., Tay, A., Lance, R., Mares, D., Cheong, J., et al. (2008). A new PCR-based marker on chromosome 4AL for resistance to pre-harvest sprouting in wheat (Triticum aestivum L.) Mol. Breed. 22, 227–236. doi: 10.1007/s11032-008-9169-3
Keywords: haplotype, pre-harvest sprouting, TaPHS1, Phs1-A1, QTL, SSRs, wheat
Citation: Sydenham SL and Barnard A (2018) Targeted Haplotype Comparisons between South African Wheat Cultivars Appear Predictive of Pre-harvest Sprouting Tolerance. Front. Plant Sci. 9:63. doi: 10.3389/fpls.2018.00063
Received: 29 August 2017; Accepted: 12 January 2018;
Published: 01 February 2018.
Edited by:
Jose Maria Barrero, Commonwealth Scientific and Industrial Research Organisation (CSIRO), AustraliaReviewed by:
Lee Hickey, The University of Queensland, AustraliaFrank Gubler, Commonwealth Scientific and Industrial Research Organisation (CSIRO), Australia
Copyright © 2018 Sydenham and Barnard. This is an open-access article distributed under the terms of the Creative Commons Attribution License (CC BY). The use, distribution or reproduction in other forums is permitted, provided the original author(s) and the copyright owner are credited and that the original publication in this journal is cited, in accordance with accepted academic practice. No use, distribution or reproduction is permitted which does not comply with these terms.
*Correspondence: Scott L. Sydenham, c3lkZW5oYW1zQGFyYy5hZ3JpYy56YQ==