Abstract
In the last 50 years, intensive farming systems have been boosted by modern agricultural techniques and newly bred cultivars. The massive use of few and related cultivars has dramatically reduced the apple genetic diversity of local varieties, confined to marginal areas. In Central Italy a limited spread of intensive fruit orchards has made it possible to preserve much of the local genetic diversity, but at the same time the coexistence of both modern and ancient varieties has generated some confusion. The characterization and clarification of possible synonyms, homonyms, and/or labeling errors in old local genetic resources is an issue in the conservation and management of living collections. 175 accessions provided by 10 apple collections, mainly local varieties, some of unknown origin, and well-known modern and ancient varieties, were studied by using 19 SSRs, analyzed by STRUCTURE, Ward’s clustering and parentage analysis. We were able to identify 25 duplicates, 9 synonyms, and 9 homonyms. As many as 37 unknown accession were assigned to well known local or commercial varieties. Polyploids made up 20%. Some markers were found to be significantly correlated with morphological traits and the loci associated with the fruit over color were related to QTLs for resistance to biotic stresses, aroma compounds, stiffness, and acidity. In conclusion the gene pool of Central Italy seems to be rather consistent and highly differentiated compared with other European studies (FST = 0.147). The importance of safeguarding this diversity and the impact on the management of the germplasm living collection is discussed.
Introduction
Apple (Malus × domestica Borkh., family Rosaceae, tribe Pyreae, 2n = 2x = 34) is one of the most ancient and widespread fruit crops in temperate regions. Almost certainly the domesticated apple is the result of a long evolutionary process extending over thousands of years, and it seems several species have contributed to its gene pool. On the basis of genetic data, of fruit and tree morphology, the wild Asian species M. sieversii M. Roem is actually considered the main contributor to the Malus × domestica gene pool, and the Tian Shan Mountains (Central Asia) the center of origin (Velasco et al., 2010; Cornille et al., 2014). Furthermore, hybridizations with other wild apple species present along the Silk Route, such as M. baccata (L.) Borkh. in Siberia, M. orientalis Uglitz. in Caucasus and M. silvestris (L.) Miller in Europe, have produced the diversity currently present in the domesticated apple (Vavilov, 1926; Harris et al., 2002; Cornille et al., 2012, 2014; Gross et al., 2014). Despite high genetic variability, the thousands of cultivars distributed throughout the world and the world-wide breeding programs, mainly based on organoleptic traits, aesthetic standards and disease resistance, the size of the genetic resources used by breeders has been limited and reduced to a few varieties such as ‘Cox’s Orange Pippin,’ ‘Golden Delicious,’ ‘Jonathan,’ ‘Red Delicious,’ and ‘McIntosh’ (Noiton and Alspach, 1996). As a result, apple cultivation today is limited to closely related cultivars, and four of them, namely Golden Delicious, Gala, Red Delicious, and Idared, account for 48% of global production. Actually, the most important variety is Golden Delicious with 2.546 million metric tons, followed, by Gala with 1.331 million metric tons and Idared with 1.111 million metric tons (Food and Agricultural Organization of the United Nation [FAO], 2016; WAPA, 2017). This massive use of limited and related cultivars, combined with vegetative practices based on cuttings and grafting, has dramatically reduced apple genetic diversity and, hence, many interesting and well adapted traditional and local varieties, considered obsolete, were no longer cultivated and have been partly lost (Hammer et al., 2003).
Similar trends occurred in Italy, which with its 2.5 million t represents the fifth apple producer in the World and the second in Europe (Food and Agricultural Organization of the United Nation [FAO], 2016). Apple production is mainly concentrated in the North of Italy, in particular in Trentino Alto Adige, which with its 1.7 million t represents 67% of total Italian production, followed by Veneto (11%), Piemonte (6%), and Emilia-Romagna (6%). In these regions, as well as in the World and in other European Countries, production is based mainly on intensive orchards with few commercial varieties: Golden Delicious, Gala, Red Delicious, Fuji, and Granny Smith (Assomela-CSO, 2017). In Center-South Italy intensive apple orchards are appreciably present only in Campania (3% of Italian production). Historically these areas have never been inclined to intensive cultivation of fruit in general and apples in particular, even if in the 1920s there were unsuccessful attempts to introduce improved varieties in intensive orchards (Albertini et al., 2015). In these regions, apart from few family-run orchards, fruit production was, and currently remains, mainly directed toward self-consumption and local markets. Therefore, in Central Italy the almost complete absence of intensive apple cultivation allowed for the preservation of much of the existing genetic diversity even if the limited coexistence between modern and local varieties and the evolution of the farming systems since the 1950s, has led to the disappearance of several interesting and well adapted ancient varieties. Many of these varieties, although of low productivity, were relatively stable under extreme environmental conditions, and their high genetic variability guaranteed reliable harvesting for local communities in the past (Albertini et al., 2015). Over time, some of the modern, introduced varieties mixed with the autochthones, increasing the panorama of choice on the one hand, but generating some confusion regarding local genetic resources and their correct denomination on the other. Consequently, the need for characterization and clarification of possible synonyms, homonyms, and/or labeling errors in these old and local genetic resources is a fundamental and necessary step for the conservation and management of living collections. Indeed, the genetic variability and allelic diversity present in these old accessions could be of extreme interest in terms of response to selection in adaptation toward a changing environment (Caballero and García-Dorado, 2013). Therefore, even though such varieties are characterized by low fruit quality and yield, their allelic diversity could be essential for crop improvement, providing the presence of interesting traits for the development of new varieties.
In this scenario, molecular markers can provide a valid tool to assess genetic diversity, uncovering duplicates or possible synonymies and/or homonymies, and helping the management of plant genetic resources. Several studies based on molecular markers have assessed the diversity in Malus, including modern cultivars and old, local germplasm accessions (Pereira-Lorenzo et al., 2007, 2008, 2017; Gharghani et al., 2009; Gasi et al., 2010; van Treuren et al., 2010; Gross et al., 2012; Urrestarazu et al., 2012; Gao et al., 2015; Liang et al., 2015; Lassois et al., 2016; Vanderzande et al., 2017). For these purposes microsatellites (SSRs) are considered the marker of choice due their high polymorphism and co-dominant inheritance, widely used to asses the genetic diversity at population and individual level in many plant core collections (Blair et al., 2009; Zhang et al., 2011; Patzak et al., 2012; Emanuelli et al., 2013; Urrestarazu et al., 2016; Mousavi et al., 2017). To date several hundred SSR markers have been developed and mapped in apples by Guilford et al. (1997), Gianfranceschi et al. (1998), Liebhard et al. (2002), Vinatzer et al. (2004), Silfverberg-Dilworth et al. (2006), Han and Korban (2008), and Celton et al. (2009). Many of these mapped SSR are linked to QTL with interesting agronomical, morphological, and organoleptic traits and could be used as molecular tools for marker assisted selection (MAS) in plant breeding programs (Gianfranceschi et al., 1998; Gygax et al., 2004; Kunihisa et al., 2014; Sun et al., 2014; Liu et al., 2016). Microsatellites have been also widely used in apples to asses the genetic diversity in core collections (Yun et al., 2015; Lassois et al., 2016; Urrestarazu et al., 2016), cultivar characterization (Goulão and Oliveira, 2001; Patzak et al., 2012; Pérez-Romero et al., 2015), and parentage analysis (Kitahara et al., 2005; Moriya et al., 2011; Lassois et al., 2016).
The present research aims to understand the relationship between local accessions in central Italy with old and new varieties, as well as investigate for synonyms/homonyms for a better management of conservation and propagation of genetic resources.
Materials and Methods
Plant Material
One hundred and seventy five accessions of Malus × domestica, mostly Italian, were included in this study and were provided by several collections: the National Center of Fruit Tree Germplasm (CREA, coded c01), Parco Tecnologico Agroalimentare dell’Umbria (3A-PTA, coded c02 and c03 as coming from two living collections), the Department of Agriculture, Forestry and Food Science of the University of Torino (DISAFA, c04), the Archeologia Arborea private collection (c05), the Department of Agricultural, Food and Environmental Sciences of the Polytechnic University of Marche (D3A, c06), Malva Rinaldi School in Torino (c07), the Department of Agricultural Science, University of Bologna (DipSA, c08), the Giardino Armonico of Bevagna private collection (c09) and Azienda Ortofrutticola Sett’Olmi, Perugia (c10). Details are reported in Table 1. Many of the 175 accessions were well documented by reliable historical sources. Those lacking of several reliable information were coded as Unknown. Therefore, based on the initial information, the 175 accessions used in this study were classified into 17 commercial varieties (CV) used as control, 99 local varieties (LV), and 59 unknown accessions (UA).
Table 1
| Coll. code | Accession name | Ploidy | Status |
|---|---|---|---|
| c01 | 001_Cerina | D | LV |
| c01 | 002_Zuccherina | D | LV |
| c01 | 003_Gelato Cola | D | LV |
| c01 | 004_Ghiacciola | P | LV |
| c01 | 005_Pom de L’oio Rosso | D | LV |
| c01 | 006_’E Santu Giuanni | D | LV |
| c01 | 007_’E Santu Giuanni Rossa | D | LV |
| c01 | 008_Roggia | D | LV |
| c01 | 009_Ruzine | D | LV |
| c01 | 010_Ruzza | D | LV |
| c01 | 011_Sona | D | LV |
| c02 | 012_Ruzza | D | LV |
| c02 | 013_San Giovanni | D | LV |
| c02 | 014_Oleosa | D | LV |
| c02 | 015_A Sonagli | D | LV |
| c02 | 016_Gelata | D | LV |
| c02 | 017_Cera | D | LV |
| c03 | 018_Roggia | D | LV |
| c04 | 019_Gris d’la composta | D | LV |
| c04 | 020_Gris canavoeit | D | LV |
| c04 | 021_San Sebastian | P | LV |
| c04 | 022_Ruggine piatta | D | LV |
| c04 | 023_Buras | P | LV |
| c04 | 024_Grigia di Torriana | D | LV |
| c05 | 025_Oliata | P | LV |
| c05 | 026_Diacciata | P | LV |
| c06 | 027_Oleata | D | LV |
| c06 | 028_Cerina | D | LV |
| c06 | 029_Gelata | D | LV |
| c06 | 030_Gelata | D | LV |
| c02 | 031_Olia | D | LV |
| c02 | 032_Casciola | P | LV |
| c02 | 033_Panaia | D | LV |
| c02 | 034_Panaia | P | LV |
| c02 | 035_Pagliaccia | P | LV |
| c02 | 036_Casciola | P | LV |
| c02 | 037_Casciola | D | LV |
| c07 | 038_Sonaja Rossa | D | LV |
| c07 | 039_Ciocarina Bianca | D | LV |
| c07 | 040_Ciocarina Rossa Dossa | D | LV |
| c07 | 041_Ciochera Rosa | D | LV |
| c08 | 042_Pum Giuan | D | CV |
| c08 | 043_San Giovanni PT | D | LV |
| c08 | 044_San Giovanni MO | P | LV |
| c08 | 045_San Giovanni BO | P | LV |
| c08 | 046_Ceres | D | LV |
| c02 | 047_Golden Delicious | D | CV |
| c02 | 048_Golden Gala | D | CV |
| c02 | 049_Amerina | D | LV |
| c02 | 050_Pianella | P | LV |
| c02 | 051_Unknown | D | UA |
| c02 | 052_Appiola Rossa | D | LV |
| c02 | 053_Rosa D’Amelia | D | LV |
| c02 | 054_Unknown | P | UA |
| c02 | 055_Unknown | D | UA |
| c02 | 056_Unknown | P | UA |
| c02 | 057_Bianchina | D | LV |
| c02 | 058_Coccianese | D | LV |
| c02 | 059_Coccianese | D | LV |
| c02 | 060_Unknown | D | UA |
| c02 | 061_Limoncella | D | LV |
| c02 | 062_Piattuccia | D | LV |
| c02 | 063_Stratarina | D | LV |
| c02 | 064_Conventina | D | LV |
| c02 | 065_Muso di Bue | D | LV |
| c02 | 066_Ruzza | D | LV |
| c02 | 067_Spoletina | P | LV |
| c02 | 068_Unknown | D | UA |
| c02 | 069_Unknown | P | UA |
| c02 | 070_Rossa Doglio | D | LV |
| c02 | 071_Gialla Doglio | D | LV |
| c02 | 072_Ciucca Dolcetta | D | LV |
| c02 | 073_Polsola | P | LV |
| c02 | 074_Dolcetta | D | LV |
| c02 | 075_Unknown | D | UA |
| c02 | 076_Unknown | D | UA |
| c02 | 077_Appiola Rossa | P | LV |
| c02 | 078_Appiola | D | LV |
| c02 | 079_Unknown | D | UA |
| c02 | 080_Ducale | D | LV |
| c02 | 081_Pianella | D | LV |
| c02 | 082_Rosciola | D | LV |
| c02 | 083_Unknown | P | UA |
| c02 | 084_Unknown | D | UA |
| c02 | 085_Unknown | D | UA |
| c02 | 086_Ulpia | D | LV |
| c02 | 087_Amerina | D | LV |
| c02 | 088_Saragano Rossa | D | LV |
| c02 | 089_Unknown | D | UA |
| c02 | 090_Unknown | D | UA |
| c02 | 091_Saragano Gialla | D | LV |
| c02 | 092_Unknown | D | UA |
| c02 | 093_Unknown | P | UA |
| c02 | 094_Unknown | D | UA |
| c02 | 095_Unknown | D | UA |
| c02 | 096_Unknown | D | UA |
| c02 | 097_Unknown | D | UA |
| c02 | 098_Unknown | D | UA |
| c02 | 099_Unknown | P | UA |
| c02 | 100_Unknown | D | UA |
| c02 | 101_Maggiolina | D | LV |
| c02 | 102_Unknown | P | UA |
| c02 | 103_Unknown | D | UA |
| c02 | 104_Rossa Montelupone | D | LV |
| c02 | 105_Unknown | D | UA |
| c02 | 106_Unknown | D | UA |
| c02 | 107_Gialla Montelupone | D | LV |
| c02 | 108_Unknown | D | UA |
| c02 | 109_Unknown | P | UA |
| c02 | 110_Unknown | D | UA |
| c02 | 111_Unknown | D | UA |
| c02 | 112_Paradisa | D | LV |
| c02 | 113_Unknown | D | UA |
| c02 | 114_Unknown | P | UA |
| c02 | 115_Coppiola | D | LV |
| c02 | 116_Unknown | P | UA |
| c02 | 117_Unknown | D | UA |
| c03 | 118_Rosa in Pietra | D | LV |
| c03 | 119_Del Castagno | D | LV |
| c03 | 120_Ciucca | D | LV |
| c03 | 121_Rosa Gentile | D | LV |
| c03 | 122_Rosa Romana | P | LV |
| c03 | 123_Polsola | D | LV |
| c03 | 124_Bianchina | P | LV |
| c03 | 125_Unknown | D | UA |
| c03 | 126_Limoncella | D | LV |
| c03 | 127_Conventina | D | LV |
| c03 | 128_Roggia | D | LV |
| c09 | 129_Durello | D | LV |
| c09 | 130_Calvilla d’Estate | D | CV |
| c09 | 131_Reinette du Canada | P | CV |
| c09 | 132_Reinette Ananas | D | CV |
| c09 | 133_Reinette de Champagne | D | CV |
| c09 | 134_Limoncina | D | CV |
| c09 | 135_Decio | D | LV |
| c09 | 136_Annurca | D | CV |
| c09 | 137_Abbondanza | D | CV |
| c02 | 138_Unknown | D | UA |
| c02 | 139_Spoletina | P | LV |
| c02 | 140_Unknown | P | UA |
| c02 | 141_Limoncella | D | LV |
| c02 | 142_Unknown | D | UA |
| c02 | 143_Unknown | D | UA |
| c02 | 144_Unknown | D | UA |
| c02 | 145_Unknown | P | UA |
| c02 | 146_Gelata | D | LV |
| c02 | 147_Rosa in Pietra | D | LV |
| c02 | 148_Unknown | D | UA |
| c02 | 149_Coccianese | D | LV |
| c02 | 150_Unknown | D | UA |
| c02 | 151_Unknown | D | UA |
| c02 | 152_Cera | D | LV |
| c02 | 153_Unknown | D | UA |
| c02 | 154_Unknown | D | UA |
| c02 | 155_Unknown | D | UA |
| c02 | 156_Statia | D | LV |
| c02 | 157_Unknown | D | UA |
| c02 | 158_Paonazza di Piubbica | D | LV |
| c02 | 159_Annurca | D | CV |
| c02 | 160_Unknown | D | UA |
| c02 | 161_Unknown | P | UA |
| c02 | 162_Unknown | P | UA |
| c02 | 163_Unknown | P | UA |
| c02 | 164_Unknown | D | UA |
| c02 | 165_Rossa di San Venanzo | D | CV |
| c02 | 166_Unknown | D | UA |
| c02 | 167_Unknown | D | UA |
| c02 | 168_Unknown | D | UA |
| c02 | 169_Rosona | P | LV |
| c10 | 170_Golden Clone B | D | CV |
| c10 | 171_Fuji | D | CV |
| c10 | 172_Stark Delicious | D | CV |
| c10 | 173_Unknown | D | UA |
| c10 | 174_Gold Chief (Gold Pink) | D | CV |
| c10 | 175_Cripps Pink | D | CV |
Collection code1, accession name, ploidy2 (D, diploids; P, polyploids) and status (LV, local variety; CV, commercial variety; UA, unknown) of 175 apple accessions used in the present study.
1c01 = CREA, National Centre of Fruit Tree Germplasm; c02 = 3A-PTA, Parco Tecnologico Agroalimentare dell’Umbria, Pantalla; c03 = 3A-PTA, Casalina; c04 = DISAFA, Department of Agriculture, Forestry and Food Science, University of Torino; c05 = Archeologia Arborea, private collection; c06 = D3A, Department of Agricultural, Food and Environmental Sciences, Marche Polytechnic University; c07 = School Malva Rinaldi of Torino; c08 = DipSA, Department of Agricultural Science, University of Bologna; c09 = Giardino Armonico of Bevagna, private collection; c10 = Nursery Sett’Olmi, private collection. 2An accession is considered polyploid when at least 3 out of 19 loci showed a third allele.
Microsatellite Amplification
Total genomic DNA was purified from young leaves using the DNeasy 96 Plant Kit (Qiagen) according to manufacturer’s protocol. Twenty one apple SSR primer pairs (Liebhard et al., 2002; Vinatzer et al., 2004; Silfverberg-Dilworth et al., 2005) distributed over the 17 apple linkage groups were used (Table 2). Primer sequence and allele range for validated loci were analyzed by Multiplex Manager (Holleley and Geerts, 2009) to determine the best sets of loci to combine in a multiplex protocol. Multiplex Manager was used with the option of grouping all validated loci within the minimum number of PCRs avoiding allele range overlap and primer interactions.
Table 2
| Locus | Forward seq. (5′– 3′) | Reverse seq. (5′- 3′) | Rep. motiv | Rep. type | Linkage group |
|---|---|---|---|---|---|
| CH05c06 | atcaacagtagtggtagccgggt | attggaactctccgtattgtgc | CT | Imp | 16 |
| CH-Vf1 | atcaacacgagcagcaaag | catacaaatcaaagcacaaccc | AG | Imp | 1 |
| Hi07h02 | caaattggcaactgggtctg | gtttaggtggaggtgaagggatg | GT | Perf | 17 |
| CH03d12 | gcccagaagcaataagtaaacc | attgctccatgcataaaggg | CT | Comp | 6 |
| CH05e03 | cgaatattttcactctgactggg | caagttgttgtactgctccgac | GA | Perf | 2 |
| Hi04e04 | gaccacgaagcgctgttaag | gtttcggtaattccttccatcttg | GA | Perf | 16 |
| CH02b03b | ataaggatacaaaaaccctacacag | gacatgtttggttgaaaacttg | CT | Perf | 10 |
| CH01f03b | gagaagcaaatgcaaaaccc | ctccccggctcctattctac | GA | Imp | 9 |
| CH02c09 | ttatgtaccaactttgctaacctc | agaagcagcagaggaggatg | CT | Perf | 15 |
| Hi22f12 | ggccctcacccagtctacatt | gtttggtgtgatggggtactttgc | CTT | Imp | 5 |
| CH01g12 | cccaccaatcaaaaatcacc | tgaagtatggtggtgcgttc | CT | Imp | 12 |
| AU223657 | ttctccgtccccttcaacta | caccttgaggcctctgtagc | CT | Imp | 3 |
| CH01h02 | agagcttcgagcttcgtttg | atcttttggtgctcccacac | CT | Imp | 9 |
| CH01h01 | gaaagacttgcagtgggagc | ggagtgggtttgagaaggtt | CT | Perf | 17 |
| CH04a12 | cagcctgcaactgcacttat | atccatggtcccataaacca | CT | Imp | 11 |
| Hi03a10 | ggacctgcttccccttattc | cagggaacttgttgatgg | GA | Imp | 7 |
| CH04c07 | ggccttccatgtctcagaag | cctcatgccctccactaaca | GA | Perf | 14 |
| CH01c06 | ttccccatcatcgatctctc | aaactgaagccatgagggc | GA | Perf | 8 |
| CH02g01 | gatgacgtcggcaggtaaag | caaccaacagctctgcaatc | CT | Perf | 13 |
| CH03d07 | caaatcaatgcaaaactgtca | ggcttctggccatgatttta | CT | Perf | 6 |
| Hi23g02 | ttttccaggatatactacccttcc | gtttcttcgaggtcagggtttg | CA | Perf | 4 |
Characteristics of the 19 SSR markers used in the study, forward and reverse sequences, repetitive motives and types (Perfect, Imperfect, Compound), and linkage group.
PCRs were carried out in a final volume of 25 μl using 1 × Type-it Microsatellite PCR Master Mix (Qiagen), 0.2 μM of each fluorescent forward primer labeled with 6-FAM or ROX dyes (Sigma) and reverse unlabeled primer and 20 ng of template DNA. All amplifications were performed in a GeneAmpPCRSystem 9700 (Applied Biosystems, United States) consisting of a denaturing step of 5 min at 95°C followed by 30 cycles of 95°C for 30 s, 57°C for 90 s and 72°C for 30 s, and a final elongation step of 30 min at 60°C.
PCR products were separated and analyzed on a 3130 XL DNA Analyzer (Applied Biosystems). The size of the amplified products was determined on internal standard DNA (GeneScan 500 Liz, Thermo) and the scorable peaks were assigned by GeneMapper software v.4.0 (Applied Biosystems).
Morphological Characterization
Phenological and morphological traits of interest were scored as follows: time of eating maturity (1 = early summer, 3 = late summer-early autumn, 5 = autumn, 7 = winter); fruit shape (1 = cylindrical waisted, 2 = conic, 3 = ovoid, 4 = cylindrical, 5 = ellipsoid, 6 = globose, 7 = obloid); fruit ground color (1 = green, 3 = yellow, 5 = red); hue over color of fruit (1 = absent, 3 = yellow, 5 = orange, 7 = pink, 9 = red); fruit rustiness (1 = absent, 9 present), pulp color (1 = white, 3 = cream, 5 = yellow, 7 = red). The scores were assigned by 3 operators who exchanged opinions before eventually providing individual scores, which were averaged prior to statistical analysis. Data were available only for 130 accessions and were therefore used primarily to ascertain doubts (Supplementary Table S1).
Data Analysis
For each locus, common PCR artifacts leading to genotyping error were investigated. Presence of null alleles, large allele dropout and extreme stuttering was inferred by means of bootstrapping in Micro-Checker v2.2.3 (Van Oosterhout et al., 2004) based on 1000 bootstraps and 95% confidence interval. A preliminary analysis detected a deviation due the presence of null alleles for two loci (Hi23g02 and Hi03g02) which were therefore discarded. The statistical analysis was then based on the remaining 19 loci (Supplementary Table S2).
The statistical analysis of the SSR data matrix was carried out by Genodive (Meirmans and Van Tienderen, 2004) and SPAGeDi1.2 (Hardy and Vekemans, 2002). Both software packages are able to analyze data files containing diploid and polyploid accessions together. The analysis included: the detection of the number of allele (Na) per locus, the effective number of alleles (Ne), the percentage of rare alleles (RA = allele frequency < 0.01), of the observed (Ho) and expected (He) heterozygosity (Nei, 1978), inbreeding coefficient F, polymorphic information content (PIC) (Botstein et al., 1980) at each locus, determined using the following equation:
The analysis also included the probability of identity (PID) (Waits et al., 2001) and the probability of identity among sibs P(ID)sib (Evett and Weir, 1998), calculated as follows:
where pi and pj are the frequencies of the ith and jth alleles and i ≠ j.
Finally, the ability of each marker to discriminate two random cultivars was estimated by the Power of Discrimination (PD = 1 - PID) (Kloosterman et al., 1993).
In order to run a cluster analysis on diploid and polyploid accessions together, SSR data were converted to a binary data matrix by assigning “1” to the presence of a defined allele and “0” to its absence. The binary data matrix was then used to estimate a distance matrix, and the 175 accessions were clustered by Ward’s hierarchical method (Ward, 1963) and validated by 1000 bootstrap replicates using PAST software (Hammer et al., 2001). The analysis revealed the presence of several identical accessions with the same genetic profile. As a consequence, these were removed and the remaining 150 were used again as binary data for a cluster analysis based on Ward’s method, and the results compared with the Bayesian model-based clustering of STRUCTURE ver. 2.2.3 (Pritchard et al., 2000) using codominant data based on allele size. STRUCTURE software implements a clustering method assigning individuals and predefined populations to K inferred clusters, each characterized by a set of allele frequencies at Hardy-Weinberg equilibrium, based on estimates of the corresponding probabilities of membership to each group. The analyses were run on an admixture ancestral model with correlated allele frequencies, and the number of K clusters was determined firstly by simulating a range of K-values from 1 to 21 with 10 independent runs each. Since after K = 5 there were no other appreciable peaks, STRUCTURE was run again with twenty runs for K-values ranging from 1 to 11, using a burn-in and a run length of the Monte Carlo Markov Chain (MCMC) of 300,000 and 500,000 iterations for data collection. The best K-value was determined through the ΔK method (Evanno et al., 2005) by using the STRUCTURE HARVESTER ver. 0.6.193 website (Earl and vonHoldt, 2012). The genotypes were assigned to the groups according to their highest membership coefficient, considering a strong affinity when the assigning probability (qI) was ≥ 0.80 (Breton et al., 2008; Pereira-Lorenzo et al., 2008; Miranda et al., 2010; Urrestarazu et al., 2012). The software STRUCTURE is able to infer the genetic structure either in diploid or polyploid genotypes as described in using the recessive allele approach (Falush et al., 2007). The membership of each accession to the Ward’s clusters and to the groups of STRUCTURE were compared and discussed.
The 92 accessions whose probability (qI) was ≥ 0.80 were grouped into K = 5 subset of 7, 9, 29, 11, and 36 individuals. The goodness of fit of these 5 groups was investigated by the F statistics (FIS and FST) (Weir and Cockerham, 1984), and the analysis of molecular variance (AMOVA) that estimates the fraction of the genetic variation among and within populations (Excoffier et al., 1992; Michalakis and Excoffier, 1996).
The software FaMoz (Gerber et al., 2003) was used to carry out a parentage analysis, to look for possible genetic relationships (parents) present among the entire sample of accessions and eventually confirming the results of STRUCTURE and Ward’s clustering. FaMoz calculates the logarithm of the likelihood ratio, log of odds ratio (LOD score), by determining the likelihood of an individual being the parent of a given offspring, divided by the likelihood of these individuals being unrelated (Meagher and Thompson, 1986). LOD scores for any potential parentage relationship with a value greater than zero were computed, giving statistical significance to the data. Possible parents determined by LOD scores and significance thresholds were probed among the 150 accessions characterized with the set of 19 SSRs. Through 100,000 simulations with a rate of mistyping errors of 0.1% as described by Gerber et al. (2000), a LOD score threshold of 5.0 was found and used in our work (Supplementary Figure S1). For polyploid accessions a FaMoz control analysis was run on a 0–1 data matrix.
Moreover, in order to look for correlations between molecular data and morphological traits, a non-parametric correlation analysis (Spearman) was carried out using SAS 9.1 (Cary, NC, United States).
Results
Genetic Diversity
The 19 nuclear SSRs were all polymorphic and produced scorable amplicons with a total of 278 alleles. The average number of alleles per locus was 14.6, ranging from 5 (Hi22f12) to 26 (CH05e03), but the number of effective alleles per locus was significantly lower (Ne = 5.94) (Table 3). With the exception of locus Hi22f12, all loci showed at least one genotype with three alleles. Loci CH02b03b and CH01h01 identified as many as 28 individuals with three alleles, while the other loci identified between 8 and 22 individuals. Even if several individuals showed one locus with a third allele, only those showing a third allele in at least 3 loci (Urrestarazu et al., 2012) were considered putative polyploids. In the present study 35 individuals (20%) were classified as polyploids (Table 1), as they showed a third allele from 4 up to 13 loci.
Table 3
| Locus | Range of allele size (bp) | Na | Ne | RA† | Ho | He | F | PIC | PID‡ unrelated | PIDsib‡ |
|---|---|---|---|---|---|---|---|---|---|---|
| CH05c06 | 104–134 | 14 | 4.68 | 28.6 | 0.80 | 0.79 | –0.018 | 0.784 | 0.0183 | 0.3626 |
| CH-Vf1 | 127–173 | 14 | 2.85 | 57.1 | 0.75 | 0.65 | –0.154 | 0.647 | 0.0761 | 0.4453 |
| Hi07h02 | 238–276 | 17 | 8.84 | 23.5 | 0.86 | 0.89 | 0.034 | 0.885 | 0.0025 | 0.3084 |
| CH03d12 | 96–157 | 25 | 7.36 | 40.0 | 0.83 | 0.86 | 0.041 | 0.862 | 0.0091 | 0.3214 |
| CH05e03 | 145–224 | 26 | 7.79 | 42.3 | 0.70 | 0.87 | 0.200 | 0.869 | 0.0059 | 0.3169 |
| Hi04e04 | 208–249 | 15 | 6.75 | 20.0 | 0.87 | 0.85 | –0.020 | 0.849 | 0.0088 | 0.3275 |
| CH02b03b | 73–106 | 13 | 6.43 | 15.4 | 0.90 | 0.84 | –0.062 | 0.842 | 0.0074 | 0.3308 |
| CH01f03b | 137–185 | 11 | 4.83 | 18.2 | 0.88 | 0.79 | –0.110 | 0.791 | 0.0163 | 0.3587 |
| CH02c09 | 234–259 | 12 | 5.51 | 16.7 | 0.82 | 0.82 | –0.005 | 0.816 | 0.0139 | 0.3453 |
| Hi22f12 | 202–218 | 5 | 3.91 | – | 0.16 | 0.74 | 0.784 | 0.742 | 0.0307 | 0.3867 |
| CH01g12 | 102–186 | 21 | 7.77 | 33.3 | 0.91 | 0.87 | –0.043 | 0.869 | 0.0052 | 0.3169 |
| AU223657 | 224–237 | 6 | 4.38 | – | 0.72 | 0.77 | 0.067 | 0.769 | 0.0180 | 0.3698 |
| CH01h02 | 236–255 | 9 | 3.36 | 22.2 | 0.77 | 0.70 | –0.098 | 0.701 | 0.0595 | 0.4146 |
| CH01h01 | 104–131 | 12 | 6.70 | 25.0 | 0.85 | 0.85 | 0.000 | 0.849 | 0.0050 | 0.3270 |
| CH04a12 | 159–202 | 18 | 4.53 | 27.8 | 0.81 | 0.78 | –0.041 | 0.777 | 0.0322 | 0.3696 |
| Hi03a10 | 199–291 | 16 | 8.89 | 18.8 | 0.75 | 0.89 | 0.156 | 0.885 | 0.0023 | 0.3080 |
| CH04c07 | 95–139 | 16 | 8.06 | 12.5 | 0.91 | 0.88 | –0.038 | 0.874 | 0.0039 | 0.3142 |
| CH01c06 | 149–191 | 14 | 4.19 | 28.6 | 0.81 | 0.76 | –0.065 | 0.759 | 0.0369 | 0.3796 |
| CH02g01 | 184–246 | 14 | 6.09 | 14.3 | 0.80 | 0.84 | 0.036 | 0.834 | 0.0113 | 0.3360 |
| Mean | – | 14.6 | 5.94 | – | 0.78 | 0.81 | 0.036 | 0.811 | – | – |
| Total | – | 278 | 112.92 | – | – | – | – | – | 2.2 × 10-38 | 8.5 × 10⁻¹⁰ |
Genetic diversity in terms of range of allele size (bp), number of allele (Na), effective number of alleles (Ne), percentage of rarity (RA), observed (Ho) and expected (He) heterozygosity, inbreeding coefficient (F), polymorphic information content (PIC) and probability of identity (PID and PIDsib) of all 175 accessions of apple germplasm evaluated.
†RA: percentage of rare alleles; an allele is defined rare at a frequency < 0.01; ‡The total value of the column is the cumulative P(ID) obtained as the product of the P(ID) of individual loci. The same is for P(ID)sib.
Rare alleles were found in 17 loci and were more common as the number of alleles per locus increased. Rare alleles ranged from 12.5% (at locus CH04c07 rare alleles with a frequency less than 1% were 2 out of 16) to 57% (at locus CH-Vf1 they were 8 out of 14). No rare allele were found at the loci Hi22f12 and AU223657, where the range of allele size were the lowest, 16 and 13 bp, respectively (Table 3).
Except for CH-Vf1 and CH01c06, all other loci were not in Hardy-Weinberg equilibrium (P ranging from 0.05 to less than 0.001) and this was expected as the 175 individuals do not belong to a panmictic population. Mean observed heterozygosity (Ho) was 0.78, ranging from 0.16 (locus Hi22f12) to 0.91 (CH01g12 and CH04c07) (Table 3). Mean expected heterozygosity (He) was 0.81, denoting high variability and ranging from 0.65 (CH-Vf1) to 0.89 (Hi07h02 and Hi03a10). F coefficients ranged from - 0.154 (CH-Vf1) to + 0.784 (Hi22f12), but the latter was the only value significantly departing from the others, thus denoting high homozygosity.
The 19 loci showed PIC values ranging from 0.65 (CH-Vf1) to 0.89 (Hi07h02 and Hi03a10), which were all higher than 0.5 and therefore very informative (Botstein et al., 1980).
The probability of identity (PID) of a locus is the probability that two individuals share the same genotype at that locus, while the power of discrimination (PD = 1-PID) is the probability that two individuals have different genotypes at that locus. An overall mean value of PD = 0.98 (ranging from 0.924 to 0.997) indicates that the loci are polymorphic enough in discriminating individuals. By considering the profile of the 19 loci at the same time, the probability to find two identical individuals is indeed remote (PID = 2.2 × 10-38); therefore, two individuals with the same profile at 19 loci are expected to be clones of the same genotype.
Genetic Structure and Identification of Unknown Accessions
The Ward’s clustering method, based on the Euclidean distance matrix, highlighted several individuals grouped at zero distance and, according also to the PID value based on the polymorphisms at 19 loci, they can be considered to be the same genotype (Supplementary Figure S2). Table 4 lists 38 accessions that were found to be identical. Among these, accessions #049, #012, #058, #147, and #013 were identical to #087, #010, #059, #118, and #043, respectively; they confirmed the correctness of the procedure as they had the same names, even if some of them were provided by different collections. Moreover, five unknown accessions, namely #076, #173, #148, #151, and #093 were identical to known genotypes and could therefore be named Annurca, Fuji, Coccianese, Rosciola, and Reinette du Canada, respectively. Some other accessions found to be identical can be considered synonyms: #002 of 001_Cerina, #134 of 126_Limoncella, #015 of 011_Sona, #028 and #030 of 016_Gelata, #041 of 039_Ciocarina Bianca, #053 of 080_ Ducale, #112 of 146_Gelata, #035, and #036 of 034_Panaia. Lastly, there were 5 other pairs of identical accessions (#055 and #060; #095 and #160; #103 and #157; #099 and #140; #054 and #102), all of unknown origin. In order to proceed with the statistical analysis accessions #054, #060, #103, #140, and #160 were removed.
Table 4
| Synonyms/Unknown | Reference accession | Cluster |
|---|---|---|
| 049_Amerina | 087_Amerina | 1 |
| 012_Ruzza | 010_Ruzza | 2 |
| 058_Coccianese | 059_Coccianese | 3 |
| 147_Rosa in Pietra | 118_Rosa in Pietra | 3 |
| 013_San Giovanni | 043_San Giovanni | 5 |
| 148_Unknown | 149_Coccianese | 3 |
| 076_Unknown | 136_Annurca | 4 |
| 173_Unknown | 171_Fuji | 5 |
| 151_Unknown | 082_Rosciola | 5 |
| 093_Unknown | 131_Reinette du Canada | 5 |
| 112_Paradisa | 146_Gelata | 1 |
| 002_Zuccherina | 001_Cerina | 1 |
| 028_Cerina | 016_Gelata | 1 |
| 030_Gelata | ||
| 015_A Sonagli | 011_Sona | 3 |
| 041_Ciochera Rosa | 039_Ciocarina Bianca | 3 |
| 134_Limoncina | 126_Limoncella | 3 |
| 053_Rosa d’Amelia | 080_Ducale | 3 |
| 035_Pagliaccia | 034_Panaia | 4 |
| 036_Casciola |
Accessions with identical SSR profile at 19 loci, used to identify unknown accessions and synonyms∗.
∗Please note that other five pair of Unknown accessions were identical and only one was maintained for further analysis (see text in Results). Accessions in italics are putative polyplois.
After the removal of 25 duplicates, the 150 accessions were reanalyzed by Ward’s clustering and analyzed by STRUCTURE. The results are reported in Figure 1 and are aligned in order to compare and, eventually, validate accession membership and population structure. On Ward’s dendrogram and at a distance of 60 units we found two main groups (P < 0.001). The upper group includes all local varieties, while the other includes several commercial varieties that were used in this study as controls: Annurca, Reinettes, Abbondanza, Golden Delicious, Golden Gala, Fuji, Cripps Pink, and Stark Delicious. Moreover, at a distance of 35 the dendrogram showed essentially 5 clusters, in agreement with K = 5 of STRUCTURE (see later paragraph).
FIGURE 1
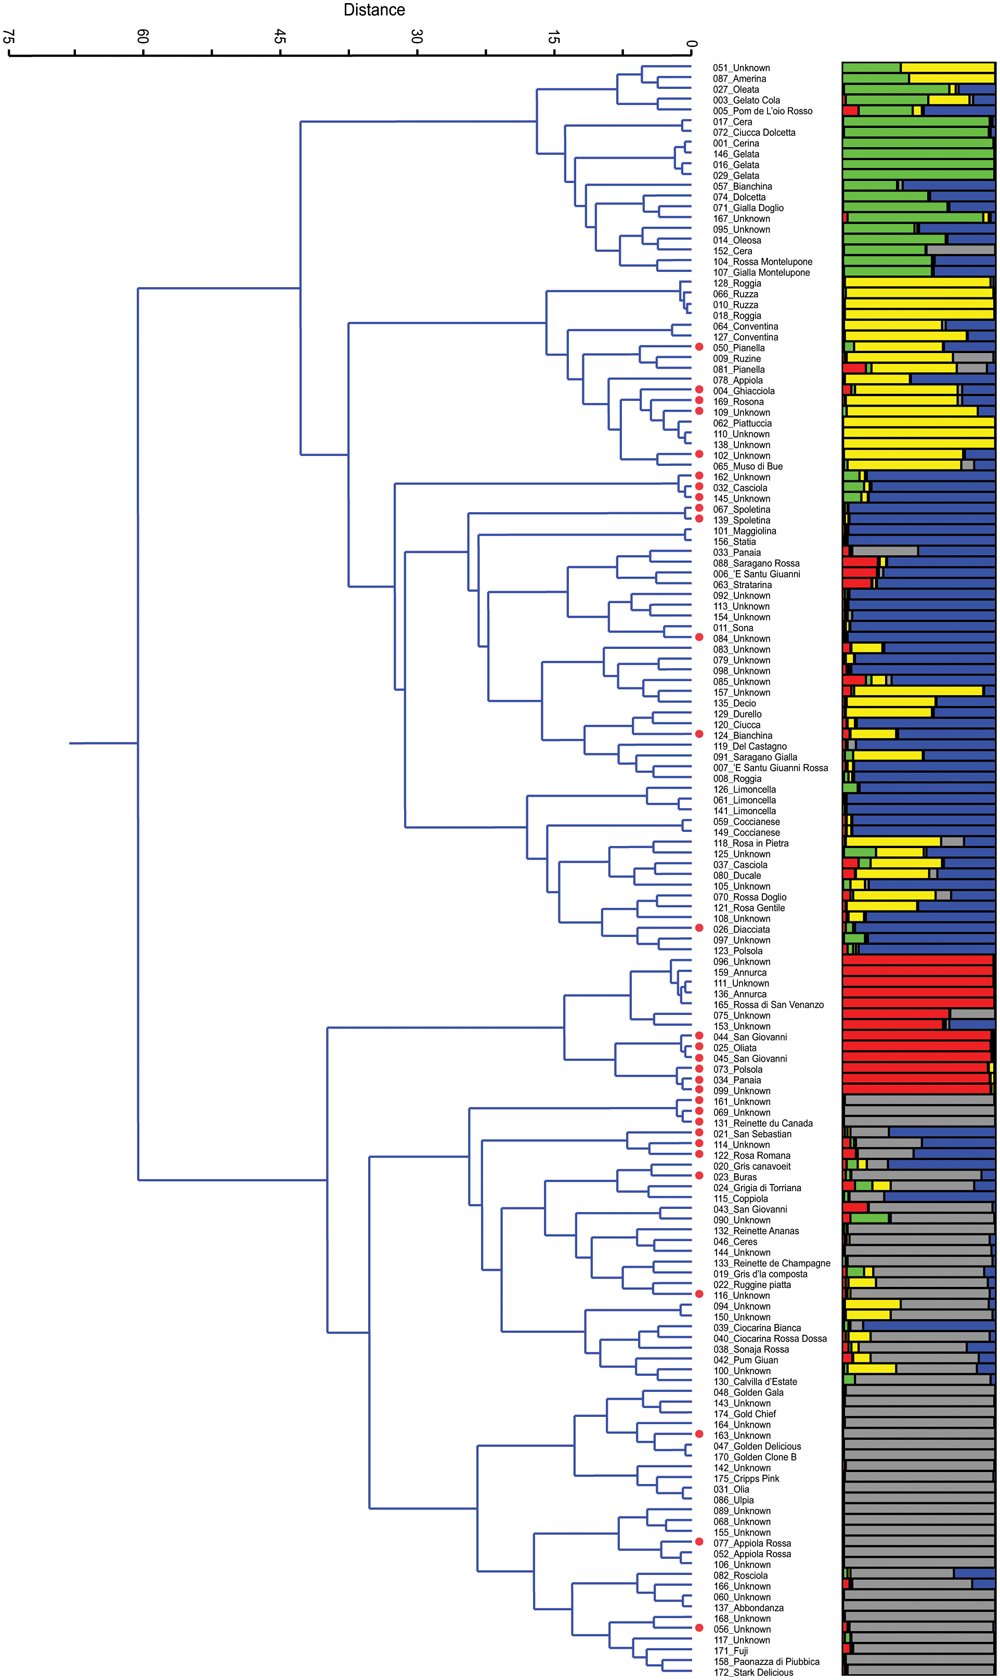
Ward’s clustering dendrogram of the 150 accessions of apple (on the left) and assignment by STRUCTURE at K = 5 (on the right). Polyploids are red labelled beside the accession name.
Cluster 1 is characterized by a group of local varieties which refer to ‘Gelata’ (#146, #016, #029), common in central Italy where it is known with different names: Cerina, Oleata, Cera (#001, #027, #017, and #152, respectively) (Gallesio, 1817/1839; Molon, 1901; Tamaro, 1929). In this cluster there are also two very similar accessions (#104 and #107) from Montelupone (Marche), differing from one another only for the skin color, red, and yellow, respectively.
Cluster 2 includes several ancient accessions from Umbria, such as Ruzza (#066 and #010) or Roggia (#128 and #018), which had already been described in the 16th century (Gallo, 1540). In this cluster there are two accessions named ‘Conventina’ (#064 and #127) from Gubbio (Umbria), which is the Italian name for ‘Monastery,’ and where this variety was grown since the Middle Ages, and it is known to be suitable for mountain areas (Tonini, 1930). Lastly, there is a subcluster of Piattuccia (#062) and Pianella (#050, #081) whose names are due to a flattened fruit shape.
Cluster 3, with 45 accessions, includes the subgroups of Spoletina (#067, #139), of Limoncella (#126, #061, and #141), of several polyploids (red labeled beside the name), the local varieties Sona (#011), Coccianese (#059) and several unknown accessions. Limoncella is an ancient variety common in the South of Italy whose name means ‘small lemon’; Sona is common in Valnerina (Umbria) and its name derives from the rattling sound of the seeds inside the carpel detaching at maturity.
Although apparently uniform, in Cluster 4 it is possible to detect two subgroups, one including all diploids accessions that refer to Annurca, an ancient cultivar of Campania whose origins were already described by Pliny the Elder (Pasquale, 1876), and the other including all polyploids and refers to Panaia (#034) and Polsola (#073), a synonym of Panaia, a local variety from Tuscany that spread in Umbria around 1700 and later in Abruzzo (Gallesio, 1817/1839). In the Annurca subgroup there are two unknown accessions, #096 and #111, tightly joined together (P < 0.06), both collected in Umbria.
Cluster 5 is the most numerous. It includes 54 accessions and it is possible to distinguish the group of Reinettes, the group of Golden, that of Appiola, that of Abbondanza and that of Fuji, Cripps Pink, and Stark Delicious. The Reinette accessions (#131, #132, and #133) and those known as ‘Mele Grigie’ (‘gray apples,’ from #019 to #024), provided by the Department of Agriculture of Torino, are very common in the North-West of Italy and are characterized by an acidic pulp and by a shrunken skin at maturity.
The plot of the average log-likelihood values for Ks ranging from 1 to 21 and the distribution of ΔK-values (Evanno et al., 2005) according to K-values are shown in the Supplementary Figure S3. Two peaks were found, the first corresponding to K = 2 and the second to K = 5; the hierarchical genetic structure was investigated at K = 5. A threshold value of PqI ≥ 0.80 was used to assign individuals to the groups (Figure 1). With this threshold as many as 58 of 150 individuals were classified as admixture. At K = 5 STRUCTURE was able to define 5 groups, identified by the colors green, yellow, blue, red, and gray, respectively, which are represented side by side with those detected by Ward’s clustering (Figure 1). By comparing the two grouping methods, and apart from the admixtures, it can be stated that there was a similar trend and correspondence. In Group 1 (green) only 7 out of 20 accessions were not classified as admixtures, and they all belong to Gelata and Cera (these are normally considered synonyms). In Group 2 (yellow) only 7 out of 18 accessions were classified at P(qI)≥ 0.80; of these, some belong to the group of Ruzza (synonym of Roggia, #128, #066, #010, #018, Dalla Ragione and Dalla Ragione, 2011) and the rest to Piattuccia (#062, #110, #138), confirming their cluster closeness. In Group 3 (blue), the cluster of Spoletina, Sona and Limoncella, 28 out of 45 were correctly classified (P(qI) ≥ 0.80). In Group 4 (red) 11 out of 13 accessions were correctly classified: the Annurca’s (all diploids) and a set of triploids, all belonging to #034_Panaia. Group 5 (gray) includes several commercial varieties (Reinettes, Golden Delicious, Golden Gala, Abbondanza, Fuji, Cripps Pink, and Stark Delicious) and here as many as 35 out of 54 accessions were accurately classified. Overall, by comparing the two methods, only two misclassified accessions emerged: the unknown #157 found in Ward’s Cluster 3 but ascribed by STRUCTURE in Group 2 (yellow), and 039_Ciocarina Bianca in Cluster 5 attributed by STRUCTURE in Group 3 (blue).
Having established that 92 accessions showed a genetic structure, the five groups were compared in terms of number of alleles, expected and observed heterozygosity (Table 5) and F-Statistics (Table 6). However, the mean number of alleles across the 19 loci and for all 92 accessions, as revealed by STRUCTURE, was 13.1, very similar to the population based on 150 accessions (14.6); likewise were the values of He (0.82 for both) and Ho (0.79 vs. 0.78, respectively). As expected, the mean number of alleles per locus in Groups 1, 2, and 4 was consistently lower than those for Groups 3 and 5, since heavily dependent on the number of accession forming the groups. Interestingly, in the former, less numerous groups, there was at least one locus with a fixed allele (Table 5), hence the indexes of diversity (He) were lower than those of Group 3 and 5. As expected, the overall FIS of the 5 groups was slightly negative (outbreeding), consistent for the majority of the loci (14), except for CH05e03 (0.1045, P < 0.05) and especially for Hi22f12 (0.7914, P < 0.001), highly homozygous compared with the expected values. The overall loci FST-value (0.1470, P < 0.001) is to be considered rather high, meaning that the 92 accessions were well structured and close to a value (0.15), generally considered to indicate a threshold limit between a moderate and a great differentiation (Wright, 1978). However, upon closer inspection of the FST-values at each locus it is possible to note that, apart from those loci whose values are close to the mean, some exceeded it by at least 3 times the standard error; these were CH05c06, Hi22f12, and AU223657 with 0.1995, 0.2162, and 0.3074, respectively, all significant at P < 0.001. Some other loci showed values more than 3 times lower than the mean; they were CH04c07, CH01h01, CH-Vf1, and CH01f03b, all significant at P < 0.001. In particular locus CH01h02 with a FST-value of 0.0403 (P < 0.05) denoted a little differentiation. All the results reported above were confirmed by AMOVA, where the variation within groups was 75.9% and among was 24.1%, values different from those reported in literature (Gasi et al., 2010; Urrestarazu et al., 2012, 2016; Pereira-Lorenzo et al., 2017).
Table 5
| ALL (n = 92) | Group1 (n = 7) | Group2 (n = 9) | Group3 (n = 29) | Group4 (n = 11) | Group5 (n = 36) | |||||||||||||
|---|---|---|---|---|---|---|---|---|---|---|---|---|---|---|---|---|---|---|
| Locus | Na | He | Ho | Na | He | Ho | Na | He | Ho | Na | He | Ho | Na | He | Ho | Na | He | Ho |
| CH05c06 | 13 | 0.81 | 0.83 | 3 | 0.60 | 1.00 | 1a | 0.00 | 0.00 | 10 | 0.77 | 0.90 | 6 | 0.73 | 1.00 | 9 | 0.79 | 0.89 |
| CH-Vf1 | 10 | 0.64 | 0.74 | 2 | 0.49 | 0.71 | 2 | 0.11 | 0.11 | 7 | 0.71 | 0.90 | 3 | 0.65 | 1.00 | 7 | 0.63 | 0.69 |
| Hi07h02 | 15 | 0.89 | 0.87 | 3 | 0.38 | 0.43 | 3 | 0.66 | 1.00 | 14 | 0.92 | 0.86 | 5 | 0.77 | 1.00 | 11 | 0.82 | 0.89 |
| CH03d12 | 22 | 0.87 | 0.78 | 2 | 0.14 | 0.14 | 5 | 0.71 | 1.00 | 16 | 0.89 | 0.93 | 7 | 0.80 | 0.75 | 10 | 0.74 | 0.75 |
| CH05e03 | 22 | 0.90 | 0.70 | 2 | 0.54 | 1.00 | 6 | 0.64 | 0.67 | 14 | 0.89 | 0.66 | 2 | 0.42 | 0.00 | 13 | 0.90 | 0.89 |
| Hi04e04 | 14 | 0.88 | 0.85 | 2 | 0.44 | 0.57 | 3 | 0.45 | 0.56 | 9 | 0.83 | 0.97 | 5 | 0.70 | 1.00 | 9 | 0.86 | 0.83 |
| CH02b03b | 13 | 0.86 | 0.90 | 2 | 0.53 | 0.86 | 4 | 0.69 | 1.00 | 8 | 0.76 | 0.86 | 6 | 0.78 | 1.00 | 10 | 0.83 | 0.89 |
| CH01f03b | 11 | 0.79 | 0.89 | 4 | 0.71 | 1.00 | 4 | 0.69 | 1.00 | 8 | 0.81 | 0.90 | 3 | 0.50 | 0.55 | 8 | 0.81 | 0.94 |
| CH02c09 | 12 | 0.85 | 0.85 | 4 | 0.67 | 1.00 | 1b | 0.00 | 0.00 | 8 | 0.81 | 0.86 | 6 | 0.83 | 1.00 | 8 | 0.82 | 0.97 |
| Hi22f12 | 5 | 0.76 | 0.13 | 3 | 0.54 | 0.14 | 3 | 0.57 | 0.11 | 5 | 0.75 | 0.18 | 1c | 0.00 | 0.00 | 4 | 0.73 | 0.14 |
| CH01g12 | 17 | 0.88 | 0.91 | 3 | 0.67 | 1.00 | 5 | 0.60 | 0.78 | 12 | 0.84 | 0.90 | 5 | 0.70 | 1.00 | 11 | 0.84 | 0.92 |
| AU223657 | 6 | 0.78 | 0.67 | 2 | 0.26 | 0.29 | 3 | 0.66 | 1.00 | 5 | 0.78 | 0.79 | 3 | 0.63 | 1.00 | 4 | 0.47 | 0.47 |
| CH01h02 | 9 | 0.71 | 0.75 | 3 | 0.66 | 0.86 | 5 | 0.71 | 1.00 | 8 | 0.74 | 0.72 | 3 | 0.45 | 0.55 | 5 | 0.72 | 0.75 |
| CH01h01 | 11 | 0.85 | 0.88 | 2 | 0.36 | 0.43 | 4 | 0.71 | 1.00 | 11 | 0.87 | 0.90 | 5 | 0.78 | 1.00 | 7 | 0.81 | 0.89 |
| CH04a12 | 14 | 0.80 | 0.80 | 3 | 0.66 | 0.86 | 3 | 0.57 | 0.89 | 10 | 0.81 | 0.76 | 4 | 0.46 | 0.55 | 8 | 0.80 | 0.89 |
| Hi03a10 | 15 | 0.88 | 0.75 | 3 | 0.63 | 0.71 | 3 | 0.69 | 1.00 | 13 | 0.90 | 0.66 | 4 | 0.61 | 0.73 | 9 | 0.76 | 0.78 |
| CH04c07 | 16 | 0.89 | 0.92 | 3 | 0.69 | 1.00 | 4 | 0.71 | 1.00 | 12 | 0.83 | 0.90 | 7 | 0.87 | 1.00 | 9 | 0.85 | 0.89 |
| CH01c06 | 11 | 0.76 | 0.83 | 1d | 0.00 | 0.00 | 3 | 0.66 | 1.00 | 9 | 0.75 | 0.93 | 3 | 0.50 | 0.55 | 8 | 0.83 | 0.94 |
| CH02g01 | 13 | 0.82 | 0.77 | 3 | 0.69 | 1.00 | 3 | 0.63 | 0.89 | 9 | 0.80 | 0.86 | 4 | 0.71 | 0.55 | 8 | 0.74 | 0.69 |
| Mean | 13.1 | 0.82 | 0.78 | 2.6 | 0.51 | 0.68 | 3.4 | 0.55 | 0.74 | 9.9 | 0.81 | 0.81 | 4.3 | 0.63 | 0.75 | 8.3 | 0.78 | 0.80 |
Number of alleles (Na), observed (Ho), and expected (He) eterozygosity for the five groups revealed by STRUCTURE.
alocus with a fixed allele 122; blocus with a fixed allele 248; clocus with a fixed allele 218; dlocus with a fixed allele 163.
Table 6
| Locus | FIS‡ | FST |
|---|---|---|
| CH05c06 | –0.2264 ∗∗∗ | 0.1995∗∗∗ |
| CH-Vf1 | –0.2398 ∗∗∗ | 0.0894∗∗∗ |
| Hi07h02 | –0.1029 ∗ | 0.1346∗∗∗ |
| CH03d12 | –0.0687 n.s. | 0.1659 ∗∗∗ |
| CH05e03 | 0.1045 ∗ | 0.1546 ∗∗∗ |
| Hi04e04 | –0.1200 ∗∗∗ | 0.1635 ∗∗∗ |
| CH02b03b | –0.1988 ∗∗∗ | 0.1423 ∗∗∗ |
| CH01f03b | –0.1968 ∗∗∗ | 0.0670 ∗∗∗ |
| CH02c09 | –0.1791 ∗∗∗ | 0.1849 ∗∗∗ |
| Hi22f12 | 0.7914 ∗∗∗ | 0.2162 ∗∗∗ |
| CH01g12 | –0.1736 ∗∗∗ | 0.1403 ∗∗∗ |
| AU223657 | –0.1676 ∗∗∗ | 0.3074 ∗∗∗ |
| CH01h02 | –0.1151 ∗ | 0.0403 ∗ |
| CH01h01 | –0.1458 ∗∗∗ | 0.1050 ∗∗∗ |
| CH04a12 | –0.1146 ∗ | 0.1166 ∗∗∗ |
| Hi03a10 | 0.0006 n.s. | 0.1547 ∗∗∗ |
| CH04c07 | –0.1363 ∗∗ | 0.1084 ∗∗∗ |
| CH01c06 | –0.2209 ∗∗∗ | 0.1360 ∗∗∗ |
| CH02g01 | –0.0646 n.s. | 0.1324 ∗∗∗ |
| Mean | –0.0866 ∗∗∗ | 0.1470∗∗∗ |
| SE | 0.0460 | 0.0127 |
F statistics and significance for each locus and total of the 5 groups as obtained by STRUCTURE (SPAGeDi).
‡FIS is the loss of heterozygosity due to inbreeding, FST is the loss of heterozygosity due to genetic drift; ∗, ∗∗, ∗∗∗F-values significant at P < 0.05, 0.01, and 0.001, respectively; n.s. not significant.
Parentage Analysis
The parentage analysis was used (i) to investigate the origins of the 49 unknown accessions after the removal of 10 found identicals to well-known genotypes and (ii) to look for concordance with the results from STRUCTURE and Ward’s clustering.
Table 7 reports the 38 unknown accessions significantly related (LOD score > 5) to parents of known origin (LV and CV). As many as 27 of them showed full concordance with STRUCTURE and Ward’s clustering. The most likely parents of 10 unknown accessions, classified by STRUCTURE into the Admixture group, were classified also by Ward’s in the same group. Lastly, the 144_Unknown was included by STRUCTURE in group 5, whereas the most likely parent, 033_Panaia, was classified differently by the other two analytic procedures (Ward’s Cluster3 and Admixture in STRUCTURE).
Table 7
| Unknown accessions | Classified by STRUCTURE into Group | Likely parents of known origin | LOD score | Ward’s Cluster Number | Classified by STRUCTURE into Group |
|---|---|---|---|---|---|
| #051 | Adm | #001 Cerina | 12.79 | 1 | 1 |
| #062 Piattuccia | 11.56 | 2 | 2 | ||
| #167 | 1 | #016 Gelata | 15.34 | 1 | 1 |
| #029 Gelata | 14.65 | 1 | 1 | ||
| #146 Gelata | 11.69 | 1 | 1 | ||
| #001 Cerina | 11.00 | 1 | 1 | ||
| #095 | Adm | #001 Cerina | 9.27 | 1 | 1 |
| #146 Gelata | 5.00 | 1 | 1 | ||
| #109 | 2 | #062 Piattuccia | 17.87 | 2 | 2 |
| #110 | 2 | #062 Piattuccia | 22.50 | 2 | 2 |
| #004 Ghiacciola | 16.29 | 2 | 2 | ||
| #138 | 2 | #062 Piattuccia | 23.33 | 2 | 2 |
| #004 Ghiacciola | 17.00 | 2 | 2 | ||
| #102 | Adm | #062 Piattuccia | 17.91 | 2 | 2 |
| #162 | 3 | #032 Casciola | 21.81 | 3 | 3 |
| #145 | 3 | #032 Casciola | 23.40 | 3 | 3 |
| #084 | 3 | #011 Sona | 22.84 | 3 | 3 |
| #079 | 3 | #135 Decio | 14.69 | 3 | 3 |
| #097 | 3 | #123 Polsola | 10.44 | 3 | 3 |
| #096 | 4 | #165 Rossa di San Venanzo | 24.47 | 4 | 4 |
| #159 Annurca | 23.52 | 4 | 4 | ||
| #136 Annurca | 23.41 | 4 | 4 | ||
| #111 | 4 | #159 Annurca | 24.27 | 4 | 4 |
| #136 Annurca | 24.16 | 4 | 4 | ||
| #075 | Adm | #136 Annurca | 16.78 | 4 | 4 |
| #153 | Adm | #159 Annurca | 11.17 | 4 | 4 |
| #136 Annurca | 11.05 | 4 | 4 | ||
| #099 | 4 | #073 Polsola | 30.01 | 4 | 4 |
| #034 Panaia | 27.96 | 4 | 4 | ||
| #161 | 5 | #131 Reinette du Canada | 25.20 | 5 | 5 |
| #019 Gris d’la Composta | 6.04 | 5 | 5 | ||
| #069 | 5 | #131 Reinette du Canada | 25.88 | 5 | 5 |
| #019 Gris d’la Composta | 6.72 | 5 | 5 | ||
| #090 | Adm | #043 San Giovanni PT | 21.60 | 5 | 5 |
| #144 | 5 | #033 Panaia | 8.72 | 3 | Adm |
| #116 | 5 | #131 Reinette du Canada | 6.37 | 5 | 5 |
| #094 | Adm | #038 Sonaja Rossa | 7.04 | 5 | 5 |
| #150 | Adm | #038 Sonaja Rossa | 5.93 | 5 | 5 |
| #100 | Adm | #130 Calvilla d’Estate | 14.04 | 5 | 5 |
| #143 | 5 | #047 Golden Delicious | 19.31 | 5 | 5 |
| #170 Golden Clone B | 18.74 | 5 | 5 | ||
| #174 Gold Chief | 13.66 | 5 | 5 | ||
| #172 Stark Delicious | 12.47 | 5 | 5 | ||
| #171 Fuji | 7.99 | 5 | 5 | ||
| #048 Golden Gala | 6.47 | 5 | 5 | ||
| #164 | 5 | #047 Golden Delicious | 11.50 | 5 | 5 |
| #170 Golden Clone B | 10.81 | 5 | 5 | ||
| #175 Cripps Pink | 9.13 | 5 | 5 | ||
| #174 Gold Chief | 5.58 | 5 | 5 | ||
| #163 | 5 | #170 Golden Clone B | 16.89 | 5 | 5 |
| #047 Golden Delicious | 13.56 | 5 | 5 | ||
| #174 Gold Chief | 12.67 | 5 | 5 | ||
| #137 Abbondanza | 6.82 | 5 | 5 | ||
| #142 | 5 | #086 Ulpia | 15.32 | 5 | 5 |
| #031 Olia | 13.71 | 5 | 5 | ||
| #089 | 5 | #052 AppiolaRossa | 16.14 | 5 | 5 |
| #137 Abbondanza | 13.24 | 5 | 5 | ||
| #077 Appiola Rossa | 7.25 | 5 | 5 | ||
| #068 | 5 | #137 Abbondanza | 19.26 | 5 | 5 |
| #052 AppiolaRossa | 13.67 | 5 | 5 | ||
| #155 | 5 | #137 Abbondanza | 16.43 | 5 | 5 |
| #052 AppiolaRossa | 11.63 | 5 | 5 | ||
| #158 Paonazza di Piubbica | 6.92 | 5 | 5 | ||
| #106 | 5 | #052 AppiolaRossa | 30.40 | 5 | 5 |
| #077 Appiola Rossa | 22.15 | 5 | 5 | ||
| #166 | Adm | #137 Abbondanza | 19.49 | 5 | 5 |
| #060 | 5 | #137 Abbondanza | 33.23 | 5 | 5 |
| #158 Paonazza di Piubbica | 13.17 | 5 | 5 | ||
| #168 | 5 | #052 AppiolaRossa | 15.94 | 5 | 5 |
| #172 Stark Delicious | 15.77 | 5 | 5 | ||
| #077 Appiola Rossa | 6.25 | 5 | 5 | ||
| #158 Paonazza di Piubbica | 5.80 | 5 | 5 | ||
| #056 | 5 | #077 Appiola Rossa | 8.41 | 5 | 5 |
| #172 Stark Delicious | 8.00 | 5 | 5 | ||
| #052 AppiolaRossa | 7.95 | 5 | 5 | ||
| #117 | 5 | #172 Stark Delicious | 17.69 | 5 | 5 |
| #174 Gold Chief | 6.22 | 5 | 5 |
Parentage analysis of unknown accessions, their membership to the group of Stucture, the most likely parent of known origin (LOD score as otained by FaMoz) and its membership to Cluster and to STRUCTURE.
In particular, 051_Unknown was classified by STRUCTURE as admixture, showing a probability of 0.38 to be assigned to Group1 and of 0.61 to Group2; likely parents were 001_Cerina and 062_Piattuccia, belonging to Cluster1/Group1 and to Cluster2/Group2, respectively. Since Ward’s clustering assigned #051 to Cluster 1, it can be stated that STRUCTURE was more efficient to infer its mixed genomic configuration.
Correlation of SSR Alleles and Some Morphological Traits
Correlations among morphological traits were not significant, except over color vs. fruit rustiness (r = -0.3166, P < 0.001). Eleven out of 19 SSR loci revealed that 15 alleles out of 278 were significantly (P < 0.001) correlated with five morphological traits (Table 8). Four alleles showed a significant negative correlation with time of eating maturity, so that the presence of these alleles was related with early maturity. CH03d12_128 and Hi03a10_199 were positively correlated with fruit shape. Similarly, pulp color revealed two alleles with significant positive correlations with two SSR loci related to aroma compounds (Dunemann et al., 2009), indicating putative correlation between pulp color and aroma trait.
Table 8
| Traits | SSR locus_allele | r | P-value |
|---|---|---|---|
| Time of eating maturity | CH05c06_106 | –0.28146 | 0.0010 |
| CH02c09_234 | –0.28809 | 0.0008 | |
| CH01g12_146 | –0.28636 | 0.0008 | |
| AU223657_235 | –0.28460 | 0.0009 | |
| Fruit shape | CH03d12_128 | 0.34733 | 0.0001 |
| Hi03a10_199 | 0.29298 | 0.0006 | |
| Ground color | CH01f03b_137 | 0.28016 | 0.0010 |
| Over color | CH_Vf1_127 | –0.36308 | 0.0001 |
| Hi04e04_222 | –0.31808 | 0.0002 | |
| CH02b03b_077 | –0.30490 | 0.0004 | |
| CH01g12_151 | –0.31013 | 0.0003 | |
| Hi03a10_253 | –0.31440 | 0.0002 | |
| CH01c06_159 | –0.31436 | 0.0002 | |
| Pulp color | Hi04e04_247 | 0.38470 | 0.0001 |
| CH01g12_146 | 0.33177 | 0.0001 |
Spearman correlation coefficients (r) and statistical significance (P-value) between SSRs loci and morphological traits.
The over color was found negatively correlated with several alleles, with r-values ranging from - 0.3049 (for CH02b03b_077) to - 0.36308 (for CH_Vf1_127), meaning that their presence is by some means related to light colors (absence, yellow, and orange). Interestingly, the majority of the marker-alleles detected for the over color were related to QTLs for resistance to biotic stresses, aroma compounds, stiffness, and acidity, indicating a possible correlation among these traits (Kenis et al., 2008). Lastly, only one allele (CH01f03b_137) resulted positively correlated with ground color.
Moreover, three (CH01g12, Hi03a10, and Hi04e04) out of eleven loci identified in the correlation test were found in at least two traits, while CH01g12 was detected in maturity, over color and pulp color.
Discussion
The rapid spread of modern, intensive agricultural techniques during the last century was also accompanied by a rapid spread of newly bred cultivars characterized by greater productivity and uniformity. Although this trend was more intensive in annual crops, it did not spare fruit orchards. The oversimplification of the agricultural systems in favorable areas caused parallel changes in the agricultural economy, farming assets, rural culture, and agricultural landscapes as well. From a biological point of view this determined a significant reduction of crop biodiversity and a progressive genetic erosion with the loss of many ancient, well adapted local varieties. For this reason, over the last 50 years, the need to develop effective strategies for the conservation and management of genetic resources has become a fundamental issue. At this purpose germplasm banks have been established all over the world, operating at international, national and local levels. Italy, in compliance with EU directives, has promoted several Regional germplasm collections, with the aim of maintaining and preserving the autochthonous diversity. In Italy fruit germplasm, and apple genetic resources in particular, are conserved by National and Regional institutions (such as CREA, University of Bologna, Malva Rinaldi School of Torino, and many others), several of whom kindly provided accessions that were used as controls in this study.
The area of Central Italy is characterized by hills, mountains, small valleys, a variety of soil types (Corti et al., 2013) and of exposure, generating many micro-environments. Rainfall amounts and distribution from the East to the West coasts, passing through the Apennines, is also different, as well as the temperatures due to altitude differences from sea level to 2000–3000 m a.s.l. (Longinelli and Selmo, 2003). Fruit in general, and apples in particular, were rarely grown in specialized and intensive cultivation over large areas. Therefore, coupling these conditions together can perhaps explain most of the reasons at the base of the rich diversity found in the apple germplasm of Central Italy, a picture difficult to find in other Italian regions.
Many of these local varieties are well adapted to specific agro-climatic conditions and often express some diversity with respect to the originals in terms of morphological and physiological traits, thus assuming different names. Often, the names were assigned on the base of phenotypic traits, strongly influenced by the environment and agricultural practice, thus increasing the existing confusion about local genetic resources and their correct denomination. This gives rise to the importance of characterizing the germplasm present in the national and regional germplasm banks, by identifying duplicates and redundant accessions, hence simplifying the management and reducing costs of living collections.
For this purpose, molecular markers and in particular SSR have been widely used in genetic diversity studies and clarified cases of synonymy and homonymy in core collections (Patzak et al., 2012; Urrestarazu et al., 2012, 2016; Liang et al., 2015; Yun et al., 2015; Lassois et al., 2016). Following the detection of null alleles, two of the initial 21 loci (Hi23g02 and Hi03g02) were discarded. The remaining 19 showed a high degree of polymorphism and discriminating power and allowed us to meet our objectives.
The pool of accession studied here showed a percentage of polyploids of 20%, a value intermediate between 8% reported by Urrestarazu et al. (2016) in screening a wide European collection, and those found in Spain: 34% by Pereira-Lorenzo et al. (2007), 29% by Ramos-Cabrer et al. (2007), and 24% by Urrestarazu et al. (2012).
In brief, our study showed that 25 accessions were duplicates, 9 had to be considered synonyms (Table 4) and 9 homonyms. Six accessions from the living collection of 3A-PTA Pantalla and 3A-PTA Casalina (Amerina c02_049/ c02_087, Coccianese c02_058/ c02_059, and Rosa in Pietra c02_147/c03_118) were duplicates of the same genotype, because the SSR profiles were identical throughout the 19 loci. Also San Giovanni (c02_013) and Ruzza (c02_012) turned out to be identical to the corresponding accessions provided by the Department of Agricultural Science, University of Bologna (c08) and the National Center of Fruit Tree Germplasm (c01), thus confirming the goodness of the analysis.
Among polyploids we found some accessions named Panaia or Polsola, and they are synonyms (Dalla Ragione and Dalla Ragione, 2011). This ancient variety, whose local name ‘Panaia’ derives from ‘bread basket,’ was very common in Central Italy and in the past two varieties were described by Gallesio (1817/1839): ‘Panaia massima’ and ‘Panaia a frutto piccolo.’ These denominations refer to the dimension of the fruit, and may explain the homonymy between #034 and #075 (polyploids with bigger fruit) vs. #033 (diploid with smaller fruit).
As far as homonymy is concerned, three accessions named ‘San Giovanni’ were also scattered among Clusters 4 and 5. This is a group of accessions whose local name is linked to the time of maturation (end of June), independently of other traits, one is diploid (#043, Cluster 5) while the other two were polyploids (#044, #045, Cluster 4). Other examples of homonymy include #008_Roggia (Cluster3), genetically different from the two Roggia listed in Cluster2; Appiola Rossa #052 (diploid) vs. Appiola Rossa #077 (polyploid) in Cluster 5, and Bianchina #057 (diploid, in Cluster1) vs. Bianchina #124 (polyploid, in Cluster 3).
Another significant result of our study was the genetic identification of several unknown accessions. Ten of them were excluded as duplicates of well-known accessions. By using different statistical approaches (Cluster, STRUCTURE and Parentage analysis) it was possible to assign 37 more accessions to known commercial or local varieties.
Lastly, it is worth mentioning that the 92 accessions found by the Bayesian analysis were well-structured at K = 5, where the FST-value indicates a high differentiation among subpopulations, much higher than those reported in the literature (Pereira-Lorenzo et al., 2007; Gasi et al., 2010; Urrestarazu et al., 2012, 2016), indicating that the material from Central Italy is a genetic pool worthy of safeguarding and conservation. In particular we found that FST at some loci were very contrasting (see Table 6). The low FST-values at loci CH04c07, CH01h01, CH-Vf1, CH01f03b and CH01h02 suggests that homogenizing selection across subpopulations reduces differentiation, whereas the high FST-values at loci CH05c06, Hi22f12, and AU223657 suggest that selection for local adaptation is creating differentiation. In these cases we found that the allele 128 of CH-Vf1 is correlated with fruit over color and allele 137 of locus CH01f03b with fruit ground color, while allele 106 of CH05c06 and allele 235 of AU223657 are correlated with time of eating maturity (Table 8).
Unexpectedly, the observed heterozygosity at the locus Hi22f12 was significantly lower than the values at the other 18 loci (0.13 vs. 0.78), meaning that almost all individuals at this locus are homozygous. Actually, this is also the locus with the lowest number of alleles. The sequence of the Hi22f12 SSR locus was then used in the BLAST program analysis against the NCBI nr database, and we found that Hi22f12 is located inside the transcription factor IIE subunit 1-like gene (XM_008376494.2) of Malus × domestica, at the position 1187–1242. The expectation and the identity of the query against the reference gene was 2 × 10⁻⁶ and 85%, respectively. The stability needed by this gene explains this low polymorphism, perhaps confined to introns. It would be interesting to extend this investigation to other germplasm collections.
In the present study Hi22f12 and some other SSR loci resulted fixed; in particular, loci CH05C06 and CH02c09 showed a fixed allele in group 2 of STRUCTURE. Of these, CH05C06 is of particular interest, associated with a major QTL for fruit titratable acidity (TA) detected in the Ma region (Liebhard et al., 2003; Kenis et al., 2008). In the cross ‘Telamon × Braeburn,’ this QTL was mapped in the LG16, an interval between the markers CH05e04z and CH05c06 and explained 20–34% of the observed variance (Kenis et al., 2008). The Ma gene controls the level of malic acid in apples and many other fruits (Maliepaard et al., 1998; Liebhard et al., 2003; Xu et al., 2012). Indeed, acidity is one of the most important fruit traits and, in apples, it strongly affects quality and organoleptic characteristics. In fact, the balance between sugars and acids is the basis of the taste and flavor of fruit (Wu et al., 2007; Zhang et al., 2010) and is therefore of utmost importance in breeding programs (Visser and Verhaegh, 1978). Moreover, this locus seems to be associated with a second QTL (M2), coding for the aromatic compound β-damascenone (Dunemann et al., 2009), a potent aroma present in apples (Cunningham et al., 1986; Fuhrmann and Grosch, 2002) and other fruits (peaches and grapes) and beverages (coffee, beer, and wine), and is associated with descriptions such as “fruity-flowery,” and in particular “apple” and “baked apple” (Pineau et al., 2007). In our study the allele 120 at the locus CH05C06 is fixed in all accessions of Group 2 of STRUCTURE, the one hosting Conventina, Ruzza, Roggia, Rosona, and Piattuccia, all characterized by crispy, sugary, sour, and very aromatic pulp. In the same group 2 we found fixed also the allele 248 of the locus CH2c09 and this locus is linked to a QTL for the aromatic compound allylanil (M1) associated with anise and licorice descriptors on the LG 15(Plotto and McDaniel, 2000; Dunemann et al., 2009). Two other allele in the present investigation, the 162 at locus CH01c06 and the 218 at locus Hi22f12, were also fixed in Group 1 and Group 4, respectively, but no information was found in the Malus database.
Conclusion
In conclusion, this paper highlights the presence of considerable genetic variability among the apple accessions recovered in Central Italy and the information obtained can be used to better manage large living collections of a fruit tree of great nutritional interest such as the apple.
Statements
Author contributions
EA, LC, and FV conceived the study. EA and GM designed and coordinated the experiments. EA, GM, and LC chose and provided the germplasm. GM and NF performed the lab experiments. GM, LR, and NF conducted the data analysis and wrote the manuscript, while EA and FV critically reviewed it.
Funding
The research was supported by “Convenzione con il Parco 3APTA 2014: Servizio di Conservazione e Ampliamento delle Banche Regionali della Biodiversità,” CUP I61J11000280009.
Acknowledgments
The authors would like to thank all the public and private institutions that kindly provided the accessions (listed in Table 1), Isabella Dalla Ragione and Mauro Gramaccia for technical assistance, and Liam Boyle for proofreading the manuscript.
Conflict of interest
The authors declare that the research was conducted in the absence of any commercial or financial relationships that could be construed as a potential conflict of interest.
Supplementary material
The Supplementary Material for this article can be found online at: https://www.frontiersin.org/articles/10.3389/fpls.2018.01460/full#supplementary-material
References
1
AlbertiniE.Dalla RagioneI.FalcinelliM.FerradiniN.GramacciaM.LorenzettiS.et al(eds). (2015). “Il contributo delle analisi genetiche allo studio ed alla conoscenza della diversità delle varietà locali di melo,” inLa Biodiversità di Interesse Agrario Della Regione Umbria - Specie Arboree da FruttoVol. 2 (Todi PG: 3A-PTA) 12–57.
2
Assomela-CSO (2017). Available at: http://www.assomela.it/index_it.html
3
BlairM. W.DíazL. M.BuendíaH. F.DuqueM. C. (2009). Genetic diversity, seed size associations and population structure of a core collection of common beans (Phaseolus vulgaris L.).Theor. Appl. Genet.119955–972. 10.1007/s00122-009-1064-8
4
BotsteinD.WhiteR. L.SkolnikM.DavisR. W. (1980). Construction of a genetic linkage map in man using restriction fragment length polymorphisms.Am. J. Hum. Genet.32314–331.
5
BretonC.PinatelC.MédailF.BonhommeF.BervilléA. (2008). Comparison between classical and Bayesian methods to investigate the history of olive cultivars using SSR-polymorphisms.Plant Sci.175524–532. 10.1016/j.plantsci.2008.05.025
6
CaballeroA.García-DoradoA. (2013). Allelic diversity and its implications for the rate of adaptation.Genetics1951373–1384. 10.1534/genetics.113.158410/-/DC1
7
CeltonJ. M.TustinD. S.ChagnéD.GardinerS. E. (2009). Construction of a dense genetic linkage map for apple rootstocks using SSRs developed from Malus ESTs and Pyrus genomic sequences.Tree Genet. Genomes593–107. 10.1007/s11295-008-0171-z
8
CornilleA.GiraudT.SmuldersM. J.Roldan-RuizI.GladieuxP. (2014). The domestication and evolutionary ecology of apples.Trends Genet.3057–65. 10.1016/j.tig.2013.10.002
9
CornilleA.GladieuxP.SmuldersM. J.Roldan-RuizI.LaurensF.Le CamB.et al (2012). New insight into the history of domesticated apple: secondary contribution of the European wild apple to the genome of cultivated varieties.PLoS Genet.8:e1002703. 10.1371/journal.pgen.1002703
10
CortiG.CoccoS.BrecciaroliG.AgnelliA.SeddaiuG. (2013). “Italian soil management from antiquity to nowadays,” inThe Soils of Italy. World Soils Book SeriesedsCostantiniE. A. C.DazziC. (Dordrecht: Springer Netherlands) 247–293. 10.1007/978-94-007-5642-7_9
11
CunninghamD. G.AcreeT. E.BarnardJ.ButtsR. M.BraellP. A. (1986). Charm analysis of apple volatiles.Food Chem.19137–147. 10.1016/0308-8146(86)90107-X
12
Dalla RagioneL.Dalla RagioneI. (2011). Archeologia Arborea. Diario di due cercatori di piante.Perugia: Alieno ed.
13
DunemannF.UlrichD.BoudichevskaiaA.GrafeC.WeberW. E. (2009). QTL mapping of aroma compounds analysed by headspace solid-phase microextraction gas chromatography in the apple progeny ‘Discovery’ × ‘Prima’.Mol. Breed.23501–521. 10.1007/s11032-008-9252-9
14
EarlD. A.vonHoldtB. M. (2012). Structure Harvester: a website and program for visualizing structure output and implementing the Evanno method.Conserv. Genet. Resour.4359–361. 10.1007/s12686-011-9548-7
15
EmanuelliF.LorenziS.GrzeskowiakL.CatalanoV.StefaniniM.TroggioM.et al (2013). Genetic diversity and population structure assessed by SSR and SNP markers in a large germplasm collection of grape.BMC Plant Biol.13:39. 10.1186/1471-2229-13-39
16
EvannoG.RegnautS.GoudetJ. (2005). Detecting the number of clusters of individuals using the software structure: a simulation study.Mol. Ecol.142611–2620. 10.1111/j.1365-294X.2005.02553.x
17
EvettI. W.WeirB. S. (1998). Interpreting DNA Evidence: Statistical Genetics for Forsenic Scientist.Sunderland, MA: Sinauer Associates, Inc.
18
ExcoffierL.SmouseP. E.QuattroJ. M. (1992). Analysis of molecular variance inferred from metric distances among DNA haplotypes: application to human mitochondrial DNA restriction data.Genetics131479–491.
19
FalushD.StephensM.PritchardJ. K. (2007). Inference of population structure using multilocus genotype data: dominant markers and null alleles.Mol. Ecol. Notes7574–578. 10.1111/j.1471-8286.2007.01758.x
20
Food and Agricultural Organization of the United Nation [FAO] (2016). Available at: http://faostat.fao.org/beta/en/#data/QC/visualize
21
FuhrmannE.GroschW. (2002). Character impact odorants of the apple cultivars Elstar and Cox Orange.Mol. Nutr. Food Res.46187–193.
22
GallesioG. (1817/1839). Pomona Italiana, Ossia Trattato Degli Alberi da Frutto.Pisa: Nicolò Capurro.
23
GalloM. A. (1540). “Le vinti giornate dell’agricoltura et de’ piaceri della villa,” inAnonymous Printing at Venice in the Sixteenth Centuryed.RhodesD. E. (Venetia: appresso Camillo, & Rutilio Borgomineri fratelli, al segno di San Giorgio).
24
GaoY.LiuF.WangK.WangD.GongX.LiuL.et al (2015). Genetic diversity of Malus cultivars and wild relatives in the Chinese National Repository of Apple Germplasm Resources.Tree Genet. Genomes11:106. 10.1007/s11295-015-0913-7
25
GasiF.SimonS.PojskicN.KurtovicM.PejicI. (2010). Genetic assessment of apple germplasm in Bosnia and Herzegovina using microsatellite and morphologic markers.Sci. Hortic.126164–171. 10.1016/j.scienta.2010.07.002
26
GerberS.ChabrierP.KremerA. (2003). FaMoz: a software for parentage analysis using dominant, codominant and uniparentally inherited markers.Mol. Ecol. Notes3479–481. 10.1046/j.1471-8286.2003.00439.x
27
GerberS.StreiffR.BodénèsC.MarietteS.KremerA. (2000). Comparison of microsatellites and AFLP markers for parentage analysis.Mol. Ecol.91037–1048. 10.1046/j.1365-294x.2000.00961.x
28
GharghaniA.ZamaniZ.TalaieA.OraguzieN. C.FatahiR.HajnajariH.et al (2009). Genetic identity and relationships of Iranian apple (Malus x domestica Borkh) cultivars and landraces, wild Malus species and representative old apple cultivars based on simple sequence repeat (SSR) marker analysis.Genet. Resour. Crop Evol.56829–842. 10.1007/s10722-008-9404-0
29
GianfranceschiL.SegliasN.TarchiniR.KomjancM.GesslerC. (1998). Simple sequence repeats for the genetic analysis of apple.Theor. Appl. Genet.961069–1076. 10.1007/s001220050841
30
GoulãoL.OliveiraC. M. (2001). Molecular characterisation of cultivars of apple (Malus × domestica Borkh.) using microsatellite (SSR and ISSR) markers.Euphytica12281–89. 10.1023/A:1012691814643
31
GrossB. L.HenkA. D.RichardsC. M.FazioG.VolkG. M. (2014). Genetic diversity in Malus × domestica (Rosaceae) through time in response to domestication.Am. J. Bot.1011770–1779. 10.3732/ajb.1400297
32
GrossB. L.VolkG. M.RichardsC. M.ForslineC. L.FazioG.ChaoC. T. (2012). Identification of “duplicate” accessions within the USDA-ARS national plant germplasm system Malus collection.J. Am. Soc. Hortic. Sci.137333–342.
33
GuilfordP.PrakashS.ZhuJ. M.RikkerinkE.GardinerS.BassettH.et al (1997). Microsatellites in Malus domestica (apple) abundance, polymorphism and cultivar identification.Theor. Appl. Genet.94249–254. 10.1007/s001220050407
34
GygaxM.GianfranceschiL.LiebhardR.KellerhalsM.GesslerC.PatocchiA. (2004). Molecular markers linked to the apple scab resistance gene Vbj derived from Malus baccata jackii.Theor. Appl. Genet.1091702–1709. 10.1007/s00122-004-1803-9
35
HammerK.ArrowsmithN.GladisT. (2003). Agrobiodiversity with emphasis on plant genetic resources.Naturwissenschaften90241–250. 10.1007/s00114-003-0433-4
36
HammerØHarperD. A. T.RyanP. D. (2001). Past: Paleontological Statistics Software Package for Education and Data Analysis.Available at: http://palaeo-electronica.org/2001_1/past/issue1_01.htm
37
HanY.KorbanS. S. (2008). An overview of the apple genome through BAC end sequence analysis.Plant Mol. Biol.67581–588. 10.1007/s11103-008-9321-9
38
HardyO. J.VekemansX. (2002). SPAGeDi: a versatile computer program to analyse spatial genetic structure at the individual or population levels.Mol. Ecol. Notes2618–620. 10.1046/j.1471-8286.2002.00305.x
39
HarrisS. A.RobinsonJ. P.JuniperB. E. (2002). Genetic clues to the origin of the apple.Trends Genet.18426–430. 10.1016/S0168-9525(02)02689-6
40
HolleleyC. E.GeertsP. G. (2009). Multiplex Manager 1.0: a cross-platform computer program that plans and optimizes multiplex PCR.Biotechniques46511–517. 10.2144/000113156
41
KenisK.KeulemansJ.DaveyM. W. (2008). Identification and stability of QTLs for fruit quality traits in apple.Tree Genet. Genomes4647–661. 10.1007/s11295-008-0140-6
42
KitaharaK.MatsumotoS.YamamotoT.SoejimaJ.KimuraT.KomatsuH.et al (2005). Parent identification of eight apple cultivars by S-RNase analysis and simple sequence repeat markers.HortScience40314–317.
43
KloostermanA. D.BudowleB.DaselaarP. (1993). PCR-amplification and detection of the human D1S80 VNTR locus.Int. J. Legal Med.105257–264. 10.1007/BF01370382
44
KunihisaM.MoriyaS.AbeK.OkadaK.HajiT.HayashiT.et al (2014). Identification of QTLs for fruit quality traits in Japanese apples: QTLs for early ripening are tightly related to preharvest fruit drop.Breed. Sci.64240–251. 10.1270/jsbbs.64.240
45
LassoisL.DenancéC.RavonE.GuyaderA.GuisnelR.Hibrand-Saint-OyantL.et al (2016). Genetic diversity, population structure, parentage analysis, and construction of core collections in the French apple germplasm based on SSR markers.Plant Mol. Biol. Rep.34827–844. 10.1007/s11105-015-0966-7
46
LiangW.DondiniL.De FranceschiP.ParisR.SansaviniS.TartariniS. (2015). Genetic diversity, population structure and construction of a core collection of apple cultivars from Italian germplasm.Plant Mol. Biol. Rep.33458–473. 10.1007/s11105-014-0754-9
47
LiebhardR.GianfranceschiL.KollerB.RyderC. D.TarchiniR.Van De WegE.et al (2002). Development and characterisation of 140 new microsatellites in apple (Malus x domestica Borkh.).Mol. Breed.10217–241. 10.1023/A:1020525906332
48
LiebhardR.KollerB.GianfranceschiL.GesslerC. (2003). Creating a saturated reference map for the apple (Malus × domestica Borkh.) genome.Theor. Appl. Genet.1061497–1508. 10.1007/s00122-003-1209-0
49
LiuZ.BaoD.LiuD.ZhangY.AshrafM. A.ChenX. (2016). Construction of a genetic linkage map and QTL analysis of fruit-related traits in an F1 Red Fuji × Hongrou apple hybrid.Open Life Sci.11487–497. 10.1515/biol-2016-0063
50
LonginelliA.SelmoE. (2003). Isotopic composition of precipitation in Italy: a first overall map.J. Hydrol.27075–88. 10.1016/S0022-1694(02)00281-0
51
MaliepaardC.AlstonF. H.van ArkelG.BrownL. M.ChevreauE.DunemannF.et al (1998). Aligning male and female linkage maps of apple (Malus pumila Mill.) using multi-allelic markers.Theor. Appl. Genet.9760–73. 10.1007/s001220050867
52
MeagherT. R.ThompsonE. (1986). The relationship between single parent and parent pair genetic likelihoods in genealogy reconstruction.Theor. Popul. Biol.2987–106. 10.1016/0040-5809(86)90006-7
53
MeirmansP.Van TienderenP. (2004). Genotype and GenoDive: two programs for the analysis of genetic diversity of asexual organisms.Mol. Ecol. Notes4792–794. 10.1111/j.1471-8286.2004.00770.x
54
MichalakisY.ExcoffierL. (1996). A generic estimation of population subdivision using distances between alleles with special reference for microsatellite loci.Genetics1421061–1064.
55
MirandaC.UrrestarazuJ.SantestebanL. G.RoyoJ. B. (2010). Genetic diversity and structure in a collection of ancient Spanish pear cultivars assessed by microsatellite markers.J. Am. Soc. Hortic. Sci.135428–437.
56
MolonG. (1901). Pomologia.Milan: Hoepli.
57
MoriyaS.IwanamiH.YamamotoT.AbeK. (2011). A practical method for apple cultivar identification and parent-offspring analysis using simple sequence repeat markers.Euphytica177135–150. 10.1007/s10681-010-0295-8
58
MousaviS.MariottiR.RegniL.NasiniL.BufacchiM.PandolfiS.et al (2017). The first molecular identification of an olive collection applying standard simple sequence repeats and novel expressed sequence tag markers.Front. Plant Sci.8:1283. 10.3389/fpls.2017.01283
59
NeiM. (1978). Estimation of average heterozygosity and genetic distance from a small number of individuals.Genetics89583–590.
60
NoitonD. A. M.AlspachP. A. (1996). Founding clones, inbreeding, coancestry, and status number of modern apple cultivars.J. Am. Soc. Hortic. Sci.121773–782.
61
PasqualeG. A. (1876). Manuale di Arboricoltura da Servire pe’ Proprietarii, Agricoltori, Orticoltori, Ingegneri, ecc.Charleston, SC: Nabu Press.
62
PatzakJ.PapršteinF.HenychováA.SedlákJ. (2012). Comparison of genetic diversity structure analyses of SSR molecular marker data within apple (Malus × domestica) genetic resources.Genome551–19. 10.1139/g2012-054
63
Pereira-LorenzoS.Ramos-CabrerA. M.Dıaz-HernandezM. B. (2007). Evaluation of genetic identity and variation of local apple cultivars (Malus domestica Borkh.) from Spain using microsatellite markers.Genet. Resour. Crop Evol.54405–420. 10.1007/s10722-006-0003-7
64
Pereira-LorenzoS.Ramos-CabrerA. M.Gonzalez-DiazA. J.Diaz-HernandezM. B. (2008). Genetic assessment of local apple cultivars from La Palma Spain, using simple sequence repeats (SSRs).Sci. Hortic.117160–166. 10.1016/j.scienta.2008.03.033
65
Pereira-LorenzoS.UrrestarazuJ.Ramos-CabrerA. M.MirandaC.PinaA.DapenaE. (2017). Analysis of the genetic diversity and structure of the Spanish apple genetic resources suggests the existence of an Iberian genepool.Ann. Appl. Biol.171424–440. 10.1111/aab.12385
66
Pérez-RomeroL. F.SuárezM. P.DapenaE.RalloP. (2015). Molecular and morphological characterization of local apple cultivars in Southern Spain.Genet. Mol. Res.141487–1501. 10.4238/2015.February.20.4
67
PineauB.BarbeJ. C.Van LeeuwenC.DubourdieuD. (2007). Which impact for β-damascenone on red wines aroma?J. Agric. Food Chem.554103–4108. 10.1021/jf070120r
68
PlottoA.McDanielM. R. (2000). Characterization of changes in ‘Gala’ apple aroma during storage using osme analysis, a gas chromatography-olfactometry technique.J. Am. Soc. Hortic. Sci.125714–722.
69
PritchardJ. K.StephensM.DonnellyP. (2000). Inference of population structure using multilocus genotype data.Genetics155945–959.
70
Ramos-CabrerA. M.Pereira-LorenzoS.Diaz-HernandezM. B. (2007). Morphology and microsatellites in Spanish apple collections.J. Hortic. Sci. Biotechnol.82257–265. 10.1080/14620316.2007.11512227
71
Silfverberg-DilworthE.BesseS.ParisR.BelfantiE.TartariniS.SansaviniS.et al (2005). Identification of functional apple scab resistance gene promoters.Theor. Appl. Genet.1101119–1126. 10.1007/s00122-005-1940-9
72
Silfverberg-DilworthE.MatasciC.Van de WegW.Van KaauwenM.WalserM.KoddeL.et al (2006). Microsatellite markers spanning the apple (Malus × domestica Borkh.) genome.Tree Genet. Genomes2202–224. 10.1007/s11295-006-0045-1
73
SunR.LiH.ZhangQ.ChenD.YangF.ZhaoY.et al (2014). Mapping for Quantitative Trait Loci and major genes associated with fresh-cut browning in apple.HortScience4925–30.
74
TamaroD. (1929). Frutta di Grande Reddito.Milan: Hoepli.
75
ToniniS. (1930). Aumentiamo la Produzione Delle Vecchie Piante da Frutto in Provincia di Perugia. Cattedra Ambulante di Agricoltura.Perugia: Santucci ed.
76
UrrestarazuJ.DenancéC.MirandaC.RavonE.GuyaderA.GuisnelR.et al (2016). Analysis of the genetic diversity and structure across a wide range of germplasm reveals prominent gene flow in apple at the European level.BMC Plant Biol.16:130. 10.1186/s12870-016-0818-0
77
UrrestarazuJ.MirandaC.SantestebanL. G.RoyoB. (2012). Genetic diversity and structure of local apple cultivars from Northeastern Spain assessed by micro satellite markers.Tree Genet. Genomes81163–1180. 10.1007/s11295-012-0502-y
78
Van OosterhoutC.HutchinsonW. F.WillsD. P. M.ShipleyP. (2004). Micro-Checker: software for identifying and correcting genotyping errors in microsatellite data.Mol. Ecol. Notes4535–538. 10.1111/j.1471-8286.2004.00684.x
79
van TreurenR.KempH.ErnstingG.JongejansB.HoutmanH.VisserL. (2010). Microsatellite genotyping of apple (Malus × domestica Borkh.) genetic resources in the Netherlands: application in collection management and variety identification.Genet. Resour. Crop Evol.57853–865. 10.1007/s10722-009-9525-0
80
VanderzandeS.MichelettiD.TroggioM.DaveyM. W.KeulemansJ. (2017). Genetic diversity, population structure, and linkage disequilibrium of elite and local apple accessions from Belgium using the IRSC array.Tree Genet. Genomes13:125. 10.1007/s11295-017-1206-0
81
VavilovN. I. (1926). Centry Proischozdenija Kul’turnych Rastenij (On the origin of cultivated plants).Mainz: Gutenberg.
82
VelascoR.ZharkikhA.AffourtitJ.DhingraA.CestaroA.KalyanaramanA.et al (2010). The genome of the domesticated apple (Malus × domestica Borkh.).Nat. Genet.42833–841. 10.1038/ng.654
83
VinatzerB. A.PatocchiA.TartariniS.GianfranceschiL.SansaviniS.GesslerC. (2004). Isolation of two microsatellite markers from BAC clones of the Vf scab resistance region and molecular characterization of scab-resistant accessions in Malus germplasm.Plant Breed.123321–326. 10.1111/j.1439-0523.2004.00973.x
84
VisserT.VerhaeghJ. J. (1978). Inheritance and selection of some fruit characters of apple. I. Inheritance of low and high acidity.Euphytica27753–760. 10.1007/BF00023711
85
WaitsL. P.LuikartG.TaberletP. (2001). Estimating the probability of identity among genotypes in natural populations: cautions and guidelines.Mol. Ecol.10249–256. 10.1046/j.1365-294X.2001.01185.x
86
WAPA (2017). Crop Forecast.Available at: http://www.wapa-association.org/asp/page_1.asp?doc_id=447
87
WardJ. H. (1963). Hierarchical grouping to optimize an objective function.J. Am. Stat. Assoc.58236–244. 10.1080/01621459.1963.10500845
88
WeirB. S.CockerhamC. C. (1984). Estimating F-statistics for the analysis of population structure.Evolution381358–1370. 10.2307/2408641
89
WrightS. (1978). Variability Within and Among Natural Populations in Evolution and the Genetics of PopulationsVol. 4Chicago, IL: University of Chicago Press.
90
WuJ.GaoH.ZhaoL.LiaoX.ChenF.WangZ.et al (2007). Chemical compositional characterization of some apple cultivars.Food Chem.10388–93. 10.1016/j.foodchem.2006.07.030
91
XuK.WangA.BrownS. (2012). Genetic characterization of the Ma locus with pH and titratable acidity in apple.Mol. Breed.30899–912. 10.1007/s11032-011-9674-7
92
YunW. H.BanS. H.KimG. H.KimJ.-H.KwonS. I.ChoiC. (2015). Assessment of apple core collections constructed using phenotypic and genotypic data.Genet. Mol. Res.146453–6464. 10.4238/2015.June.11.21
93
ZhangP.LiJ.LiX.LiuX.ZhaoX.LuY. (2011). Population structure and genetic diversity in a rice core collection (Oryza sativa L.) investigated with SSR markers.PLoS One6:e27565. 10.1371/journal.pone.0027565
94
ZhangY.LiP.ChengL. (2010). Developmental changes of carbohydrates, organic acids, amino acids, and phenolic compounds in ‘Honeycrisp’ apple flesh.Food Chem.1231013–1018. 10.1016/j.foodchem.2010.05.053
Summary
Keywords
Malus × domestica, SSR markers, local varieties, genetic resources, germplasm collection
Citation
Marconi G, Ferradini N, Russi L, Concezzi L, Veronesi F and Albertini E (2018) Genetic Characterization of the Apple Germplasm Collection in Central Italy: The Value of Local Varieties. Front. Plant Sci. 9:1460. doi: 10.3389/fpls.2018.01460
Received
02 July 2018
Accepted
12 September 2018
Published
10 October 2018
Volume
9 - 2018
Edited by
Spyridon Alexandros Petropoulos, University of Thessaly, Greece
Reviewed by
Aureliano Bombarely, Virginia Tech, United States; Gerhard Buck-Sorlin, Agrocampus Ouest, France; Nicolò Cultrera, Istituto di Bioscienze e Biorisorse (IBBR), Italy
Updates
Copyright
© 2018 Marconi, Ferradini, Russi, Concezzi, Veronesi and Albertini.
This is an open-access article distributed under the terms of the Creative Commons Attribution License (CC BY). The use, distribution or reproduction in other forums is permitted, provided the original author(s) and the copyright owner(s) are credited and that the original publication in this journal is cited, in accordance with accepted academic practice. No use, distribution or reproduction is permitted which does not comply with these terms.
*Correspondence: Emidio Albertini, emidio.albertini@unipg.it
†These authors have contributed equally to this work as first authors
This article was submitted to Crop and Product Physiology, a section of the journal Frontiers in Plant Science
Disclaimer
All claims expressed in this article are solely those of the authors and do not necessarily represent those of their affiliated organizations, or those of the publisher, the editors and the reviewers. Any product that may be evaluated in this article or claim that may be made by its manufacturer is not guaranteed or endorsed by the publisher.