 Sarah D. Turner1
 Shelby L. Ellison2
 Douglas A. Senalik2
 Philipp W. Simon1,2
 Edgar P. Spalding3*
 Nathan D. Miller3
- 1Department of Horticulture, University of Wisconsin–Madison, Madison, WI, United States
- 2Vegetable Crops Research Unit, United States Department of Agriculture–Agricultural Research Service, Madison, WI, United States
- 3Department of Botany, University of Wisconsin–Madison, Madison, WI, United States
Carrot is a globally important crop, yet efficient and accurate methods for quantifying its most important agronomic traits are lacking. To address this problem, we developed an automated image analysis platform that extracts components of size and shape for carrot shoots and roots, which are necessary to advance carrot breeding and genetics. This method reliably measured variation in shoot size and shape, petiole number, petiole length, and petiole width as evidenced by high correlations with hundreds of manual measurements. Similarly, root length and biomass were accurately measured from the images. This platform also quantified shoot and root shapes in terms of principal components, which do not have traditional, manually measurable equivalents. We applied the pipeline in a study of a six-parent diallel population and an F2 mapping population consisting of 316 individuals. We found high levels of repeatability within a growing environment, with low to moderate repeatability across environments. We also observed co-localization of quantitative trait loci for shoot and root characteristics on chromosomes 1, 2, and 7, suggesting these traits are controlled by genetic linkage and/or pleiotropy. By increasing the number of individuals and phenotypes that can be reliably quantified, the development of a rapid, automated image analysis pipeline to measure carrot shoot and root morphology will expand the scope and scale of breeding and genetic studies.
Introduction
Carrot is a globally important crop that originated in Central Asia (Vavilov, 1992; Iorizzo et al., 2013) with a secondary center of diversity in Asia Minor (Banga, 1957). A hallmark of carrot domestication is the capacity to develop a thickened storage root (Macko-Podgórni et al., 2017). Selective breeding has since improved taproot size, shape, and uniformity, resulting in forms that have served as the primary delimiter of variety classification since the 1600s (Simon et al., 2008). By comparison, carrot shoots have received much less attention despite the practical limitation of poor weed competitive ability during the seedling stage, with successful crop establishment often requiring intensive herbicide application and hand weeding (Bellinder et al., 1997; Bell et al., 2000; Swanton et al., 2010; Colquhoun et al., 2017), or the fact that the petioles must be sufficiently strong for the root to be mechanically harvested (Rogers and Stevenson, 2006). Currently, a primary breeding objective is to achieve rapidly growing, sturdy shoots without compromising the size and shape of the storage root. Therefore, methods to measure both shoots and roots more objectively are required (Horgan, 2001). These methods should be quantitative and objective, replacing traditional subjective descriptors such as circular, obovate, obtriangular, and narrow oblong to describe global root shape, or blunt, slightly pointed, and strongly pointed to describe the distal end (or tip) of the storage root. Similarly, methods should characterize shoot architecture more comprehensively than typical measurements of plant height, width, and biomass.
Image analysis has proven useful in describing several crop shoot systems while growing in controlled environments, during the field season, and after harvest (Furbank and Tester, 2011; Lobet et al., 2013; Fahlgren et al., 2015). Notably, a similar approach to characterizing carrot shoots must accommodate some special issues. In contrast to many crops, carrots do not produce a shoot structure by erecting a typical stem axis with leaves. Instead, an apical meristem at or beneath the soil produces leaves attached by petioles to internodes that do not elongate during the vegetative phase of the crop cycle. The petiole of each leaf, not the internode, elongates at an angle to lift and spread the leaf blade. Thus, the cluster of petioles attached to the crown of the root is a major architectural feature of the shoot structure that a phenotyping method must capture.
In addition to attributes of individual plant parts, allocation of resources between the shoot and root of plants plays a central role in crop fitness and improvement (Lynch, 2007; Poorter et al., 2012). Thus, a phenotyping platform for a root crop such as carrot should measure both shoot and root traits. For instance, what may appear to be a practically helpful change in shoot architecture could negatively impact light interception and therefore photosynthesis (Falster and Westoby, 2003), while altered root structure could influence fibrous root architecture, which plays a critical role in water and nutrient acquisition (Lynch, 1995; York et al., 2013). The evidence of pleiotropic relationships between root and shoot phenotypes in Arabidopsis (Bouteillé et al., 2012), maize (Ruta et al., 2010; Dignat et al., 2013), barley (Naz et al., 2014), soybean (Manavalan et al., 2015), rice (Li et al., 2009), and lentil (Idrissi et al., 2016) is yet another motivation to build a comprehensive root and shoot phenotyping platform for carrot.
Any improved methods for measuring shoot and root phenotypes in carrot would be useful in studies designed to identify genetic loci that control these traits. To date, the majority of genetic studies in carrot have focused on storage root pigmentation, specifically anthocyanin content (Yildiz et al., 2013; Cavagnaro et al., 2014) and carotenoid accumulation (Buishand and Gabelman, 1979; Bradeen and Simon, 1998; Just et al., 2007, 2009; Iorizzo et al., 2016; Ellison et al., 2017). More recently, two potential domestication loci that influence carrot morphology were identified on chromosome 2 for early flowering (Vrn1; Alessandro et al., 2013) and storage root development (DcAHLc1, Macko-Podgórni et al., 2014, 2017). Additionally, the observation of a linear relationship between the logarithms of shoot biomass and storage root biomass in carrot (Hole et al., 1983; Turner et al., 2018) suggests potential genetic relationships, but the causal genetic loci, the extent of polygenic control, and the influence of pleiotropy on shoot and root architecture in carrot have not yet been investigated.
For the reasons outlined above, carrot breeders are interested to measure carrot root and shoot morphologies, preferably more objectively (Horgan, 2001). More precise and objective data on the traits of interest will increase the ability to leverage genomic data and the potential for genetic gain in breeding projects. Current limitations include the inability to measure some traits of interest and the labor cost to collect hand measurements. These bottlenecks can be addressed using automated image analysis (Furbank and Tester, 2011; Fahlgren et al., 2015). Moreover, increasing precision and sample size through automated image analysis will support practical breeding efforts by decreasing experimental error, thereby improving estimates of heritability, facilitating the detection of causative genetic loci, and expanding our understanding of quantitative inheritance (Kuijken et al., 2015).
Here, we describe a relatively simple and low cost method to acquire 2D images of whole, excavated carrot plants. This is coupled with a set of custom computer algorithms that quantify shoot architectural features as well as the size and shape of storage roots. The entire pipeline is shown to detect meaningful variation for traits of interest in two commonly used experimental populations of carrot: a six-parent diallel mating design (Turner et al., 2018) and an F2 mapping population exhibiting segregation for root shape and shoot architecture. To further demonstrate the utility of this phenotyping method for genetic studies in carrot, we also applied multiple quantitative trait loci (QTL) mapping (MQM) to hand and image measured data from the F2 population. This pipeline, coupled with the availability of a carrot genome (Iorizzo et al., 2016) and the accessibility of high-throughput genotyping resources, will enable further insight into the underlying genetics of complex shoot and root traits in carrot.
Materials and Methods
Plant Materials and Experimental Design
Samples included individual plants from two sources: a diallel mating design with six diverse inbred parents and an F2 population that segregates for plant height, shoot biomass, and storage root shape. Seeds were sown on 1.5 m plots with 1 m spacing between rows. Carrots were harvested and stored at 1–2°C prior to imaging. Field sites included the Desert Research and Extension Center (Holtville, CA, United States) and the University of Wisconsin Hancock Agricultural Research Station (Hancock, WI, United States). Supplementary Figure S1 diagrams the sample size and sources of individuals used for imaging and QTL mapping, which are described briefly below.
Diallel progenies were grown in a randomized complete block design (RCBD) with two replicates in WI (2015) and CA (2016) (see Turner et al., 2018 for additional details). The F2 population, L8708 × Z020, was identified from prior field screening as segregating for plant height, shoot biomass, and root storage shape and color. This population was derived from a cross between L8708, an orange inbred line with a medium-long storage root and compact shoots, and Z020, a yellow, cultivated landrace from Uzbekistan with a short, blunt-tipped storage root and broad, prostrate leaves. A single F1 plant was selected from this cross and selfed to produce the F2 population used for mapping in this study. F2 plants were grown at the CA location in 2013 (n = 63) and 2016 (n = 450) and at the WI location in 2016 (n = 77). Additional F2 plants of the same cross, but derived from a different F1 plant, were also grown at CA in 2016 (n = 128) and were used only for validation of image measurements.
Manual Measurements
A total of 1,041 carrot plants were measured manually and photographed for the dual purpose of developing an automated phenotyping method and determining the genetic architecture of important traits. Hand measurements were recorded for shoot height (cm), root length (cm), petiole number, shoot biomass (g), and root biomass (g). Unless otherwise specified, the term ‘root’ will refer to the storage root in this report. Shoot height, measured as the distance from the crown to the tip of the longest leaf, was recorded in the field for three plants per plot of each diallel entry and after harvest for each F2 individual. Root length was measured as the distance from the crown to the tip of the storage root, defined here as having a diameter greater than 2 mm. Petiole number was recorded as the total number of fully expanded, true leaves. Shoot biomass was sampled by removing all shoot tissue more than 4 cm above the crown. For root biomass, fresh weight was recorded for the entire root and for a subsample, which was dried and extrapolated to estimate dry weight for the entire root. Fresh weights were recorded immediately for both shoot and root tissues. For dry shoot and root weights, samples were dried at 60°C in a forced-draft oven and values were recorded after reaching constant mass. Ground truth data for digital measurements of petiole length and diameter was recorded for a subset of 100 images using ImageJ (Schneider et al., 2012).
Image Acquisition and Preprocessing
Digital images were collected in tandem with hand measurements. The imaging set-up consisted of a 2.5 cm PVC frame (145 cm long × 100 cm wide × 136 cm tall) with a white, non-reflective baseboard and a Nikon D3300 DSLR camera mounted on a centered, overhead boom. The baseboard was divided into upper and lower halves by a black, horizontal line with a gap in the center where a carrot was positioned such that its shoot lay above the line and the root below it (Figure 1A, left). Arranging a plant on the baseboard involved some manual manipulation. The time to stage a given plant and acquire an image ranged from 1 to 2 min. A computer running custom gphoto2 scripts controlled the camera (Gage et al., 2017). All images were acquired in ambient light with an 18–55 mm lens set to 18 mm and positioned 85 cm above the baseboard. Carrot leaves were deliberately arranged to maximize the distance between individual leaves.
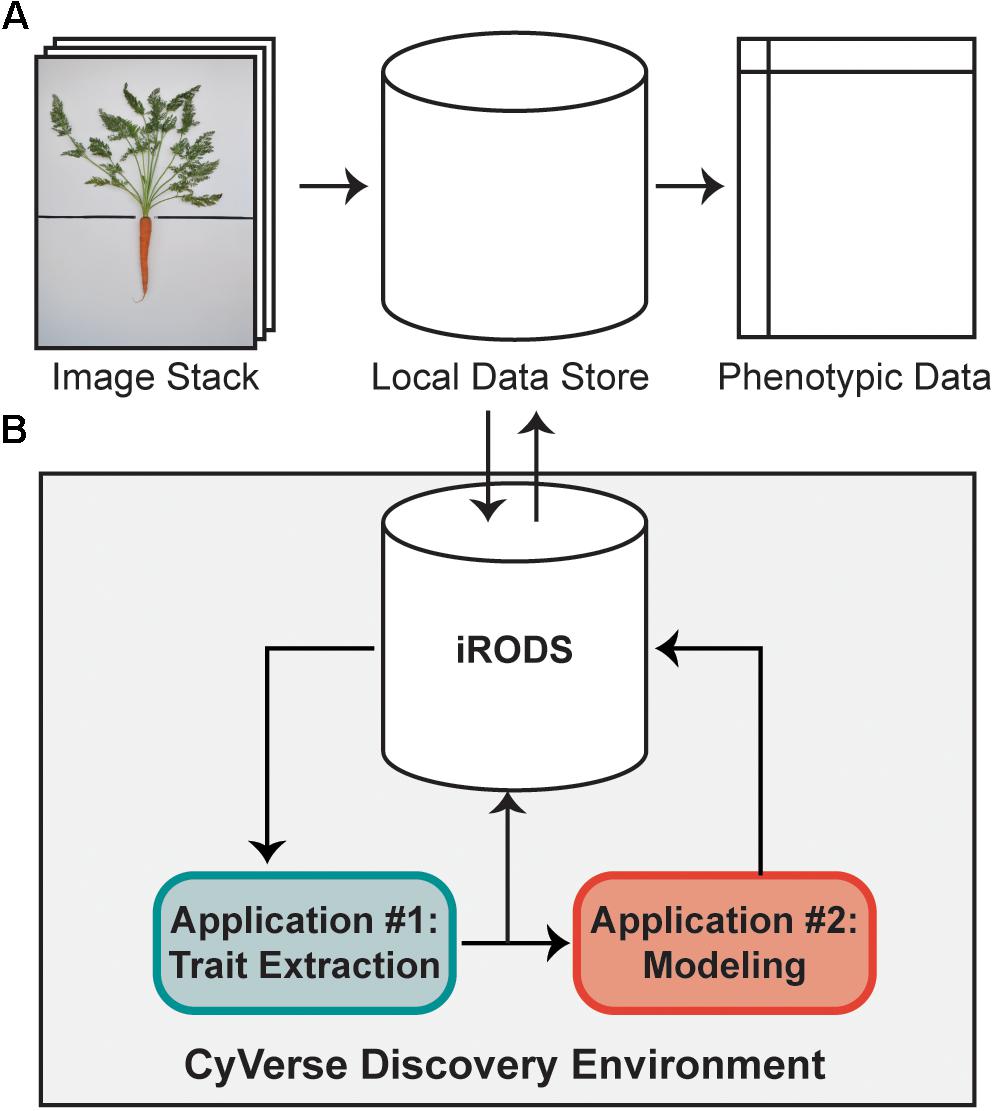
FIGURE 1. A high-throughput workflow to measure carrot morphology from images. (A) A user collects a stack of individual carrot images, which are uploaded from a local data store to the iRODS data system on CyVerse for trait extraction. Following image processing, quantitative data is returned to the user for downstream analyses. (B) Once uploaded to CyVerse, images are processed in the Discovery Environment using custom algorithms via a high-throughput computing (HTC) resource. The workflow is split into two applications: the first extracts traits which are directly measured from the image (e.g., area, bounding box, etc.), while the second uses a regression model built from a validation set of 100 ground-truth measurements to predict petiole number, petiole length, and petiole width.
Input files were raw Nikon Electronic File (NEF) images (dimensions 6000 × 4000 pixels) with uniform positioning of the carrot crown on the focal plane. As part of the computational workflow, raw NEF files were automatically converted to Tagged Image Format (TIF) files with a resolution of 129 dots per inch. These files served as the inputs for custom trait extraction algorithms written in the MATLAB 9.0 language (The MathWorks Inc., 2016). To separate the carrot plant from the background, the red–green–blue (RGB) images were converted to grayscale and to the hue-saturation-value (HSV) representation of color. The S channel was subtracted from the grayscale image and the Otsu threshold method was applied to produce a binary image (MASK) in which pixels belonging to the carrot object were white (1) and background pixels were black (0). Based on the location of the horizontal black line on the baseboard, images were automatically split into shoot and root sections for corresponding morphometric analyses.
Computational Workflow
As described by Miller et al. (2017), a high-throughput computational workflow was implemented using a community cyberinfrastructure, which is publicly available as a software tool through the CyVerse Discovery Environment web interface (Figure 1). Briefly, image files were uploaded to the integrated rule-oriented data store system (iRODS) (Rajasekar et al., 2010) managed by CyVerse (Merchant et al., 2016) (Figure 1). Each image was processed as a separate computational job using parallel computing enabled by the University of Wisconsin’s Center for High-Throughput Computing. Scheduling, resource matching, execution of analyses, and return of results were managed by the HTCondor software (Thain et al., 2005). Results were then returned to the data store holding the original images (Figure 1A). This workflow proceeded without any manual steps, returning the traits described below automatically in approximately 2 min per image.
Image Analysis
All images were processed through a two-stage workflow (Figure 1B) and data was returned as both individual CSV files for each measurement and as an indexable JavaScript Object Notation (JSON) file containing all measurements. For the shoot, root, and whole carrot masks, data output included classic image measurements of a bounding box (used to measure shoot height, root length, and root width), convex hull, eccentricity, equivalent diameter, Euler number, perimeter, and solidity. Measurements of interest included shoot and root biomass profiles, petiole width, petiole number, and petiole length, which are described in detail below. File names, measurements, and data structure are described in Supplementary Table S1.
Distribution of Shoot Biomass
Morphological features of the shoot were quantified from the portion of the binarized image that lay above the horizontal line marking the root–shoot junction. Each pixel in the plant mask has a value of 1 (white) and each pixel outside of the mask is black (value of 0). The diagram in Figure 2A demonstrates how an elliptical grid originating at the crown was used to create a shoot biomass profile (SBP). A running sum of each pixel value (integral) along each sweep (θ = −π to π) of the grid determined the amount of digital biomass (or shoot area) at each radius. The entire distribution of digital biomass (white pixels) is given by:
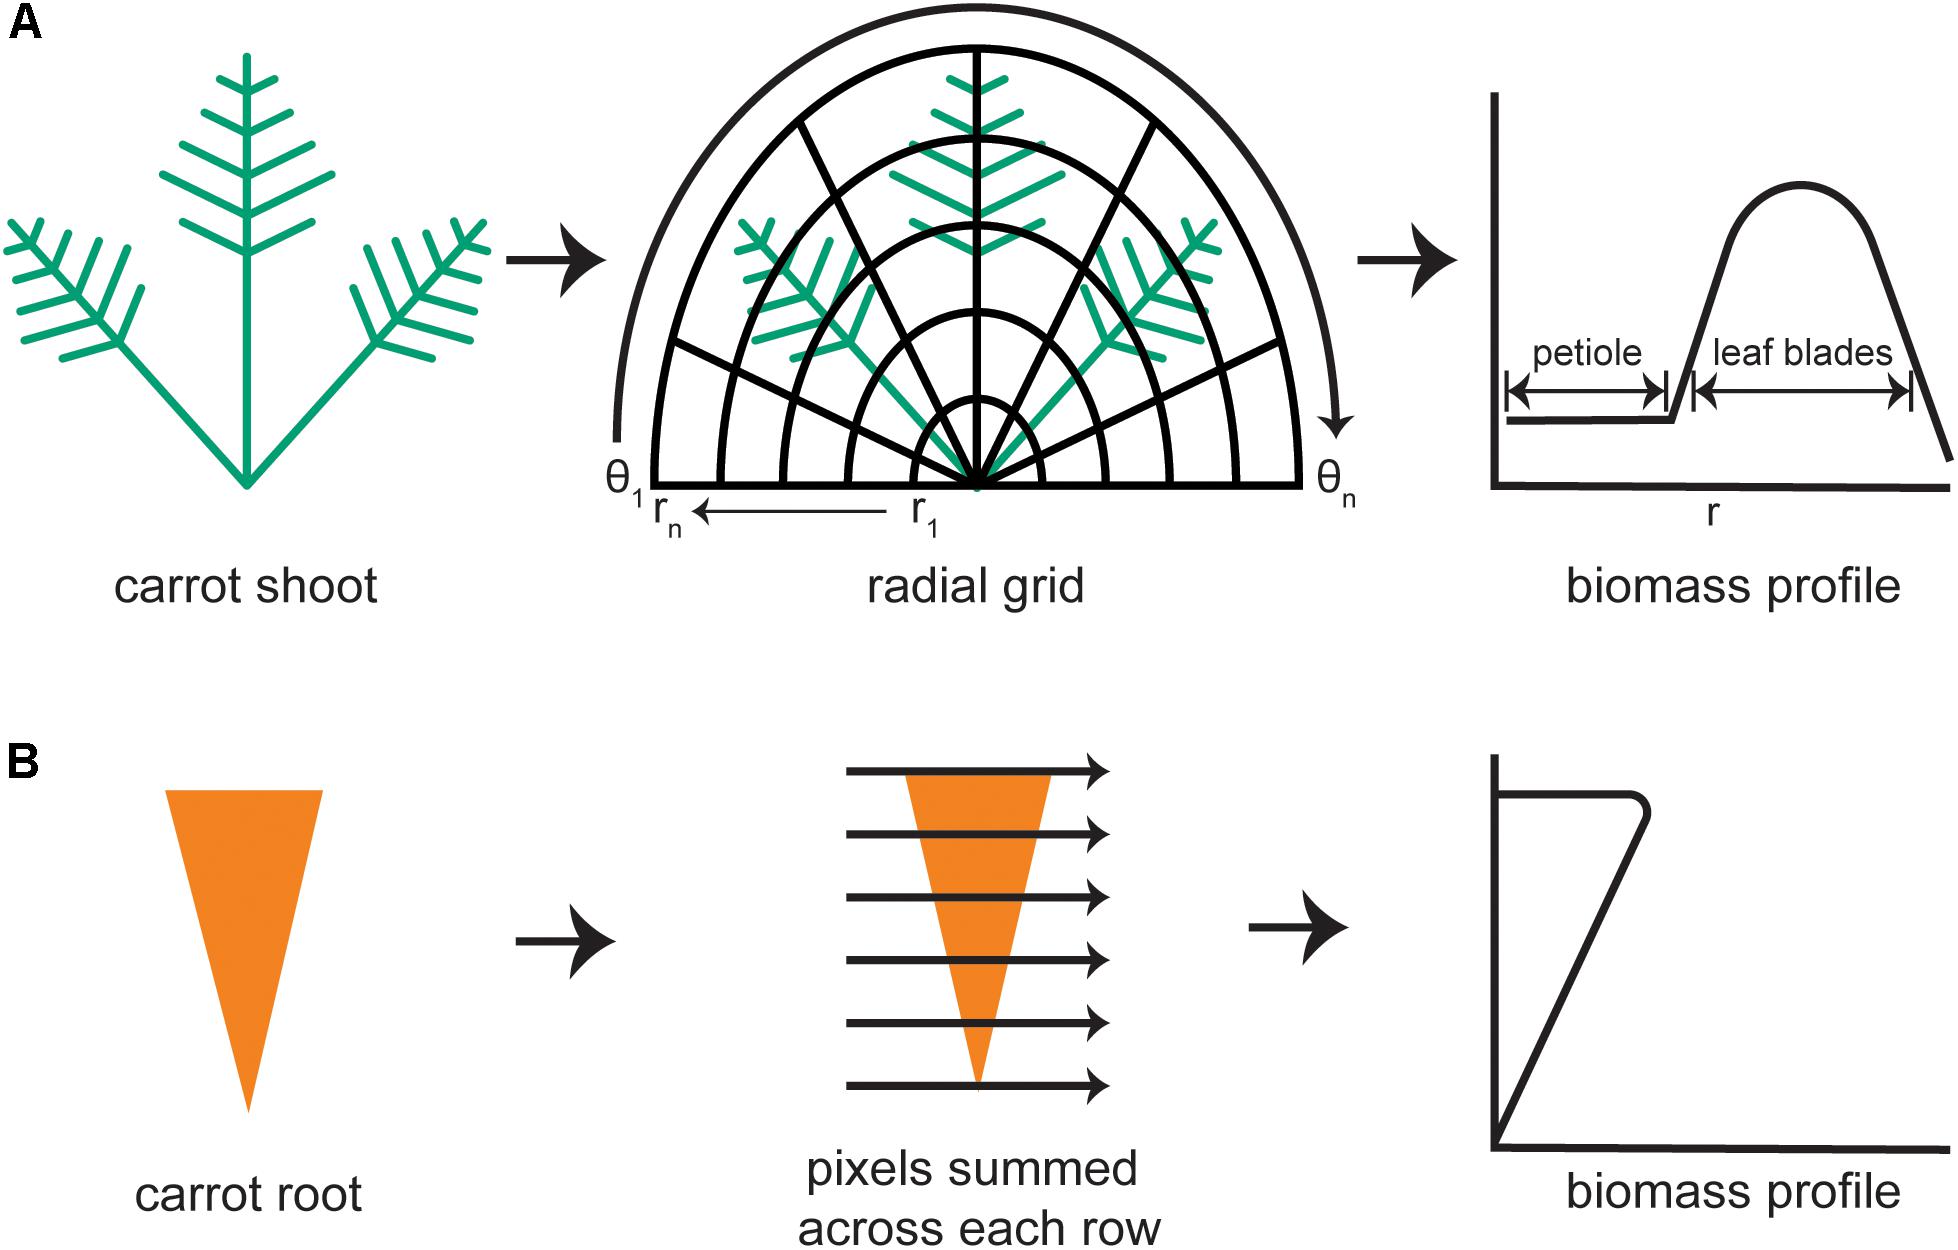
FIGURE 2. Steps to generate biomass profiles for the shoot and root of individual carrot plants. (A) An image mask of a carrot shoot is superimposed with half of an elliptical grid. Holding each radius (r) of the grid constant, the image mask is integrated along each angular sweep (θ) to produce a shoot biomass profile with defined regions belonging to the petioles and to the leaf blades. (B) For the carrot root mask, pixels are summed across each row to produce a root biomass profile.
At the lowest values of r, the SBP primarily reflects petiole material. The contribution of leaf blade material increases as r increases, then decreases at r values that exceed the plant mask, as shown in Figure 2A. The result was stored as an n-dimensional vector, where n is the number of points along the radius, i.e., the number of sweeps used to build the distribution. The default value of n is 1000. To document the fidelity of each analysis, the algorithm also generates an image of the binarized carrot shoot with overlays of the half elliptical grid and computed biomass profile. The SBP determined in this way formed the basis for subsequent shoot trait extraction methods.
Petiole Characteristics
To estimate petiole width, a Euclidean distance transformation (EDT) was applied over the entire binary shoot image. The EDT labels each pixel in the plant mask with a value equal to the distance to the nearest contour pixel. Next, the image was skeletonized. The EDT value at each skeleton point was sampled to produce a distribution of values corresponding to each pixel in the mask. This distribution was used as the input for the prediction step using partial least squares (PLS) regression (Wold, 1982; Wold et al., 1984) against the ground truth values from ImageJ. The number of components to retain in the PLS model was assessed using cross-validation with a one-fold holdout.
To predict the number of petioles in an image, the digital shoot biomass (i.e., the sum of white pixels in the binary shoot image) was divided by the algorithm-measured petiole width. This was performed for every image of a shoot. The resulting ratio of total mass divided by average petiole width value was the input for PLS regression against the true counts, which were collected by hand at the time the image was acquired. The number of components to retain in the PLS model was assessed using cross-validation with a one-fold holdout. The trained PLS model accurately predicted the actual petiole counts even in cases of moderate petiole overlap (see the Section “Results”).
To predict petiole length, the SBP was subjected to principal components analysis. The principal components extracted from the SBP and the ground truth values for petiole length, which were collected from 100 images in ImageJ, were used to train a two-layer feed forward neural network (Bhandarkar et al., 1996). The prediction step was also performed with PLS regression as was done for the petiole number. In this case, the neural network method provided higher correlations than PLS regression. Vectors for petiole counts, width, and length were returned to the data store for subsequent analyses.
Root Shape
A root biomass profile was generated by recording the number of white pixels along each horizontal sweep, which was returned as a 1000-dimensional vector (Figure 2B). To focus exclusively on shape differences, the root biomass profile was normalized by both length and width prior to principal components analysis, which was used to examine symmetrical shape variance. The binarized root image with the root outline in green was also returned to the data store for error checking.
Correlations and Repeatability
All downstream analyses were performed in R 3.3.2 (R Core Team, 2016). Pearson’s correlation coefficient (r) and Spearman’s rho (ρ) were used to compare manual- and image-measured traits. For manual-measured and digital biomass, correlations were estimated using a linear log–log relationship, following established guidelines for allometric models of biomass partitioning in carrot (Hole et al., 1983) and in seed plants (Enquist and Niklas, 2002). When possible, algorithm-measured values were converted from pixels to centimeters using reference points of known size on the baseboard.
Repeatability, which describes the proportion of trait variance attributable to differences among rather than within individuals, was calculated using observations for 336 individual plants representing 42 crosses from a six-parent diallel mating design. Variance components were assessed using the linear mixed-effects model, yijk = μ + Gi + Ej + Bk(j) + GEij + Rijk where yijk is the phenotype, Gi is the effect of genotype, Ej is the effect of environment, Bk(j) is the effect of replication k within environment j, GEij is the interaction between genotype i and environment j, and Rijk is the residual error. Repeatability was estimated on an entry-mean basis as , where t is the harmonic mean of test environments and r is the harmonic mean number of replications in each environment. Similarly, repeatability was calculated for each individual environment as . The significance of genotype, environment, and genotype by environment interaction (GxE) was evaluated using two-way ANOVA.
DNA Extraction and Quantification
Following image capture, a 1.5 g leaf sample (fresh weight) was collected from each F2 plant. Total genomic DNA was isolated from ∼20 mg of lyophilized leaf tissue using the CTAB method of Murray and Thompson (1980) with modifications by Boiteux et al. (1999). DNA quality was assessed visually using 1% agarose gel electrophoresis and double-stranded DNA was quantified using the Quant-iTTM PicoGreen® dsDNA assay kit (Life Technologies, Grand Island, NY, United States). Concentrations were normalized to 10 ng/μl.
Genotyping-by-Sequencing (GBS)
Genotyping-by-sequencing (GBS) was conducted following the protocol of Elshire et al. (2011) and as described for carrot (Arbizu et al., 2016; Iorizzo et al., 2016; Ellison et al., 2017). Library construction and sequencing were performed by the University of Wisconsin-Madison Biotechnology Center (WI, United States) using half-sized reactions. Genomic DNA was digested with ApeK1, barcoded, and pooled for sequencing with 85–95 pooled samples per Illumina HiSeq 2000 lane. Samples were sequenced using single end, 100 nt reads and v3 SBS reagents (Illumina, San Diego, CA, United States).
SNPs were called using the TASSEL-GBS pipeline version 5.2.31 (Bradbury et al., 2007; Glaubitz et al., 2014). Filtering was conducted in VCFtools version 0.1.14 (Danecek et al., 2011) with the following parameters: a minimum minor allele frequency of 0.1 and maximum missing data of 10% for both genotype and marker.
Genetic Map Construction
Linkage maps were constructed using the JoinMap 4.1 software (Van Ooijen, 2011). Markers and genotypes which deviated from expected segregation ratios based on a Chi-square test (P < 0.001) were excluded. All linkage groups were obtained at a LOD threshold greater than 10. The regression mapping algorithm was used with Kosambi’s mapping function to calculate the distance between markers (Kosambi, 1943). Linkage groups were achieved by aligning GBS sequences to the carrot genome (Iorizzo et al., 2016) and corresponded to nine chromosomes. After initial mapping, markers defined as having insufficient linkage were flipped to the opposite phase and remapped. Two rounds of the regression mapping algorithm were used to increase the number of loci incorporated into the map.
QTL Mapping
QTL analysis was conducted in R 3.3.2 (R Core Team, 2016) using the R/qtl package (Broman and Sen, 2009). Individuals included 316 F2 plants from the CA2016 environment. Genotype probabilities were calculated using a step value of one for the entire linkage map and an assumed genotyping error rate of 0.001. Missing genotype data was replaced with the most probable values using the Viterbi algorithm (method = ‘argmax’) in the ‘fill.geno’ function.
Multiple QTL mapping (MQM) (Jansen and Stam, 1994) was performed in R/qtl using the ‘mqmscan’ function with an additive model and cofactor significance set to 0.001 (Arends et al., 2010). Cofactors were set at a fixed marker interval of 5 cM. Following scripts developed by Moore et al. (2013), genome-wide LOD significance thresholds were determined for each phenotype using parallel computing on the Open Science Grid (OSG) (Pordes et al., 2007; Sfiligoi et al., 2009). Significance thresholds were based on 10,000 random permutations (Churchill and Doerge, 1994) with the assumed genotyping error rate set to 0.001 and α = 0.01. For each QTL, confidence intervals were determined using the 1.5 LOD drop off flanking the most significant peak of the QTL. The linkage map was plotted using R/LinkageMapView (Ouellette et al., 2018). Percent variance explained (PVE) was calculated using the formula PV E = 1 − , where n is the number of individuals (Broman and Sen, 2009). QTL were named using an abbreviation for the trait (e.g., ht, height) suffixed with the chromosome (1–9), and finally the serial number of QTLs on the chromosome (e.g., ht-2.1, ht-2.2).
Results
Image Analysis
For the 1,041 images submitted through the analysis pipeline, 917 (88%) ran successfully and returned data. Of the 124 images that failed, two were also missing hand measurements, eight had root defects such as sprangle (i.e., branching of the root), 60 had poor lighting or shadowing, eight overlapped with the edge of the image or the black line separating the shoot and root, and 46 failed for reasons which were not readily identifiable, with possible explanations including the presence of numerous fibrous roots, interference of labels, and/or diminutive plant size.
Correlations Between Hand and Algorithm Measurements
Overall, traits extracted automatically from images had strong and significant (P < 0.001) correlations with their manually measured analogs, ranging from r = 0.77 for petiole number to r = 0.93 for root biomass. Relationships among manual- and image-measured values for shoot height, shoot biomass, root length, and root biomass are detailed in Figure 3. Shoot height and root length each had correlations of r = 0.88 between manual and image measurements, with larger correlations observed for shoot biomass and shoot area (r = 0.91) and between root biomass and root area (r = 0.93). Notably, correlations ranged from low to moderate when comparing shoot to root attributes, such as shoot height and root length (r = 0.18), and the correlation between shoot and root biomass deviated from unity for both manual measurements (r = 0.72) and for algorithm values (r = 0.62).
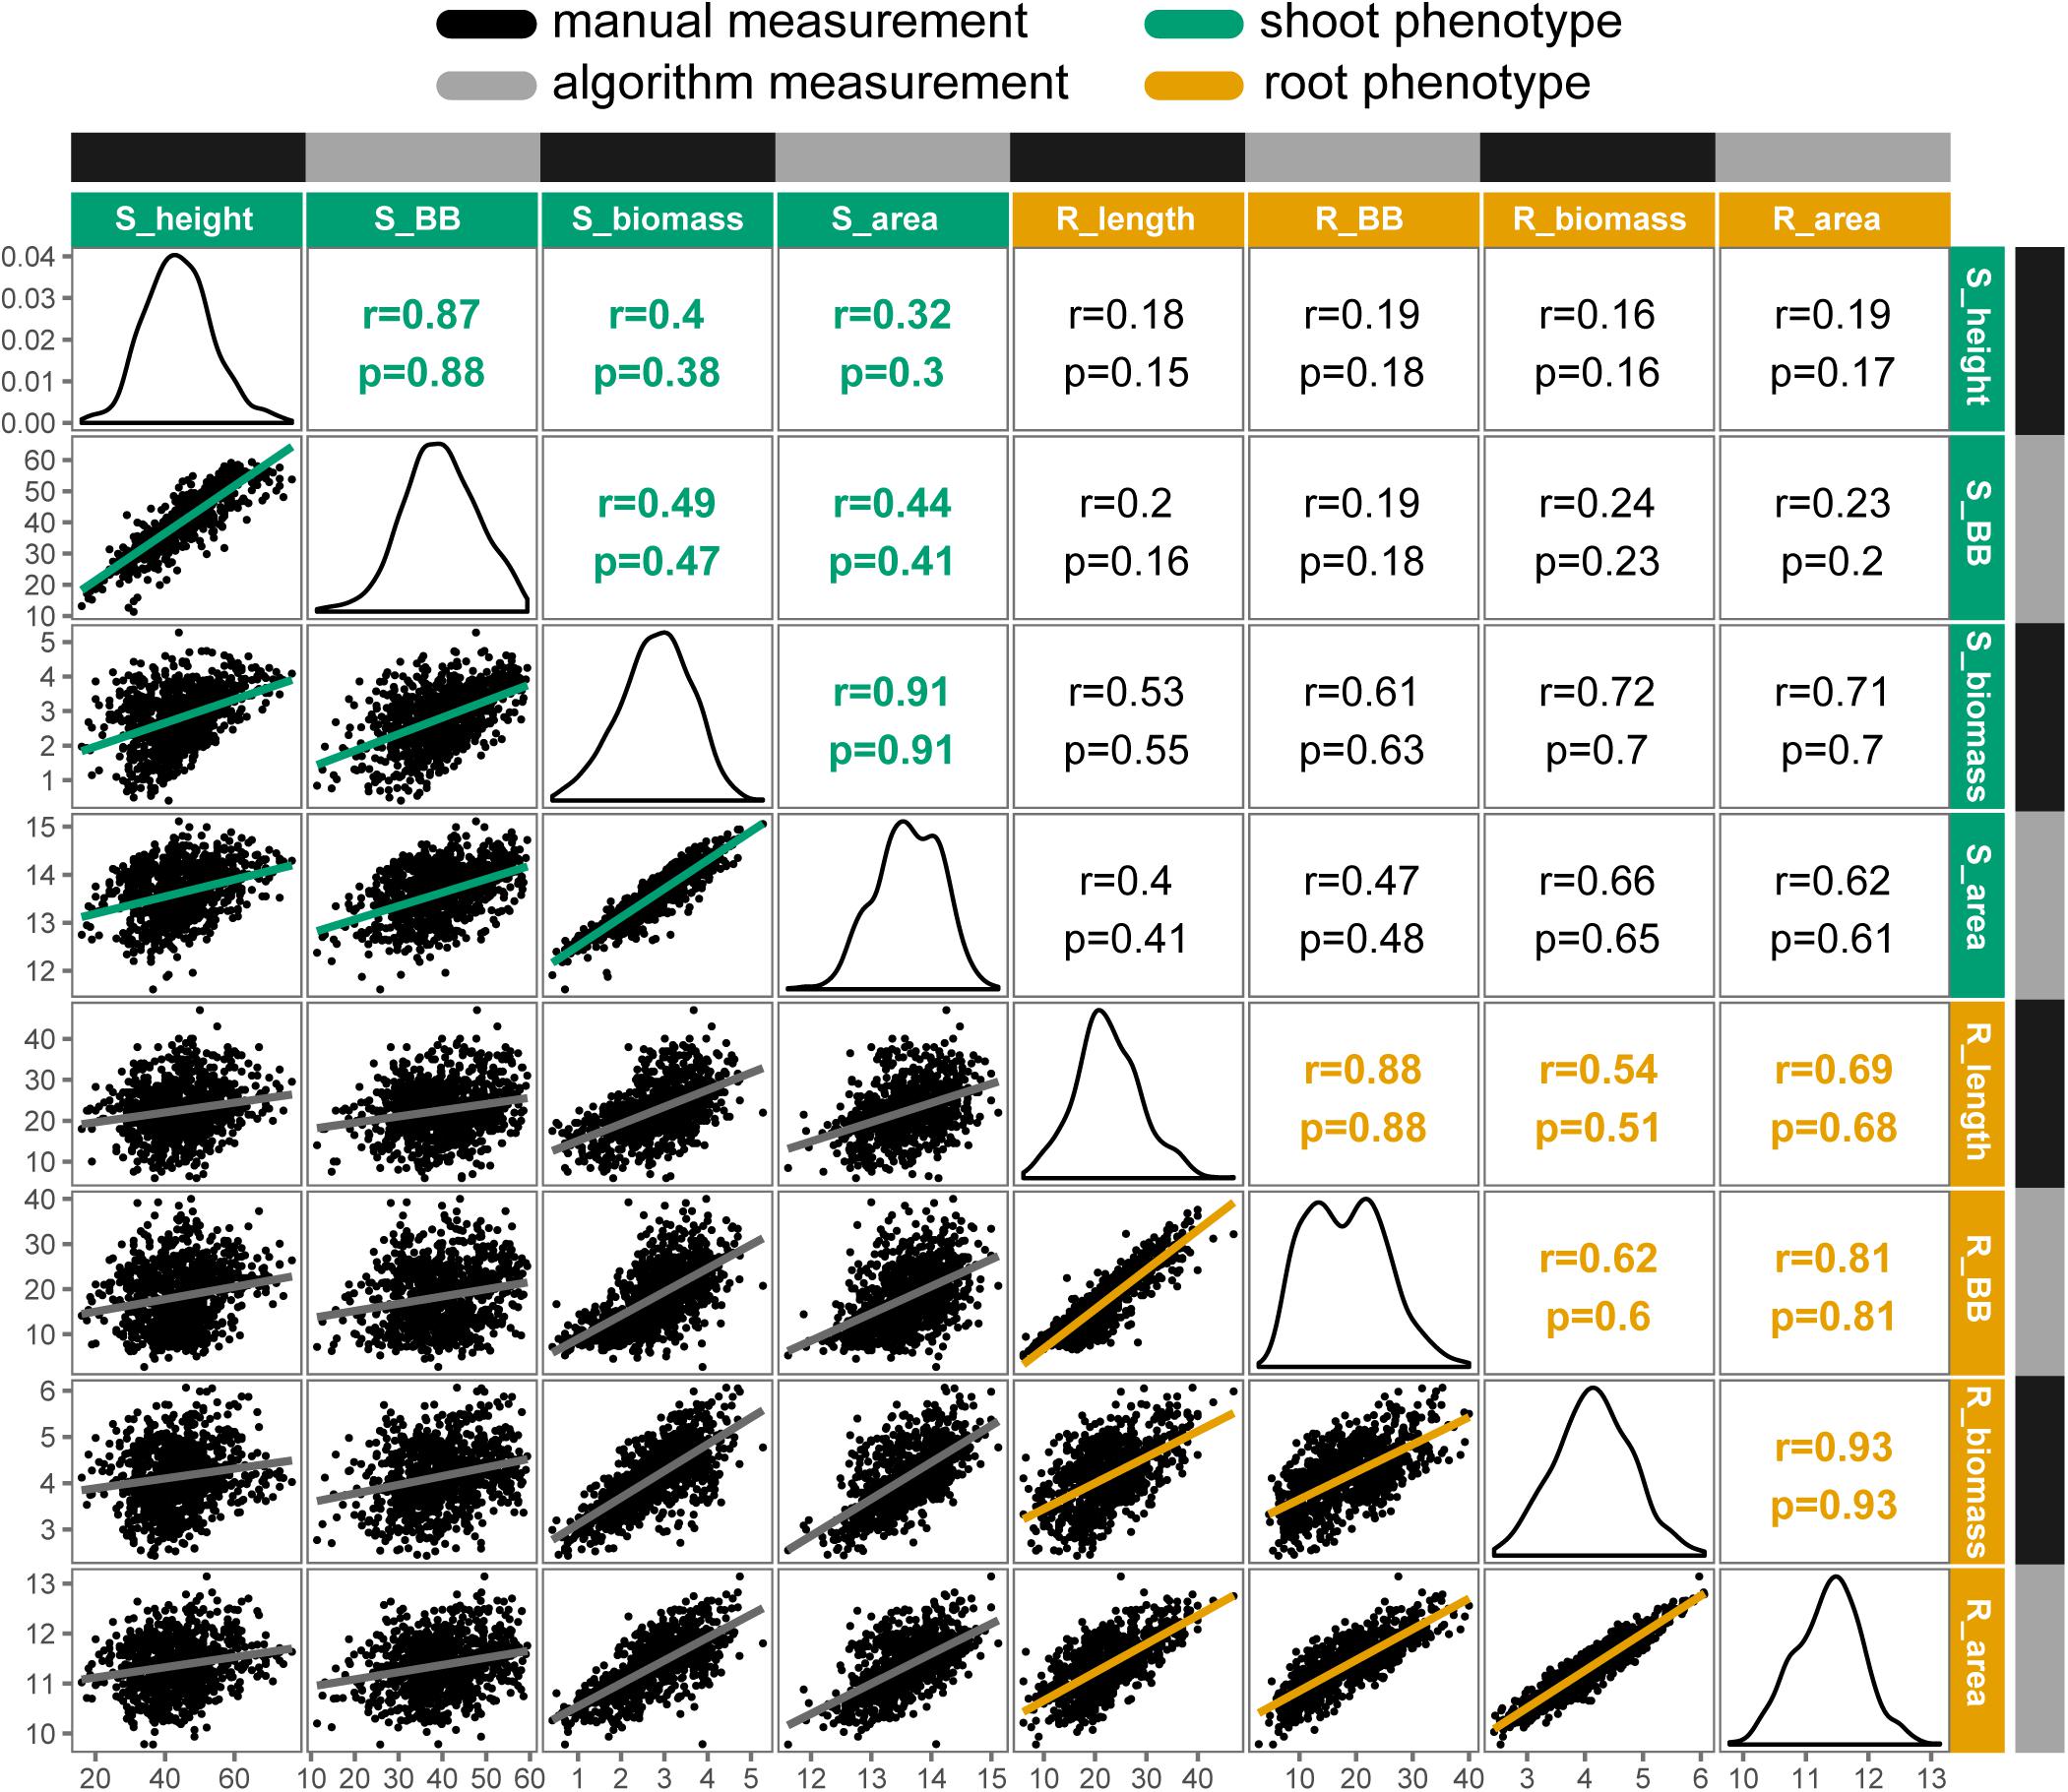
FIGURE 3. Correlation matrix of selected manual and algorithm measurements in carrot (n = 917 individuals). Trait distributions are on the diagonal, with Pearson’s correlation coefficients (r) and Spearman’s rho (ρ) displayed on the upper triangle and linear relationships on the lower triangle. All correlations were significant at P < 0.001. Trait key: S_height = shoot height (cm); S_BB = shoot bounding box height (cm); S_biomass = shoot biomass (g, fresh); S_area = digital shoot biomass (px); R_length = root length (cm); R_BB = root bounding box height (cm); R_biomass = root biomass (g, fresh); R_area = digital root biomass (px). Note that biomass traits are natural log transformed.
Similarly, Figure 4 presents the strong correlations between manual measurements and algorithm predictions for petiole attributes, with manual measurements of petiole length and width based on ground truth data from images. The highest correlation was observed for petiole length (n = 100, r = 0.90, ρ = 0.91), followed by petiole width (n = 100, r = 0.85, ρ = 0.86), and petiole number (n = 910, r = 0.77, ρ = 0.84). For petiole number, accuracy was noticeably reduced above 15 leaves, at which point it becomes difficult to predict individual petioles given some degree of overlap in a 2D image. Similarly, estimates may also be skewed for plants with dense, compact shoots. Correlations among all phenotypes, including additional measurements, are provided in Supplementary Figure S2.
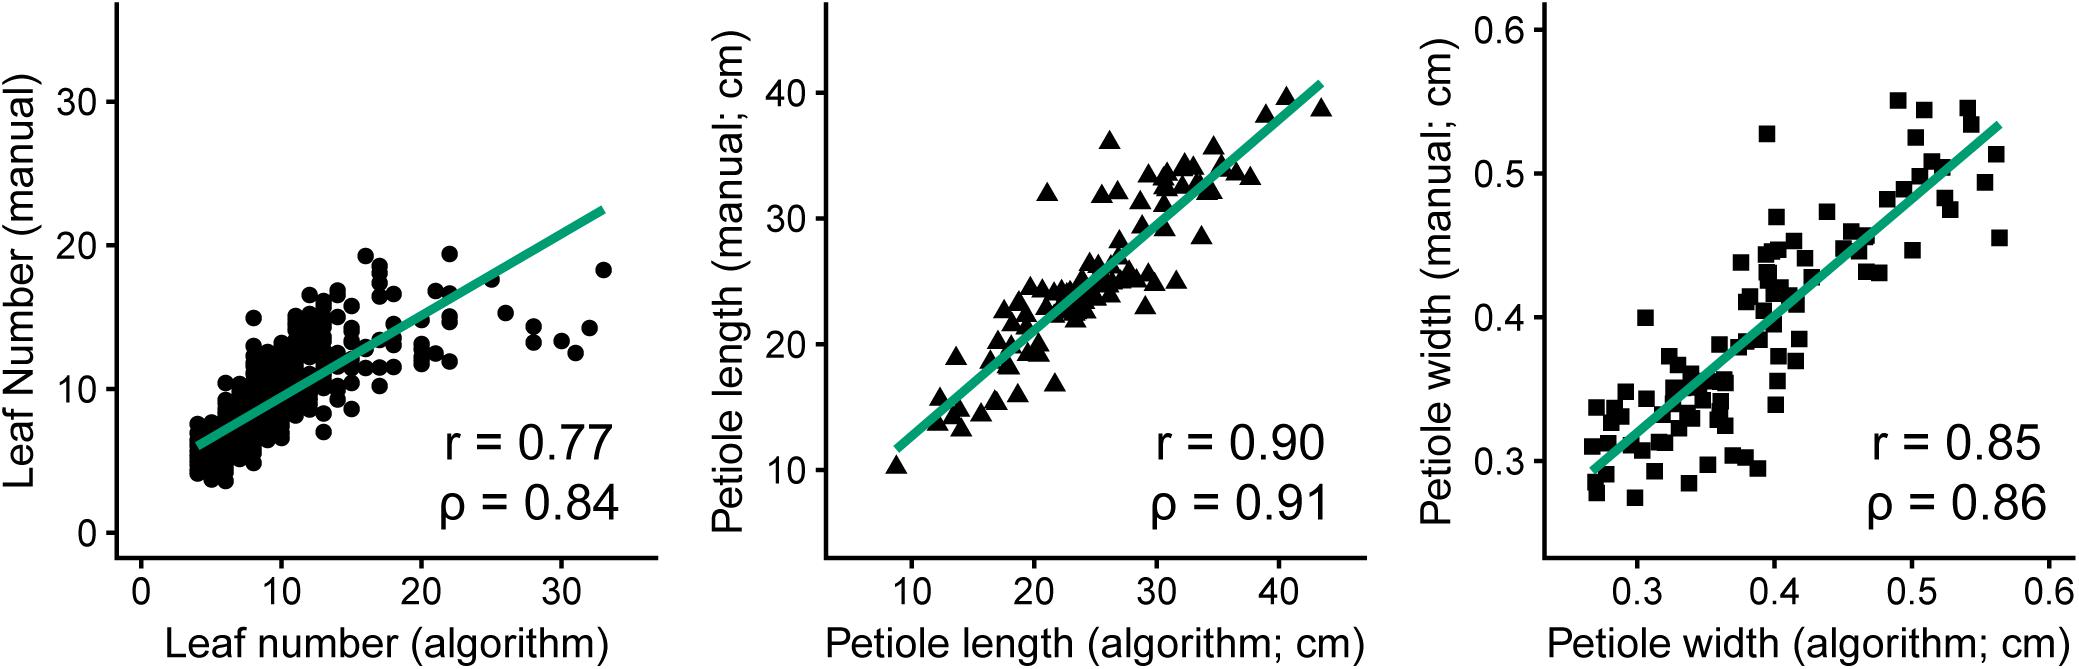
FIGURE 4. Comparison of manual measurements to algorithm-derived values for petiole number (left, n = 910, R2 = 0.59, P ≤ 0.001), petiole length (middle, n = 100, R2 = 0.81, P ≤ 0.001), and petiole width (right, n = 100, R2 = 0.72, P ≤ 0.001).
Principal Components Analysis of Shoot Biomass and Root Shape
For SBPs, principal components analysis identified differences in the magnitude and location of biomass (Figure 5). The first two principal components accounted for 80.3 percent of the variation explained (PVE). Sweeping PC1 detected differences in overall biomass accumulation (43.7 PVE), which is likely a combination of increases in both petiole number and total leaf area. Sweeping PC2 corresponded to decreasing petiole length and overall height (36.6 PVE), capturing variation for shoot compactness.
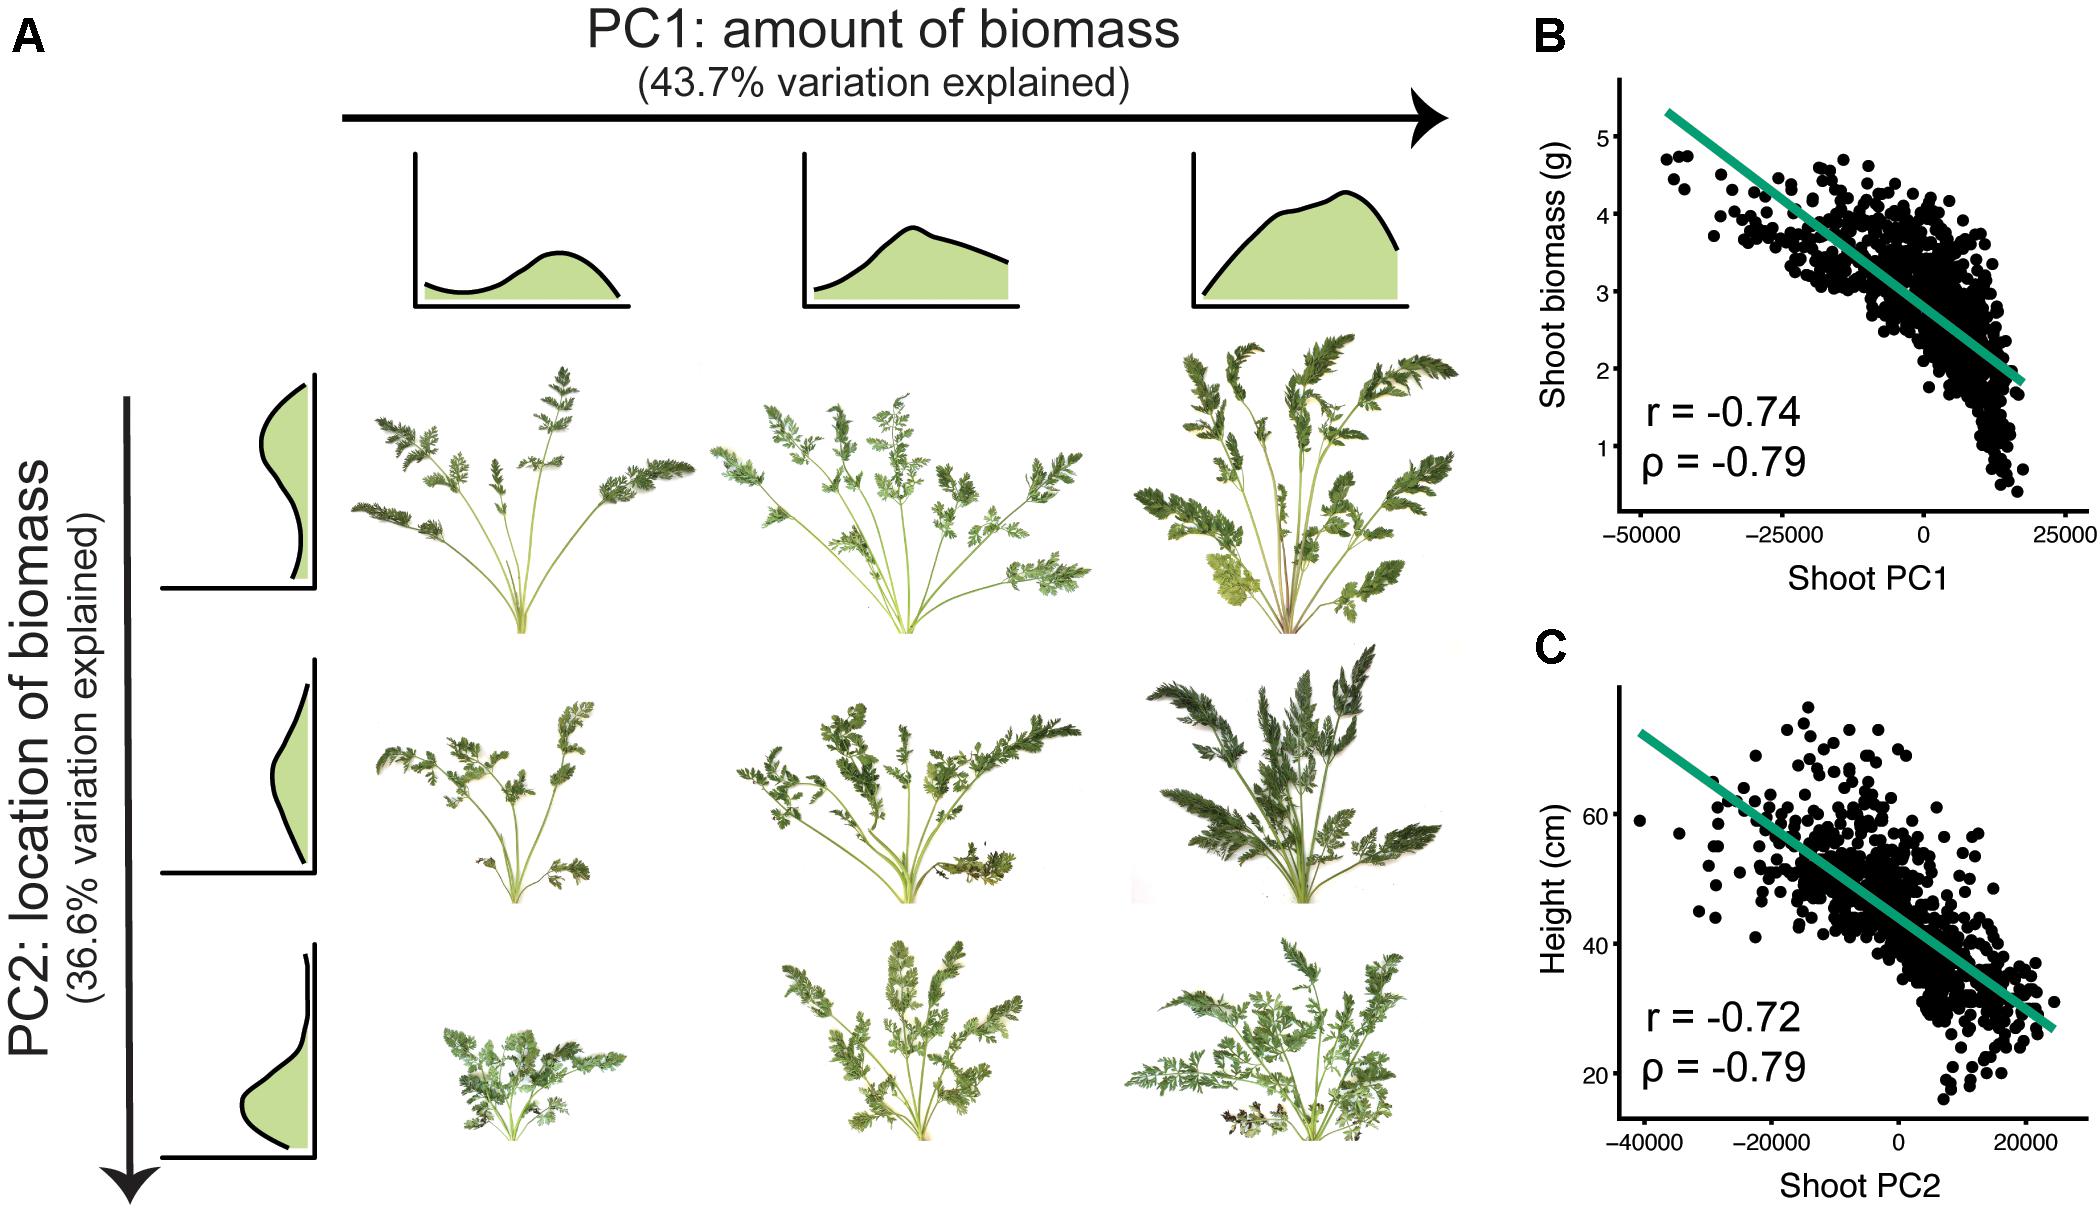
FIGURE 5. Principal components analysis for shoot biomass profiles (n = 917 individuals). (A) The first two principal components (PC1 and PC2) detect variation for the magnitude and location of carrot shoot biomass, respectively. Shoot biomass profiles are shown for the top three and leftmost three images. From left to right, sweeping PC1 primarily reflected the amount of biomass (43.7% variation explained). From top to bottom, sweeping PC2 reflected where the biomass was distributed (i.e., petiole length) (36.6% variation explained). (B) Correlation of shoot PC1 with biomass (P ≤ 0.001). (C) Correlation of shoot PC2 with shoot height (P ≤ 0.001).
To identify symmetrical differences in root shape, root biomass profiles were rescaled to constant length and width prior to principal components analysis. Principal components detected differences in the contour of the roots, with the first three principal components accounting for 88.6 PVE (Figure 6). Changes in PC1 corresponded to differences in overall shape (conical vs. cylindrical; 66.4 PVE). Variation in PC2 was associated with the shape of the root tip from a tapered shape to a blunt, rounded shape (16.6 PVE). For PC3, changes corresponded to diameter in the longitudinal section (5.6 PVE).
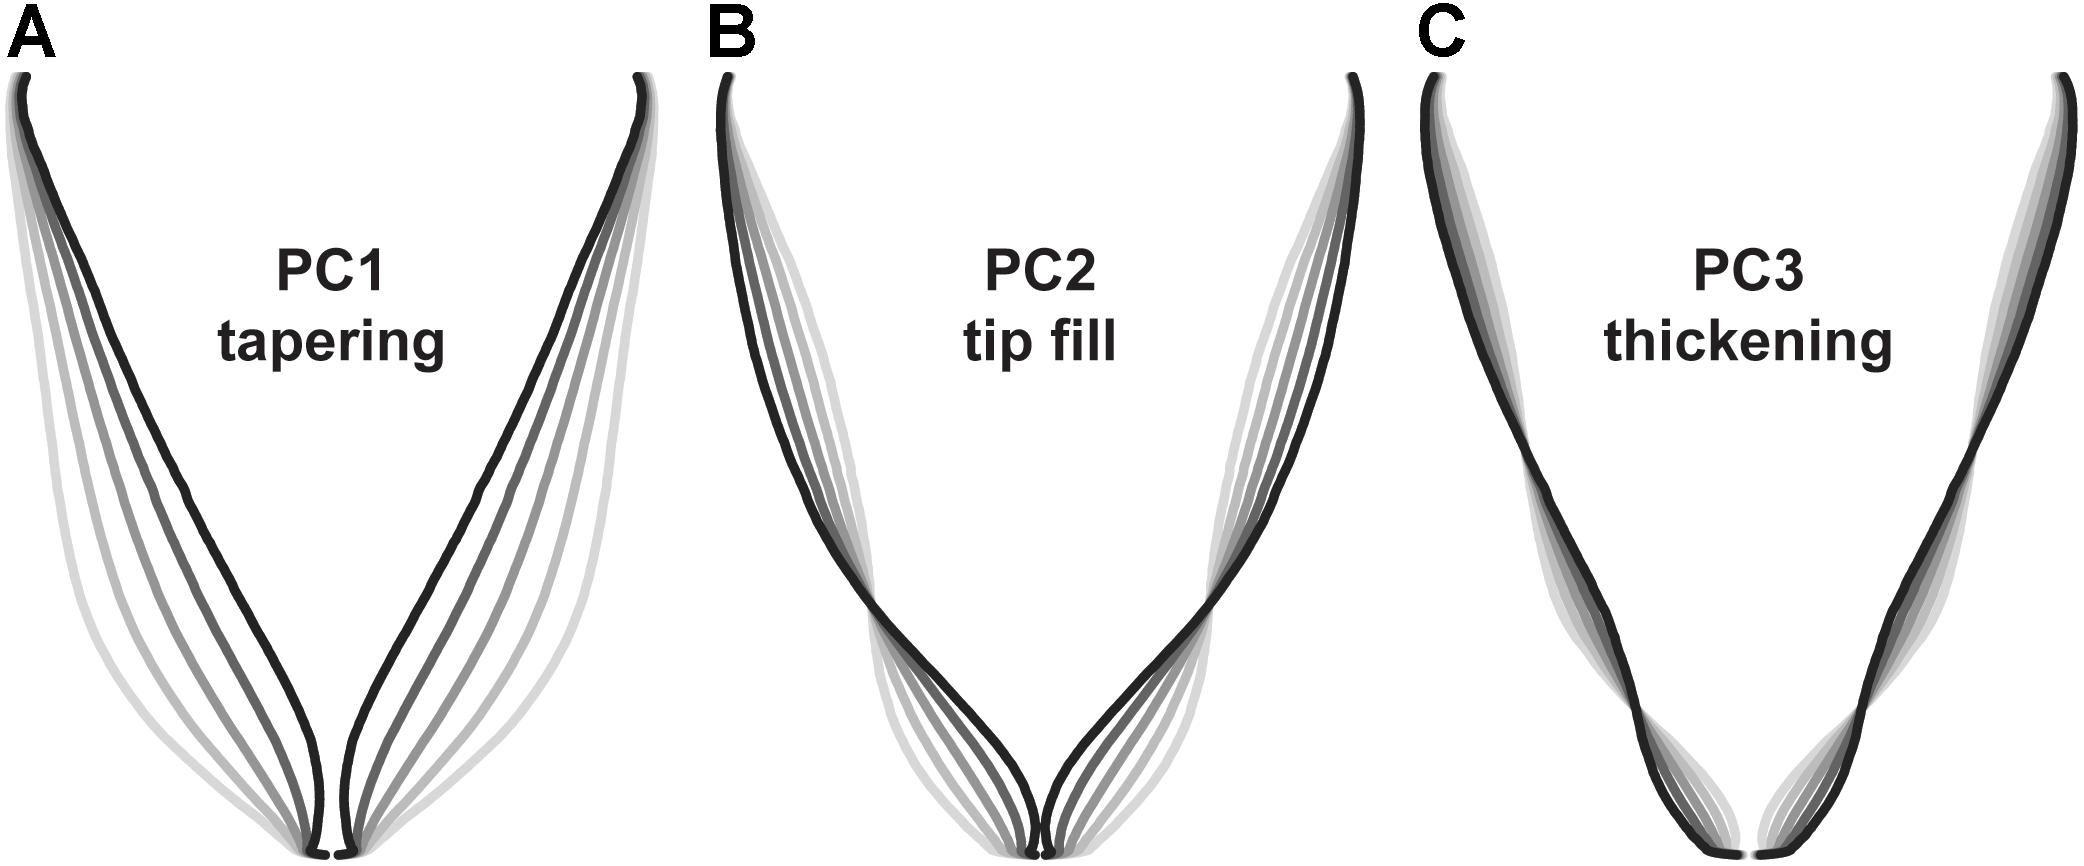
FIGURE 6. Eigenvectors for principal components analysis of carrot root shape after normalization for aspect ratio (n = 917 individuals). Lines represent a parameter sweep of the principal component, capturing symmetrical variation in root shape. (A) Changes in PC1 modified the extent of root tapering (conical vs. cylindrical) and explained 66.4% of the observed variation. (B) Changes in PC2 reflected the degree of tapering at the tip of the root (i.e., tip fill) and explained 16.6% of the observed variation. (C) Changes in PC3 captured variation for thickening in the longitudinal section of the root and explained 5.6% of the observed variation.
Results differed slightly from findings using landmark analysis by Horgan (2001), in which principal components for root shape included variation for size (short and thick vs. long and thin; 72.0 PVE), tapering (cylinder vs. cone; 10.8 PVE), thickness (8.2 PVE), bending (3.4 PVE), asymmetry (2.0 PVE), and tapering at the tip (0.9 PVE). Differences can be explained in part by the decision to correct for aspect ratio (i.e., the ratio of width to height), which allowed us to explain more variation in shape independent of root length and width. Disparities may also result from differences in measurement technique and in the range of root shapes represented in each study. Interestingly, our results are also similar to findings in Japanese radish (Iwata et al., 1998), which identified principal components for aspect ratio (73.9 PVE), bluntness at the distal end of the root (14.2 PVE), and swelling in the middle of the root (3.9 PVE).
Repeatability and Genotype by Environment Interaction
Estimates of repeatability were moderate for most traits, ranging from low (e.g., root length) to high (e.g., shoot height) and were comparable between manual and image measurements (Tables 1, 2). For shoot traits, repeatability across environments was highest for both manual and image-derived measurements of height (0.52 and 0.59, respectively) and petiole number (0.31 and 0.49, respectively), with low values observed for image-derived measurements of shoot biomass (0.19) (Table 1). In general, repeatability was relatively higher within rather than across environments for most traits. For instance, petiole width, which has a low repeatability across environments, had moderate to high repeatability within environments (0.35 in WI2015 and 0.84 in CA2016).
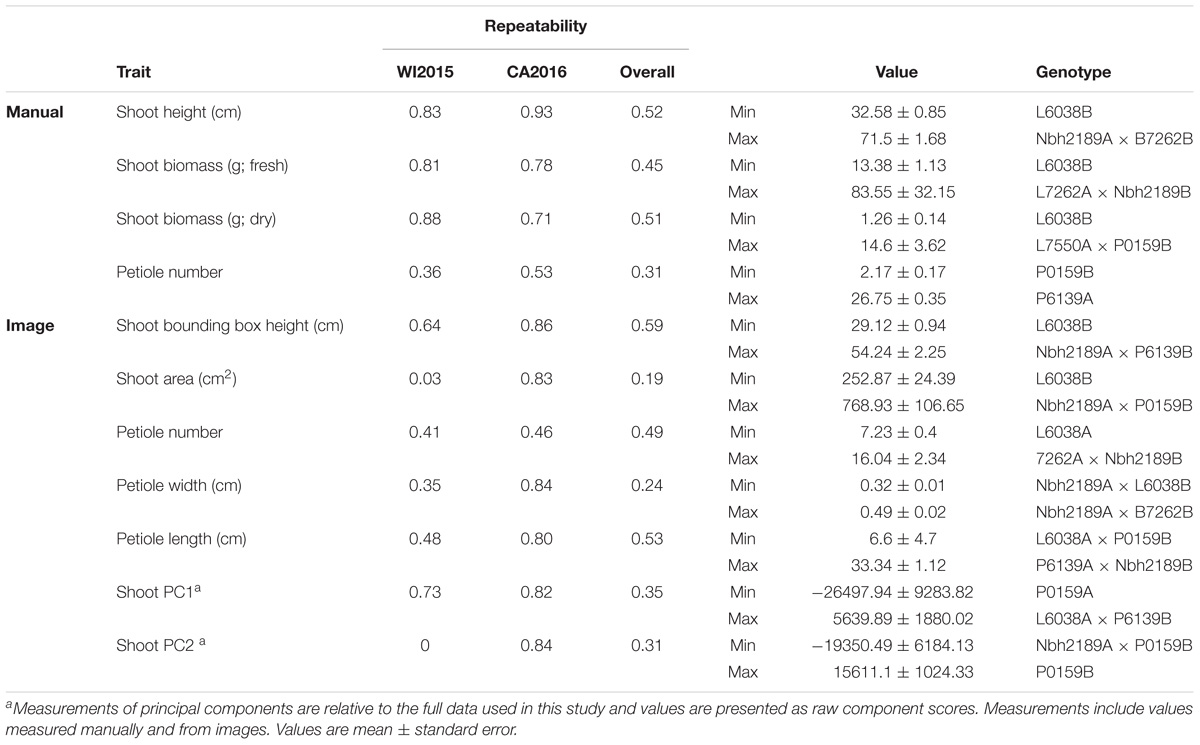
TABLE 1. Estimates of repeatability, trait ranges, and corresponding pedigrees for shoot characteristics in 42 inbreds and hybrids from a six-parent carrot diallel.
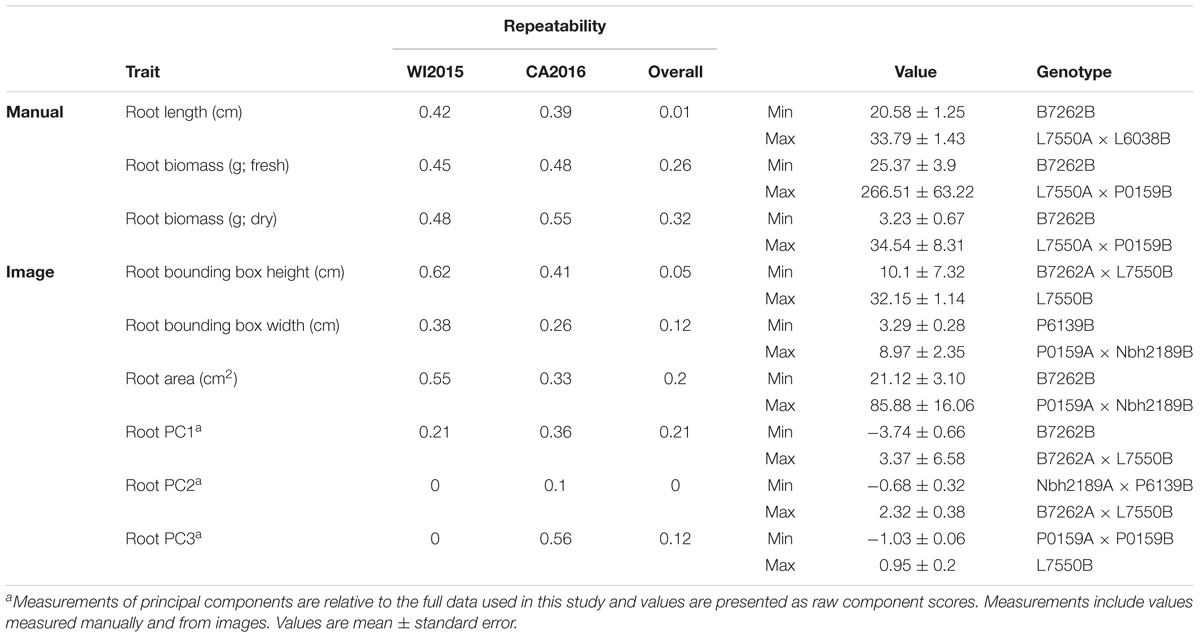
TABLE 2. Estimates of repeatability, trait ranges, and corresponding pedigrees for root characteristics in 42 inbreds and hybrids from a six-parent carrot diallel.
Repeatability for root traits ranged from 0.01 for manual measurements of root length to 0.32 for manually measured root biomass, with a value of 0 observed for root PC2 (Table 2). Observations of low repeatability for root length and shape characteristics may be due to low phenotypic variation among the inbred parents, which were primarily selected for divergent shoot characteristics, and/or GxE. As observed for shoot traits, estimates of repeatability were generally higher within environments, supporting the importance of GxE for these phenotypes.
Compared to manual measurements, image derived values successfully identified the lowest ranking line for shoot height (L6038), shoot biomass (L6038), and root biomass (B7262) (Tables 1, 2). Discrepancies between manual and image measurements, for instance between the highest line for shoot height based on manual measurements (Nbh2189A × B7262B) and based on image measurements (Nbh2189A × P6139B), may be due to differences in how the measurements were obtained (e.g., measured at the plot level in the field or for individual plants) and due the prevalence of missing observations in the WI2015 season.
Significant GxE was observed for all traits except petiole number (manual and image measurements), petiole length (image), root biomass (manual), root width (image), shoot PC2, shoot PC3, root PC1, and several traditional image measurements (shoot solidity, shoot eccentricity, root eccentricity, root Euler number, and root solidity) (Supplementary Table S2). Results for manual measurements of shoot height, shoot biomass, and root biomass are consistent with previous results reported by Turner et al. (2018), which provides a detailed diallel analysis and assessment of GxE for these traits. However, the significance of GxE was inconsistent between manual and image measurements of root biomass. Of the traits without significant GxE, all had a significant genotype effect except shoot eccentricity and root solidity, suggesting most traits measured in this study are useful for distinguishing among lines and capturing GxE.
Genotyping and Genetic Linkage Map Construction
A total of 116,030 SNPs were identified for 467 individuals. After filtering for missing data and allele frequency, the final data set contained 15,659 high quality SNPs. The linkage map was constructed using 461 individuals and included a total of 640 high quality SNP markers across nine chromosomes after removal of markers that were redundant or had significant segregation distortion, with the largest gaps observed on chromosomes 3, 4, and 6 (Supplementary Figure S3). The total distance covered was 719 cM with an average marker spacing of 1.1 cM and a maximum marker spacing of 17.7 cM (Supplementary Table S3). The density of this map is consistent with expectations for an F2 population of this size and with other recent QTL studies for maize (Li et al., 2017), Brachypodium (Jiang et al., 2017), barley (Huang et al., 2018), and carrot (Ellison et al., 2017).
QTL for Shoot and Root Traits
Overall, seven significant QTL on chromosomes 1, 2, 3, 4, 5, and 7 were identified for manual measurements of carrot shoot and root traits. Of these, six QTL were also detected for traits extracted computationally from images (Figure 7). Additionally, the use of image based measurements resulted in the identification of two additional QTL for root PC1 and petiole width on chromosomes 6 and 8, respectively. Significant QTL, including the most significant marker and corresponding 1.5 LOD interval, are described in detail for shoot traits in Table 3 and for root traits in Table 4. In general, the total PVE was similar for manually measured traits compared to their image-based counterparts, the notable exception being root length, for which the manual measurement only had 19 PVE compared to 41 PVE for the image measurement.
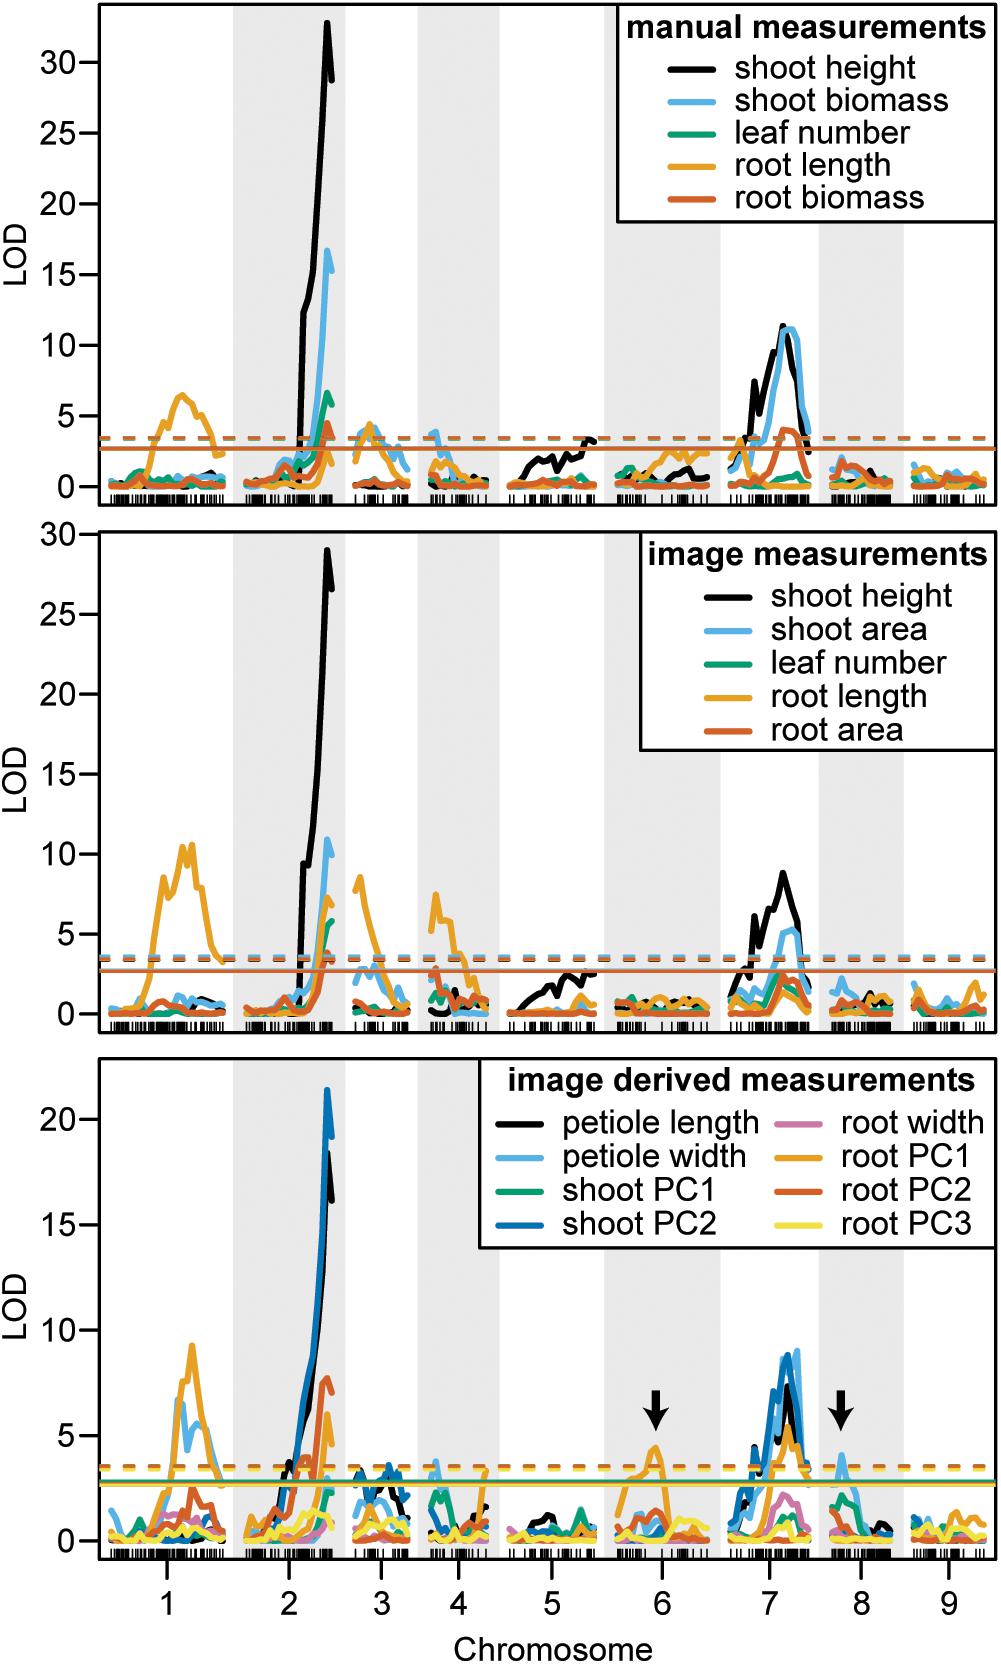
FIGURE 7. LOD curves for manually measured traits (top), image measured traits which were analogous to manual measurements (middle), and traits that were only measured from images (bottom). Arrows designate QTL that were identified by image measurements but not by manual measurements. Horizontal lines indicate the significant LOD thresholds for P < 0.05 (solid) and P < 0.01 (dashed).
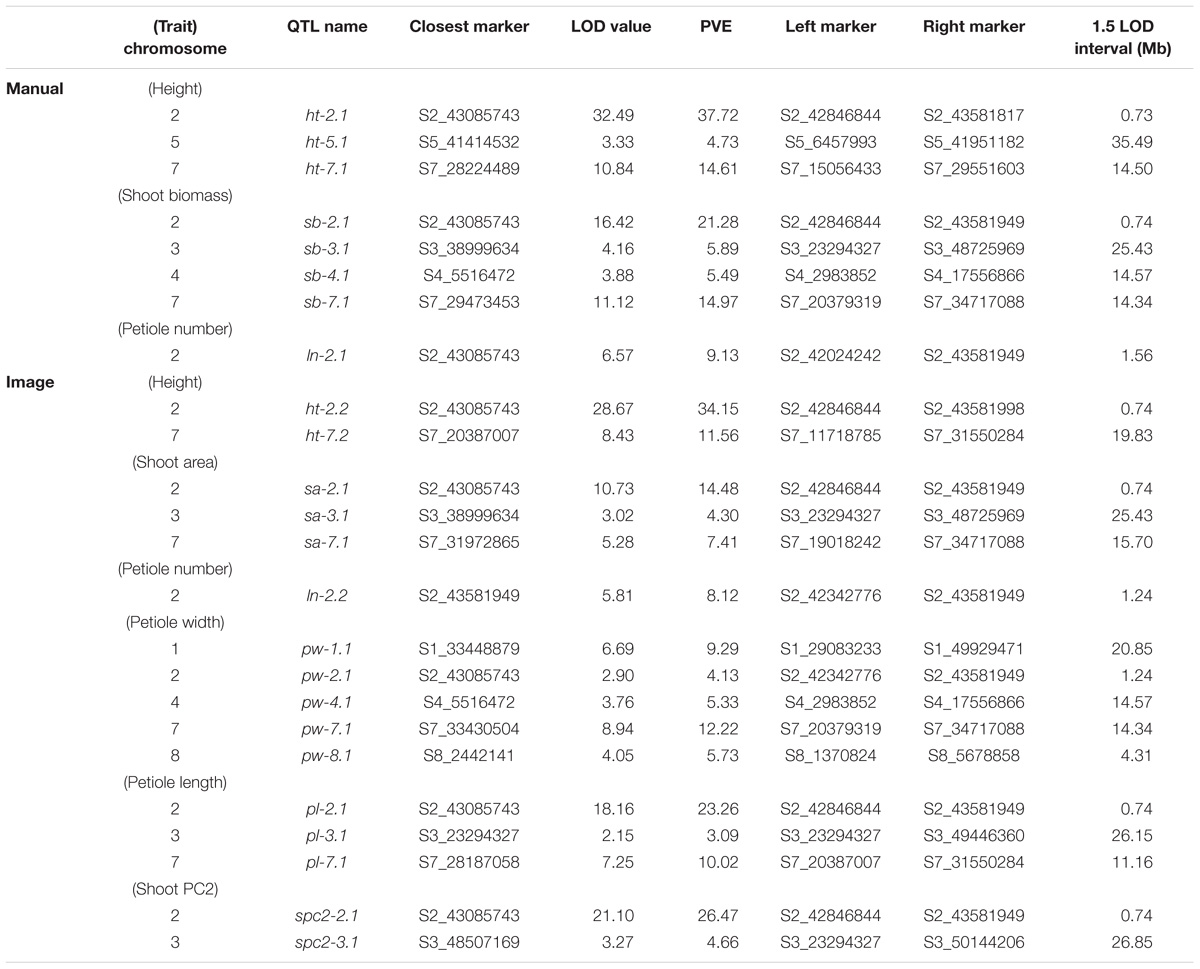
TABLE 3. Significant QTL (α = 0.05), LOD values, percent variance explained (PVE), and 1.5 LOD intervals for manual and image-based measurements of shoot traits in carrot.
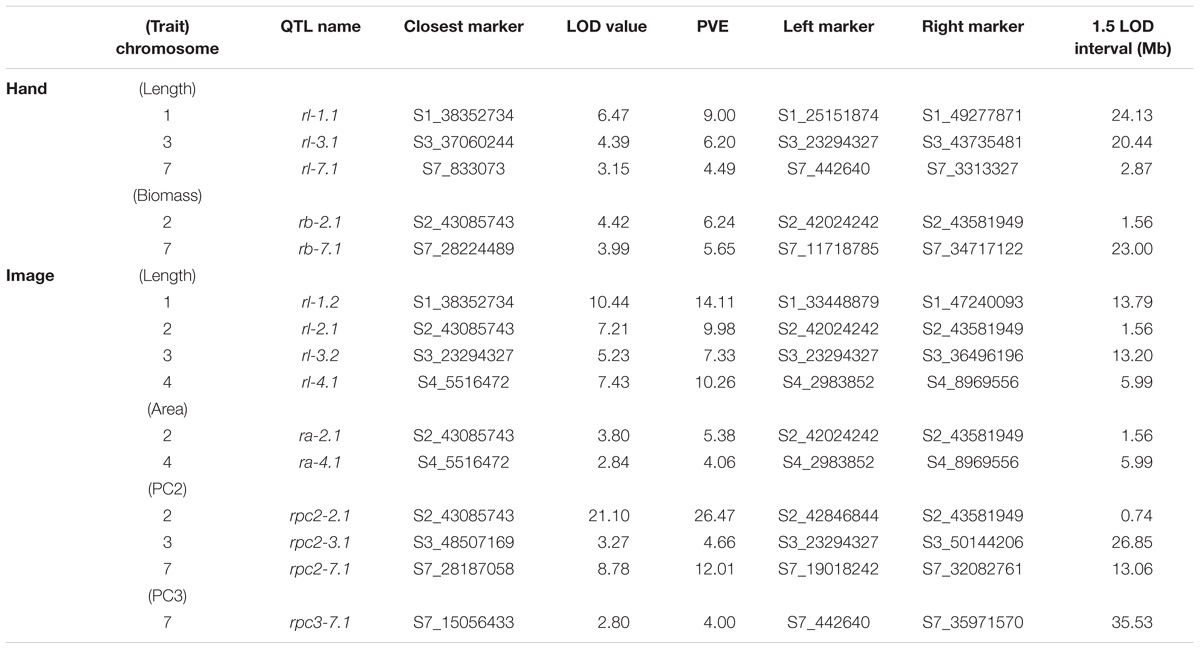
TABLE 4. Significant QTL (α = 0.05), LOD values, percent variance explained (PVE), and 1.5 LOD intervals for manual and image-based measurements of root traits in carrot.
We observed co-localization of QTL for shoot and root traits on the distal ends of chromosomes 2 and 7, which was consistent for both manual and image-based measurements. Significant QTL on chromosome 2 were identified for manual measurements of shoot height, shoot biomass, petiole number, and root biomass, and for image-based measurements of shoot height, shoot area, petiole number, petiole width, petiole length, shoot PC2 (correlated with height), root length, root area, and root PC2 (corresponding to the degree of tip fill). Similarly, significant QTL on chromosome 7 included manually measured shoot height, shoot biomass, and root biomass, and image measured shoot height, shoot biomass, petiole width, petiole length, root PC2 (tip fill), and root PC3 (associated with root thickening). In general, the QTL on chromosomes 2 and 7 also accounted for most of the PVE. For shoot traits, this ranged from 8% for petiole number to 53% for shoot height (Table 3) and, for root traits, from 4% for root PC3 (root thickening) to 38% for root PC2 (tip fill) (Table 4). Additional significant QTL explained a relatively small proportion of the variance and are described below.
Shoot Traits
For manual measurements of shoot height, a third QTL was identified on chromosome 5 (5 PVE), which was not captured by the corresponding image measurement. Additional QTL for shoot biomass included regions on chromosomes 3 (6 PVE) and 4 (5 PVE), of which only the region on chromosome 3 was found for the image-extracted trait (4 PVE). This same region on chromosome 3 was also identified for petiole length (3 PVE) and for shoot PC2 (5 PVE). For the image measurement of petiole width, two QTL, which were not identified for any hand measurements, were found on chromosomes 4 (5 PVE) and 8 (6 PVE). Despite strong correlation of shoot PC1 with shoot biomass, no QTL were identified for shoot PC1.
Root Traits
In contrast to the region on chromosome 7 described above, a QTL on the proximal end of chromosome 7 was identified for manually measured root length (4 PVE), but not for the corresponding image measurement. Two other QTL for root length were identified on chromosomes 1 and 3 for both manual (9 PVE and 6 PVE, respectively) and image (14 PVE and 7 PVE) measurements. The same QTL on chromosome 3, which was also identified for shoot biomass and petiole length, was detected for root PC2. For image-based measurements of root length and biomass, another QTL was also identified on chromosome 4 (10 PVE and 4 PVE, respectively).
Discussion
Plant phenomics has the potential to accelerate plant improvement through increased scope, throughput, and accuracy (Furbank and Tester, 2011; Bucksch et al., 2014; Fahlgren et al., 2015). These advances are especially beneficial in specialty crop breeding, as phenotypes are often complex and population sizes are limited by the time required to obtain measurements. This advantage is further realized in biennial crops such as carrot, where breeding is accelerated to annual cycle and phenotyping occurs in the narrow window between the harvest of vegetative roots and planting of vernalized roots for seed production (Simon, 2000; Simon et al., 2008).
To facilitate crop improvement efforts in carrot, we present a pipeline to assess whole-plant morphology, which to date has lacked protocols for standardized, quantitative measurements. This method will enable more in-depth genetic and phenotypic studies in carrot by providing: (1) robust, reliable and repeatable measurements of carrot morphology and (2) augmented throughput, which improves the statistical power of subsequent analyses by increasing sample size. Additionally, the phenotypes measured by this pipeline encompass both theoretical and applied importance for improvement of crop quality and yield, providing a means to accelerate genetic gain for primary breeding targets in carrot.
Image Analysis as a Promising Tool to Measure Carrot Phenotypes
The efficacy of image analysis to estimate carrot shoot and root morphology was validated on 917 field grown carrot plants from multiple locations and commonly used experimental designs. We anticipate that this analysis will be equally suitable for plants grown in the greenhouse or in other environments. In addition to providing measurements not attainable by hand, throughput for image analysis took approximately one third of the time needed for collection of the equivalent hand measurements. This time difference can be explained by the ability to capture multiple traits of interest from an image, which requires one step for data collection (image acquisition), compared to multiple manual measurements for individual traits, which can require several steps (e.g., biomass, which requires sampling, weighing, drying, and reweighing). Additionally, rapid processing of samples may also reduce potential errors during data entry and variation due to differences in the duration of storage prior to measurements (Fiorani and Schurr, 2013; Lobet et al., 2013; Bucksch et al., 2014). The throughput of this method could be further improved by decreasing the time and precision required to stage plants, barcoding individual plants, and including a marker of known size during imaging to automatically convert pixels to metric units.
The high correlation between image-extracted traits and hand-measured analogs (r > 0.7) provides evidence that this is a reliable method to capture phenotypic diversity and quantitative trait variation for important breeding targets in carrot. By enabling precise measurements for larger population sizes, the power of subsequent genetic investigations will be improved to enable more precise estimates of heritability and ultimately to better inform breeding strategies to increase genetic gain (Fiorani and Schurr, 2013; Kuijken et al., 2015). Additionally, a distinct advantage of this approach is the ability to measure shape parameters, which do not have an objective or practical hand measurement equivalent. Previous work on carrot shoot morphology includes image analysis of leaflet shape (Horgan et al., 2001) and an assessment of phenotypic and genotypic diversity for shoot height in commercially available carrot germplasm (Luby et al., 2016). However, this is the first method to implement an automated, quantitative assessment of carrot shoot architecture. The capability to capture variation for shoot morphology will benefit future investigations into the improvement of crop establishment and weed competitive ability in carrot, which are increasingly important for successful crop production (Colquhoun et al., 2017; Turner et al., 2018).
Carrot root shape has been extensively studied in the context of variety classification and crop quality. Previous work to quantify root shape includes the use of power law curves (Bleasdale and Thompson, 1963), machine vision (Howarth et al., 1992), landmark analysis (Horgan, 2001; Horgan et al., 2001), X-ray computed tomography (Rosenfeld et al., 2002), and quality assessment using geometric criteria (Koszela et al., 2013). The scope of these approaches was restricted to assessing varietal and quality differences in root shape, independent of haulm characteristics, and was limited to commercially available varieties. We build upon these methods by characterizing root shape without landmarks (Horgan et al., 2001), expanding the methodology to capture shoot architecture, and demonstrating the detection of subtle but biologically important variation in diverse genetic resource populations. Deviations from previous reports of principal components for carrot root shape can be partly explained by the decision to normalize for root length and width (i.e., aspect ratio), a step which can be omitted if aspect ratio is a trait of interest. It is also worth noting that the scope of our approach could be improved with the inclusion of additional root classes, such as Paris Market and Kuroda types (Simon et al., 2008).
Identification of QTL for Shoot and Root Characteristics
Vegetative plant organs often evolve as phenotypic modules, and consequently tend to be highly correlated and share evolutionary tracts (Bouchet et al., 2017). We observed strong correlations among shoot and root biomass and petiole number, consistent with recently reported results for developmental phenotypes in maize (Bouchet et al., 2017) and with the general observation that plant organs tend to evolve as phenotypic modules (Murren, 2002; Pigliucci and Preston, 2004). Despite the strong correlation between shoot and root biomass, the deviation of this linear relationship from unity could also suggest that carrot growth may depart from a steady state, with biomass allocation in the shoot not directly proportional to biomass in the storage root (Poorter et al., 2012). Alternatively, this disparity could also result from an inability to account for fibrous root mass, which is lost during harvest.
For the F2 population in this study, a total of seven unique QTL were detected for carrot shoot and root morphology, which are traits of primary interest to improve carrot quality and yield. Of these, three QTL had large effects and accounted for over 10 PVE for a given trait, while the remainder had small to moderate effects. QTL for image measurements tended to overlap with QTL for manual measurements, providing confirmation that this pipeline can be used reliably for genetic studies of shoot and root morphology in carrot. Notably, QTL for several traits in this study had various amounts of overlap with previously identified QTL for root swelling on chromosomes 2, 3, 4, and 5 (Macko-Podgórni et al., 2017).
We report evidence for the co-localization of QTL for shoot traits (height, petiole number, biomass, petiole width, and petiole length) and root characteristics (length, biomass, and tip fill) on the distal end for the long arm of chromosome 2. This suggests a pleiotropic basis and/or tight genetic linkage for the morphological integration of shoot and root architecture in carrot. This finding is also consistent with the recent identification of a QTL and selective sweep on a nearby region of chromosome 2, which included the identification of a candidate domestication gene in carrot (DcAHLc1) (Macko-Podgórni et al., 2017). DcAHLc1 is a regulatory gene in the AT-HOOK MOTIF CONTAINING NUCLEAR LOCALIZED (AHL) family, which is highly conserved across monocot and dicot species and influences plant growth and development (Zhao et al., 2013). Members of the AHL gene family have been linked to shoot and root characteristics in other species, including hypocotyl elongation (Street et al., 2008; Xiao et al., 2009), increased plant biomass (Jiang et al., 2004), root growth (Zhou et al., 2013), and phytohormone regulation (Rashotte et al., 2003; Matsushita et al., 2007; Vom Endt et al., 2007). Interestingly, in this study we also find a member of the AHL gene family within the confidence interval for the QTL identified on chromosome 2 (Supplementary Table S4). While our findings support evidence that the region on chromosome 2 is important for carrot growth and development, they differ from the findings of Macko-Podgórni et al. (2017) in two important ways: (1) we did not observe overlap between the support intervals of significant QTL on chromosome 2 in this study and the DcAHLc1 gene and (2) we did not find any significant QTL for image-based measurements of root width, although we did observe a significant QTL for root PC2, which captures variation in the amount of tapering (or swelling) at the tip of the root. A likely explanation for not finding the DcAHLc1 gene to contribute to root shape in our study, which used a cross between domesticated breeding stocks, is that Macko-Podgórni et al. (2017) used a wild × domesticated cross (D. carota subsp. commutatus × 2874B), in which the DcAHLc1 gene is segregating. Together, these findings suggest the possibility of additional candidate gene(s) on chromosome 2 and tight linkage among genes influencing carrot shoot and root development, which are inherited together as a suite of traits.
By providing a foundation for future genetic mapping and genome-wide association studies, the significant QTL detected in this study will contribute to the development of marker-assisted selection and fine mapping efforts for carrot shoot and root morphology, which will require development of populations with higher marker density and mapping resolution. Further research will be necessary to validate the prevalence and importance these regions in different genetic backgrounds, over the course of developmental stages, and across environments.
Conclusion and Future Directions
The development of an automated image analysis pipeline for carrot shoot and root morphology provides new opportunities for crop improvement and to elucidate the underlying genetics for quantitative traits. The design for image collection is simple, low-cost, and could be easily adapted for use in other crops with similar morphology. Ideally, this methodology could be expanded to other important crops, e.g., cassava, beet, radish, and other members of the Apiaceae family, such as celery, parsnip, parsley, and cilantro, which have widespread culinary uses but lack substantial research investment. Images are also an ideal medium to facilitate collaborations, as they transfer multidimensional information for which analysis is standardized and automated (Lobet et al., 2013). As such, the ability to analyze and share carrot images through public repositories is an opportunity to increase the scope, archival, and reproducibility of carrot research.
Data from this method can be used in numerous applications for carrot breeding and research. Morphological variation can be rapidly assessed and cataloged for diverse genetic backgrounds, providing a resource to better inform experimental design and population selection for more in-depth analysis. This pipeline can be used in tandem with physiological studies, for instance to evaluate the effects of gibberellic acid and cytokinin, which are known to influence carrot shoot and root morphology (Wang et al., 2015a,b). Phenotypic data can also be integrated into predictive models for carrot growth and development by imaging plants at various developmental stages, permitting further investigation of allometric relationships between the shoot and root. In future studies, it will also be important to consider the relationship between fibrous root architecture, which provides a source of photosynthates, water, and soil-borne nutrients, and the storage root, which serves as a sink for these metabolites that are essential for vegetative and reproductive growth.
This approach is specifically tailored for a carrot breeding program, but could also complement existing image analysis software and methods for detailed analyses. For example, research on the genetic basis of lateral branching in carrot roots is underway using RootNav (Pound et al., 2013) and SmartRoot (Lobet et al., 2011), which are well established methodologies to quantify root system architecture. Potential improvements and expansions of our method include incorporation of uniform lighting and a marker of known size, as well as extension of carrot phenotyping to field-scale measurements over the course of the growing season.
The method presented in this study provides an initial step in automated phenotyping for carrot. By enabling rapid, precise measurements of important agronomic characteristics in carrot, this platform will allow carrot breeders to measure greater population sizes, increasing throughput and supporting downstream analyses.
Data Availability
All images, scripts, and sequence data used in this study are publicly available. Custom algorithms for image analysis are accessible on CyVerse as part of the PhytoMorph Image Phenomics ToolKit. Scripts for data processing, visualization, and QTL mapping are available on GitHub at https://github.com/mishaploid/carrot-image-analysis. Unfiltered SNPs from the F2 mapping population (variant call format) and images are deposited on FigShare at https://doi.org/10.6084/m9.figshare.c.4300439.v1.
Author Contributions
ST, PS, ES, and NM conceived and designed the study. NM developed custom algorithms for image analysis. ST and SE gathered phenotypic and genotypic data. DS performed SNP calling and filtering. ST, SE, and NM performed the statistical analyses. ST wrote the manuscript with contributions from the other authors. All authors read and approved the final manuscript.
Funding
This research was supported by the United States Department of Agriculture National Institute of Food and Agriculture under award number 2011-51300-30903 of the Organic Agriculture and Research Extension Initiative and was conducted using resources provided by the Open Science Grid, which is supported by the National Science Foundation award 1148698, and the United States Department of Energy’s Office of Science.
Conflict of Interest Statement
The authors declare that the research was conducted in the absence of any commercial or financial relationships that could be construed as a potential conflict of interest.
Acknowledgments
The authors are grateful to Adam Bolton, Jenna Hershberger, Erin Lalor, Leah Weston, Robynn Schwarzmann, Hailey Shanovich, Grace Gustafson, and Sam Veum for assistance in data collection, to Charlene Grahn, Joseph Gage, and Julie Dawson for helpful advice on the project, and to Rob Kane (deceased) and Tom Horejsi for technical support and field management.
Supplementary Material
The Supplementary Material for this article can be found online at: https://www.frontiersin.org/articles/10.3389/fpls.2018.01703/full#supplementary-material
References
Alessandro, M. S., Galmarini, C. R., Iorizzo, M., and Simon, P. W. (2013). Molecular mapping of vernalization requirement and fertility restoration genes in carrot. Theor. Appl. Genet. 126, 415–423. doi: 10.1007/s00122-012-1989-1
Arbizu, C. I., Ellison, S. L., Senalik, D., Simon, P. W., and Spooner, D. M. (2016). Genotyping-by-sequencing provides the discriminating power to investigate the subspecies of Daucus carota (Apiaceae). BMC Evol. Biol. 16:234. doi: 10.1186/s12862-016-0806-x
Arends, D., Prins, P., Jansen, R. C., and Broman, K. W. (2010). R/qtl: high-throughput multiple QTL mapping. Bioinformatics 26, 2990–2992. doi: 10.1093/bioinformatics/btq565
Banga, O. (1957). Origin of the European cultivated carrot. Euphytica 6, 54–63. doi: 10.1007/BF00179518
Bell, C. E., Boutwell, B. E., Ogbuchiekwe, E. J., and McGiffen, M. E. (2000). Weed control in carrots: the efficacy and economic value of linuron. Hortscience 35, 1089–1091.
Bellinder, R. R., Kirkwyland, J. J., and Wallace, R. W. (1997). Carrot (Daucus carota) and weed response to linuron and metribuzin applied at different crop stages. Weed Technol. 11, 235–240. doi: 10.1017/S0890037X00042895
Bhandarkar, S. M., Koh, J., and Suk, M. (1996). A hierarchical neural network and its application to image segmentation. Robotics 41, 337–355. doi: 10.1016/0378-4754(95)00083-6
Bleasdale, J. K. A., and Thompson, R. (1963). An objective method of recording and comparing the shapes of carrot roots. J. Hortic. Sci. 38, 232–241. doi: 10.1080/00221589.1963.11514074
Boiteux, L. S., Fonseca, M. E. N., and Simon, P. W. (1999). Effects of plant tissue and DNA purification method on randomly amplified polymorphic DNA-based genetic fingerprinting analysis in carrot. J. Am. Soc. Hortic. Sci. 124,32–38.
Bouchet, S., Bertin, P., Presterl, T., Jamin, P., Coubriche, D., Gouesnard, B., et al. (2017). Association mapping for phenology and plant architecture in maize shows higher power for developmental traits compared with growth influenced traits. Heredity 118, 249–259. doi: 10.1038/hdy.2016.88
Bouteillé, M., Rolland, G., Balsera, C., Loudet, O., and Muller, B. (2012). Disentangling the intertwined genetic bases of root and shoot growth in Arabidopsis. PLoS One 7:e32319. doi: 10.1371/journal.pone.0032319
Bradbury, P. J., Zhang, Z., Kroon, D. E., Casstevens, T. M., Ramdoss, Y., and Buckler, E. S. (2007). TASSEL: software for association mapping of complex traits in diverse samples. Bioinformatics 23, 2633–2635. doi: 10.1093/bioinformatics/btm308
Bradeen, J. M., and Simon, P. W. (1998). Conversion of an AFLP fragment linked to the carrot Y2 locus to a simple, codominant, PCR-based marker form. Theor. Appl. Genet. 97, 960–967. doi: 10.1007/s001220050977
Broman, K., and Sen, Ś. (2009). A Guide to QTL Mapping with R/qtl. New York, NY: Springer. doi: 10.1007/978-0-387-92125-9
Bucksch, A., Burridge, J., York, L. M., Das, A., Nord, E., Weitz, J. S., et al. (2014). Image-based high-throughput field phenotyping of crop roots. Plant Physiol. 166, 470–486. doi: 10.1104/pp.114.243519
Buishand, J., and Gabelman, W. (1979). Investigations on the inheritance of color and carotenoid content in phloem and xylem of carrot roots (Daucus carota L.). Euphytica 28, 611–632. doi: 10.1007/BF00038928
Cavagnaro, P. F., Iorizzo, M., Yildiz, M., Senalik, D., Parsons, J., Ellison, S., et al. (2014). A gene-derived SNP-based high resolution linkage map of carrot including the location of QTL conditioning root and leaf anthocyanin pigmentation. BMC Genomics 15:1118. doi: 10.1186/1471-2164-15-1118
Churchill, G. A., and Doerge, R. W. (1994). Empirical threshold values for quantitative trait mapping. Genetics 138, 963–971.
Colquhoun, J. B., Rittmeyer, R. A., and Heider, D. J. (2017). Tolerance and suppression of weeds varies among carrot varieties. Weed Technol. 31, 897–902. doi: 10.1017/wet.2017.54
Danecek, P., Auton, A., Abecasis, G., Albers, C. A., Banks, E., DePristo, M. A., et al. (2011). The variant call format and VCFtools. Bioinformatics 27, 2156–2158. doi: 10.1093/bioinformatics/btr330
Dignat, G., Welcker, C., Sawkins, M., Ribaut, J. M., and Tardieu, F. (2013). The growths of leaves, shoots, roots and reproductive organs partly share their genetic control in maize plants. Plant Cell Environ. 36, 1105–1119. doi: 10.1111/pce.12045
Ellison, S., Senalik, D., Bostan, H., Iorizzo, M., and Simon, P. (2017). Fine mapping, transcriptome analysis, and marker development for Y2, the gene that conditions β-carotene accumulation in carrot (Daucus carota L.). G3 7, 2665–2675. doi: 10.1534/g3.117.043067
Elshire, R. J., Glaubitz, J. C., Sun, Q., Poland, J. A., Kawamoto, K., Buckler, E. S., et al. (2011). A robust, simple genotyping-by-sequencing (GBS) approach for high diversity species. PLoS One 6:e19379. doi: 10.1371/journal.pone.0019379
Enquist, B. J., and Niklas, K. J. (2002). Global allocation rules for patterns of biomass partitioning in seed plants. Science 295, 1517–1520. doi: 10.1126/science.1066360
Fahlgren, N., Gehan, M. A., and Baxter, I. (2015). Lights, camera, action: high-throughput plant phenotyping is ready for a close-up. Curr. Opin. Plant Biol. 24, 93–99. doi: 10.1016/j.pbi.2015.02.006
Falster, D. S., and Westoby, M. (2003). Leaf size and angle vary widely across species: what consequences for light interception? New Phytol. 158, 509–525. doi: 10.1046/j.1469-8137.2003.00765.x
Fiorani, F., and Schurr, U. (2013). Future scenarios for plant phenotyping. Annu. Rev. Plant Biol. 64, 267–291. doi: 10.1146/annurev-arplant-050312-120137
Furbank, R. T., and Tester, M. (2011). Phenomics – technologies to relieve the phenotyping bottleneck. Trends Plant Sci. 16, 635–644. doi: 10.1016/j.tplants.2011.09.005
Gage, J. L., Miller, N. D., Spalding, E. P., Kaeppler, S. M., and de Leon, N. (2017). TIPS: a system for automated image-based phenotyping of maize tassels. Plant Methods 13:21. doi: 10.1186/s13007-017-0172-8
Glaubitz, J. C., Casstevens, T. M., Lu, F., Harriman, J., Elshire, R. J., Sun, Q., et al. (2014). TASSEL-GBS: a high capacity genotyping by sequencing analysis pipeline. PLoS One 9:e90346. doi: 10.1371/journal.pone.0090346
Hole, C. C., Barnes, A., Thomas, T. H., Scott, P. A., and Rankin, W. E. F. (1983). Dry matter distribution between the shoot and storage root of carrot (Daucus carota L.) I. comparison of varieties. Ann. Bot. 51, 175–187. doi: 10.1093/oxfordjournals.aob.a086456
Horgan, G. W. (2001). The statistical analysis of plant part appearance — a review. Comput. Electron. Agric. 31, 169–190. doi: 10.1016/S0168-1699(00)00190-3
Horgan, G. W., Talbot, M., and Davey, J. C. (2001). Use of statistical image analysis to discriminate carrot cultivars. Comput. Electron. Agric. 31, 191–199. doi: 10.1016/S0168-1699(00)00191-5
Howarth, M. S., Brandon, J. R., Searcy, S. W., and Kehtarnavaz, N. (1992). Estimation of tip shape for carrot classification by machine vision. J. Agric. Eng. Res. 53, 123–139. doi: 10.1016/0021-8634(92)80078-7
Huang, Y., Haas, M., Heinen, S., Steffenson, B. J., Smith, K. P., and Muehlbauer, G. J. (2018). QTL mapping of fusarium head blight and correlated agromorphological traits in an elite barley cultivar Rasmusson. Front. Plant Sci. 9:1260. doi: 10.3389/fpls.2018.01260
Idrissi, O., Udupa, S. M., De Keyser, E., McGee, R. J., Coyne, C. J., Saha, G. C., et al. (2016). Identification of quantitative trait loci controlling root and shoot traits associated with drought tolerance in a lentil (Lens culinaris Medik.) recombinant inbred line population. Front. Plant Sci. 7:1174. doi: 10.3389/fpls.2016.01174
Iorizzo, M., Ellison, S., Senalik, D., Zeng, P., Satapoomin, P., Huang, J., et al. (2016). A high-quality carrot genome assembly provides new insights into carotenoid accumulation and asterid genome evolution. Nat. Genet. 48, 657–666. doi: 10.1038/ng.3565
Iorizzo, M., Senalik, D. A., Ellison, S. L., Grzebelus, D., Cavagnaro, P. F., Allender, C., et al. (2013). Genetic structure and domestication of carrot (Daucus carota subsp. sativus) (Apiaceae). Am. J. Bot. 100, 930–938. doi: 10.3732/ajb.1300055
Iwata, H., Niikura, S., Matsuura, S., Takano, Y., and Ukai, Y. (1998). Evaluation of variation of root shape of Japanese radish (Raphanus sativus L.) based on image analysis using elliptic Fourier descriptors. Euphytica 102, 143–149. doi: 10.1023/A:1018392531226
Jansen, R. C., and Stam, P. (1994). High resolution of quantitative traits into multiple loci via interval mapping. Genetics 136, 1447–1455.
Jiang, C. Z., Heard, J., Ratcliffe, O., Gutterson, N., Hempel, F., Kumimoto, R., et al. (2004). Methods for Modifying Plant Biomass and Abiotic Stress. Available at: https://www.google.com/patents/US20040128712
Jiang, Y., Wang, X., Yu, X., Zhao, X., Luo, N., Pei, Z., et al. (2017). Quantitative trait loci associated with drought tolerance in Brachypodium distachyon. Front. Plant Sci. 8:811. doi: 10.3389/fpls.2017.00811
Just, B. J., Santos, C. A. F., Fonseca, M. E. N., Boiteux, L. S., Oloizia, B. B., and Simon, P. W. (2007). Carotenoid biosynthesis structural genes in carrot (Daucus carota): isolation, sequence-characterization, single nucleotide polymorphism (SNP) markers and genome mapping. Theor. Appl. Genet. 114, 693–704. doi: 10.1007/s00122-006-0469-x
Just, B. J., Santos, C. A. F., Yandell, B. S., and Simon, P. W. (2009). Major QTL for carrot color are positionally associated with carotenoid biosynthetic genes and interact epistatically in a domesticated × wild carrot cross. Theor. Appl. Genet. 119, 1155–1169. doi: 10.1007/s00122-009-1117-z
Kosambi, D. D. (1943). The estimation of map distances from recombination values. Ann. Eugen. 12, 172–175. doi: 10.1111/j.1469-1809.1943.tb02321.x
Koszela, K., Weres, J., Boniecki, P., Zaborowicz, M., Przybył, J., Dach, J., et al. (2013). “Computer image analysis in the quality procedure for selected carrot varieties,” in Proceedings of the Fifth International Conference on Digital Image Processing SPIE 8878, Beijing. doi: 10.1117/12.2030701
Kuijken, R. C. P., van Eeuwijk, F. A., Marcelis, L. F. M., and Bouwmeester, H. J. (2015). Root phenotyping: from component trait in the lab to breeding. J. Exp. Bot. 66, 5389–5401. doi: 10.1093/jxb/erv239
Li, J., Xie, Y., Dai, A., Liu, L., and Li, Z. (2009). Root and shoot traits responses to phosphorus deficiency and QTL analysis at seedling stage using introgression lines of rice. J. Genet. Genomics 36, 173–183. doi: 10.1016/S1673-8527(08)60104-6
Li, K., Wang, H., Hu, X., Ma, F., Wu, Y., Wang, Q., et al. (2017). Genetic and quantitative trait locus analysis of cell wall components and forage digestibility in the Zheng58 × HD568 maize RIL population at anthesis stage. Front. Plant Sci. 8:1472. doi: 10.3389/fpls.2017.01472
Lobet, G., Draye, X., and Périlleux, C. (2013). An online database for plant image analysis software tools. Plant Methods 9:38. doi: 10.1186/1746-4811-9-38
Lobet, G., Pages, L., and Draye, X. (2011). A novel image-analysis toolbox enabling quantitative analysis of root system architecture. Plant Physiol. 157, 29–39. doi: 10.1104/pp.111.179895
Luby, C. H., Dawson, J. C., and Goldman, I. L. (2016). Assessment and accessibility of phenotypic and genotypic diversity of carrot (Daucus carota L. var. sativus) cultivars commercially available in the United States. PLoS One 11:e0167865. doi: 10.1371/journal.pone.0167865
Lynch, J. (1995). Root architecture and plant productivity. Plant Physiol. 109, 7–13. doi: 10.1104/pp.109.1.7
Lynch, J. P. (2007). Rhizoeconomics: the roots of shoot growth limitations. Hortscience 42, 1107–1109.
Macko-Podgórni, A., Iorizzo, M., Krzysztof, S., Simon, P. W., and Grzebelus, D. (2014). Conversion of a diversity arrays technology marker differentiating wild and cultivated carrots to a co-dominant cleaved amplified polymorphic site marker. Acta Biochim. Pol. 61, 19–22.
Macko-Podgórni, A., Machaj, G., Stelmach, K., Senalik, D., Grzebelus, E., Iorizzo, M., et al. (2017). Characterization of a genomic region under selection in cultivated carrot (Daucus carota subsp. sativus) reveals a candidate domestication gene. Front. Plant Sci. 8:12. doi: 10.3389/fpls.2017.00012
Manavalan, L. P., Prince, S. J., Musket, T. A., Chaky, J., Deshmukh, R., Vuong, T. D., et al. (2015). Identification of novel QTL governing root architectural traits in an interspecific soybean population. PLoS One 10:e0120490. doi: 10.1371/journal.pone.0120490
Matsushita, A., Furumoto, T., Ishida, S., and Takahashi, Y. (2007). AGF1, an AT-hook protein, is necessary for the negative feedback of AtGA3ox1 encoding GA 3-Oxidase. Plant Physiol. 143, 1152–1162. doi: 10.1104/pp.106.093542
Merchant, N., Lyons, E., Goff, S., Vaughn, M., Ware, D., Micklos, D., et al. (2016). The iPlant Collaborative: cyberinfrastructure for enabling data to discovery for the life sciences. PLoS Biol. 14:e1002342. doi: 10.1371/journal.pbio.1002342
Miller, N. D., Haase, N. J., Lee, J., Kaeppler, S. M., de Leon, N., and Spalding, E. P. (2017). A robust, high-throughput method for computing maize ear, cob, and kernel attributes automatically from images. Plant J. 89, 169–178. doi: 10.1111/tpj.13320
Moore, C. R., Gronwall, D. S., Miller, N. D., and Spalding, E. P. (2013). Mapping quantitative trait loci affecting Arabidopsis thaliana seed morphology features extracted computationally from images. G3 3, 109–118. doi: 10.1534/g3.112.003806
Murray, M. G., and Thompson, W. F. (1980). Rapid isolation of high molecular weight plant DNA. Nucleic Acids Res. 8, 4321–4325. doi: 10.1093/nar/8.19.4321
Murren, C. (2002). Phenotypic integration in plants. Plant Species Biol. 17, 89–99. doi: 10.1046/j.1442-1984.2002.00079.x
Naz, A. A., Arifuzzaman, M., Muzammil, S., Pillen, K., and Léon, J. (2014). Wild barley introgression lines revealed novel QTL alleles for root and related shoot traits in the cultivated barley (Hordeum vulgare L.). BMC Genet. 15:107. doi: 10.1186/s12863-014-0107-6
Ouellette, L. A., Reid, R. W., Blanchard, S. G., and Brouwer, C. R. (2018) LinkageMapView—rendering high-resolution linkage and QTL maps. Bioinformatics 34, 306–307. doi: 10.1093/bioinformatics/btx576
Pigliucci, M., and Preston, K. (2004). Phenotypic Integration: Studying the Ecology and Evolution of Complex Phenotypes. Oxford: Oxford University Press.
Poorter, H., Niklas, K. J., Reich, P. B., Oleksyn, J., Poot, P., and Mommer, L. (2012). Biomass allocation to leaves, stems and roots: meta-analyses of interspecific variation and environmental control. New Phytol. 193, 30–50. doi: 10.1111/j.1469-8137.2011.03952.x
Pordes, R., Petravick, D., Kramer, B., Olson, D., Livny, M., Roy, A., et al. (2007). The open science grid. J. Phys. Conf. Ser. 78:12057. doi: 10.1088/1742-6596/78/1/012057
Pound, M. P., French, A. P., Atkinson, J., Wells, D. M., Bennet, J. M., and Pridmore, T. (2013). RootNav: navigating images of complex root architectures. Plant Physiol. 162, 1802–1814. doi: 10.1104/pp.113.221531
R Core Team (2016). R: A Language and Environment for Statistical Computing. Vienna: R Foundation for Statistical Computing.
Rajasekar, A., Moore, R., Hou, C., Lee, C. A., Marciano, R., de Torcy, A., et al. (2010). iRODS Primer: integrated rule-oriented data system. Synth. Lect. Inf. Concepts Retr. Serv. 2:143. doi: 10.2200/S00233ED1V01Y200912ICR012
Rashotte, A. M., Carson, S. D. B., To, J. P. C., and Kieber, J. J. (2003). Expression profiling of cytokinin action in Arabidopsis. Plant Physiol. 132, 1998–2011. doi: 10.1104/pp.103.021436
Rogers, P., and Stevenson, W. (2006). Weather-based fungicide spray programs for control of two foliar diseases on carrot cultivars differing in susceptibility. Plant Dis. 90, 358–364. doi: 10.1094/PD-90-0358
Rosenfeld, H. J., Dalen, K. S., and Haffner, K. (2002). The growth and development of carrot roots. Gartenbauwissenschaft 67, 11–16.
Ruta, N., Stamp, P., Liedgens, M., Fracheboud, Y., and Hund, A. (2010). Collocations of QTLs for seedling traits and yield components of tropical maize under water stress conditions. Crop Sci. 50, 1385–1392. doi: 10.2135/cropsci2009.01.0036
Schneider, C. A., Rasband, W. S., and Eliceiri, K. W. (2012). NIH image to ImageJ: 25 years of image analysis. Nat. Meth. 9, 671–675. doi: 10.1038/nmeth.2089
Sfiligoi, I., Bradley, D. C., Holzman, B., Mhashilkar, P., Padhi, S., and Wurthwein, F. (2009). “The pilot way to grid resources using glideinWMS,” in Proceedings of the WRI World Congress on Computer Science and Information Engineering, Los Angeles, CA, 428–432. doi: 10.1109/CSIE.2009.950
Simon, P. W. (2000). Domestication, historical development, and modern breeding of carrot. Plant Breed. Rev. 19, 157–190. doi: 10.1002/9780470650172.ch5
Simon, P. W., Freeman, R. E., Vieira, J. V., Boiteux, L. S., Briard, M., Nothnagel, T., et al. (2008). “Carrot,” in Vegetables II: Fabaceae, Liliaceae, Solanaceae, and Umbelliferae, eds J. Prohens and F. Nuez (New York, NY: Springer), 327–357. doi: 10.1007/978-0-387-74110-9_8
Street, I. H., Shah, P. K., Smith, A. M., Avery, N., and Neff, M. M. (2008). The AT-hook-containing proteins SOB3/AHL29 and ESC/AHL27 are negative modulators of hypocotyl growth in Arabidopsis. Plant J. 54, 1–14. doi: 10.1111/j.1365-313X.2007.03393.x
Swanton, C. J., O’Sullivan, J., and Robinson, D. E. (2010). The critical weed-free period in carrot. Weed Sci. 58, 229–233. doi: 10.1614/WS-09-098.1
Thain, D., Tannenbaum, T., and Livny, M. (2005). Distributed computing in practice: the Condor experience. Concurr. Comput. Pract. Exp. 17, 323–356. doi: 10.1002/cpe.938
Turner, S. D., Maurizio, P. L., Valdar, W., Yandell, B. S., and Simon, P. W. (2018). Dissecting the genetic architecture of shoot growth in carrot (Daucus carota L.) using a diallel mating design. G3 8, 411–426. doi: 10.1534/g3.117.300235
Van Ooijen, J. (2011). JoinMap 4.1: Software for the Calculation of Genetic Linkage Maps in Experimental Populations. Wageningen: Kyazma B.V.
Vavilov, N. (1992). in Origin and Geography of Cultivated Plants, ed. V. Dorofeyev Great Britain (Cambridge: Cambridge University Press).
Vom Endt, D., Soares e Silva, M., Kijne, J. W., Pasquali, G., and Memelink, J. (2007). Identification of a bipartite jasmonate-responsive promoter element in the Catharanthus roseus ORCA3 transcription factor gene that interacts specifically with AT-hook DNA-binding proteins. Plant Physiol. 144, 1680–1689. doi: 10.1104/pp.107.096115
Wang, G.-L., Sun, S., Xing, G.-M., Wu, X.-J., Wang, F., and Xiong, A.-S. (2015a). Morphological characteristics, anatomical structure, and gene expression: novel insights into cytokinin accumulation during carrot growth and development. PLoS One 10:e0134166. doi: 10.1371/journal.pone.0134166
Wang, G.-L., Xiong, F., Que, F., Xu, Z.-S., Wang, F., and Xiong, A.-S. (2015b). Morphological characteristics, anatomical structure, and gene expression: novel insights into gibberellin biosynthesis and perception during carrot growth and development. Hortic. Res. 2:15028. doi: 10.1038/hortres.2015.28
Wold, H. (1982). “Soft modelling, the basic design and some extensions,” in Systems Under Indirect Observation, eds K.-G. Jöreskog and H. Wold (Amsterdam: North-Holland).
Wold, S., Ruhe, A., Wold, H., and Dunn, W. J. I. I. I. (1984). The collinearity problem in linear regression. The partial least squares (PLS) approach to generalized inverses. SIAM J. Sci. Stat. Comput. 5, 735–743. doi: 10.1137/0905052
Xiao, C., Chen, F., Yu, X., Lin, C., and Fu, Y.-F. (2009). Over-expression of an AT-hook gene, AHL22, delays flowering and inhibits the elongation of the hypocotyl in Arabidopsis thaliana. Plant Mol. Biol. 71, 39–50. doi: 10.1007/s11103-009-9507-9
Yildiz, M., Willis, D. K., Cavagnaro, P. F., Iorizzo, M., Abak, K., and Simon, P. W. (2013). Expression and mapping of anthocyanin biosynthesis genes in carrot. Theor. Appl. Genet. 126, 1689–1702. doi: 10.1007/s00122-013-2084-y
York, L., Nord, E., and Lynch, J. (2013). Integration of root phenes for soil resource acquisition. Front. Plant Sci. 4:355. doi: 10.3389/fpls.2013.00355
Zhao, J., Favero, D. S., Peng, H., and Neff, M. M. (2013). Arabidopsis thaliana AHL family modulates hypocotyl growth redundantly by interacting with each other via the PPC/DUF296 domain. PNAS 110, E4688–E4697. doi: 10.1073/pnas.1219277110
Keywords: carrot, plant breeding, shoot architecture, storage root shape, image-based phenotyping
Citation: Turner SD, Ellison SL, Senalik DA, Simon PW, Spalding EP and Miller ND (2018) An Automated Image Analysis Pipeline Enables Genetic Studies of Shoot and Root Morphology in Carrot (Daucus carota L.). Front. Plant Sci. 9:1703. doi: 10.3389/fpls.2018.01703
Received: 05 August 2018; Accepted: 01 November 2018;
Published: 27 November 2018.
Edited by:
Roberto Papa, Università Politecnica delle Marche, ItalyReviewed by:
Tania Gioia, University of Basilicata, ItalyPasquale Tripodi, Consiglio per la Ricerca in Agricoltura e l’Analisi dell’Economia Agraria (CREA), Italy
Copyright © 2018 Turner, Ellison, Senalik, Simon, Spalding and Miller. This is an open-access article distributed under the terms of the Creative Commons Attribution License (CC BY). The use, distribution or reproduction in other forums is permitted, provided the original author(s) and the copyright owner(s) are credited and that the original publication in this journal is cited, in accordance with accepted academic practice. No use, distribution or reproduction is permitted which does not comply with these terms.
*Correspondence: Edgar P. Spalding, c3BhbGRpbmdAd2lzYy5lZHU=