 Luis A. Rivera-Burgos
 Jeffrey J. Volenec
 Gebisa Ejeta
- Department of Agronomy, Purdue University, West Lafayette, IN, United States
Public appetite for fossil fuels continues to drive energy prices and foment the build-up of intractable environmental problems. Ethanol (ETOH) production from lignocellulosic biomass grown in marginal lands offers a sustainable alternative without diverting arable land from food and feed production. The quantity and quality of lignocellulosic biomass can be enhanced by the abundant genetic diversity for biomass production as well as stem sugar and lignin composition in sorghum (Sorghum bicolor L. Moench). The objective of this study was to assess yield and quality of lignocellulosic biomass enhancement for ethanol production potential in a population of sorghum derived from two cultivars with contrasting biomass yield and compositional traits. We tested 236 recombinant inbred lines (RIL) of sorghum in a randomized complete block design (RCBD) with two replications for lignocellulosic biomass performance and determined hemicellulose, cellulose and lignin concentrations through detergent fiber analysis (DFA). The stover compositional values were used to estimate theoretical ethanol yield (ETOH on a mass basis) and production (ETOH on an area basis). Results showed that RIL carrying the brown midrib mutation had significantly higher theoretical glucose recovery (released glucose from cellulose, > 200 g kg-1). Those carrying both mutations, had high theoretical ethanol yield (>400 L ton-1) and high theoretical ethanol production (>14,500 L ha-1). Lignin concentration was determined as most reliable predictor (R2 = 0.67) for glucose recovery. Lignin and stem sugar concentrations (R2 = 0.46 and 0.35, respectively) were good predictors for ethanol yield. Stover yield traits (R2 = 0.89) were most important determinants for ethanol production. Our findings suggest that careful breeding of sorghum for genetic enhancement of biomass quantity and quality could double lignocellulosic ethanol yields.
Introduction
Fossil fuel dependency and increased greenhouse gases are major concerns that have caught the attention of environmentalists, economists, as well as scientists. Fossil fuel is a non-renewable source of energy, with its production and utilization generating gases, associated with environmental pollution as well as causing respiratory health problems. However, rapid expansion of the global economy sustains an insatiable hunger for energy, leading to a strong dependency on fossil fuel products. This dependency creates a growing consumer demand that raises petroleum product prices affecting the economy within and among countries (Davis et al., 2008).
A large volume of lignocellulosic biomass is produced from a number of crops every year. Field crops produce considerable amounts of both grain and stover. Grain from crops is harvested and used for human (food) and animal (feed) consumption, while stover (lignocellulosic biomass) is often left unharvested on-farm every crop season (Nelson et al., 2011). Though some may consider the stover left on-farm a waste, agronomists recognize the value of crop residues for reducing soil erosion and building soil organic matter (Gupta and Verma, 2015).
Sorghum research conducted over the last several years has generated interest in this stress-tolerant species as a potential biomass crop for lignocellulosic feedstock and energy production (Rooney et al., 2007). Knowledge on the genetics of several lignocellulosic traits in sorghum is also growing, albeit slowly due to a constrained research funding environment. The sweet-stalk phenotype appears to be a quantitatively inherited trait, controlled by multiple loci. Recent genetic analyses have placed quantitative trait loci (QTL) for stem sugar concentration on four chromosomes (3, 5, 6, and 7). These QTL generally explain from 11% to 21% of the total variation for stem sugar concentration (Ritter et al., 2008; Murray et al., 2008a; Murray et al., 2009). It is suggested that environmental factors as well as additional unidentified QTL likely affect the expression of this trait.
Brown midrib mutants have been identified in maize (Zea mays) and sorghum (Sorghum bicolor) by either spontaneous or chemical mutagenesis. Five brown midrib (bm1 through bm5) loci have been identified, extensively studied, and genetically characterized in maize. The brown midrib phenotype (reddish-brown coloration) is correlated with two homologous loci in maize (bm1 and bm3) and sorghum (bmr6 and bmr12). In both grasses, the brow midrib phenotype is associated with reduced lignin concentration and increased livestock digestibility (Sattler et al., 2010).
The brown-midrib (bmr) mutation in sorghum, caused by single-point mutations in genes involved in cell wall composition, generally reduces lignin concentration. The bmr mutants are visually identified by the reddish-brown coloration in the midrib of sorghum leaves that is associated with low lignin concentration. Several bmr mutant lines were identified at Purdue University from a chemical mutagenesis study aimed at improving sorghum forage quality (Porter et al., 1978). The bmr mutant collection was tested for allelism and they fall into four bmr groups, all causing reduced lignin concentration in sorghum lignocellulosic biomass (Saballos et al., 2008). Group 1 mutants include bmr3, bmr4, bmr6, bmr27, and bmr28; Group 2 mutants contain bmr7, bmr12, bmr18, bmr25, and bmr26; Group 3 mutants include bmr19 only; and allelic Group 4 includes bmr2, bmr5, and bmr14. From these groups, two genes have been identified to be involved in the lignin biosynthetic pathway. One identified gene that belongs to allelic group 1, is located on chromosome 3, and affects cinnamyl alcohol dehydrogenase (CAD) activity during lignin biosynthesis. The CAD is encoded by a multi-gene family consisting of members thought to have distinct roles (Palmer et al., 2008; Saballos et al., 2008). Another locus on chromosome 7, belonging to allelic group 2, is responsible for low activity of the enzyme caffeic acid o-methyltransferase (COMT) (Bout and Vermerris, 2003). This enzyme also plays an important role during lignin biosynthesis in sorghum.
Stover lignin concentration plays an important role during enzymatic hydrolysis of cellulose. During this process, increased amount of lignin prevents the attachment of the hydrolytic enzyme to cellulose, and leads to a low yield of fermentable sugars. Therefore, high concentration of lignin in stover could lead to low ethanol yields (Sun and Cheng, 2002; Ohgren et al., 2007).
Traditionally, commercial lignocellulosic ethanol production is based on conversion of non-structural carbohydrates (soluble carbohydrates) or structural carbohydrates (hemicellulose and cellulose) to ethanol. Soluble carbohydrates (sucrose, glucose, and fructose) are generally referred to fermentable sugars and these accumulate in stems of crops like sugarcane (Saccharum officinarum) and sweet sorghums (Han et al., 2013). Due to the simple biochemical structure of these fermentable sugars, they can be converted to ethanol in a single step known as simultaneous saccharification-fermentation (SSF) (Saballos et al., 2008).
Structural carbohydrates form part of the plant cell wall and are tightly linked to lignin. During biomass conversion, these complex sugars undergo three different processes to produce ethanol as their final product. The first process separates lignin from the complex carbohydrates using pretreatment of hot sulfuric acid (Dien et al., 2006). The second process hydrolyzes the complex carbohydrates (cellulose and hemicellulose) to simple carbohydrates and the third process ferments simple carbohydrates to ethanol (Sun and Cheng, 2002; Dien et al., 2006; Sticklen, 2008; Canilha et al., 2012). These processes suggest that the combination of both sources of carbohydrates in one crop is highly desirable to increase ethanol production from lignocellulosic biomass (Rooney et al., 2007).
A genetically enhanced biomass that combines both sources of carbohydrates, maximizing the soluble carbohydrate pool, but also making the structural carbohydrates of cell walls readily fermentable, increases the value of a feedstock (Oliver et al., 2005; Vogler et al., 2009; Gírio et al., 2010; Vogel et al., 2011). We hypothesize that the combination of two compositional mutations segregating in brown × sweet sorghum recombinant inbred lines (RIL) would increase the fermentable carbohydrate pool of feedstock. The objectives of this study were: 1) To assess biomass component traits of bmr x sweet sorghum RIL; 2) To determine the concentration of cellulose, hemicellulose and lignin (compositional traits) of bmr × sweet sorghum RIL; 3) To estimate theoretical glucose recovery, theoretical ethanol yield, and theoretical ethanol production from two sources of carbohydrates; and 4) To determine suitable predictors associated with theoretical ethanol.
Materials and Methods
Plant Material
A population consisting of 236 RIL was evaluated in a 2-year study. The population was developed through seven generations of single-seed descent selection from the original F2 population of a cross between two lines, bmr12 (a brown midrib, low lignin sorghum) and Brown County (a sweet sorghum) as parents. Additionally, a forage sorghum cultivar (bmrAtlas) with an introgressed bmr 12 gene was included as control.
Field Experiment
The experiment was planted in late May at the Agronomy Center for Research and Education (ACRE) in West Lafayette, Indiana (40°29’41.67”N; 86°59’26.46”W). The soils at ACRE consist of Drummer silty clay loam (fine-silty, mixed, superactive, mesic Typic Endoaquolls) and Raub silt loam (fine-silty, mixed, superactive, mesic Aquic Argiudolls) (United States Department of Agriculture, 2014). Mean air temperature and precipitation at ACRE during the crop seasons of 2008 and 2009 are shown in Table 1. Rainfall totals for the growing season (May–October) in 2008 and 2009 were 586.0 and 631 mm, respectively. Monthly mean temperatures (average monthly minimum and maximum) for the growing season for each year were 18.3ºC (3.3–28.5 ºC) in 2008 and 18.0ºC (4.0–28.0ºC) in 2010 (Indiana State Climate Office, 2014).
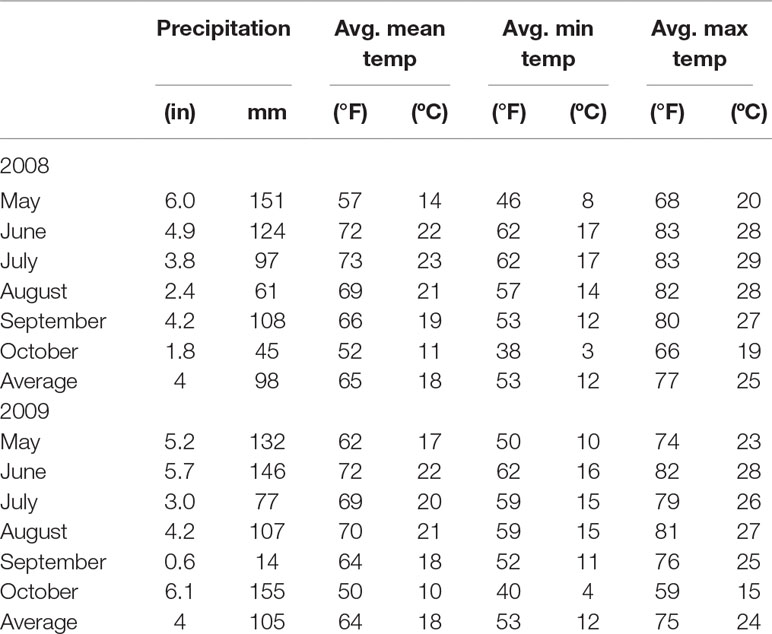
Table 1 Mean air temperature and precipitation at Lafayette IN during the crop season of 2008 and 2009.
All RIL, both parents, and bmrAtlas were each planted in two-row plots. Dimensions of each plot were 6.10 m long with 0.76 m spacing between rows. Approximately 2.5 grams sorghum seed row-1 was planted at a depth of 5 cm. The seeds were treated with a fungicide prior to planting to ensure better seedling emergence and stand establishment. Three weeks after planting, plots were thinned to 6 plants per 30 cm for an approximate plant population of 250,000 plants per hectare. Urea ammonium nitrate was applied and incorporated at a rate of 150 kg N per hectare.
Biomass and Stem Sugar Measurements
Plant maturity (PM) of grain was defined as 45 days after flowering date. Based on flowering dates, RIL were placed into three PM groups in order to minimize confounding differences of PM in biomass component and compositional traits. Stem sugar concentrations (SSC) were estimated as degrees Brix (ºBrix) of each RIL, parents and commercial control at PM. For each plot, four plants located in the middle region of each row were randomly collected and stem internodes between the fourth and the fifth node squeezed with a garlic press to obtain the stem juice. A digital refractometer (ATAGO Model PAL-1) was used to measure Brix (One degree Brix is 1 g of soluble sugars in 100 g of solution) (Han et al., 2013). The average of the four brix measurements per plot was used to determine soluble carbohydrates. At harvesting time of each PM group (Stage 9), a sample plot of 10 plants (5 from each row) was randomly selected from the middle region of each plot. Panicles were removed, and the weight of leaves and stems was recorded as fresh stover yield (FSY) per plot. These 10 plants were passed through a tractor-powered mechanical chopper, chopped leaves and stems mixed, and a subsample of 300 g was weighed, dried in a forced-air dryer for 3–4 days at 60ºC, and dry stover subsample weight was recorded. Dry stover yield (DSY) per plot was calculated by dividing the dry stover subsamples weight by fresh stover subsample weight and multiplying by FSY per plot (Murray et al., 2008b). Dry stover subsamples were ground to initially pass a 6-mm screen (Wiley Mill, Thomas Scientific, Swedesboro, NJ), then re-ground to pass a 1-mm screen using a cyclone sample mill (Udy Corp., Fort Collins, CO) for laboratory analysis.
Detergent Fiber Analysis (DFA)
Hemicellulose and cellulose of stover of 236 RIL were analyzed by modified filter bag technology using ANKOM 2000 instrument (ANKOM Tech., Corp., NY) (Vogel et al., 1999; Wu et al., 2006; Lemus et al., 2008; Anderson et al., 2009). Two modifications were made for neutral detergent fiber (NDF), acid detergent fiber (ADF), and acid detergent lignin (ADL) analyses: a) two empty bags were included in each run as an indicator of bag mass loss during the extraction; one empty bag was placed in the first tray, and the other in last tray to determine the blank bag correction; b) filter bags were dried overnight at 45ºC before to proceeding to next analysis step. Hemicellulose concentration was calculated by subtracting ADF concentration from the NDF concentration. Cellulose concentration was calculated by subtracting ADL concentration from the ADF concentration. Finally, lignin concentration was determined as mass loss following the ashing of the ADF.
Theoretical Ethanol Calculations
Glucose recovery formulas reported in the literature were inadequate for brown × midrib RIL since they did not account for the advantage of reduced lignin. Theoretical glucose recovery (TGR) from cellulose was estimated by a modified equation (Vogel et al., 2011):
where GRE is the glucose recovery efficiency, and 1.1111 is the glucan hydrolysis coefficient (Vogel et al., 2011). The GRE was calculated as follows (Dien et al., 2009):
These modifications adjusted for the differences in lignin concentration among the RIL.
Theoretical xylan recovery (TXR) from hemicellulose was estimated as follows (Anderson et al., 2009; Vogel et al., 2011):
where 1.1353 is the hydrolysis coefficient for xylan.
Theoretical ethanol yield (TETOHY) from cellulosic glucose and hemicellulosic-derived xylan (L ton-1) were estimated as follows (Vogel et al., 2011):
where 0.51 is the fermentation coefficient and 1.2674 is the ethanol specific volume. On a unit basis, ml kg-1 = L ton-1.
TETOHY from soluble sugars (SS) in L ton-1 was estimated based on an adjusted version of formulas used by Han et al. and Vogel et al. (Vogel et al., 2011; Han et al., 2013):
where FSY is fresh stover yield, Brix% is concentration of SS in stem juice (Brix value/100), 0.90 is soluble sugars recovery efficiency (sugar yield) and FSY* is fresh stover yield used to estimate L of ethanol per ton. On a unit basis, ml g-1 = L kg-1.
Therefore, TETOHY (L ton-1) from two sources of carbohydrates (structural and SS) was calculated as:
Theoretical ethanol production (TETOHP) from cellulosic glucose and hemicellulose-derived xylan (L ha-1) were estimated as follows:
where DSY is dry stover yield (ton ha-1) in both formulas.
TETOHP from SS (L ha-1) was estimated as follows:
Therefore, TETOHP (L ha-1) from two sources of carbohydrates (structural and SS) was calculated as:
Statistical Analyses
The experimental design for the field evaluation was a randomized complete block with two replications conducted in 2008 and 2009. PROC MIXED procedure (Type III) of SAS 9.3 was used to determine genetic variation and mean differences among RIL. The RIL were considered a fixed effect, Year and Year × RIL interactions were considered random effects. The RIL were assembled into four phenotypic groups to allow a more detailed analysis among contrasting phenotypes. Based on their genetic recombination status (“normal,” “sweet,” “brown,” and “brown-sweet”), the “normal” (non-brown; non-sweet) group was formed by 43 RIL without brown midribs or high stem sugar concentrations (Brix < 12). The “sweet” (non-brown; high stem sugar) group was formed by 108 RIL that carried a mutation for high stem sugar concentration (Brix ≥ 12), but did not have brown midribs. The “brown” (non-sweet; low lignin) group contained those RIL that had brown midribs but were not sweet (10 RIL). The fourth group named “brown-sweet” (recombinants of low-lignin and high stem sugar) were 75 RIL that carried both mutations, one for low lignin (brown midrib) and another for high stem sugar concentration (Brix ≥ 12). We dubbed this group the double mutant group because of the two mutations its members carry. This grouping allowed us to obtain three orthogonal contrasts. The first linear combination compared the double mutant group (“brown-sweet”) against the “normal” RIL group. The second linear combination compared the double mutant group against the “sweet” group. The last linear combination compared the double mutant group against the “brown” group.
Predictors of Glucose Recovery and Theoretical Ethanol
The PROC REG procedure of SAS 9.3 was used to determine suitable estimators associated with TGR, TETOHY, and TETOHP. The following formula was used to estimate the predictors:
where X is the explanatory variable and Y is the dependent variable. X was represented by NDF, ADF, cellulose, hemicellulose, lignin (g kg-1), SSC (ºBrix), FSY and DSY (ton ha-1). The slope of the line is b1 and b0 is the intercept.
Results
Biomass Traits
RIL and Year effects showed significant variation for FSY and DSY. The Year × RIL interaction was only significant for FSY (Table 2). The significant variation observed in biomass traits for the Year effect and the Year × RIL interaction effect could be explained by difference on precipitation rates and temperatures between years. Interestingly, the “sweet” and “brown-sweet” RIL groups produced significantly higher FSY than the “normal” and “brown” RIL groups, but not to the parental lines and the control (Table 3). The “sweet” RIL group produced significantly higher DSY than the “normal” and “brown” RIL groups, but not to the “brown-sweet” RIL group, the parental lines and the control. This is consistent with the high yield reported in the literature for FSY and DSY in sweet sorghums (Ritter et al., 2008; Murray et al., 2008a). Furthermore, while bmr plants (“brown” RIL group) are typically smaller than those of “sweet” RIL, when the bmr mutation is combined with the sweet mutation, as in the “brown-sweet” RIL group, the low biomass quantity associated with the bmr mutation background effects appear to be compensated for (Rivera-Burgos, 2015).
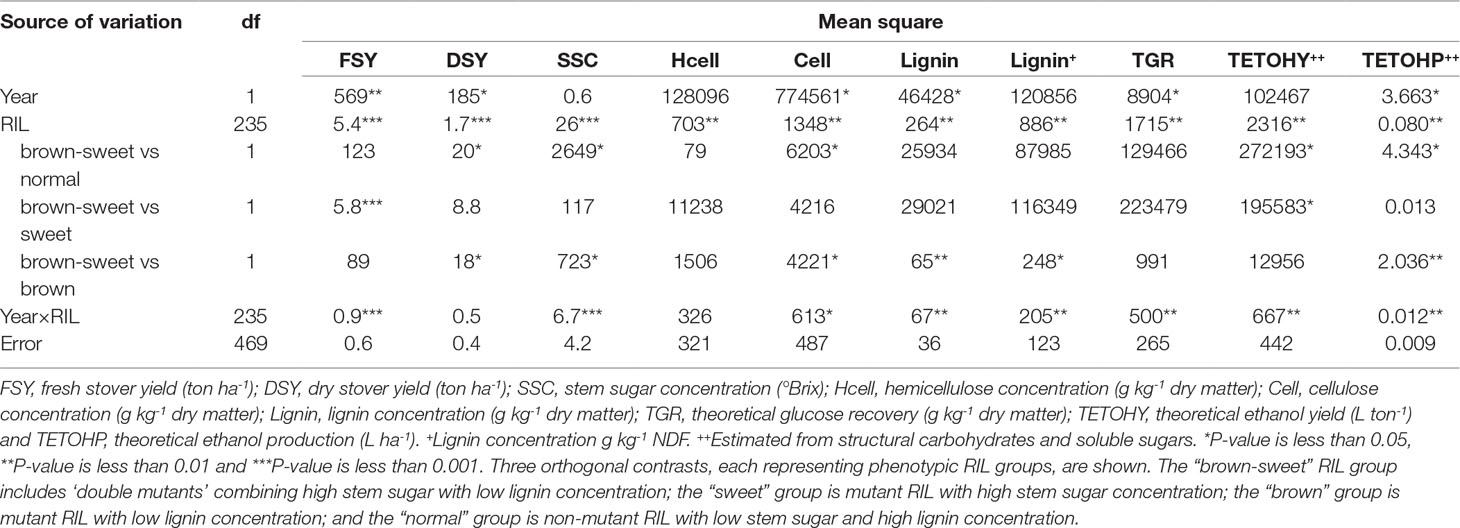
Table 2 Analysis of variance (ANOVA) for biomass compositional traits, and theoretical ethanol traits of brown midrib × sweet sorghum lines over two years.
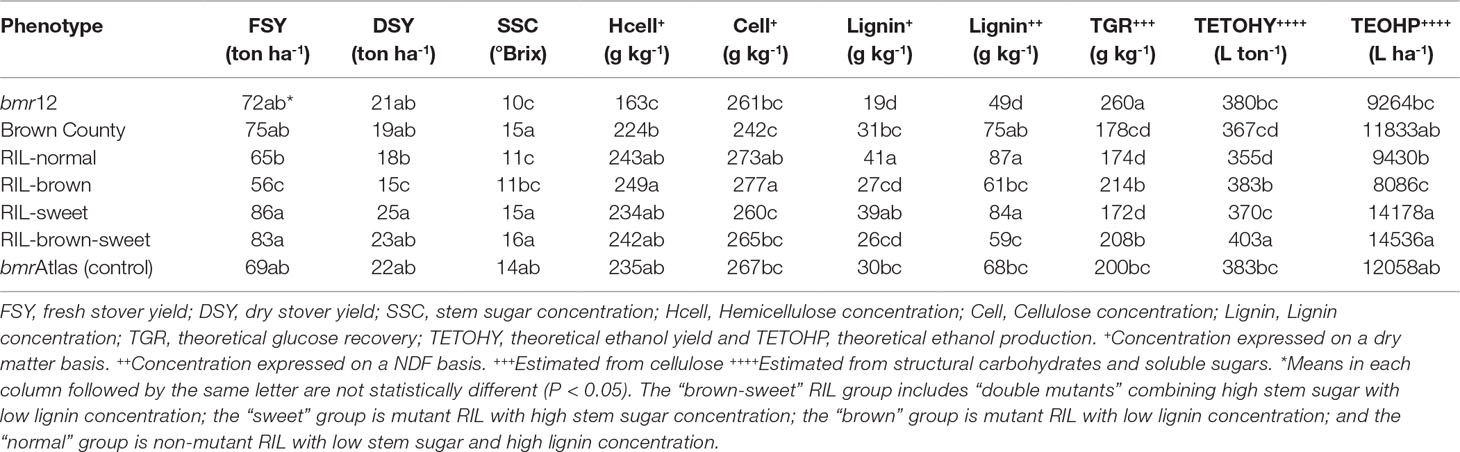
Table 3 Mean agronomic (FSY and DSY), compositional (SSC, hemicellulose, cellulose, and lignin), and theoretical ethanol related traits (TGR, TETOHY, and TETOHP) of parental lines (bmr12 and Brown County), a commercial control genotype bmrAtlas, and four phenotypic RIL groups.
Stover Carbohydrates and Lignin
RIL effect and the Year × RIL interaction effects showed significant variation for SSC (Table 2). The observed variation is explained by phenotypic difference among RIL, and its interaction with precipitation rates and temperatures between years. Not surprisingly, SSC of the “brown-sweet” and “sweet” RIL groups were significantly higher than the other two RIL groups (Table 3). However, SSC in these RIL groups were not significantly higher than in Brown County and the control bmrAtlas. This high stover quality parameter taken together with the superiority of these RIL groups to the others in measures of stover quantity, all factors in the estimation of theoretical ethanol yield, suggests superior ethanol production from these sorghum lines.
We observed significant variation in Year effect and the Year × RIL interaction effects for cellulose and lignin concentration, but not for hemicellulose concentration. This suggests that hemicellulose concentration is less affected by environmental factors (i.e., precipitation rates, temperatures, et.) than cellulose and lignin (Tables 1 and 2). The mean comparison for cellulose showed that the “brown” and the “normal” RIL groups had higher cellulose concentration when compared to the “sweet” RIL group and Brown County, but lower than the “brown-sweet” RIL group, the control, and bmr12 (Table 3). This would be anticipated because as concentrations of one carbon pool (soluble sugars in this case) increase, other carbon pool concentrations must decrease, and cellulose declines were in this case significant. Hemicellulose concentrations were more consistent, and no significant differences were observed among RIL groups (Table 3). The most striking difference among the RIL groups was observed in lignin concentration. Here, the bmr members of the RIL population (“brown” and “brown-sweet”) showed significantly lower lignin concentration (∼26.5 g kg-1) than the other two RIL groups (∼40 g kg-1). This represents 60% less lignin concentration in the stover of the bmr RIL relative to the others, presumably making the other structural carbohydrates more available to enzymatic hydrolysis (Table 3). Based on the negative effect of high concentration of lignin on biomass conversion to ethanol, it is expected that the “brown” and the “brown-sweet” sorghum will yield more ethanol (Dien et al., 2009).
Theoretical Glucose Recovery, Ethanol Yield, and Ethanol Production
The RIL showed significant differences in TGR from cellulose (Table 2). This means that TGR from at least one RIL was significantly higher than the others. Year effect and Year × RIL effects were also significant for TGR. These variations were associated with the effects of precipitation rates and temperatures between years in the RIL performance (Table 1). The “brown” and the “brown-sweet” RIL groups showed greater TGR from cellulose than the other two RIL groups (Table 3). This supports the hypothesis that lower lignin concentration exposes more structural carbohydrates, like cellulose and hemicellulose, to the process of enzymatic hydrolysis, where they are converted to fermentable sugars. Although TGR levels of the RIL with the bmr mutation was not significantly higher than the bmr donor, bmr12, these RIL showed significantly higher estimates of TGR in comparison to the sweet parent, Brown County and the RIL without the bmr mutation (Table 3). As expected, bmrAtlas showed greater TGR from cellulose than the RIL groups without the bmr mutation (“normal” and “sweet”), and was similar to the “brown” and “brown-sweet” RIL groups. Interestingly, bmrAtlas and Brown County showed similar TGR from cellulose. This supports our hypothesis that genetic background differences could play a major role in enzymatic hydrolysis of lignocellulosic biomass (Table 3).
The TGR from cellulose of individual RIL of the brown midrib × sweet population plotted against lignin concentration of individual RIL shows that cell wall lignin concentration is negatively associated with TGR (Figure 1). Linear regression revealed that 67% of the variability in TGR from cellulose could be explained by stover lignin concentration. The slope of −2.1 indicates that for a reduction of 1 g of lignin per kg of dry matter you can expect TGR to increase by an average of 2.1 g per kg. In this population, 67 RIL, all carrying the brown midrib mutation yielded above 200 g/kg of glucose upon hydrolysis of their lignocellulosic biomass (Figure 1). These results portend that this trait improves the quality of lignocellulosic biomass in terms of predicted glucose recovery per unit biomass in this population. Even more, it supports the hypothesis that structural carbohydrates, like cellulose, are more readily available to digestive processes when less lignin is there to bind them (Dien et al., 2009).
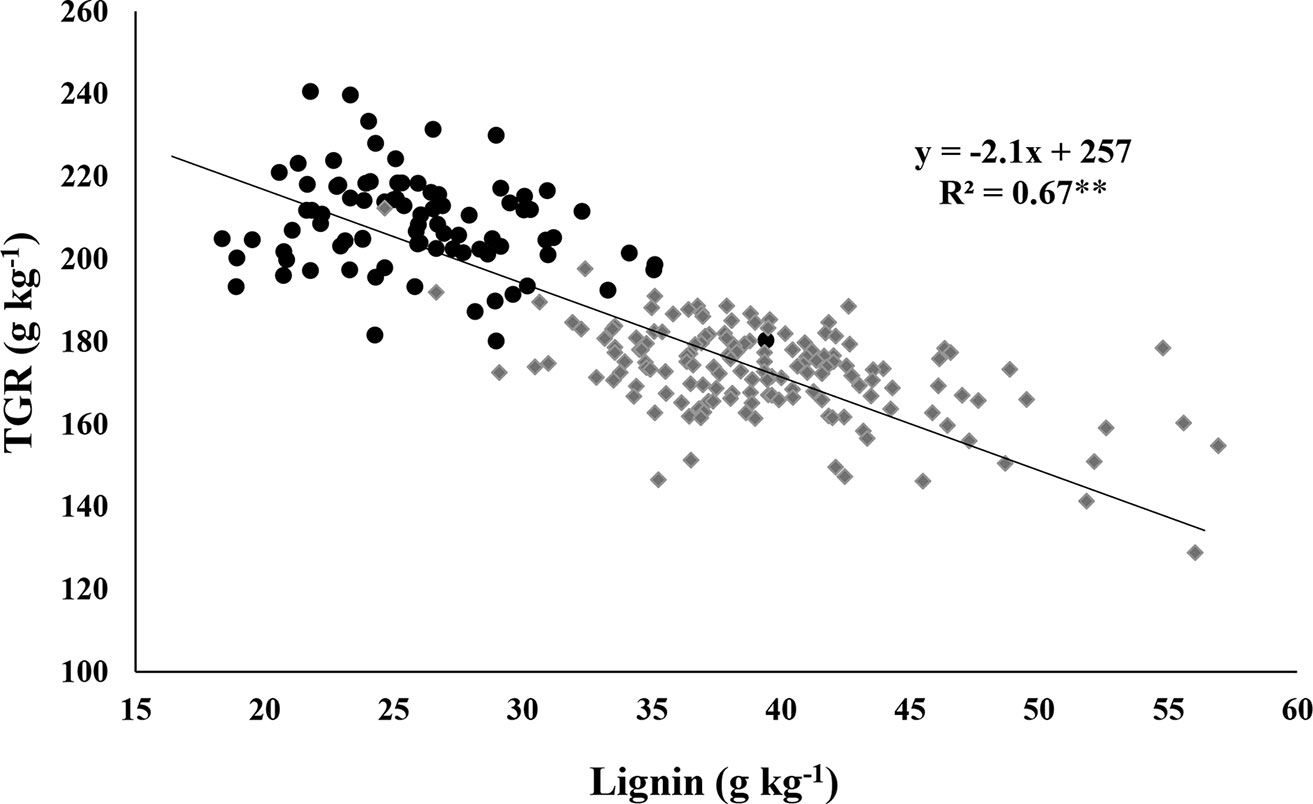
Figure 1 Distribution of theoretical glucose recovery (TGR) from cellulose and lignin measured from stover samples of individual RIL averaged over two years. Data points appearing as black circles represent RIL with brown midribs (“brown” and “brown-sweet” groups), those as grey diamonds are RIL with non-brown midribs (“normal” + “sweet” groups). **Significance at P < 0.01.
The TETOHY is a function of the amount of structural carbohydrates and non-structural sugars present in stover that is ultimately available for fermentation (Figure 2). Significant differences were observed among RIL, indicating that at least one RIL is capable of producing significantly higher amounts of theoretical ethanol than the others, based on stover compositional traits (Table 2). The Year × RIL interaction was also significant. This interaction was due to the effects of precipitation rates and temperatures between years on the performance of RIL (Table 1). In the mean comparison, the “brown-sweet” RIL group was capable to yielding significant higher amounts of TETOHY than the other three RIL groups (Figure 2). The TETOHY mean comparison showed the double mutant RIL group (“brown-sweet”) as first in rank, yielding a significant amount of 403 L ton-1 (Table 3 and Figure 2). This high predicted ethanol yield per ton of biomass was possible because sorghums not only have more sugars in their stems, carbohydrates that do not require hydrolysis before being fermented, but they also have increased availability to hydrolysis of the structural carbohydrates, cellulose and hemicellulose, due to reductions in lignin relative to non-bmr RIL. Consistent with our hypothesis, we found that combining the high stem sugar concentration and bmr mutations into a single line, increased the soluble non-structural carbohydrates (sugars in the stems), thereby maximizing ethanol yields (Murray et al., 2008a; Vogel et al., 2011). No significant differences were observed among TETOHY of the low lignin germplasm material including the “brown” RIL group, bmrAtlas and bmr12 (genotypes with the bmr mutation).
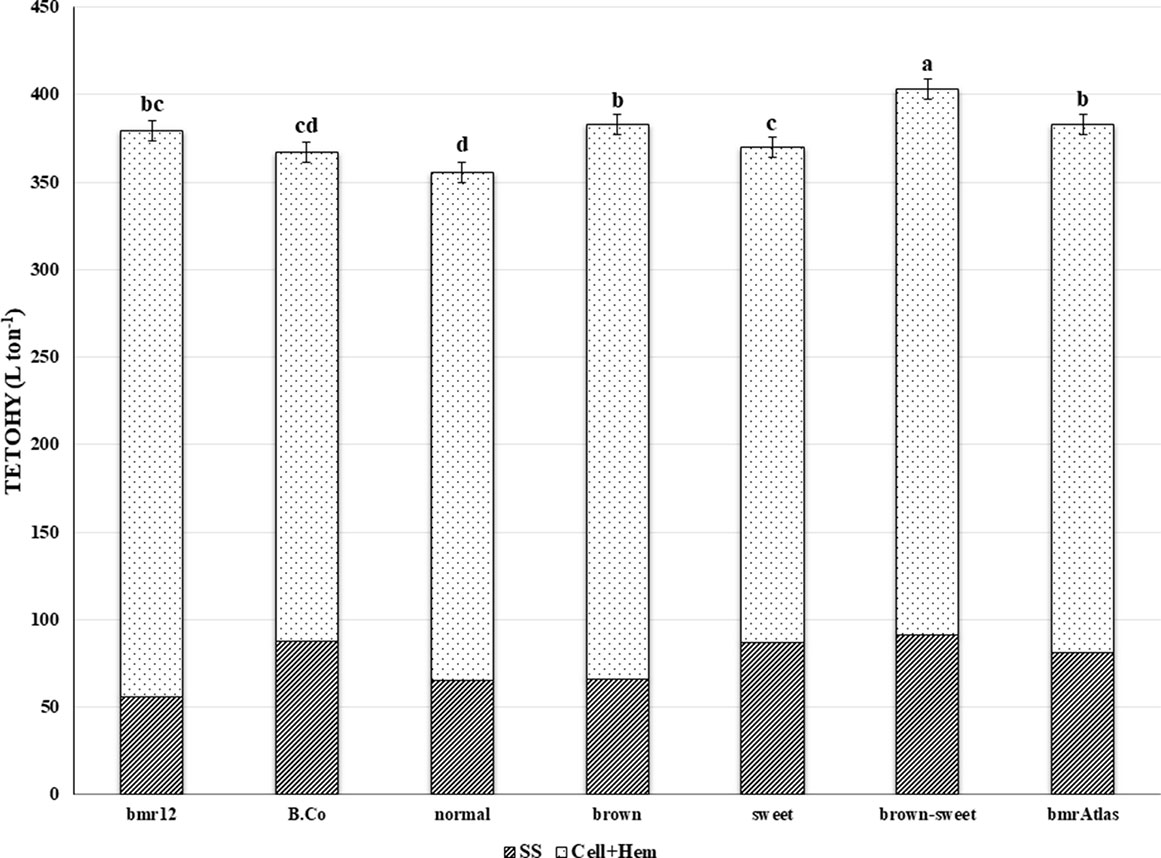
Figure 2 Mean theoretical ethanol yield (TETOHY) from two sources of sorghum stover carbohydrates. Striped bars represent TETOHY from soluble sugars (SS) and the dotted bars represent TETOHY from cellulose and hemicellulose (Cell+Hem) estimates of bmr parent (bmr12), sweet stem parent (B.Co), four RIL groups (“brown-sweet,” “brown,” “sweet,” and “normal”) and a commercial control (bmrAtlas). Bars without the same letter are significantly different (P < 0.05). Error bars represent ± one standard error of the mean.
Similar to TETOHY, ETOHP is also a function of structural and non-structural carbohydrates present in lignocellulosic biomass (Figure 3). However, this variable also accounts for biomass productivity (Vogel et al., 2011). In the combined ANOVA of TETOHP there were significant differences among the RIL; and significant Year effects and Year × RIL interaction effects were also observed due to differences in precipitation rates and temperatures between years (Table 1). Within RIL, the “brown-sweet” vs. “normal” and “brown-sweet” vs. “brown” were significant. This indicates that the “brown-sweet” RIL group would be expected to produce higher amounts of ethanol than the “normal” and the “brown” RIL groups. The “brown-sweet” RIL group and the “sweet” RIL group were predicted to produce 14,536 and 14,178 L ha-1, respectively, and these values were not significantly different from each other (Table 3). This is likely much more due to the superior biomass quantity characteristic of the sweet sorghums which tend to be tall plants with thick stems and more leaves than non-sweet sorghums (Rivera-Burgos, 2015). The Brown County parent (with sweet stalk but normal lignin), and the bmrAtlas (with low lignin but normal sugar) were predicted to produce 11,883 and 12,058 L ha-1 of ethanol, respectively. These amounts were not significantly different from the “brown-sweet” and “sweet” RIL groups. Predicted ethanol production of the “normal” and “brown” RIL groups similar (9,430 and 8,086 L ha-1, respectively), and these two RIL groups were not predicted to produce as much ethanol as the “brown-sweet” and the “sweet” RIL groups (Figure 3).
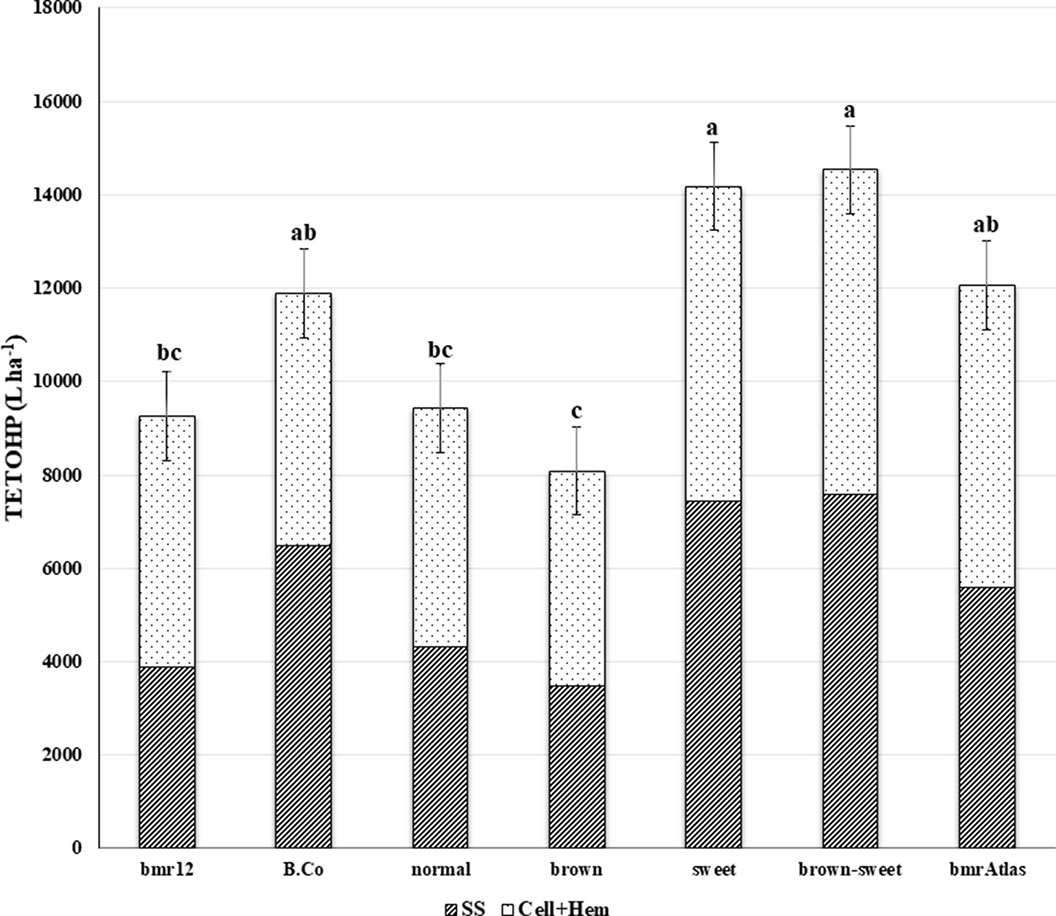
Figure 3 Mean theoretical ethanol production (TETOHP) from two sources of sorghum stover carbohydrates. Striped bars represent TETOHP from soluble sugars (SS) and the dotted bars represent TETOHP from cellulose and hemicellulose (Cell+Hem) estimates of bmr parent (bmr12), sweet stem parent (Brown County), four RIL groups (“brown-sweet,” “brown,” “sweet,” and “normal”) and a commercial control (bmrAtlas). Bars with different letters are significantly different from each other (P < 0.05). Error bars represent ± one standard error of the mean.
Predictors of Theoretical Glucose Recovery, Ethanol Yield, and Ethanol Production
Table 4 shows three possible predictors for TGR in the bmr × sweet sorghum population as a whole (all 236 RIL). Lignin, hemicellulose and cellulose concentration explained 66%, 11%, and 8% of the variation in glucose recovery, respectively. Most importantly, lignin concentration was negatively correlated with TGR, while hemicellulose and cellulose concentrations were positively correlated. Lignin concentration therefore emerged as best predictor of TGR from cellulose in our bmr × sweet sorghum population (Oliver et al., 2005).
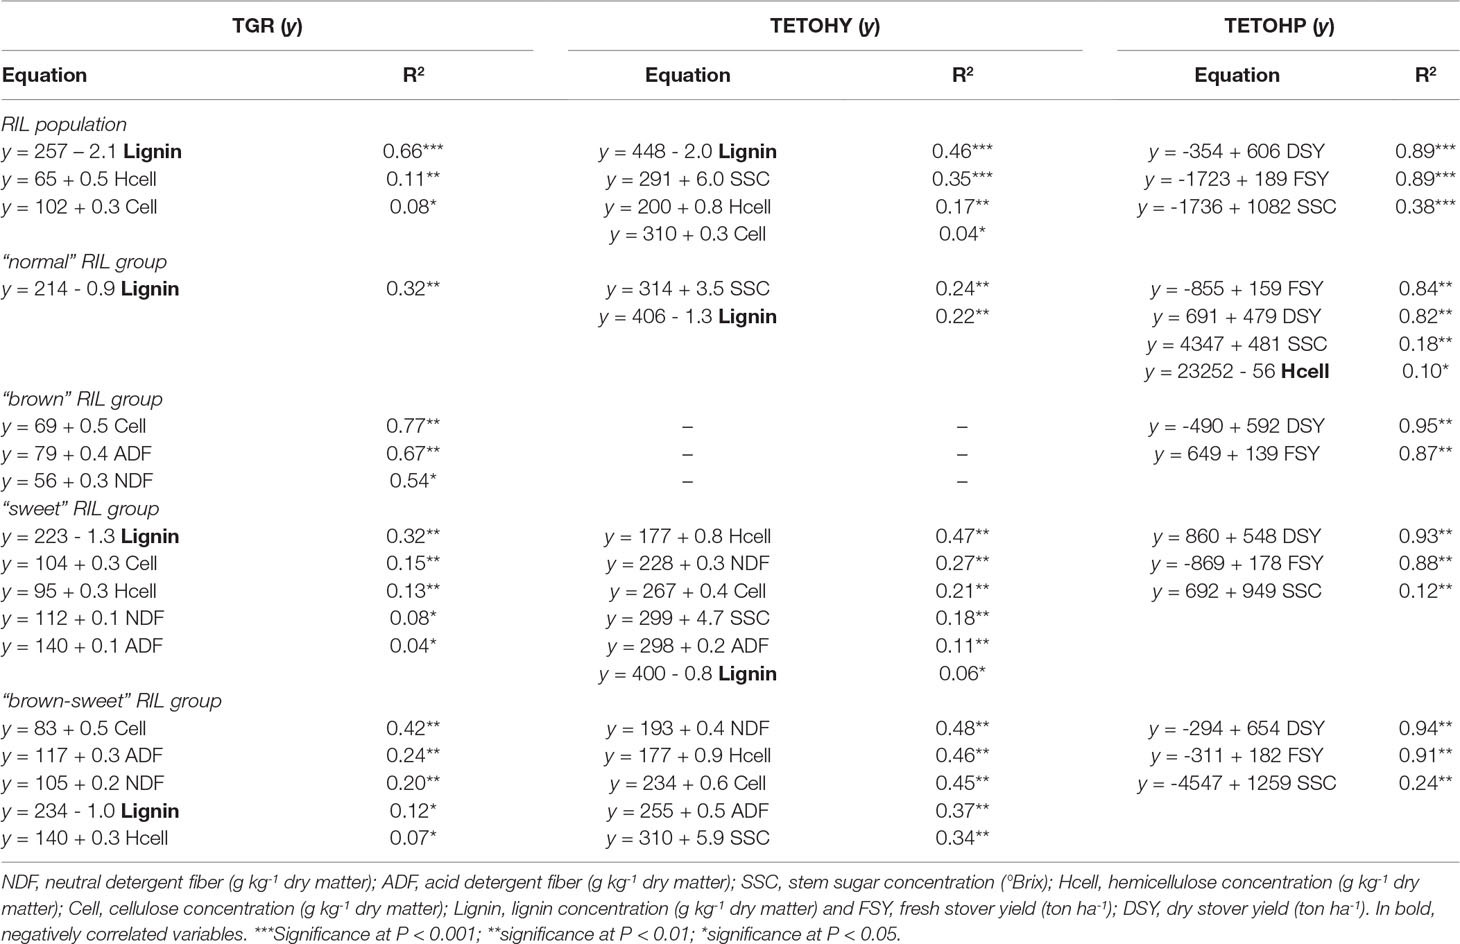
Table 4 Prediction estimates for theoretical glucose recovery (TGR), theoretical ethanol yield (TETOHY), and theoretical ethanol production (TETOHP) in the entire RIL population as well as the contrasting phenotypic groups.
when the same analysis was applied to the RIL grouped according to whether or not they carried the two quality mutations (Table 4), the predictive power of other components for glucose recovery became apparent. Within the “brown-sweet” and “brown” RIL groups, cellulose explained 42% and 77% of the total variation in TGR from cellulose, respectively. Lignin concentration within these groups, of course, did not vary greatly since they all contained the bmr mutation and so all had generally reduced lignin concentration with respect the non-bmr members of the population. Therefore, the contributions of the other predictors in these two groups are unmasked. The ADF concentration, that includes both lignin and cellulose, and the NDF concentration, that includes cellulose, hemicellulose and lignin, also explained some of the variation in TGR from cellulose. For the “brown-sweet” RIL group, ADF and NDF concentrations explained 24% and 20% of the variation in TGR from cellulose respectively. For “brown” RIL group, ADF and NDF concentrations explained 67% and 54%, respectively. Within the “sweet” and “normal” RIL groups, lignin concentration explained 32% of the variation in TGR from cellulose in both groups. This reflects the presence of background variation in lignin concentration among “normal” lines not carrying the bmr mutation, although, this variation was not as great as when comparing to the bmr lines that carry a mutation for low lignin concentration. The variation in lignin concentration within these groups was enough, however, to show even here that lignin concentration is an excellent predictor of TGR from cellulose, the only significant one within the “normal” RIL group and the major one within the “sweet” RIL group. In the latter group, cellulose and hemicellulose were also highly significant predictors of TGR from cellulose at 15% and 13%, respectively, with less significant determinants being NDF (8%) and ADF (4%) (Dien et al., 2006; Dien et al., 2009).
The TETOHY shows a slightly different trend when compared to TGR, though lignin (46%) still emerged as a major predictor in the RIL population (Table 4). Included here, SSC (35%) representing the contribution of soluble carbohydrates, also emerges as a major predictor of TETOHY over the entire population (Table 4).
when the linear relationships between lignocellulosic biomass components are considered within each RIL group (Table 4), other determinants become apparent. Since both lignin concentration and SSC are co-confounded in the “brown-sweet” RIL group, that is, all member lines having relatively low lignin concentration and a high SSC, many suitable predictors were observed. The concentrations of NDF, hemicellulose, cellulose, and ADF explained 48%, 46%, 45%, and 37% of the variation in TETOHY in this group, respectively. Interestingly, even SSC explained 34% of the variation in ethanol yield, reflecting the high variation of Brix measurements among these “brown-sweet” lines grouped here because their SSC exceeded 12ºBrix. This reflects the more complex genetics of the sweet mutation compared to that of the bmr mutation. Within the “sweet” and “normal” RIL groups, SSC (18% and 24%, respectively) were significant predictors of TETOHY. Here again, there was enough variation among the members lines in Brix measurements to see associations with ethanol yield. This was also true for lignin concentration, even though neither group contained individuals with brown midribs (Dien et al., 2009).
Ethanol production is highly dependent on the quantity of biomass that is used as feedstock. It was observed significantly positive linear associations of TETOHP with DSY, FSY and SSC for all 236 RIL of the bmr × sweet sorghum population (Table 4). DSY and FSY, explained most of the total variation for TETOHP, each accounting for 89%. This means that biomass quantity is the most important determinant of ethanol production. There is also a strong association, though less than half of the stover yield measures, of the biomass quality factor, SSC which explained 38% of TETOHP variation over the entire population.
The biomass quantity parameters (DSY and FSY) were also the major predictors of TETOHP when the population was analyzed in groups based on presence or absence of the sweet and bmr mutations. In all groups, these two quantity measures predicted 82% to 95% of the TETOHP. In all but the “brown” RIL group, variation in SSC was significantly and positively correlated with TETOHP. This also support the hypothesis that biomass quantity traits, FSY and DSY, are the major determinant for ethanol production (Table 4) (Vogel et al., 2011; Han et al., 2013).
Discussion
Biomass conversion is a key process required to produce ethanol as source of renewable energy. Over the last decade, the industrial sector has focused on improving this process by designing new methodologies to efficiently hydrolyze and ferment lignocellulosic biomass (Wu et al., 2006; Lemus et al., 2008). However, to reach significant bioconversion efficiency, products such as sulfuric acid and genetically engineered microbes capable of breaking-down structural carbohydrates to fermentable sugars are required in large amounts (Anderson et al., 2009). Genetically enhanced germplasm with high biomass yield and enhanced compositional quality have the potential to improve sorghum stover conversion to ethanol; attributes recently shown to enhance both the economic and environmental performance of currently available biomass-to-ethanol conversion systems (Torres et al., 2016). The ability of the COMT gene mutation to reduce lignin concentration in lignocellulosic biomass showed positive effects towards the improvement of biomass conversion efficiency of the bmr lines in this study, at the population level, consistent with previous studies (Ohgren et al., 2007; Ritter et al., 2008; Vogler et al., 2009).
The bmr mutation makes stover carbohydrates readily fermentable (Ritter et al., 2008; Vogler et al., 2009); however, it generally reduces plant fitness, resulting in shorter plants, delayed maturity, and increased tendency to lodge (Pedersen et al., 2005). When both mutations are combined, as in the RIL of the “brown-sweet” group, the reduced fitness caused by the bmr mutation is compensated for by the introduction of the sweet mutation, with some individuals even exceeding the performance of RIL carrying only one of the mutations (Rivera-Burgos, 2015). Evidence in this study suggest that the sweet mutation not only improves the SSC quality trait, but the stover yield of bmr, high sugar recombinant sorghum lines is increased, boosting theoretical ethanol production. This is especially noteworthy because most recent studies (Marsalis et al., 2010; Gill et al., 2014; Guragain et al., 2017; Kumar et al., 2018) confirm those reported previously (Oliver et al., 2004; Pedersen et al., 2005) regarding the inferior and/or variable agronomic performance of most sorghum lines with the bmr trait. This shortcoming has slowed deployment of this trait in both the forage and bioenergy sectors of agriculture.
Enhanced ethanol yields would be expected from bmr sorghums because their reduced lignin content exposes the structural carbohydrates to the processes of hydrolysis that break the polymers cellulose and hemicellulose into easily fermentable residues (Badger, 2002; Dien et al., 2009; Murray et al., 2009). On the other hand, sweet sorghums, by virtue of having more ready-to-ferment sugars already present at increased amounts, at least in the stem portion of the stover, would have higher TETOH relative to the “normal” RIL group. In this study, both biomass quality mutations (sweet, and low lignin) do give significantly higher TETOHY than the sorghum lines without either mutation (“normal” RIL, 355L ton-1), but the “brown” RIL group (383L ton-1) more so than the “sweet” RIL group (370L ton-1). This is perhaps not too surprising considering the effects of each mutation on overall availability of fermentable carbohydrates in the plant (Bout and Vermerris, 2003; Rooney et al., 2007; Murray et al., 2009). While the sweet mutation causes more sugars to accumulate, carbohydrates which are immediately available to fermentation, this accumulation only occurs in one part of the plant, the stem. The bmr mutation affects sorghum stover, the reduced lignin exposing the greater structural carbohydrates, cellulose and hemicellulose, components of every cell wall, to the processes of hydrolysis (Porter et al., 1978; Saballos et al., 2008). While cellulose and hemicellulose require an extra step before fermentation can occur, these polymers are present in higher amounts than soluble sugars of sorghum stover, that the ethanol yield of the overall process is enhanced more by the widespread expression of the bmr mutation and lower lignin throughout all tissues of the plant (Prasad et al., 2007; Zhao et al., 2012). The “brown” RIL group yielded significantly more theoretical ethanol than the “sweet” and the “normal” RIL groups, and the “sweet” RIL group was capable of yielding significantly higher theoretical ethanol than the “normal” RIL group (383, 370, and 355 L ton-1, respectively). When single mutations for lignocellulosic biomass enhancement were compared independently, the low lignin bmr mutation had a more significant effect on predicted ethanol yield than stem sugar “sweet” mutation, a result also previously reported in other studies (Badger, 2002; Dien et al., 2009; Masarin et al., 2011).
Based on data from this study, biomass quantity emerges as the most important factor in determining ethanol production. Traits that contribute to plant size, such as tall leafy plants with thicker stems that contribute to production of more total biomass per area increase ethanol production. Biomass quality traits, like the bmr mutation that exposes structural carbohydrates to hydrolysis, or the sweet mutation that increases the ready-to-ferment sugar concentration of the raw plants, as well as those that yield more ethanol per unit biomass, contribute to feedstock improvement at the level of ethanol yield. In addition to enhancing the extent of cell wall degradation, the bmr trait has been shown previously to accelerate the rate of cell wall digestion (Cherney et al., 1985; Cherney et al., 1986). This may further increase the practical value of the bmr trait by increasing the throughput of feedstock in a bio-ethanol production facility. From a breeding perspective, initial selection for biomass quantity traits would tend to contribute to improved ethanol productivity the most. However, as one reaches the upper limits to yield potential (i.e., genetic variability, genetic stability, land availability, single cropping season, etc.) for a crop like sorghum, genetic changes in quality traits that improve the efficiency by which the biomass is converted to ethanol become important.
Compared to other lignocellulosic and stem juice bioenergy crops, that the bmr-sweet sorghum lignocellulosic biomass give much higher amount of ethanol production is significantly important. Miscanthus, sugar beet (Beta vulgaris), maize (Zea mays), rice (Oryza sativa), wheat (Triticum aestivum), sugarcane (Saccharum officinarum), sweet and forage sorghum (Sorghum bicolor) produce no more than 6,500 L of ethanol per ha (Gupta and Verma, 2015). This ethanol is produced from both structural carbohydrates (bagasse) or soluble carbohydrates (stem juice) (Anderson et al., 2009; Nelson et al., 2011). The efficient utilization of two sources of carbohydrates to produce ethanol from this genetically improved lignocellulosic biomass offers an attractive added value to farmers and industry (Badger, 2002; Masarin et al., 2011). The results of this study showed evidence of the importance of the bmr and sweet sorghum lignocellulosic biomass quality and quantity factors influencing ethanol production at an industrial scale (Moller, 2005; Wu, 2008; Wang and Zhu, 2010).
In summary, large-scale production of a genetically enhanced lignocellulosic biomass would help to improve bioconversion efficiency required by the bio-refineries. Traits that enhance biomass quality such as the low lignin and high stem sugar concentrations, as well as traits contributing to increased biomass quantity per unit land (i.e., FSY and DSY) can improve ethanol production, driving down cost without harmful environmental effects. In this study, we found that biomass quantity traits were the most important determinants of ethanol production, and biomass quality traits enhanced sorghum biomass conversion. The genetically enhanced sorghum biomass (bmr × sweet sorghum) offered two sources of stover carbohydrates (soluble carbohydrates and structural carbohydrates) to significantly increase ethanol yields.
Author Contributions
LR-B designed and conducted the research, collated and analyzed the data, and produced the manuscript draft. GE developed the sorghum mapping population and suggested the research question. He also supervised the research and edited the manuscript. JV supervised the research and edited the manuscript.
Funding
This research did not receive any specific grant from funding agencies in the public, commercial, or not-for-profit sectors. LR-B’s graduate research support was covered by GE’s Distinguished Professor research allowance from Purdue University.
Conflict of Interest Statement
The authors declare that the research was conducted in the absence of any commercial or financial relationships that could be construed as a potential conflict of interest.
Acknowledgments
We thank Terry Lemming, Suzanne Cunningham, and Patrick Rich for their assistance during field and laboratory experiments.
References
Anderson, W. F., Dien, B. S., Jung, H.-J. G., Vogel, K. P., Weimer, P. J. (2009). Effects of forage quality and cell wall constituents of bermuda grass on biochemical conversion to ethanol. Bioenergy Res. 3, 225–237. doi: 10.1007/s12155-009-9063-9
Badger, P. (2002). “Ethanol from cellulose: a general review,” in Trends in new crops and new uses. Eds. Janick, Whipkey (Alexandria, VA.: ASHS Press), 17–210.
Bout, S., Vermerris, W. (2003). A candidate-gene approach to clone the sorghum brown midrib gene encoding caffeic acid O-methyltransferase. Mol. Genet. Genomics 269, 205–214. doi: 10.1007/s00438-003-0824-4
Canilha, L., Chandel, A. K., dos Santos Milessi, T. S., Antunes, F. A. F., da Costa Freitas, W. L., das Graças, Almeida Felipe, M., et al. (2012). Bioconversion of sugarcane biomass into ethanol: an overview about composition, pretreatment methods, detoxification of hydrolysates, enzymatic saccharification, and ethanol fermentation. J. Biomed. Biotechnol. 2012, 1–15. doi: 10.1155/2012/989572
Cherney, J. H., Volenec, J. J., Moore, K. J. (1985). “Cell wall composition and rate of digestion of brown-midrib sorghum internodes as influenced by maturity,” in Proc. 15th Int. Grassl. Congr. (Kyoto, Japan), Lexington, KY, USA: International Grassland Congress, p. 953–954.
Cherney, J. H., Moore, K. J., Volenec, J. J., Axtell, J. D. (1986). Rate and extent of digestion of cell wall components of brown-midrib sorghum species 1. Crop Sci. 26, 1055–1059. doi: 10.2135/cropsci1986.0011183X002600050044x
Davis, S., Diegel, S., Robert, B. (2008). Transportation energy data book. 27th edn Vol. 1. Washington, DC: Oak Ridge National Laboratory (ORNL), 423. doi: 10.2172/969954
Dien, B. S., Jung, H. J. G., Vogel, K. P., Casler, M. D., Lamb, J. F., Iten, L. (2006). Chemical composition and response to dilute-acid pretreatment and enzymatic saccharification of alfalfa, reed canarygrass, and switchgrass. Biomass Bioenergy 30, 880–891. doi: 10.1016/j.biombioe.2006.02.004
Dien, B. S., Sarath, G., Pedersen, J. F., Sattler, S. E., Chen, H., Funnell-Harris, D. L., et al. (2009). Improved sugar conversion and ethanol yield for forage sorghum (Sorghum bicolor L. Moench) lines with reduced lignin contents. Bioenergy Res. 2, 153–164. doi: 10.1007/s12155-009-9041-2
Gill, J. R., Burks, P. S., Staggenborg, S. A., Odvody, G. N., Heiniger, R. W., Macoon, B., et al. (2014). Yield results and stability analysis from the sorghum regional biomass feedstock trial. Bioenergy Res. 7, 1026–1034. doi: 10.1007/s12155-014-9445-5
Gírio, F., Fonseca, C., Carvalheiro, F., Duarte, L., Marques, S., Bogel-Lukasik, R. (2010). Hemicelluloses for fuel ethanol: a review. Bioresour. Technol. 101, 4775–4800. doi: 10.1016/j.biortech.2010.01.088
Gupta, A., Verma, J. P. (2015). Sustainable bio-ethanol production from agro-residues: a review. Renewable Sustainable Energy Rev. 41, 550–567. doi: 10.1016/j.rser.2014.08.032
Guragain, Y. N., Rao, P. S., Prasad, P. V., Vadlani, P. V. (2017). Evaluation of brown midrib sorghum mutants as a potential biomass feedstock for 2, 3-butanediol biosynthesis. Appl. Biochem. Biotechnol. 183, 1093–1110. doi: 10.1007/s12010-017-2486-4
Han, K. J., Pitman, W. D., Kim, M., Day, D. F., Alison, W., McCormick, M., et al. (2013). Ethanol production potential of sweet sorghum assessed using forage fiber analysis procedures. GCB Bioenergy 5, 358–366. doi: 10.1111/j.1757-1707.2012.01203.x
Kumar, G. A., Vinutha, K. S., Shrivastava, D. K., Jain, S., Syed, B. A., Gami, B., et al. (2018). Identification of ideal locations and stable high biomass sorghum genotypes in semiarid tropics. Sugar Tech. 20, 323–335. doi: 10.1007/s12355-017-0584-9
Lemus, R., Brummer, E. C., Burras, C. L., Moore, K. J., Barker, M. F., Molstad, N. E. (2008). Effects of nitrogen fertilization on biomass yield and quality in large fields of established switchgrass in southern Iowa, USA. Biomass Bioenergy 32, 1187–1194. doi: 10.1016/j.biombioe.2008.02.016
Marsalis, M. A., Angadi, S. V., Contreras-Govea, F. E. (2010). Dry matter yield and nutritive value of corn, forage sorghum, and BMR forage sorghum at different plant populations and nitrogen rates. Field Crops Res. 116, 52–57. doi: 10.1016/j.fcr.2009.11.009
Masarin, F., Gurpilhares, D. B., Baffa, D. C., Barbosa, M. H., Carvalho, W., Ferraz, A., et al. (2011). Chemical composition and enzymatic digestibility of sugarcane clones selected for varied lignin content. Biotechnol. Biofuels 4, 55–65. doi: 10.1186/1754-6834-4-55
Murray, S. C., Sharma, A., Rooney, W. L., Klein, P. E., Mullet, J. E., Mitchell, S. E., et al. (2008a). Genetic improvement of sorghum as a biofuel feedstock: I. QTL for stem sugar and grain nonstructural carbohydrates. Crop Sci. 48, 2165–2179. doi: 10.2135/cropsci2008.01.0016
Murray, S. C., Rooney, W. L., Mitchell, S. E., Sharma, A., Klein, P. E. (2008b). Genetic improvement of sorghum as a biofuel feedstock: II. QTL for stem and leaf structural carbohydrates. Crop Sci. 48, 2180–2193. doi: 10.2135/cropsci2008.01.0068
Murray, S. C., Rooney, W. L., Hamblin, M. T., Mitchell, S. E., Kresovich, S. (2009). Sweet sorghum genetic diversity and association mapping for brix and height. Plant Genome J. 2, 48–62. doi: 10.3835/plantgenome2008.10.0011
Nelson, P., Hood, E., Powell, R. (2011) "The bioeconomy: a new era of products derived from renewable plant-based feedstock." in Plant Biomass Convers., Eds Hood, E., Nelson, P., Powell, R. (New York: John Wiley & Sons), 3–20. doi: 10.1002/9780470959138.ch1
Ohgren, K., Bura, R., Saddler, J., Zacchi, G. (2007). Effect of hemicellulose and lignin removal on enzymatic hydrolysis of steam pretreated corn stover. Bioresour. Technol. 98, 2503–2510. doi: 10.1016/j.biortech.2006.09.003
Oliver, A. L., Grant, R. J., Pedersen, J. F., O’Rear, J. (2004). Comparison of brown midrib-6 and -18 forage sorghum with conventional sorghum and corn silage in diets of lactating dairy cows. J. Dairy Sci. 87, 637–644. doi: 10.3168/jds.S0022-0302(04)73206-3
Oliver, A. L., Pedersen, J. F., Grant, R. J., Klopfenstein, T. J. (2005). Comparative effects of the sorghum bmr-6 and bmr-12 genes: I. Forage sorghum yield and quality. Crop Sci. 45, 2234–2239. doi: 10.2135/cropsci2004.0644
Palmer, N. A., Sattler, S. E., Saathoff, A. J., Funnell, D., Pedersen, J. F., Sarath, G. (2008). Genetic background impacts soluble and cell wall-bound aromatics in brown midrib mutants of sorghum. Planta 229, 115–127. doi: 10.1007/s00425-008-0814-1
Pedersen, J. F., Vogel, K. P., Funnell, D. L. (2005). Impact of reduced lignin on plant fitness. Crop Sci. 45, 812. doi: 10.2135/cropsci2004.0155
Porter, K. S., Axtell, J. D., Lechtenberg, V. L., Colenbrander, V. F. (1978). Phenotype, fiber composition, and in vitro dry matter disappearance of chemically induced brown midrib (bmr) mutants of sorghum. Crop Sci. 18, 205–208. doi: 10.2135/cropsci1978.0011183X001800020002x
Prasad, S., Singh, A., Jain, N., Joshi, H. C. (2007). Ethanol production from sweet sorghum syrup for utilization as automotive fuel in India. Energy Fuels 21, 2415–2420. doi: 10.1021/ef060328z
Ritter, K. B., Jordan, D. R., Chapman, S. C., Godwin, I. D., Mace, E. S., McIntyre, C. L. (2008). Identification of QTL for sugar-related traits in a sweet × grain sorghum (Sorghum bicolor L. Moench) recombinant inbred population. Mol. Breed. 22, 367–384. doi: 10.1007/s11032-008-9182-6
Rivera-Burgos, L. A. (2015). Genetic, agronomic and compositional characterization of brown midrib sweet sorghum lignocellulosic biomass for ethanol production. West Lafayette, IN, USA: Purdue University, 311.
Rooney, W. L., Blumenthal, J., Bean, B., Mullet, J. E. (2007). Designing sorghum as a dedicated bioenergy feedstock. Biofuels, Bioprod. Biorefin. 1, 147–157. doi: 10.1002/bbb.15
Saballos, A., Vermerris, W., Rivera, L., Ejeta, G. (2008). Allelic association, chemical characterization and saccharification properties of brown midrib mutants of sorghum (Sorghum bicolor L. Moench). Bioenergy Res. 1, 193–204. doi: 10.1007/s12155-008-9025-7
Sattler, S. E., Funnell-Harris, D. L., Pedersen, J. F. (2010). Brown midrib mutations and their importance to the utilization of maize, sorghum, and pearl millet lignocellulosic tissues. Plant Sci. 178, 229–238. doi: 10.1016/j.plantsci.2010.01.001
Sticklen, M. B. (2008). Plant genetic engineering for biofuel production: towards affordable cellulosic ethanol. Nat. Rev. Genet. 9, 433–443. doi: 10.1038/nrg2336
Sun, Y., Cheng, J. (2002). Hydrolysis of lignocellulosic materials for ethanol production: a review. Bioresour. Technol. 83, 1–11. doi: 10.1016/S0960-8524(01)00212-7
Torres, A. F., Slegers, P. M., Noordam-Boot, C. M., Dolstra, O., Vlaswinkel, L., Boxtel, A. J., et al. (2016). Maize feedstocks with improved digestibility reduce the costs and environmental impacts of biomass pretreatment and saccharification. Biotechnol. Biofuels 9, 63. doi: 10.1186/s13068-016-0479-0
Vogel, K., Pedersen, J., Masterson, S., Toy, J. (1999). Evaluation of a filter bag system for NDF, ADF, and IVDMD forage analysis. Crop Sci. 39, 276–279. doi: 10.2135/cropsci1999.0011183X003900010042x
Vogel, K. P., Dien, B. S., Jung, H. G., Casler, M. D., Masterson, S. D., Mitchell, R. B. (2011). Quantifying actual and theoretical ethanol yields for switchgrass strains using NIRS analyses. Bioenergy Res. 4, 96–110. doi: 10.1007/s12155-010-9104-4
Vogler, R. K., Tesso, T. T., Johnson, K. D., Ejeta, G. (2009). The effect of allelic variation on forage quality of brown midrib sorghum mutants with reduced caffeic acid O-methyl transferase activity. Afr. J. Biochem. Res. 3, 70–76.
Wang, Q., Zhu, S. (2010). Genetically modified lignocellulosic biomass for improvement of ethanol production. BioResources 5, 3–4.
Wu, M. (2008). “Analysis of the Efficiency of the U.S,” in Ethanol Industry 2007 (Argonne, IL (United States): Argonne National Lab (ANL)). doi: 10.2172/1218364
Wu, X., Wang, D., Bean, S. R., Wilson, J. R. (2006) Ethanol production from pearl millet by using Saccharomyces cerevisiae . Cereal Chem. 83, 127–131. doi: 10.1094/CC-83-0127
Keywords: Sorghum bicolor, recombinant inbred lines, lignocellulosic biomass, brown midrib mutation, stem sugar concentration, ethanol
Citation: Rivera-Burgos LA, Volenec JJ and Ejeta G (2019) Biomass and Bioenergy Potential of Brown Midrib Sweet Sorghum Germplasm. Front. Plant Sci. 10:1142. doi: 10.3389/fpls.2019.01142
Received: 09 November 2018; Accepted: 21 August 2019;
Published: 20 September 2019.
Edited by:
Paul Christiaan Struik, Wageningen University & Research, NetherlandsReviewed by:
Zhanguo Xin, Agricultural Research Service, United States Department of Agriculture, United StatesMaria Balota, Virginia Tech, United States
Copyright © 2019 Rivera-Burgos, Volenec and Ejeta. This is an open-access article distributed under the terms of the Creative Commons Attribution License (CC BY). The use, distribution or reproduction in other forums is permitted, provided the original author(s) and the copyright owner(s) are credited and that the original publication in this journal is cited, in accordance with accepted academic practice. No use, distribution or reproduction is permitted which does not comply with these terms.
*Correspondence: Gebisa Ejeta, Z2VqZXRhQHB1cmR1ZS5lZHU=