 Shang Gao1,2,3†
 Zhi Zheng1†Haiyan Hu1,4Haoran Shi3
 Jian Ma3
 Yaxi Liu3
 Yuming Wei3
 You-Liang Zheng3Meixue Zhou2
 Chunji Liu1*
- 1Agriculture and Food, CSIRO, St Lucia, QLD, Australia
- 2TIA, University of Tasmania, Prospect, TAS, Australia
- 3Triticeae Research Institute, Sichuan Agricultural University, Wenjiang, Chengdu, China
- 4School of Life Science and Technology, Henan Institute of Science and Technology, Xinxiang, China
Fusarium crown rot (FCR), caused primarily by Fusarium pseudograminearum, is a devastating disease for cereal production in semi-arid regions worldwide. To identify and characterize loci conferring FCR resistance, we assessed a landrace AWCS799 which is among the best lines identified from a systematic screening of more than 1,000 genotypes. Genetic control of its resistance was investigated by generating and analyzing two populations of recombinant inbred lines with AWCS799 as the common parent. One of the populations was used for QTL detection and the other for validation. A novel QTL, located on the long arm of chromosome 6H (designated as Qcrs.caf-6H), was consistently detected in each of the four FCR severity tests conducted against the mapping population. The QTL explained up to 28.3% of the phenotypic variance, and its effect was confirmed in the validation population. Significant interaction between this resistance locus and either plant height or heading date was not detected, further facilitating its manipulation in breeding programs.
Introduction
Fusarium crown rot (FCR) is a chronic disease caused by various Fusarium species in cereal crops. It is prevalent in arid and semi-arid cropping regions worldwide (Akinsanmi et al., 2004; Chakraborty et al., 2006). The disease has been known for causing significant yield loss in Australia (Murray and Brennan, 2009; Murray and Brennan, 2010) and the USA (Smiley et al., 2005b). FCR has also become a major issue in recent years for cereal production in China (Zhou et al., 2014; Li et al., 2016; Xu et al., 2017).
FCR pathogens are carried over in crop residues. They can survive for two seasons or longer in the field environments (Smiley et al., 2005a; Chakraborty et al., 2006), making the disease difficult to manage using practices such as crop rotation (Burgess, 2014). As recognized several decades ago, growing resistant varieties has to be an integral component in effectively managing the disease (Purss, 1966; Wildermuth and Purss, 1971). Growing resistant varieties does not only reduce yield losses but could also reduce the loss of the following barley or other cereal crops by reducing the inoculum load. This is especially the case for barley as, compared with those of wheat, its plants accumulate much higher concentrations of Fusarium pathogens at every stage of crown rot infection (Liu et al., 2012a).
The availability of well-characterized genotypes with high levels of resistance would facilitate breeding varieties with enhanced resistance. To date, there are only three reported studies on identifying QTL conferring FCR resistance in barley. The first one was based on a study using an existing population developed for unrelated traits. The study detected a single locus on chromosome arm 3HL, which interacts strongly with plant height (PH) (Li et al., 2009). Effects of PH on FCR development were also detected based on near isogenic lines (Chen et al., 2014) and histological analyses (Bai and Liu, 2015). The second study detected a single locus on chromosome arm 4HL (designated as Qcrs.cpi-4H) from a wild barley genotype (Hordeum spontaneum L.) originated from Iran (Chen et al., 2013a). The third study detected two loci from a landrace originated from Japan. They located on 1HL (Qcrs.cpi-1H) and 3HL (Qcrs.cpi-3H), respectively (Chen et al., 2013b).
Gene pyramiding has shown to be effective in further improving FCR resistance in both barley (Chen et al., 2015) and wheat (Zheng et al., 2017). However, as discussed above, only three loci conferring FCR resistance have been reported in barley. The value of one of them is also questionable as it interacts strongly with PH (Li et al., 2009; Chen et al., 2014). With the aim of identifying additional loci with high levels of resistance to FCR, we conducted a QTL mapping study against AWCS799, which was a landrace originated from South Korea. This genotype was identified as one of the most resistant genotypes from a systematic screening of more than 1,000 genotypes representing diverse geographical origins and different plant types (Liu et al., 2012b). As previous studies have repeatedly shown that both PH (Li et al., 2009; Ma et al., 2010; Chen et al., 2013a; Zheng et al., 2014; Bai and Liu, 2015) and heading date (HD) (Liu et al., 2012b) may interact with FCR severity, we investigated possible interactions between QTL detected from this study with these characteristics. Results obtained from these analyses are reported in this publication.
Materials and Methods
Plant Materials
The genotype AWCS799 is the resistant source analyzed in this study. Two populations of recombinant inbred lines (RILs) between “AWCS799” and two cultivars, Fleet and Franklin, were developed and used in this study. They are:
1. Fleet/AWCS799 consisting of 124 F8 RILs.
2. Franklin/AWCS799 consisting of 121 F8 RILs.
Both populations were produced in glasshouses at the Queensland Bioscience Precinct in Brisbane, Australia. The first population was used for QTL mapping and the other for validating putative QTL identified from the mapping population.
FCR Inoculation and Disease Assessments
Results from previous studies show that FCR resistance is not pathogen species-specific, and the same resistance locus can be detected by pathogen isolates belonging to different Fusarium species (Ma et al., 2010; Chen et al., 2013b). We therefore used a single F. pseudograminearum isolate in this study. The isolate (CS3096) was obtained from a wheat field in northern New South Wales, Australia, and maintained in the CSIRO collection (Akinsanmi et al., 2004). Inoculum preparation, inoculations, and FCR assessments were as described by Li et al. (2008). Briefly, inoculum was prepared using plates of one-half-strength potato dextrose agar. Inoculated plates were kept for 12 days at room temperature before the mycelia were scraped and discarded. The plates were then incubated for a further 7 to 12 days under a combination of cool white and black fluorescent lights with 12-h photoperiod. The spores were then harvested, and the concentration of spore suspension was adjusted to 1 × 10⁶ spores/ml. The spore suspensions were stored in -20°C freezer, and Tween 20 was added (0.1% v/v) to the spore suspension prior to use.
Seeds were germinated in Petri dishes on three layers of filter paper saturated with water. Seedlings of 3 days old were immersed in the spore suspension for 1 min, and two seedlings were planted into a 3-cm2 punnet (Rite Grow Kwik Pots, Garden City Plastics, Australia) containing sterilized University of California mix C (50% sand and 50% peat v/v). The punnets were arranged in a randomized block design and placed in a controlled environment facility (CEF). Settings for the CEF were as follows: 25°C/18°C ( ± 1°C) day/night temperature and 65%/80% ( ± 5%) day/night relative humidity, and a 14-h photoperiod with 500 µmol m−2s−1 photon flux density at the level of the plant canopy. To promote FCR development, water stress was applied during plant growth. Inoculated seedlings were watered only when wilt symptoms appeared.
For QTL mapping, four independent FCR severity tests were carried out against the mapping population (designated as FCR01 to FCR04, respectively). Three independent tests were conducted on the validation population (designated as FCRV01, FCRV02, FCRV03, respectively). Fourteen seedlings for each of the RILs and both parental genotypes were used for each of the tests. Fusarium crown rot severity was assessed 4 weeks after inoculation, using a 0-point (no visible symptom) to 5-point (whole plant severely to completely necrotic) scale as described by Li et al. (2008). Mean of scores for each line was used as disease index (DI) in QTL analysis.
Evaluation for PH and HD
To assess the possible effects of PH and HD on FCR resistance, a trial consisting of three replicates was conducted on the mapping population (Fleet/AWCS799) with randomized block design at the CSIRO Research Station at Gatton, Queensland (27°34′S, 152°20′E). For each replicate, 20 seeds for each of the RILF8 lines were sown in a single 1.5-m row with a 25-cm row spacing. Plant height was measured at maturity as the height from the soil surface to the tip of the spike (awns excluded). Six measurements were taken from the six tallest tillers in each row, and the average of each line was used for statistical analyses. Heading date was recorded on the day when 50% of all plants were at Zadock’s stage Z55 (Tottman et al., 1979).
Molecular Marker Analysis
Genotypes for the two parents and 94 RILs from the population Fleet/AWCS799 were generated by the Department of Economic Development, Jobs, Transport and Resources, Victoria, Australia, according to a tGBS (an optimized approach for genotyping-by-sequencing) pipeline (Ott et al., 2017). Simple sequence repeats (SSR) markers were then developed for putative QTL regions and used to genotype the whole mapping population. SSR finder (https://github.com/GouXiangJian/SSR_finder) was used to screen the variants within QTL regions between the pseudomolecule of “Morex” (Mascher et al., 2017) and an assembly of a wild barley (H. spontaneum) genotype AWCS276 (Liu et al., 2019). Primers were designed using Primer-BLAST (Ye et al., 2012).
PCRs for the amplification of the SSR markers were carried out in a total volume of 12 μl containing 25 ng genomic DNA, 0.2 μM of forward and reverse primer, 3 mM MgCL2, 0.2 mM dNTPs, and 0.5 U Taq DNA polymerase. During PCR, marker products were labelled with α-[33P]dCTP (3,000 ci/mmol). Polymerase chain reaction reactions were run on a Gene Amp PCR system 2700 thermocycler (PE Applied Biosystems, Foster City, CA, USA) programmed with the cycling conditions: one cycle of 5 min at 94°C, 35 cycles of 30 s at 94°C, 30 s at 60°C, and 1 min at 72°C, with a final extension step of 5 min at 72°C. The amplified products were mixed with an equal volume of loading dye, denatured at 95°C for 5 min, and 4 μl samples was run on a denaturing 5% polyacrylamide (20:1) gel at 110 W for 2 h. The gels were subsequently dried using a gel dryer for 30 min at 80°C and exposed to Kodak X-Omat X-ray films for 2 days.
Data Analysis and QTL Mapping
To generate the best linear unbiased prediction (BLUP) for DI values from the four FCR severity tests, R package “lme4” (Bates et al., 2007) was used with the following mixed-effect model: Yij = μ + ri + gj + wij, where Yij = DI value on the jth genotype in the ith test; μ = general mean; ri = effect due to ith test; gj = effect due to the jth genotype; wij = error or genotype by test interaction, where genotype was treated as a random effect and that of test as fixed. The graph for the frequency distribution of DI values and Pearson correlation coefficient between all phenotypic data was generated with Microsoft Office Excel 2016 and R package “psych” (Revelle, 2017), respectively. Student t test was performed to evaluate the difference in DI values between lines with or without the resistant allele in the populations using Microsoft Office Excel 2016.
MSTmap Online (Wu et al., 2008) was used to build linkage maps by chromosomes with the following parameters: Grouping logarithm of the odds ratio (LOD) Criteria: single LG; Population type: RIL8; No mapping missing threshold: 10%; No mapping distance threshold: 15 centiMorgan (cM); No mapping size threshold: 2; Try to detect genotyping errors: Yes; Genetic mapping function: Kosambi. The diagrams of linkage maps were generated with MapChart (Voorrips, 2002). IciMapping 4.1 was used for QTL analysis with the “Biparental Population” (BIP) module (Meng et al., 2015). Inclusive composite interval mapping was applied to identify QTL with a mapping step of 1 cM (PIN = 0.015). For each FCR severity test, a 1,000-permutation test was performed to decide the LOD threshold corresponding to a genome-wide type I error less than 5% (P < 0.05). QTL were named according to the International Rules of Genetic Nomenclature (http://wheat.pw.usda.gov/ggpages/wgc/98/Intro.htm).
Results
Characterization of FCR Resistance in the Mapping Population of Fleet/AWCS799
FCR severity of the resistant genotype AWCS799 was significantly lower than the two susceptible commercial cultivars (Figure 1). In the four FCR severity tests conducted against the mapping population and its two parents, the DI value of AWCS799 was 50.0% lower than that of Fleet on average, and transgressive segregation was detected in each of the tests (Table 1). DI values for all four tests and BLUP presented significantly positive correlation between each other (Table 2). The frequency distribution of DI value for FCR01 skewed towards better resistance. Disease index values for the other three tests and BLUP showed more normal distributions (Figure S1).

Figure 1 Difference in resistance to Fusarium crown rot (FCR) infection between the resistant genotype AWCS799 and the two commercial cultivars (Fleet and Franklin) used as parents in this study.

Table 1 Disease index of FCR severity in the population of Fleet/AWCS799.
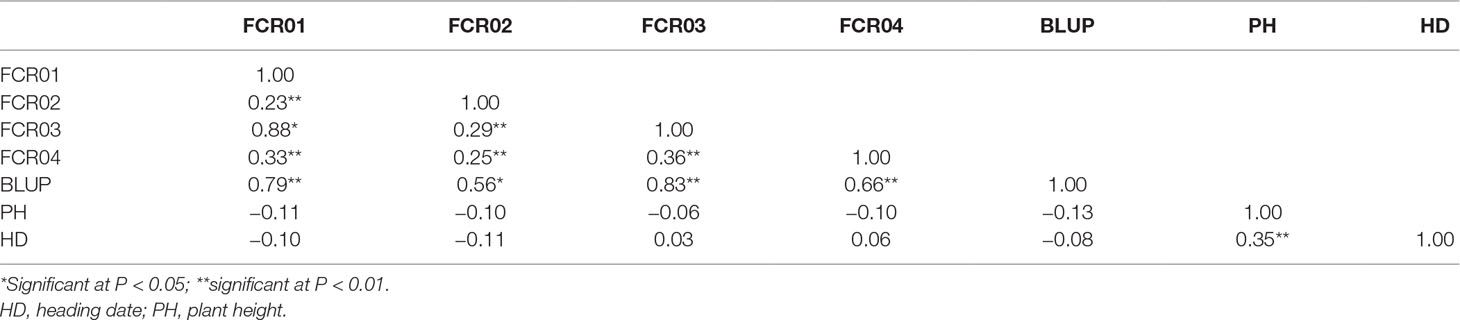
Table 2 Correlation coefficients between FCR severity, plant height, and heading date in the Fleet/AWCS799 population.
Linkage Maps Constructed and Synteny for Marker Locations in the Genome Assembly of “Morex”
Of the GBS markers mapped, 4,870 codominant markers were polymorphic between Fleet and AWCS799. These markers fell into 740 clusters and markers within each of the clusters cosegregated. As cosegregating markers contain the same information when used for mapping, a single marker with the least missing values was selected from each of the clusters and used for linkage map construction.
The markers were grouped into seven linkage groups, and they spanned a total of 1964.7 cM with an average distance of 2.3 cM between loci (Table S1; for details of linkage map, see Table S2). As all the markers generated had known physical positions, we aligned the linkage maps with the reference genome of barley based on the cultivar “Morex” (Mascher et al., 2017). This analysis found that, as expected, the genetic and physical maps were highly consistent for majority of the markers. However, there are a few exceptions around the pericentromeric regions (Figure S2).
Detection and Validation of QTL for FCR Resistance
Putative QTLs were detected on chromosomes 1H, 2H, 3H, 4H, 5H, and 6H. Only the one located on 6H was detected in each of the four tests conducted. The resistant allele of this QTL originated from AWCS799. We designated this QTL as Qcrs.caf-6H, where “crs” stands for “crown rot severity,” and “caf” represents “CSIRO Agriculture and Food.” Qcrs.caf-6H was identified in all four tests and BLUP, and it explained up to 28.3% of the phenotypic variance (Figure 2 and Table 3). Qcrs.caf-6H was delineated into a 7.0-cM interval flanked by markers 6H_453483214 and 6H_481998837 with 6H_497772849 (Table S3) as the most closely linked SSR marker.
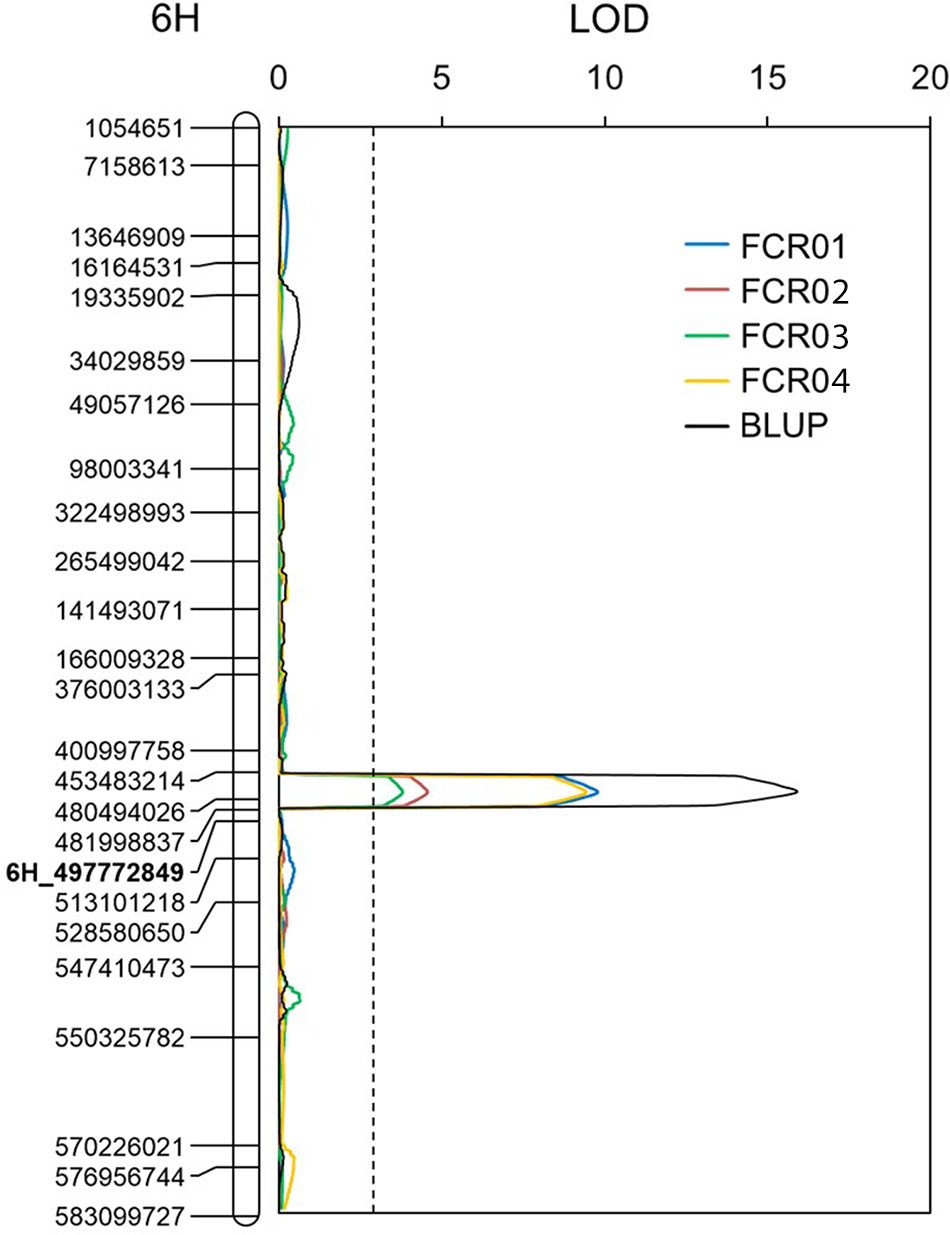
Figure 2 QTL conferring FCR resistance detected on the long arm of chromosome 6H in the population of Fleet/AWCS799. Physical position for each of the markers is shown to the left of the linkage map, and distances in centiMorgan (cM) are shown to the right. The vertical dotted lines indicate the average significance threshold (LOD = 2.7) based on a test of 1,000 permutations. The SSR marker used in validating the QTL is in bold.
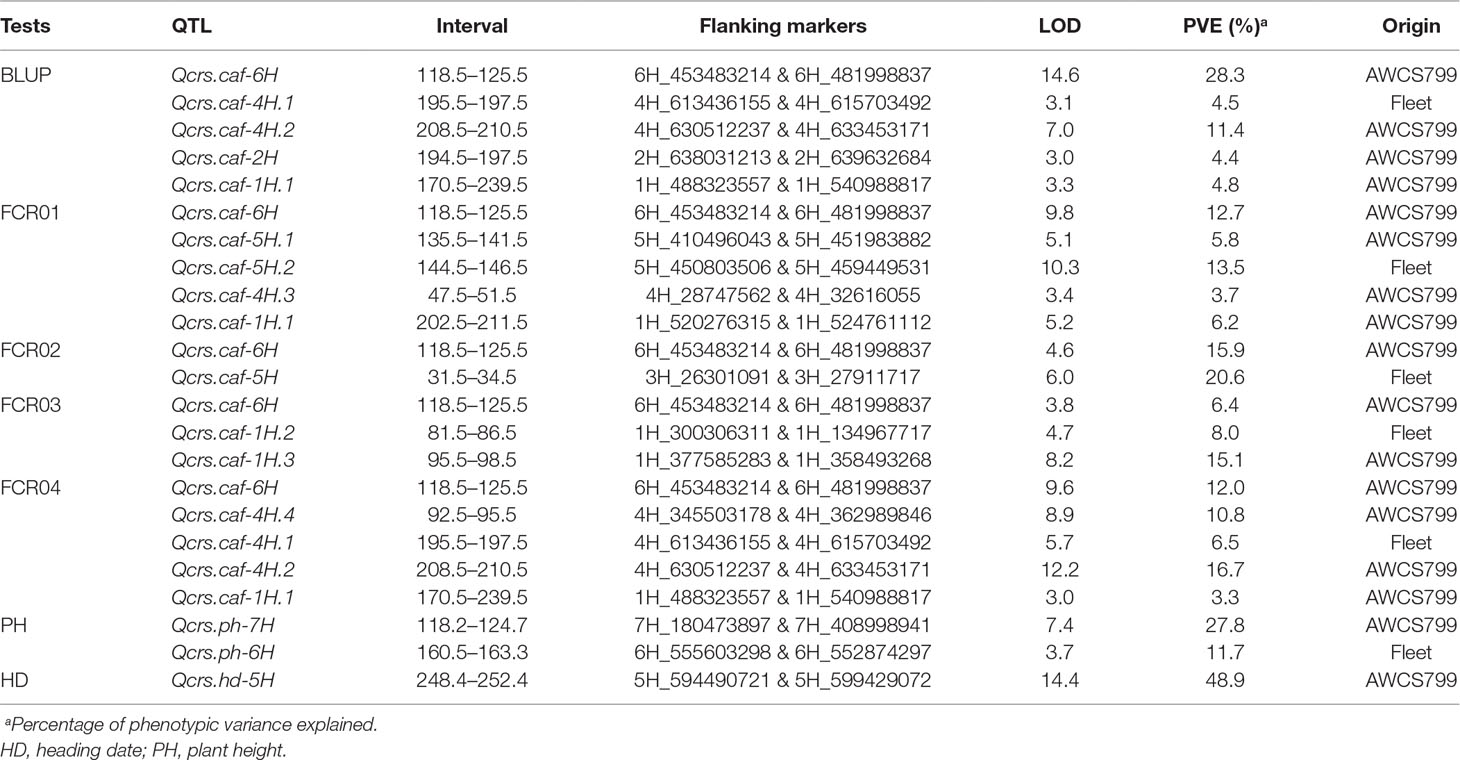
Table 3 Results of QTL analysis for FCR severity, plant height, and heading date identified in the population of Fleet/AWCS799.
Three QTLs were identified on chromosome 1H. Of them, only Qcrs.caf-1H.1 was detected in more than one test, and it was located in a similar genomic interval with another FCR QTL reported in a previous study (Chen et al., 2013b). Four QTLs were detected on chromosome 4H. Of them, Qcrs.caf-4H.1 and Qcrs.caf-4H.2 were identified in both FCR04 and BLUP. Qcrs.caf-4H.2 was mapped in a similar location with a locus reported by Chen et al. (2013a). The other two 4H QTLs and loci on chromosome 2H (Qcrs.caf-2H), 3H (Qcrs.caf-3H), and 5H (Qcrs.caf-5H.1 and Qcrs.caf-5H.2) were identified in only one of the tests. As none of these loci were consistently detected, they were not further investigated in this study.
Possible effects of Qcrs.caf-6H were further assessed in the validation population of Franklin/AWCS799. The most closely linked SSR marker with Qcrs.caf-6H from the mapping population was used to identify individuals with either the resistant (RR) or susceptible (rr) allele in this population. Significant difference was detected for Qcrs.caf-6H between RR and rr group in each of the three tests (Table 4). The average DI value of the lines bearing the resistant allele was 22.9% lower than those with the susceptible allele.
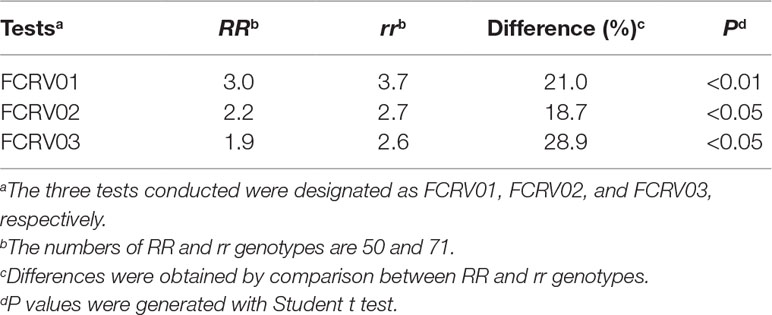
Table 4 Disease indices of FCR severity of lines possess resistant (RR) and susceptible (rr) allele of Qcrs.caf-6H from the population of Franklin/AWCS799.
Effect of PH and HD on FCR Resistance
A QTL controlling HD was identified on chromosome 5H. This QTL explained up to 48.9% of phenotypic variance with an LOD value of 14.4 (Table 3). Two QTL affecting PHs were detected and were located on chromosomes 6H and 7H, respectively. The QTL on chromosome 6H could explain up to 11.7% of the phenotypic variance with an LOD value of 3.7, and the other QTL on chromosome 7H could explain up to 27.8% of the phenotypic variance with an LOD value of 7.4 (Table 3). For quantifying possible effects of PH and HD on FCR severity, the BLUP of the four FCR severity tests was analyzed against PH and HD data using covariance analysis. The results showed that both PH and HD have little effect on Qcrs.caf-6H (Figure 3).
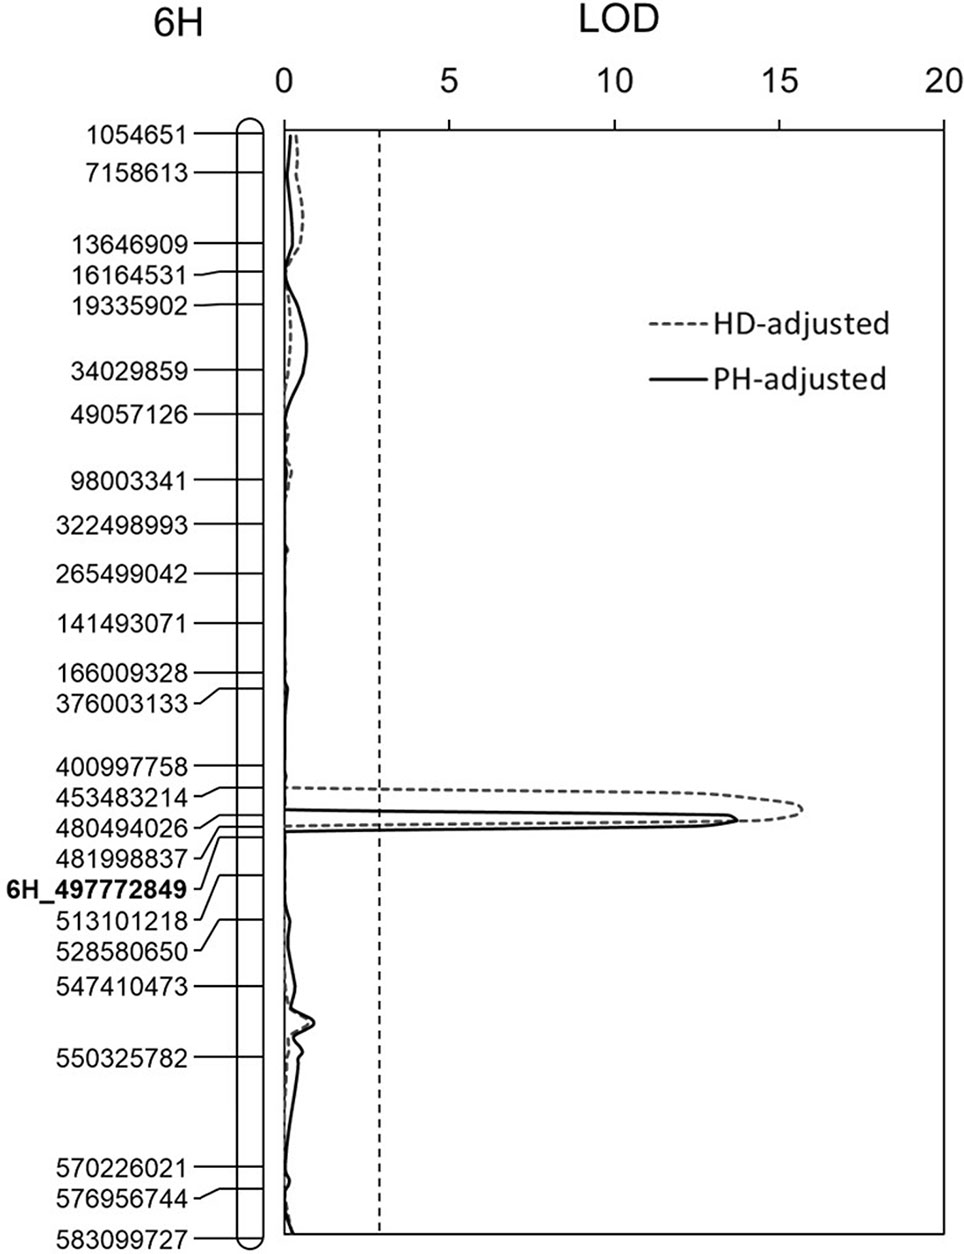
Figure 3 Effects of plant height (PH) and heading date (HD) on Qcrs.caf-6H. Physical position for each of the markers is shown to the left of the linkage map, and distances in cM are shown to the right. The LOD values were obtained from the BLUP and postadjustment by HD and PH. The vertical dotted lines indicate the average significance threshold (LOD = 2.7) based on a test of 1,000 permutations. The SSR marker used in validating the QTL is in bold.
Discussion
In the study reported here, we investigated the genetics of FCR resistance on a barley landrace originating from South Korea. A novel QTL located on chromosome arm 6HL was detected from each of the four tests. This QTL, designated as Qcrs.cpi-6H, explained up to 28.3% of the phenotypic variance in the mapping population and reduced FCR severity by 22.9% in the validation population on average. This is the first locus conferring FCR resistance identified on this chromosome in barley.
Pyramiding multiple loci into single genetic background have been proved to be effective in improving FCR resistance in barley and wheat (Chen et al., 2015; Zheng et al., 2017). However, the progress of such work in barley has been hampered by the shortage of effective loci. Of the only three loci reported in earlier studies, the value of the one located on chromosome arm 3HL is questionable as it had strong interaction with PH (Li et al., 2009; Liu et al., 2012a; Chen et al., 2013a). A histological analysis based on NILs for height also showed that Fusarium pseudograminearum hyphae were detected earlier and proliferated more rapidly during the time course of FCR development in the tall isolines (Bai and Liu, 2015). Some of the earlier studies showed that FCR severity can also be influenced by HD (Liu et al., 2012a). The new locus detected in this study does not colocate with loci controlling either PH or HD, and removing the effects of these characteristics from the mapping population has little influence on the magnitudes of the FCR locus detected in any of the tests. Thus, Qph.caf-6H is the third locus, which can be effectively exploited to further enhance FCR resistance by gene pyramiding in this crop species.
Loci conferring FCR resistance have been reported on 13 of the 21 wheat chromosomes (Liu and Ogbonnaya, 2015). One of the loci was located on wheat chromosome 6DL, and it was detected from a field trial (Martin et al., 2015). Compared with the 6DL locus, Qph.caf-6H seems to be more distally located on the chromosome arm 6HL in barley. However, as QTL mapping provides only limited resolution (Paterson et al., 1988), further studies are required to clarify the homologous relationship between these two loci.
As expected, orders for most of the markers in the linkage map constructed in this study aligned well with their physical positions in the barley genome. It is of interest to note that, without any exception, all the discrepancies involved markers and sequences located in the pericentromeric region (Figure S2). It is known that the pericentromeric regions of the barley chromosomes are characterized by low gene density, low recombination frequencies (Mascher et al., 2017), and high ratios of repetitive sequences (Wicker et al., 2017). Contributions, if any, from these characteristics to the discrepancies are not clear. However, it is not unreasonable to speculate that low recombination frequencies are likely to be less tolerable to incorrect marker scores or missing values occurred during high-throughput genotyping.
Author’s Note
This study identified and validated a novel and large-effect QTL conferring Fusarium crown rot resistance on the long arm of chromosome 6HL in barley.
Data Availability Statement
The raw data supporting the conclusions of this manuscript will be made available by the authors, without undue reservation, to any qualified researcher.
Author Contributions
CL, MZ, YW, and Y-LZ conceived the research. SG, ZZ, HH, HS, JM, and YL conducted experiments and analyzed data under the supervision of CL and MZ. SG, ZZ, YL, and CL wrote the manuscript with contribution from all the authors.
Funding
Work reported here was partially funded by the Grains Research and Development Corporation, Australia (Project CFF00010). SG is grateful to China Scholarship Council and the University of Tasmania for financial support during the tenure of his PhD studentship. HH thanks the Henan Institute of Science and Technology and China Scholarship Council for supporting her visit to CSIRO.
Conflict of Interest
The authors declare that the research was conducted in the absence of any commercial or financial relationships that could be construed as a potential conflict of interest.
Acknowledgments
The authors are also grateful to Drs Meredith McNeil and Udaykumar Kage (both at CSIRO Agriculture and Food) for their constructive suggestions in preparing the manuscript. This manuscript has been released as a Pre-Print at https://www.biorxiv.org/content/10.1101/537605v1 (Gao et al., 2019).
Supplementary Material
The Supplementary Material for this article can be found online at: https://www.frontiersin.org/articles/10.3389/fpls.2019.01206/full#supplementary-material
References
Akinsanmi, O. A., Mitter, V., Simpfendorfer, S., Backhouse, D., Chakraborty, S. (2004). Identity and pathogenicity of Fusarium spp. isolated from wheat fields in Queensland and northern New South Wales. Crop Pasture Sci. 55, 97–107. doi: 10.1071/AR03090
Bai, Z., Liu, C. (2015). Histological evidence for different spread of Fusarium crown rot in barley genotypes with different heights. J. Phytopathol. 163, 91–97. doi: 10.1111/jph.12283
Burgess, L. (2014). 2011 McAlpine memorial lecture—a love affair with Fusarium. Australas. Plant Pathol. 43, 359–368. doi: 10.1007/s13313-013-0261-8
Chakraborty, S., Liu, C., Mitter, V., Scott, J., Akinsanmi, O., Ali, S., et al. (2006). Pathogen population structure and epidemiology are keys to wheat crown rot and Fusarium head blight management. Australas. Plant Pathol. 35, 643–655. doi: 10.1071/AP06068
Chen, G., Habib, A., Wei, Y., Zheng, Y.-L., Shabala, S., Zhou, M., Liu, C. (2015). Enhancing Fusarium crown rot resistance by pyramiding large-effect QTL in barley. Mol. Breed. 35, 26. doi: 10.1007/s11032-015-0255-z
Chen, G., Liu, Y., Ma, J., Zheng, Z., Wei, Y., Mcintyre, C. L., Zheng, Y.-L., Liu, C. (2013a). A novel and major quantitative trait locus for Fusarium crown rot resistance in a genotype of wild barley (Hordeum spontaneum L.). PloS ONE 8, e58040. doi: 10.1371/journal.pone.0058040
Chen, G., Liu, Y., Wei, Y., Mcintyre, C., Zhou, M., Zheng, Y.-L., et al. (2013b). Major QTL for Fusarium crown rot resistance in a barley landrace. Theor. Appl. Genet. 126, 2511–2520. doi: 10.1007/s00122-013-2151-4
Chen, G., Yan, W., Liu, Y., Wei, Y., Zhou, M., Zheng, Y.-L., et al. (2014). The non–gibberellic acid–responsive semi-dwarfing gene uzu affects Fusarium crown rot resistance in barley. BMC Plant Biol. 14, 22. doi: 10.1186/1471–2229-14-22
Gao, S., Zheng, Z., Hu, H., Shi, H., Ma, J., Liu, Y., Wei, Y., Zheng, Y., Zhou, M., Liu, C. (2019). A novel QTL conferring Fusarium crown rot resistance located on chromosome arm 6HL in barley. BioRxiv, 537605. doi: 10.1101/537605
Li, H., He, X., Ding, S., Yuan, H., Chen, L. (2016). First report of Fusarium culmorum causing crown rot of wheat in China. Plant Dis. 100, 2532–2532. doi: 10.1094/PDIS-05-16-0723-PDN
Li, H. B., Zhou, M., Liu, C. J. (2009). A major QTL conferring crown rot resistance in barley and its association with plant height. Theor. Appl. Genet. 118, 903–910. doi: 10.1007/s00122-008-0948-3
Li, X., Liu, C., Chakraborty, S., Manners, J. M., Kazan, K. (2008). A simple method for the assessment of crown rot disease severity in wheat seedlings inoculated with Fusarium pseudograminearum. J. Phytopathol. 156, 751–754. doi: 10.1111/j.1439-0434.2008.01425.x
Liu, C., Ogbonnaya, F. C. (2015). Resistance to Fusarium crown rot in wheat and barley: a review. Plant Breed. 134, 365–372. doi: 10.1111/pbr.12274
Liu, M., Li, Y., Ma, Y., Zhao, Q., Stiller, J., Feng, Q., et al. (2019). The draft genome of a wild barley genotype reveals its enrichment in genes related to biotic and abiotic stresses compared to cultivated barley. Plant Biotechnol. J. doi: 10.1111/pbi.13210
Liu, Y., Ma, J., Yan, W., Yan, G., Zhou, M., Wei, Y., et al. (2012a). Different tolerance in bread wheat, durum wheat and barley to Fusarium crown rot disease caused by Fusarium pseudograminearum. J. Phytopathol. 160, 412-417. doi: 10.1111/j.1439-0434.2012.01920.x
Liu, Y., Zheng, Y. L., Wei, Y., Zhou, M., Liu, C. (2012b). Genotypic differences to crown rot caused by Fusarium pseudograminearum in barley (Hordeum vulgare L.). Plant Breed 131, 728–732. doi: 10.1111/j.1439-0523.2012.02008.x
Ma, J., Li, H. B., Zhang, C. Y., Yang, X. M., Liu, Y. X., Yan, G. J., et al. (2010). Identification and validation of a major QTL conferring crown rot resistance in hexaploid wheat. Theor. Appl. Genet. 120, 1119–1128. doi: 10.1007/s00122-009-1239-3
Martin, A., Bovill, W., Percy, C., Herde, D., Fletcher, S., Kelly, A., et al. (2015). Markers for seedling and adult plant crown rot resistance in four partially resistant bread wheat sources. Theor. Appl. Genet. 128, 377–385. doi: 10.1007/s00122-014-2437-1
Mascher, M., Gundlach, H., Himmelbach, A., Beier, S., Twardziok, S. O., Wicker, T., et al. (2017). A chromosome conformation capture ordered sequence of the barley genome. Nature 544, 427. doi: 10.1038/nature22043
Meng, L., Li, H., Zhang, L., Wang, J. (2015). QTL IciMapping: integrated software for genetic linkage map construction and quantitative trait locus mapping in biparental populations. The Crop Journal 3, 269–283. doi: 10.1016/j.cj.2015.01.001
Murray, G., Brennan, J. (2010). Estimating disease losses to the Australian barley industry. Australas. Plant Pathol. 39, 85–96. doi: 10.1071/AP09064
Murray, G.M., Brennan, J. P. (2009). Estimating disease losses to the Australian wheat industry. Australas. Plant Pathol. 38, 558–570. doi: 10.1071/AP09053
Ott, A., Liu, S., Schnable, J. C., Yeh, C.-T. E., Wang, K.-S., Schnable, P. S. (2017). tGBS® genotyping-by-sequencing enables reliable genotyping of heterozygous loci. Nucleic Acids Research 45, e178–e178. doi: 10.1093/nar/gkx853
Paterson, A. H., Lander, E. S., Hewitt, J. D., Peterson, S., Lincoln, S. E., Tanksley, S. D. (1988). Resolution of quantitative traits into Mendelian factors by using a complete linkage map of restriction fragment length polymorphisms. Nature 335, 721–726. doi: 10.1038/335721a0
Purss, G. (1966). Studies of varietal resistance to crown rot of wheat caused by Fusarium graminearum Schw. Queensl. J. Agric. Anim. Sci. 23, 475–498.
Revelle, W. R. (2017). psych: procedures for personality and psychological research. Evanston, IL: Northwestern University. Available online at: http://cran.r-project.org/package=psych.
Smiley, R. W., Gourlie, J. A., Easley, S. A., Patterson, L.-M. (2005a). Pathogenicity of fungi associated with the wheat crown rot complex in Oregon and Washington. Plant Dis. 89, 949–957. doi: 10.1094/PD-89-0949
Smiley, R. W., Gourlie, J. A., Easley, S. A., Patterson, L.-M., Whittaker, R. G. (2005b). Crop damage estimates for crown rot of wheat and barley in the Pacific Northwest. Plant Dis. 89, 595–604. doi: 10.1094/PD-89-0595
Tottman, D., Makepeace, R., Broad, H. (1979). An explanation of the decimal code for the growth stages of cereals, with illustrations. Ann Appl. Biol. 93, 221–234. doi: 10.1111/j.1744-7348.1979.tb06534.x
Voorrips, R. E. (2002). MapChart: software for the graphical presentation of linkage maps and QTLs. J. Hered. 93, 77–78. doi: 10.1093/jhered/93.1.77
Wicker, T., Schulman, A. H., Tanskanen, J., Spannagl, M., Twardziok, S., Mascher, M., et al. (2017). The repetitive landscape of the 5100 Mbp barley genome. Mob. DNA 8, 22. doi: 10.1186/s13100-017-0102-3
Wildermuth, G., Purss, G. (1971). Further sources of field resistance to crown rot (Gibberella zeae) of cereals in Queensland. Anim. Prod. Sci. 11, 455–459. doi: 10.1071/EA9710455
Wu, Y., Bhat, P. R., Close, T. J., Lonardi, S. (2008). Efficient and accurate construction of genetic linkage maps from the minimum spanning tree of a graph. PLoS Genet. 4, e1000212. doi: 10.1371/journal.pgen.1000212
Xu, F., Song, Y., Wang, J., Liu, L., Zhao, K. (2017). Occurrence of Fusarium crown rot caused by Fusarium pseudograminearum on barley in China. Plant Dis. 101, 837–837. doi: 10.1094/PDIS-10-16-1436-PDN
Ye, J., Coulouris, G., Zaretskaya, I., Cutcutache, I., Rozen, S., Madden, T. L. (2012). Primer-BLAST: a tool to design target-specific primers for polymerase chain reaction. BMC Bioinforma. 13, 134. doi: 10.1186/1471-2105-13-134
Zheng, Z., Gao, S., Zhou, M., Yan, G., Liu, C. (2017). Enhancing Fusarium crown rot resistance by pyramiding large-effect QTL in common wheat (Triticum aestivum L.). Mol. Breed. 37, 107. doi: 10.1007/s11032-017-0708-7
Zheng, Z., Kilian, A., Yan, G., Liu, C. (2014). QTL conferring Fusarium crown rot resistance in the elite bread wheat variety EGA Wylie. PloS ONE 9, e96011. doi: 10.1371/journal.pone.0096011
Keywords: Fusarium crown rot (FCR), Barley (Hordeum vulgare L.), QTL, Breeding, RIL population
Citation: Gao S, Zheng Z, Hu H, Shi H, Ma J, Liu Y, Wei Y, Zheng Y-L, Zhou M and Liu C (2019) A Novel QTL Conferring Fusarium Crown Rot Resistance Located on Chromosome Arm 6HL in Barley. Front. Plant Sci. 10:1206. doi: 10.3389/fpls.2019.01206
Received: 12 June 2019; Accepted: 02 September 2019;
Published: 15 October 2019.
Edited by:
Soren K. Rasmussen, University of Copenhagen, DenmarkReviewed by:
Ana M. Casas, Aula Dei Experimental Station (EEAD), SpainYongzhong Xing, Huazhong Agricultural University, China
Copyright © 2019 Gao, Zheng, Hu, Shi, Ma, Liu, Wei, Zheng, Zhou and Liu. This is an open-access article distributed under the terms of the Creative Commons Attribution License (CC BY). The use, distribution or reproduction in other forums is permitted, provided the original author(s) and the copyright owner(s) are credited and that the original publication in this journal is cited, in accordance with accepted academic practice. No use, distribution or reproduction is permitted which does not comply with these terms.
*Correspondence: Chunji Liu, Q2h1bmppLmxpdUBjc2lyby5hdQ==
†These authors have contributed equally to this work