 Sidram Dhanagond1
 Guozheng Liu2,3
 Yusheng Zhao2
 Dijun Chen4
 Michele Grieco1
 Jochen Reif2,5
 Benjamin Kilian1,6
 Andreas Graner1,5
 Kerstin Neumann1*
- 1Department of Genebank, Leibniz Institute of Plant Genetics and Crop Plant Research (IPK), Seeland, Germany
- 2Department of Breeding Research, Leibniz Institute of Plant Genetics and Crop Plant Research (IPK), Seeland, Germany
- 3BBCC – Innovation Center Gent, Gent Zwijnaarde, Belgium
- 4Institute for Biology, Humboldt-Universität zu Berlin, Berlin, Germany
- 5Plant Breeding Department, Martin-Luther-University Halle-Wittenberg, Halle, Germany
- 6Global Crop Diversity Trust (GCDT), Bonn, Germany
With ongoing climate change, drought events are becoming more frequent and will affect biomass formation when occurring during pre-flowering stages. We explored growth over time under such a drought scenario, via non-invasive imaging and revealed the underlying key genetic factors in spring barley. By comparing with well-watered conditions investigated in an earlier study and including information on timing, QTL could be classified as constitutive, drought or recovery-adaptive. Drought-adaptive QTL were found in the vicinity of genes involved in dehydration tolerance such as dehydrins (Dhn4, Dhn7, Dhn8, and Dhn9) and aquaporins (e.g. HvPIP1;5, HvPIP2;7, and HvTIP2;1). The influence of phenology on biomass formation increased under drought. Accordingly, the main QTL during recovery was the region of HvPPD-H1. The most important constitutive QTL for late biomass was located in the vicinity of HvDIM, while the main locus for seedling biomass was the HvWAXY region. The disappearance of QTL marked the genetic architecture of tiller number. The most important constitutive QTL was located on 6HS in the region of 1-FEH. Stage and tolerance specific QTL might provide opportunities for genetic manipulation to stabilize biomass and tiller number under drought conditions and thereby also grain yield.
Introduction
Barley breeding has not substantially changed total biomass (Austin et al., 1980; Gifford et al., 1984; Horie et al., 2005) but rather its distribution resulting in an increased harvest index (Abeledo et al., 2003; Reynolds et al., 1999). Consequently, one promising opportunity to increase grain yield in the future is to boost biomass per se (Fischer and Edmeades, 2010). Annual cereal yield increases in the European Union have fallen below 1% since the turn of the century (Noleppa, 2016) partly explained by an increasing volatility due to climate change (Brisson et al., 2010), leading to a higher frequency of drought periods (Lloyd-Hughes and Saunders, 2002; Lehner et al., 2006), affecting plant growth and causing yield losses world-wide (Jones and Corlett, 1992; Boyer and Westgate, 2004). Spring drought events reduce mainly vegetative biomass formation. Water deficit affects cell growth by hampering mitosis, cell elongation, and expansion (Farooq et al., 2009) and thereby reducing leaf area and tillering. Ongoing drought leads to a reduction in photosynthesis (Jedmowski et al., 2014). All these factors result in a reduced dry matter production with negative effects on grain yield. Though barley is well adapted to a wide range of climatic conditions (Ceccarelli and Grando, 1996), improvement of yield under drought environments has been challenging for plant breeders (Richards et al., 2002) as the effect of drought is highly depending on the time of onset, duration, and stress intensity. Despite that, numerous QTL studies in bi-parental mapping or natural collections have been conducted to identify genetic components of different drought stress tolerance in barley (e.g. Teulat et al., 2001; Forster et al., 2004; Guo et al., 2008; Mehravaran et al., 2014; Fan et al., 2015; Abou-Elwafa, 2016). There is evidence that selection for individual traits contributing to drought tolerance can improve grain yield (Edmeades et al., 1999; Richards, 2006).
Nevertheless, entirely different genetic loci were detected at different developmental stages within the same mapping population (Szira et al., 2008). Consequently, studying the genetics of drought tolerance requires phenotyping throughout the life cycle of a plant, nearly impossible to realize in the field. New phenotyping platforms that employ non-invasive imaging techniques (Berger et al., 2010; Chen et al., 2014a) in controlled environments offer the most suitable way to perform such experiments. Several studies demonstrate the suitability of non-invasive phenotyping for abiotic stress tolerance (Rajendran et al., 2009; Chen et al., 2014b; Honsdorf et al., 2014; Neumann et al., 2015). Recently, the genetic architecture of vegetative biomass formation was revealed in spring barley throughout plant development under well-watered conditions (Neumann et al., 2017).
Growth and development are regulated by plant hormones, flowering time genes, plant architecture genes, and many transcription factors. The main plant hormones are abscisic acid (ABA), indole-3-acetic acid (IAA or auxin), brassinosteroids (BRs), cytokinin (CK), gibberellic acid (GA), ethylene, jasmonic acid (JA), and salicylic acid (Santher et al., 2009). Therefore, genes regulating hormone levels or genes being activated or turned off by hormones can be candidates for growth-related traits. Auxin response factors (ARFs) regulate gene expression and have distinct roles in plant development, including root growth and leaf expansion, and are also involved in stress adaptation (Li et al., 2016). Recently, twenty different ARFs were identified in barley (Tombuloglu, 2019). The gene HvDIM is involved in BR biosynthesis, and mutations resulted in deficiency or reduced levels of castasterone, suggested end product of brassinosteroid biosynthesis pathway in cereal grasses (Kim et al., 2008), which generally results in reduced plant stature and sturdiness. Further, in rice, three Short Vegetative Phase (SVP)-like MADS-box genes which regulate meristem identity and flowering time (Trevaskis et al., 2007) were demonstrated to act as negative regulators of BR responses (Lee et al., 2008). The GA oxidases (GAoxs) are essential for the biosynthesis of bioactive GAs and cluster into eight subfamilies, from which GA2ox, GA20ox, and GA3ox have been well studied while the function of GAox-A/B/C/D genes has to be still explored (Huang et al., 2015). GA is not only a key regulator of growth and development (Yamaguchi, 2008) but also plays a role under abiotic stress by inducing growth restriction (Colebrook et al., 2014). CK plays a major role in vegetative development such as root and shoot meristem maintenance and root elongation and root branching (Osugi and Sakakibara, 2015) and contributes to drought tolerance by various mechanisms including water balance regulation (Pavlů et al., 2018). CK oxidases/dehydrogenases (CKX) inactivate the hormone in a single enzymatic step and are therefore controlling local CK levels (Schmülling et al., 2003). Potassium transporters are involved in the response to osmotic stress (Osakabe et al., 2013) as potassium is an essential micronutrient for plant growth and involved in enzyme activation, osmoregulation and further stomatal movement (Han et al., 2016). Fructan exohydrolases (FEHs) mobilize fructans that are important storage carbohydrates produced from sucrose (Van Riet et al., 2006) and thereby involved in plant growth. They are continuously accumulated during stem growth (Zhang et al., 2008). Moreover, fructans can stabilize membranes during drying and thereby help to prevent leakage during drought (Livingston et al., 2009).
Flowering time genes affect plant growth directly or by pleiotropy. Recently, the importance of HvPPD-H1 on leaf growth was demonstrated, with insensitive types possessing a longer leaf growth duration and a higher cell number (Digel et al., 2016), most likely as a result of source-sink allocation. Moreover, flowering time gene expression is affected by abiotic stress, and increased for HvPpd-H1, HvPRR73 and HvPRR95 (Habte et al., 2014).
The plant-specific DOF transcription factors (Moreno-Risueno et al., 2007) have a suggested role in the regulation of important processes vital for plant development including the modulation of response to abiotic stress (Noguero et al., 2013), and shoot branching in Arabidopsis (Zou et al., 2013) as well as regulation of stomatal development (Negi et al., 2014). Recently, a rich diversity in HvDof genes was seen in a screen of 58 barley accessions (Rouhian et al., 2017). Further, BZIP transcription factors regulate many plant processes including stress signaling in Arabidopsis (Jakoby et al., 2002). In rice, OsABF1 was induced by abiotic stresses and was connected with enhanced drought tolerance (Hossain et al., 2010).
Several genes are known that influence the water balance of plants. Aquaporins are water channels that facilitate water uptake in barley roots (Knipfer et al., 2011). The subfamily of plasma membrane intrinsic proteins (PIPs) has a crucial role for the water balance of plants (Hove et al., 2015; Afzal et al., 2016). The subfamily of tonoplast intrinsic proteins (TIPs) in the vacuolar membrane takes a supposed role in vacuolation, and expression of TIP genes is influenced by plant hormones GA and ABA in an antagonistic way (Lee et al., 2015). Dehydrins are LEA group 2 proteins upregulated in reaction to abiotic stresses such as cold, drought or salt stress, acting as hydration buffers and thereby reducing water loss (Graether and Boddington, 2014; Banerjee and Roychoudhury, 2016). Pectin methylesterases (PMEs) are deesterising pectin, the main cell wall component and thereby are involved in cell wall elasticity and porosity, crucial prerequisites for cell elongation and water uptake (Müller et al., 2013). Accordingly, PMEIs have a role in osmotic stress (Hong et al., 2010; Wormit and Usadel, 2018).
In the current study, we investigated the dynamics of the genetic architecture of biomass under a spring drought event by adapting our previously developed experimental setup (Neumann et al., 2015). In particular, we aimed at elucidating constitutive biomass QTL (stable under different environmental conditions) and adaptive biomass QTL (only representative for specific environmental conditions such as water-deficit conditions) by comparison to well-watered conditions investigated earlier in three consecutive experiments (Neumann et al., 2017).
Material and Methods
Spring Barley Mapping Panel and Experimental Set-Up
A set of 100 diverse two-rowed spring barley accessions, described by Neumann et al. (2017) where the 100 barley accessions were evaluated for growth under control conditions, was used in this study for the genetic investigation of biomass development under the influence of seasonal drought stress. Ninety-seven of these are the subset of a world-wide spring barley collection used in several other studies (e.g., Haseneyer et al., 2010; Pasam et al., 2012; Alqudah et al., 2014). The accessions were mainly originating from Europe and were selected based on a low variation in flowering time under field conditions (Pasam et al., 2012). For more details and the list of genotypes see Neumann et al. (2017).
The plants were grown in a greenhouse at IPK Gatersleben (51°49′23″ N, 11°17′13″ E, 112 m a.s.l.), equipped with the imaging-based high-throughput phenotyping system LemnaTec-Scanalyzer 3D system (LemnaTec GmbH, Aachen, Germany). Three consecutive independent experiments were performed from March 2013 to September 2013 (Supplementary Table S1) each with five replicates per genotype. Every experiment lasted for 58 days. Initially, two seeds per pot were sown and 7–9 days after sowing (DAS), depending on the experiment, plants were thinned-out to retain only one seedling per pot. Automated watering, imaging, and randomization were performed daily. The pots were daily watered to reach a fraction of (plant) available water (fAW) of 89% from DAS 1 to DAS 26 and from DAS 46 to DAS 58. Drought stress was imposed from DAS 27 until DAS 45 by watering to a target weight corresponding to 10% fAW (Supplementary Material, Supplementary Figure S1). Re-watering was performed with an absolute volume of 300 ml on DAS 45, and from DAS 46 on all plants received watering to 89% fAW. Note that images were taken before watering as plants first move through the imaging chambers. Therefore, the stress period lasted from DAS 27 to 45. Greenhouse conditions were set to 15 h light, 18/16°C day/night as in Neumann et al. (2017). Details of pot size, soil, and FC determination were as described by Neumann et al. (2015).
Trait Evaluation From Images and Manual Evaluation
For details on image capturing see Supplementary Material. The image analysis was done employing the barley analysis pipeline in IAP (Klukas et al., 2014). A pixel volume termed digital biomass (DB, with voxel as a unit) was calculated as in Neumann et al. (2017). Biomass growth patterns in stress conditions could be bifurcated into two parts describing the stress period and the recovery phase (Chen et al., 2014b, see Supplementary Material). In the morning of DAS 59, above-ground biomass was harvested and measured as fresh weight (FW). Tillers (TN) were manually counted at DAS 27, 45, and 58, marking the start and end of the stress treatment as well as the end of the experiment. The images of all plants were visually inspected if plants reached the growth stage of tipping BBCH 49 (Witzenberger et al., 1989) within the imaging period. In contrast to the experiments for well-watered conditions, only in experiment 2 the majority of plants (432) reached BBCH 49. In experiments 1 and 3, only 224 and 255 out of 500 plants reached BBCH 49, respectively. Therefore, we could not further analyze this parameter.
Phenotypic Analysis
Statistical analysis was performed in R software (R 2010). As plants were fully randomized each night, we considered the experimental design as a completely randomized design for statistical analysis. An outlier test was performed on the raw data from each of the three experiments. The outlier test was performed according to Tukey’s method (Anscombe and Tukey, 1963). Best linear unbiased estimates (BLUEs) were calculated for each day, within each experiment with the model Y = μ + G + e where Y is the vector of observed phenotypic value, µ is intercept, G is effect of genotype, e is residual for each plant, while µ and G were treated as fixed effects.
BLUEs from all 3 experiments were combined and used to detect outliers again and estimate BLUEs across experiments with the model Y = µ+ G+ E + e, where Y is the vector of BLUEs from a single experiment, µ is the intercept, G is the effect of genotype, E is the effect of experiments, e is the residual. While µ and G were treated as fixed effects, the other effects were treated as random. The BLUES across experiments were used to calculate the trait correlation. Moreover, we performed a one-step model to estimate the phenotypic variance components based on the raw data by fitting the model Y = G + E + GxE+ e, where G is the effect of genotype, E is the effect of experiments, GxE is the genotype by experiment interaction, and e is the residual, while assuming that all effects were random effects.
Broad-sense heritability was calculated as
where VG, VGE, and Ve are the variance components of the genotype, genotype x experiment and the residual, respectively. O is the number of experiments for the respective DAS, and R the number of biological replicates.
Genome-Wide Association Scans and Identification of Candidate Genes
The association mapping panel was genotyped using the 9k iSelect SNP array (Illumina, CA, United States). SNPs were filtered for missing data (5%) and minor allele frequency (MAF < 0.05), resulting in 4,866 polymorphic SNPs (DOI: 10.5447/IPK/2019/14) further used for genetic analysis with 4,122 SNPs having mapping information as described in Neumann et al. (2017). The decay of linkage disequilibrium (LD) and the structure of the association mapping panel were estimated by Neumann et al. (2017). The average LD decay amounted to 8 cM in the collection and a kinship using modified Rogers’ Distance (Reif et al., 2005) was sufficient to correct for population structure and included in the model for genome-wide association scans (GWAS). GWAS were performed using BLUEs from single experiments using the software ASReml-R 3.0 (Butler et al., 2009). The following mixed-linear model was applied as in Neumann et al. (2017):
where μ is the overall mean, and E is the effect of the experiments, S is the effect of SNP, and G is the random effect of the genotype, while e is the residual error. This model considers a covariance structure of 2K , where K refers to the kinship matrix (Jiang et al., 2015) and is the genetic variance. A false discovery rate (FDR) with a significance level of 0.1 was applied for each trait and separately for all days (Benjamini and Hochberg, 1995). The proportion of explained genetic variance (GV) of the detected QTL was estimated as the adjusted r2 values standardized with the heritability.
We explored all loci for potential candidate genes using the recently annotated barley genome assembly (Mascher et al., 2017) using the gene sets from 2012 for genetic positions and 2016 for physical map positions (Colmsee et al., 2015). Designation of the HvARF genes was performed according to Tombuloglu (2019).
Results
High Heritability of Biomass Related Traits Under Drought Stress
The two-rowed spring barley panel was evaluated for tiller number and biomass over time in three experiments, which showed only minor seasonal differences (Supplementary Table S2 and Supplementary Figures S2 and S3). The high correlation between fresh weight and digital biomass justifies the use of digital biomass as a biomass proxy (Supplementary Figure S4). In addition, three stress-related traits were computed applying a biomass growth model: time A (TA) reflecting the time point when biomass development stopped, biomass at time A (DBA), and the re-growth rate (k) after re-watering started. Substantial variation for each trait was found in the collection (Supplementary Table S3).
Heritability of biomass over time was high (0.79 at DAS 12; 0.92 at DAS 58), although heritability decreased to 0.59 at DAS 45 beyond TA (Supplementary Figure S5). Also, all further traits showed a high heritability, reflecting the precision of the phenotypic data.
Genotype-By-Time Interactions of Biomass Formation Are Modified by Drought Stress
Correlation of biomass among different time points starting from DAS 12 until 58 varied (Figure 1). Early seedling and late vegetative biomass turned out to be unrelated. A moderate correlation (R ∼ 0.4–0.5) of biomass during progressing drought (DAS 27 to 37) to the final biomass (DAS 58) was observed. After the onset of wilting (time A), correlations to time points in other growth phases (early, recovery) declined. This pattern indicates a change in the genetic architecture of biomass formation during early and late drought phase and the recovery phase.
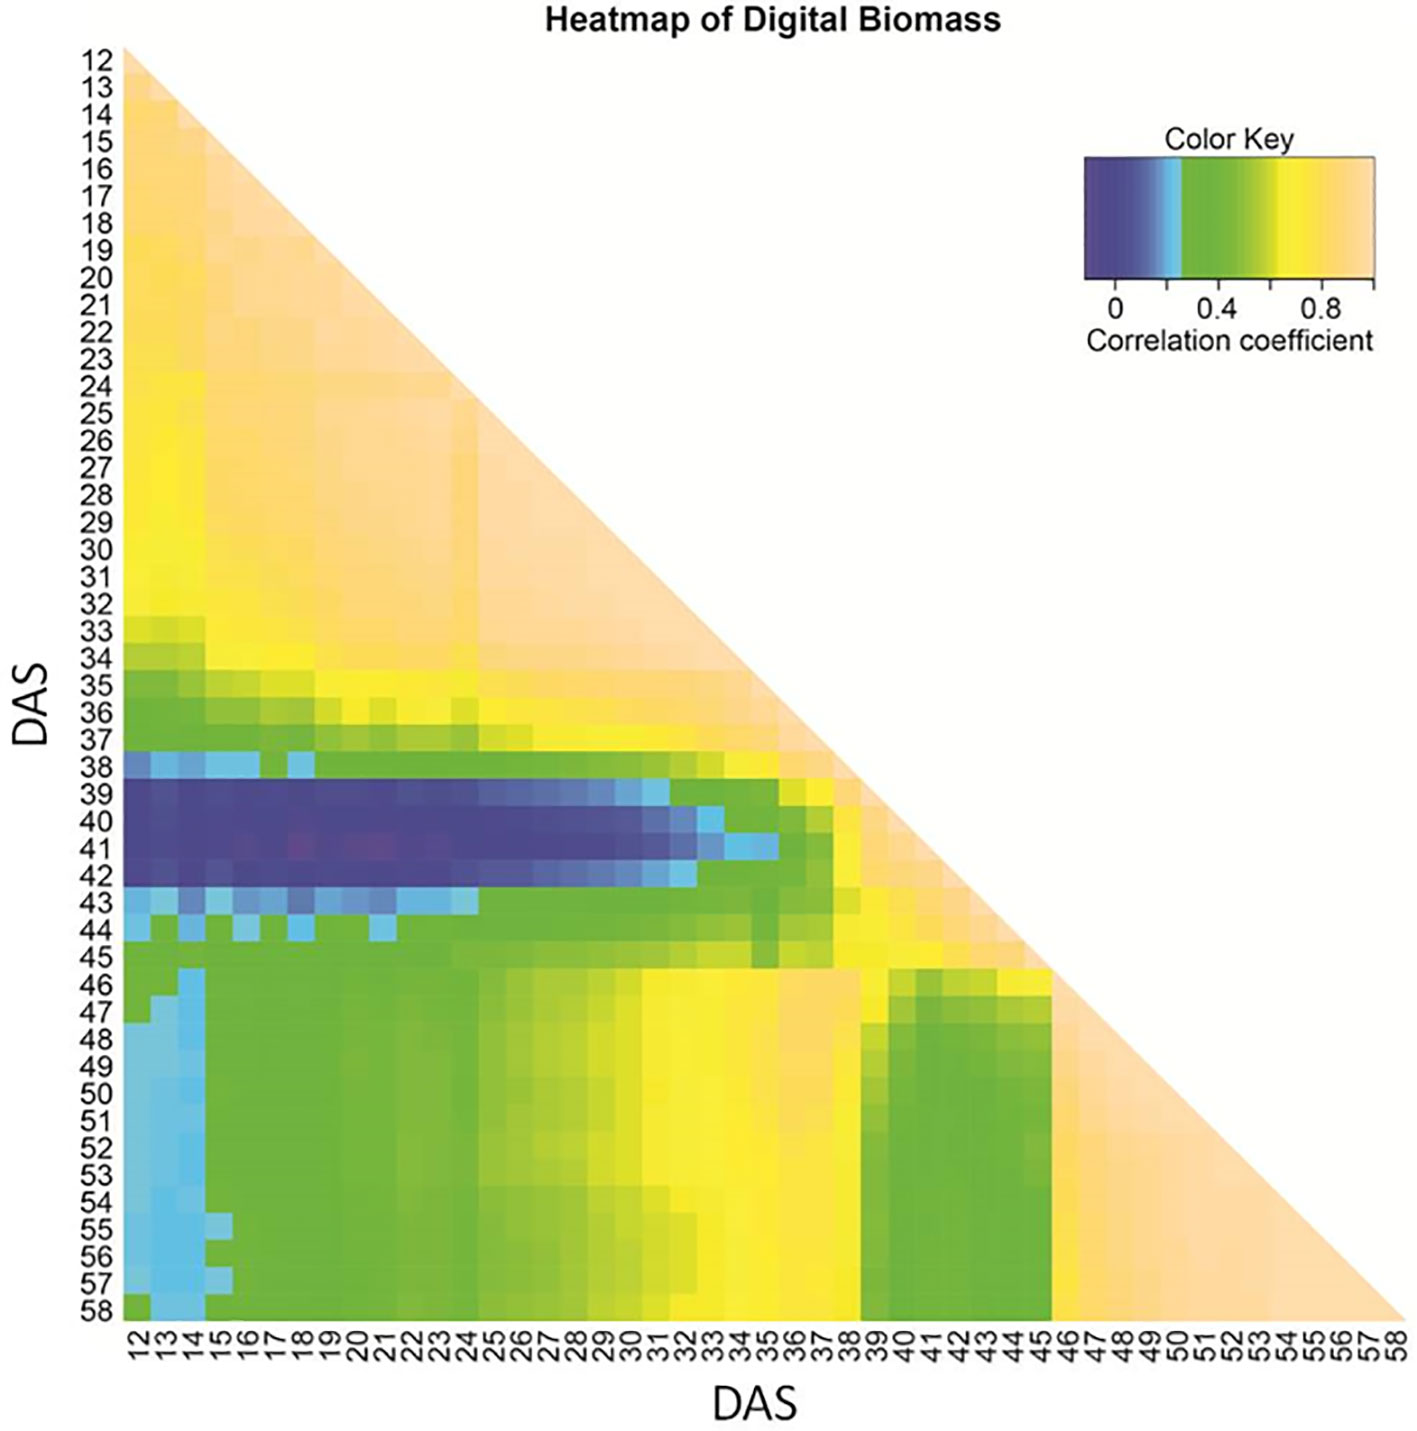
Figure 1 Heat map of Kendall correlation coefficient for image-based estimated biomass based on BLUEs across three experiments, shown from 12 to 58 days after sowing (DAS).
Phenotypic Associations Between Biomass and Further Traits
Biomass and tiller number were correlated at all three investigated time points (Supplementary Table S4). Early tiller number possessed the highest correlation to biomass (R = 0.67), while late tiller number was less correlated (R = 0.42). Time A reflects the time point where growth has stopped; afterwards, (digital) biomass is decreasing due to a loss of turgidity, causing the wilting of leaves (Neumann et al., 2015). A highly negative correlation of time A with the biomass at the onset of the drought was observed; plants with higher initial biomass wilted earlier (Supplementary Table S4). The re-growth rate k was positively correlated with biomass and tiller number, indicating genotypes with higher biomass also have a higher capability to re-grow after a stress period. Further, we were interested at what fAW plants reached Time A, especially if there is a common water status where plant growth is arrested (transpiration > water extraction from the soil). Therefore, we calculated fAW at time A (fAW_TA) for each individual plant (see Supplementary Material). The parameter exhibited a high heritability of 0.68 suitable for GWAS. On average, genotypes stopped their growth at fAW_TA = 21%, but there was substantial variation in the panel (see Supplementary Table S2). Moreover, differences in fAW_TA were not related to a “biomass effect”, as no significant correlation to biomass at the onset of drought stress or biomass at time A was observed. Plants that are able to maintain growth even at lower fAW_TA maintained higher biomass in the last days of stress, resulting in a negative correlation of fAW_TA (not shown) and biomass (R ∼ −0.5) and reached Time A later (R = −0.52).
Genetic Architecture of Biomass Under the Influence of Drought Stress
GWAS were performed for each time point. In total, 26 SNPs showed at least one significant association with digital biomass in the course of the experiment (Supplementary Table S5). These SNPs represent 12 different QTL and can be grouped according to their time of appearance. Six QTL were detected exclusively during the drought stress phase, five only during the recovery phase, while one QTL was associated with biomass in both phases. Before the onset of drought stress, no QTL was passing the FDR. Very similar GWAS results were obtained for digital biomass on DAS 58 and fresh weight on DAS 59 (Supplementary Figure S6). Only one significant SNP detected for fresh weight (6H, 24.5 cM) was not passing the FDR for digital biomass at any day despite –log(p) > 3 (Supplementary Table S5).
The occurrence of QTL in the drought stress phase depended on the time of wilting (TA). Of the seven QTL, two were detected in the early drought phase before time A was reached (1H at 119.0 cM and 7H at 140.9 cM). The remaining five QTL were detected only after time A was passed (Figure 2A). The seven QTL together explained between 22.0 and 42.2% of the genetic variance during the time course of drought stress (Figure 2B). Individual QTL explained a maximum between 6.5 and 18.5% of genetic variance. The QTL on 7HL at 140.9 cM explained the highest amount of the genetic variance during the drought phase.
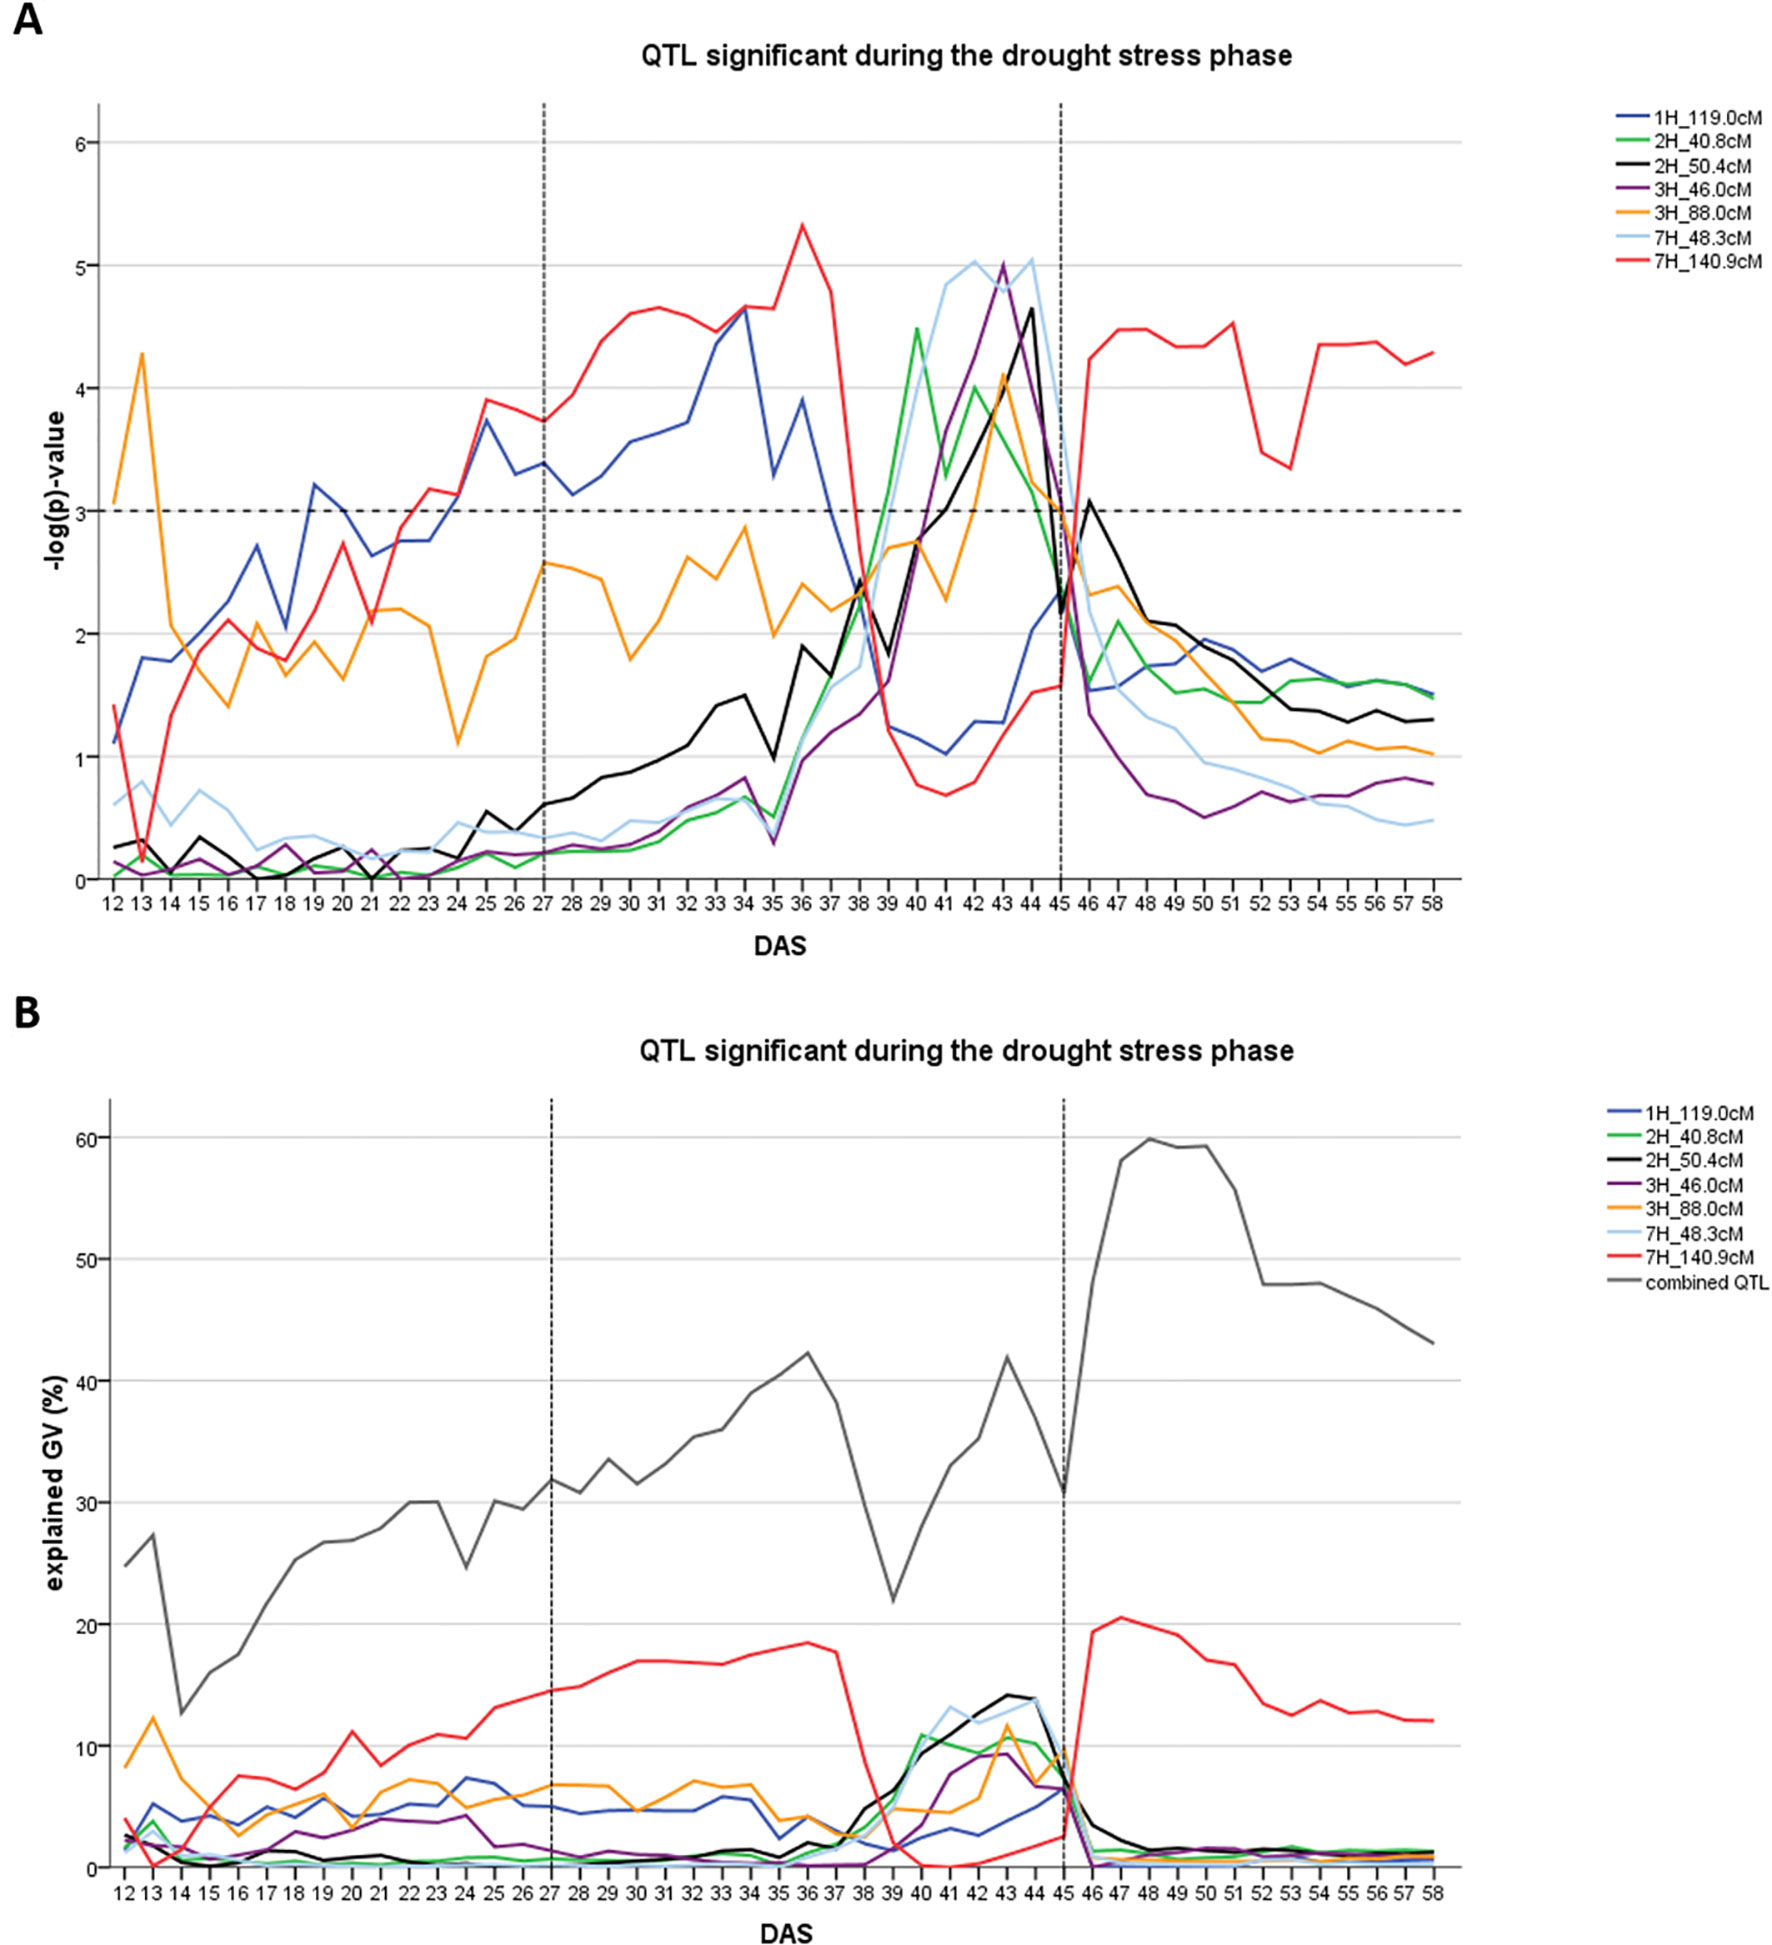
Figure 2 Time dynamics of QTL significantly associated (FDR < 0.1) with digital biomass (DB) during the drought stress phase in days after sowing (DAS). The drought stress phase from DAS 27 to DAS 45 is indicated by the two dashed vertical. (A) value –log(p) over time for each QTL (SNP with the highest significance) in different colors. Arbitrary threshold of significance at –log(p) = 3 is indicated by a dashed horizontal. (B) Proportion of genetic variance explained by each QTL, represented in different colors and combined (all 12 QTL detected during the whole time-course of the experiment – drought and recovery period).
In the recovery phase six different QTL were detected (Figure 3A). One of them was also present during the early drought stress phase (7H at 140.9 cM). One QTL was located in the region of the major flowering time locus HvPPD-H1 (2H, 18.9–27.7 cM). Collectively, the six QTL explained between 43.0 and 59.9% of the genetic variance (Figure 3B). Individual QTL contribution was higher in the recovery phase compared to the drought phase: QTL explained between 13.5 and 28.8% of genetic variance with the HvPPD-H1 locus being the most important QTL, followed by the QTL on 7H at 140.9 cM.
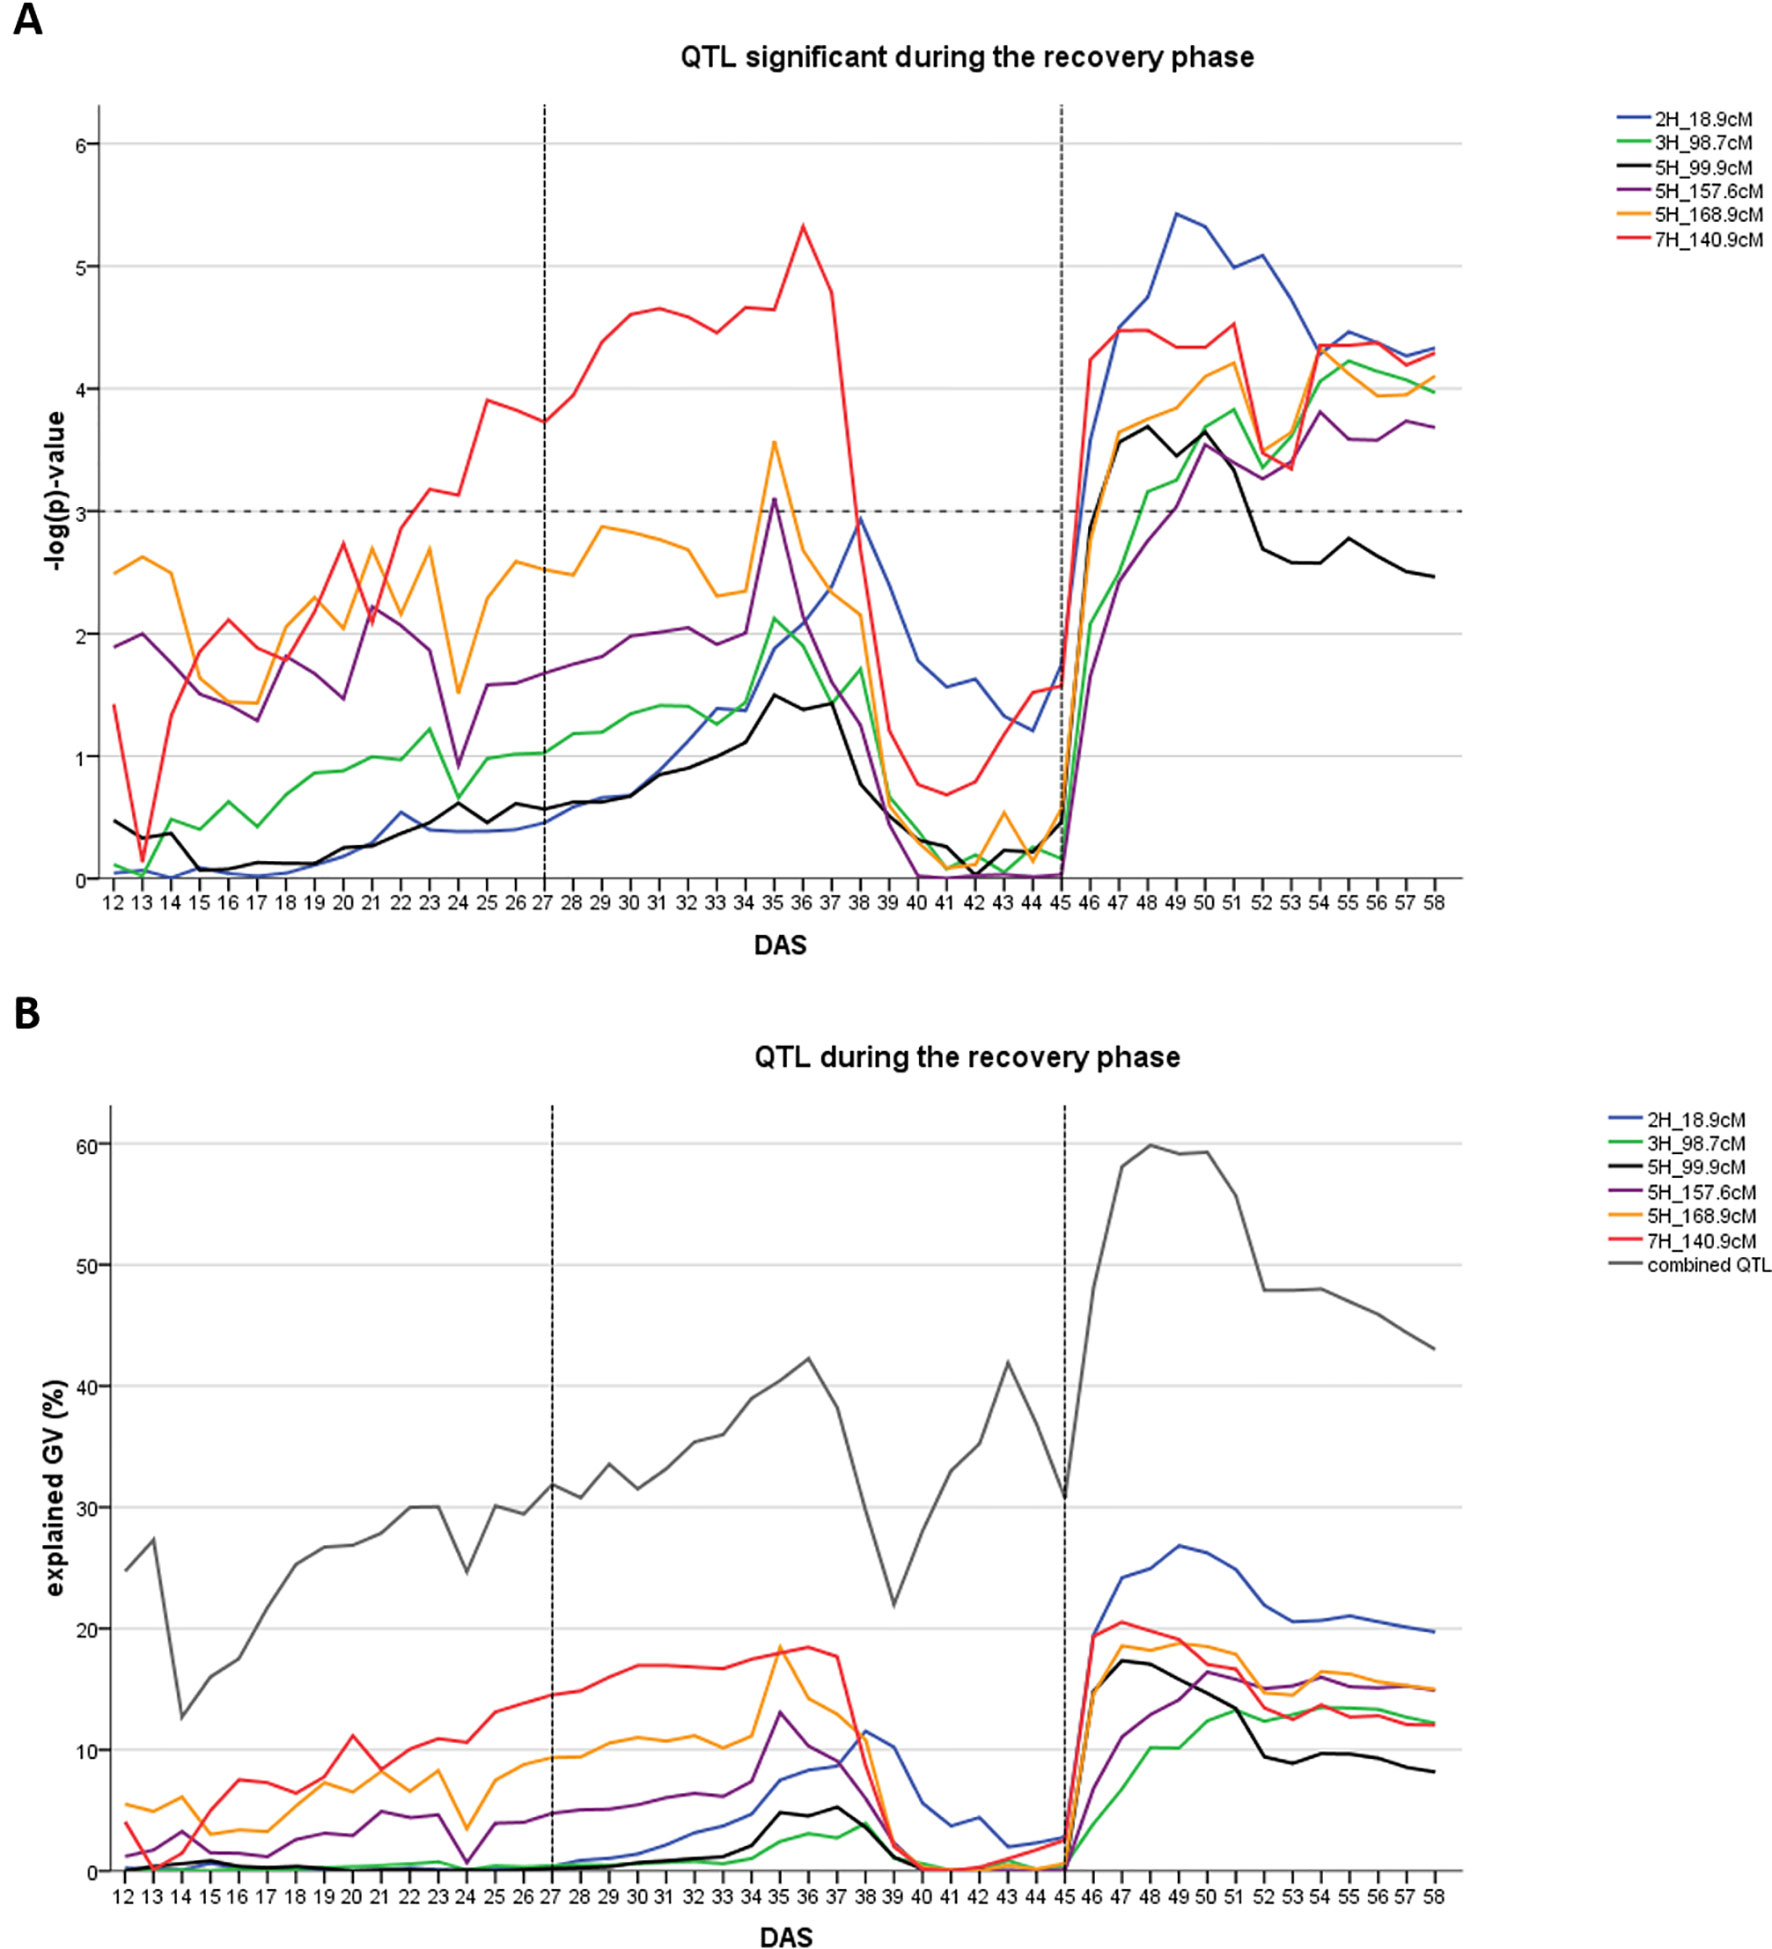
Figure 3 Time dynamics of association of QTL significantly associated (FDR < 0.1) with digital biomass (DB) during the recovery phase in days after sowing (DAS). The drought stress phase from DAS 27 to DAS 45 is indicated by the two dashed vertical lines. (A) Significance value –log(p) over time for each QTL (SNP with the highest significance) in different colors. Arbitrary threshold of significance at –log(p)=3 is indicated by a dashed horizontal line. (B) Proportion of genetic variance explained by each QTL, represented in different colors and combined (all 12 QTL detected during the whole time-course of the experiment – drought and recovery period).
Genetic Architecture of Novel Traits Obtained From Growth Curve Modelling
Four QTL were detected for Time A (Supplementary Figure S7, Supplementary Table S5): on 2H (135.8 cM), 6H (55 cM) and on 7H (14.0 and 140.9 cM). Here, the 7HL locus at 140.9 cM is represented by a different SNP (SCRI_RS_230261) compared to biomass (SCRI_RS_167617). The combined four QTL explain 40.2% of the genetic variance. Individually, the QTL on 7HS at 14 cM explained 22%, followed by those on 2HL (10.5%), 7HL (9.3%) and 6H (0.8%).
For biomass at time A (DBA), no SNP passed the FDR, although eight SNPs showed –log(p) values ≥ 3, including SCRI_RS_167617 on 7HL at 140.9 cM (Supplementary Figure S7).
The trait fAW_TA was significantly associated with three SNPs (Supplementary Figure S8, Supplementary Table S5) corresponding to one QTL on 3H (45.8–46.0 cM). The QTL explained 24.4% of the genetic variance.
For the re-growth rate k no SNP was passing the FDR, but 15 SNPs showed –log(p) > 3, including SCRI_RS_167617 on 7HL (140.9 cM) and two SNPs in the region of HvPPD-H1 (Supplementary Figure S9, Supplementary Table S5).
Genetic Architecture of Tiller Number Under the Influence of Drought Stress
Tiller number was counted at the start and at the end of drought stress as well as at the end of the experiments (DAS 27, 45 and 58, respectively). For each time point significant QTL were detected (Supplementary Figure S10, Supplementary Table S5).
In total, four QTL were significant for tiller number at DAS 27: 5H (43.7–45.7 cM), 5H at 120.1 cM, 6H at 30.1–30.2 cM and the biomass QTL on 7H at 140.9 cM. Together these four QTL explained 25.9% of the genetic variance, while the individual contribution ranged between 0.4% (5H 43.7–45.7 cM) and 20% (7H 140.9 cM).
For tiller number at DAS 45 three QTL were detected: 5H (43.7–45.7 cM), 6H at 30.1–30.2 cM, and 6H at 55 cM, the first two QTL identified already for tiller number at DAS 27. In combination, these three QTL explained 14.6% of the genetic variance. The most prominent QTL was the locus on 6H at ∼30 cM, which explained 18.6%, while the remaining two QTL explained only up to 0.64%.
For tiller number at DAS 58, three QTL were detected: 2H (74.1 cM), 5H (42.9–45.7 cM), and 6H at 30.1–30.2 cM. Together these explained 24.4% of the genetic variance. The most important QTL was on 6H at 30 cM, explaining 20.2% of genetic variance, while the QTL on 5H and 2H explained 4.5 and 2.2%, respectively.
Discussion
The Influence of Drought on Growth Patterns
The described experiments are complementary to the study of Neumann et al. (2017) where the same barley lines were evaluated under well-watered conditions (control treatment). The controlled conditions applied in the present study helped to eliminate small environmental effects that negatively impact heritabilities in drought stress experiments heritabilities (Rosielle and Hamblin, 1981; Fukai and Cooper, 1995; Kumar et al., 2007).
Comparing biomass under drought stressand control conditions, the ranking of genotypes changed during drought but quickly re-established once plants were re-watered (Supplementary Figure S11). At the start of stress treatment, plants had already more biomass and tillers compared to control treatment (Supplementary Figures S12 and S13). The differences can be attributed to different seasonal scheduling of experiments (Supplementary Table S6 compared with Supplementary Table S1). Therefore, future experimental series should be planned very carefully. Biomass was reduced in drought by 32% compared to control at the end of the experiment (Supplementary Figure S14). Directly upon re-watering, the reduction amounted to even 51% for biomass and 40% for tiller number. However, the re-tillering ability of barley (Jamieson et al., 1995) lead to an even slightly higher (although not significant) tiller number at the end of recovery phase compared to control treatment. Although the absolute number of tillers can be increased after drought (Blum et al., 1990), drought stress during the booting stage leads to a reduction in the number of productive tillers and a concomitant decrease in grain number and seed set (Lawlor et al., 1981; Rajala et al., 2010; Mathew et al., 2019).
Akin biomass, tipping time was affected by seasonal differences (see Supplementary Material). Vegetative drought stress can delay flowering as reported for wheat (Sanad et al., 2019) and rice (Kondhia et al., 2015; Haque et al., 2016). Early biomass was negatively correlated with tipping, but with progressing growth and development, the signs changed (Supplementary Figures S15 and S16), only disrupted by the wilting of plants. Biomass in the recovery period was then even stronger correlated with tipping compared to the control treatment. Accordingly, the QTL in the HvPPD-H1 region was the most important in the recovery phase whereas it was not significant under control conditions. Plant recovery is so far a mainly unexplored trait. However, a recent study in wheat showed that the ability to recover might be useful for selecting drought tolerant genotypes as visually scored plant recovery was correlated with grain yield under a vegetative drought set up in 16 diverse genotypes (Sanad et al., 2019).
Genetic Architecture of Biomass Under the Influence of Drought Stress
By comparing the QTL identified in both treatments, it is possible to determine constitutive and adaptive QTL based on the definition given by Collins et al. (2008) who referred to a constitutive QTL when it is present in all environments whereas adaptive QTL are only present in a subset of environment(s). By this definition, we considered a QTL as constitutive when it was i) significantly associated with biomass in both treatments or ii) significantly associated in one treatment and having, –log(p)-values >3 in the complementary treatment (although missing the FDR threshold). Accordingly, we considered a QTL as adaptive if it was only in one treatment significantly associated and in the complementary had –log(p)-values <3.
The comparison of the results from this study with previously published QTL data benefitted in two ways: Firstly, our barley panel is part of larger collection consisting of 224 genotypes, which had been employed in a series of QTL studies, enabling a direct comparison of QTL (Pasam et al., 2012; Alqudah et al., 2014; Alqudah et al., 2016; Alqudah et al., 2018; Abdel-Ghani et al., 2019; Zhongtao et al., 2019). Secondly, comparison to other GWAS studies in barley benefitted from the widespread deployment of the 9K iSelect array (Table 1).
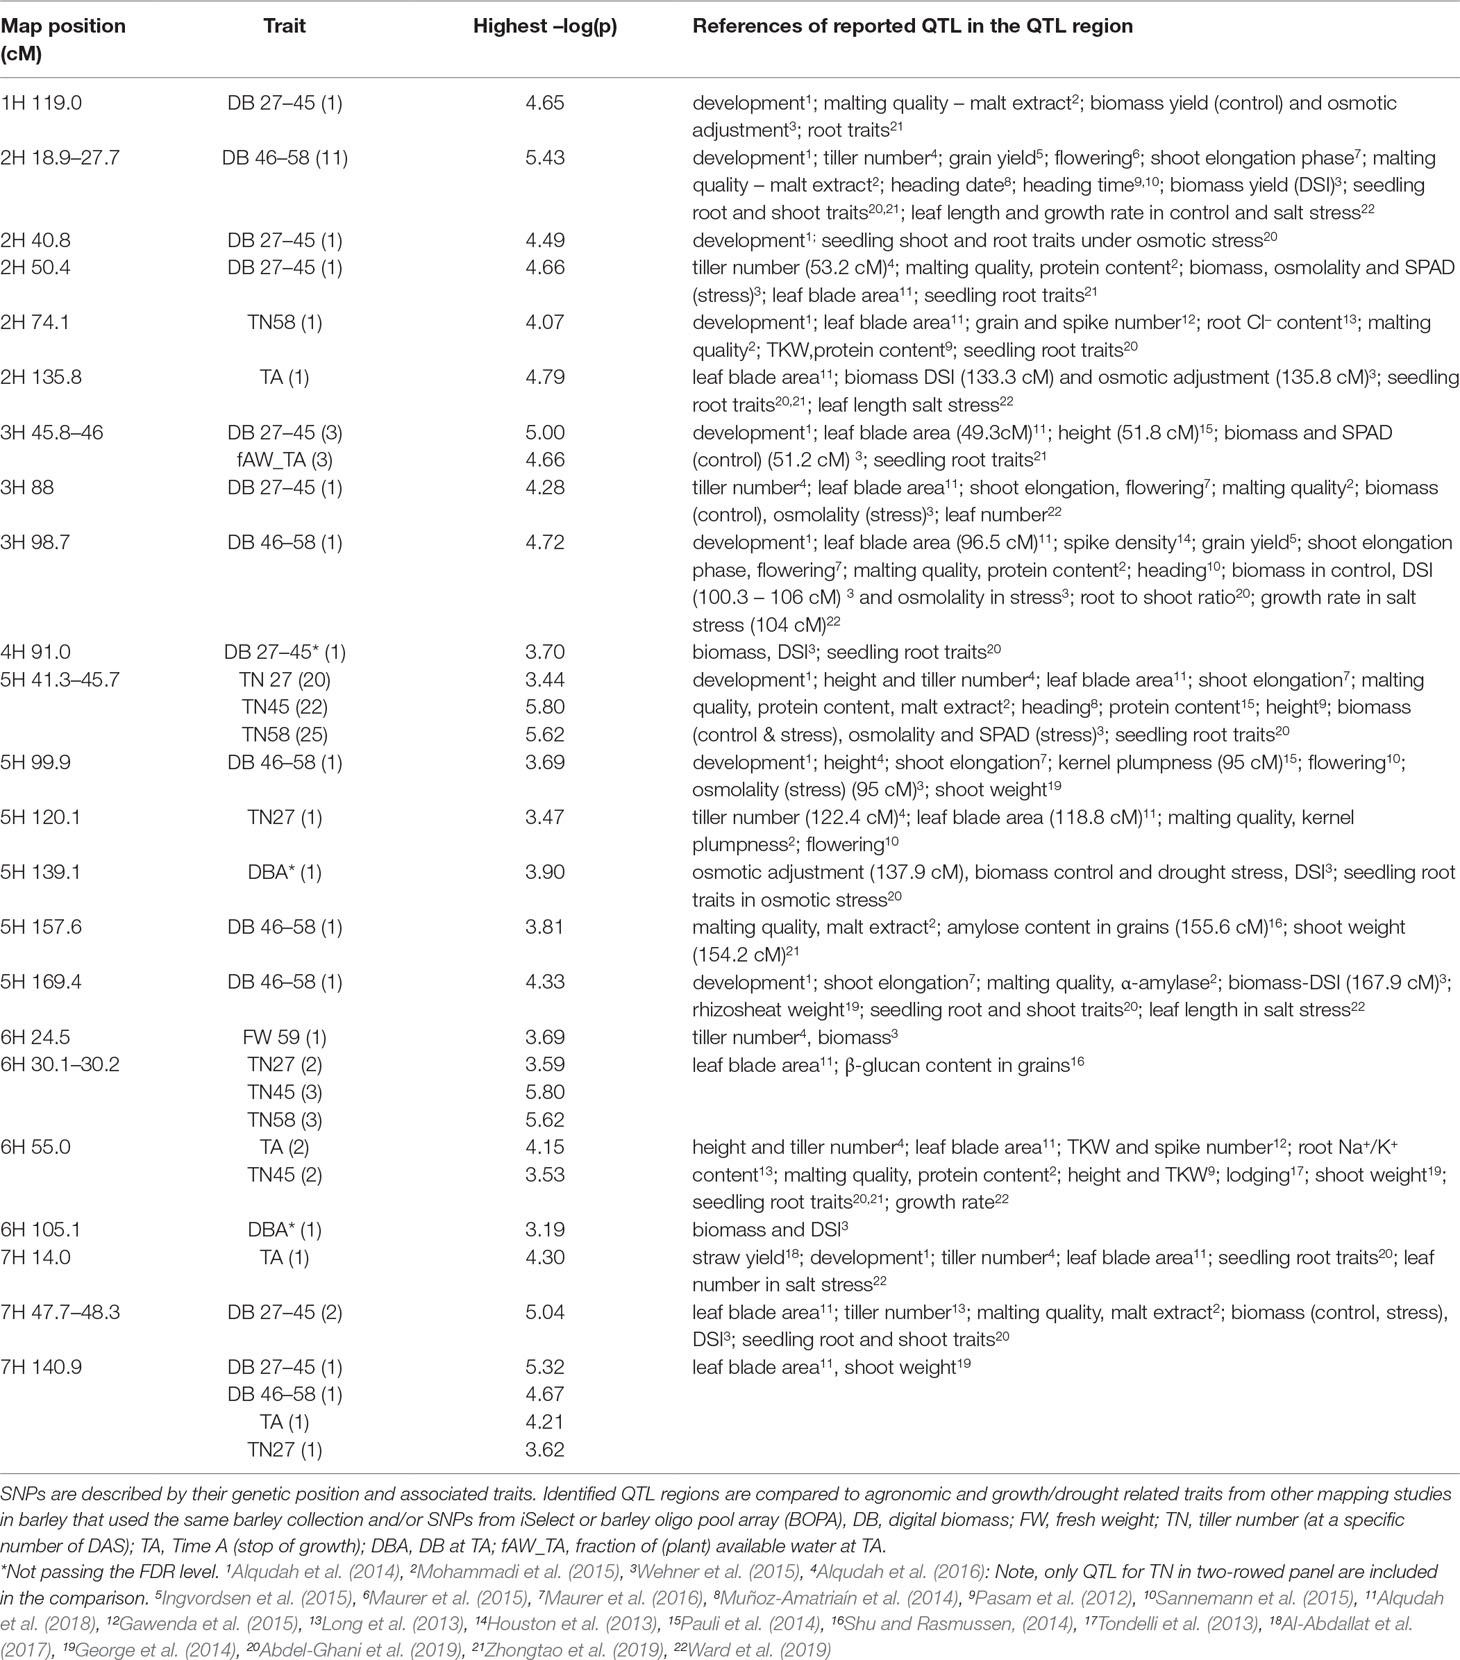
Table 1 Summary GWAS results from non-invasive phenotyping of growth under drought stress. All genomic regions significantly associated with one or more traits are presented along with the highest –log(p)-value of each trait (number of significant SNPS in brackets) along with other traits reported to be associated with these regions from the literature where iSelect marker platform was deployed.
Constitutive Biomass QTL
Across both studies, 17 biomass QTL were detected, eight of them are classified as constitutive. The first on 7HS at 14.0 cM located in the vicinity of HvWAXY is the only seedling biomass QTL. It had very similar –log(p)-values in both studies (Figure 4A) but did not pass the FDR in the current study. In the full barley panel, a QTL for root thickness at seedling stage was associated with the same SNP (SCRI_RS_240014) and QTL for tiller number, leaf blade area and tipping time were mapped to the same region (Table 1). A high level of vegetative biomass at early growth stages may translate to biomass at maturity in conditions with little or no rainfall after plant establishment. Accordingly, in a different barley panel, a QTL for final straw yield in Jordanian field conditions was detected here.
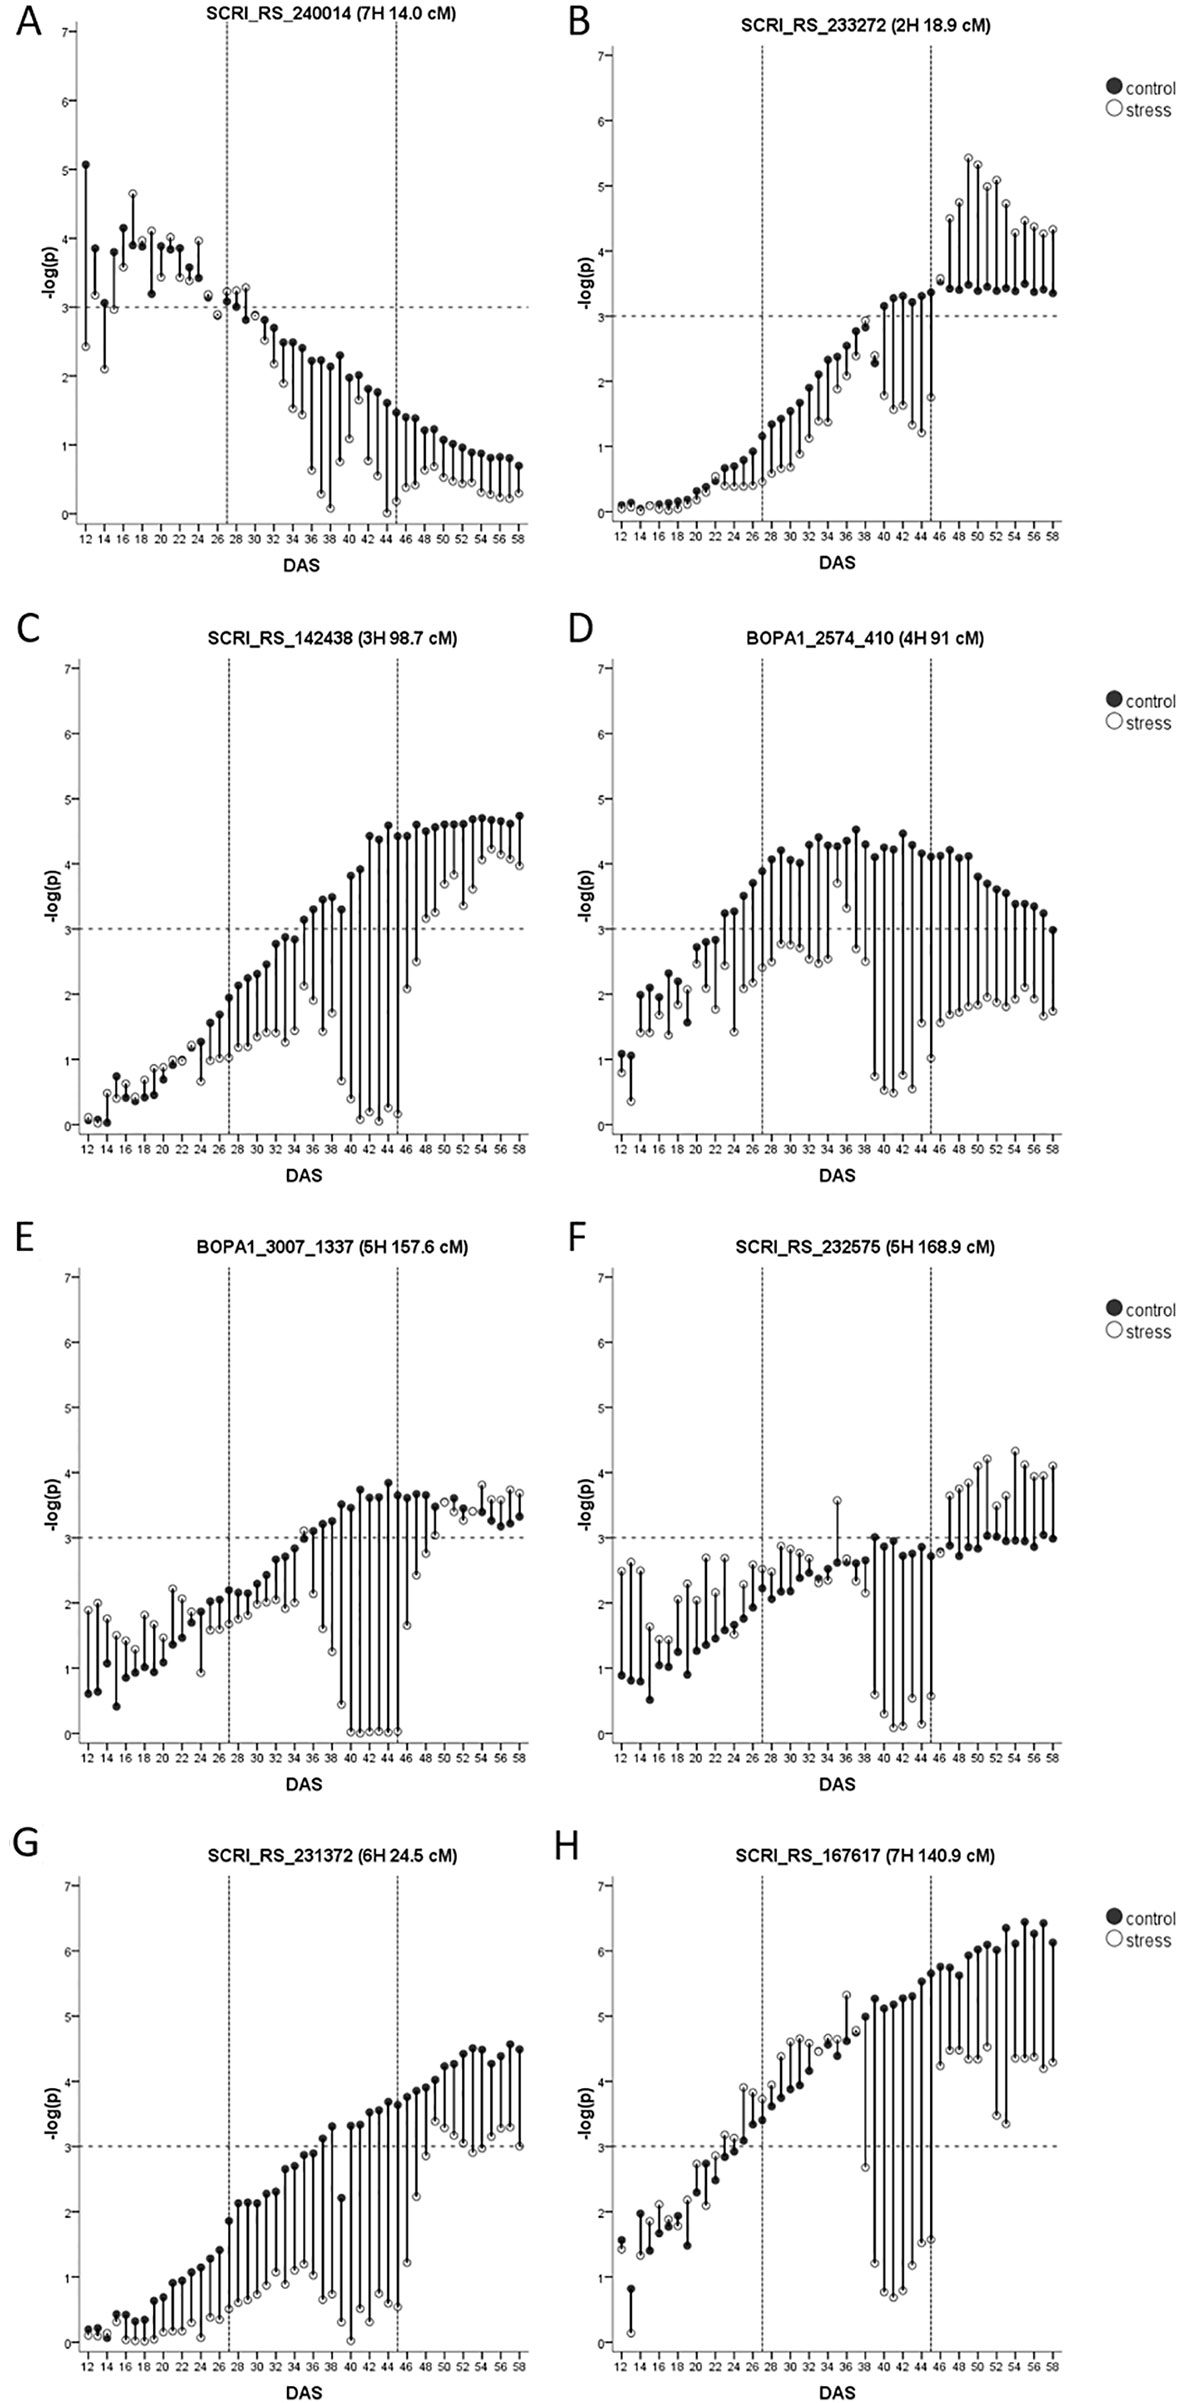
Figure 4 (A–H) Constitutive biomass QTL with their –log(p)-values over time in days after sowing (DAS) in drought stress (unfilled) and well-watered (black) conditions. Presented is only the most significant SNP of each QTL (in case it consists of several SNPs). As the FDR is calculated for each day and in each treatment separately, the general significance level of –log(p)-value = 3 is indicated by a dashed horizontal line. The drought stress phase from DAS 27 to DAS 45 is indicated by the two dashed vertical.
The most prominent QTL during the recovery phase was the HvPPD-H1 locus. The QTL was not passing the FDR in control but already showed –log(p)-values >3 (Figure 4B). However, the role of this QTL has increased under the influence of drought, which is in line with increased expression levels of this gene under drought stress (Habte et al., 2014). The region was further detected as a hotspot for seedling growth in the full barley panel under normal and osmotic stress conditions, and co-locates with many agronomic traits (Table 1).
The QTL on 3HL at 98.7 cM (Figure 4C) passed the FDR in both studies and explained a very similar proportion of the genetic variance. In the full barley panel, the same SNP (SCRI_RS_142438) was associated with the root to shoot ratio under osmotic stress. Further, QTL for biomass, the drought susceptibility index (DSI) and osmotic adjustment in DS in a winter barley panel were located in close distance (Table 1). The QTL is located in the vicinity of flowering time gene HvCMF1 (Cockram et al., 2012) and of AK366153, a supposed homolog of LpABCG5 from Lolium perenne L. (Supplementary Table S7). This member of the ATP-binding cassette protein subfamily G was identified as a candidate behind a QTL for plant architecture (Shinozuka et al., 2011). In accordance with these two candidate genes, this genomic region is associated with many agronomic important traits such as heading, grain yield, or plant height (Table 1).
The constitutive QTL on 4HL at 91.0 cM was the only QTL found during the middle of the growth observation period under control conditions but did not pass the FDR under drought stress (Figure 4D). At close distance (90.9 cM) a QTL was detected for biomass and the DSI in winter barley, while in the full barley panel, root length QTL were located at 91.1 and 91.7 cM under control and osmotic stress conditions, respectively (Table 1). We detected three growth-related candidate genes in this region (Supplementary Table S7). The MADS-box transcription factor BM1 is located in the physical map interval of the QTL. Bm1 is one of the SVP genes and is mainly expressed in vegetative tissues such as nodes and internodes (Schmitz et al., 2000) and has a suggested role in vegetative growth (Carmona et al., 1998). Digel et al. (2016) observed a complete downregulation of Bm1 upon floral transition. The expression pattern of BM1 observed by Trevaskis et al. (2007) fits with the timing of our QTL. A second growth-related candidate gene is one ARF that is in close physical distance. Further, MLOC_17989.1 annotated to transport potassium is located at 91.4 cM and shows a high similarity to HvHAK1 on 2H (58.7 cM). A drought-related candidate represents HvTIP1;1 at 91.7 cM (Supplementary Table S7).
The QTL on 5HL at 157.6 cM was significant for biomass during the recovery phase of the drought treatment but did not pass the FDR under control conditions although timing and –log(p)-values were very similar (Figure 4E). In 3.5 cM distance, a QTL for seedling shoot weight was identified in the full barley panel (Zhongtao et al., 2019). HvCesA2 resides at 158.3 cM, encoding a cellulose synthase expressed in seedling leaves and required for cell wall synthesis (Burton et al., 2004). Further, a potential homolog of the rice OsFEN-1b gene is located at 157.8 cM. It is encoding for a Flap endonuclease-1 (Supplementary Table S7) with a putative role in cell proliferation in the shoot apical meristem and young leaves Kimura et al. (2003).
Another constitutive QTL on 5HL at 169.4 cM was significant for biomass during the recovery phase but did not pass the FDR in the control treatment (Figure 4F). At the seedling stage, the region was associated with growth under non-stress and osmotic stress conditions in the full barley panel. In the same region, a constitutive QTL for biomass and for DSI and a QTL for rhizosheat were detected in other collections (Table 1). Interestingly, this genomic region harbors a key enzyme in the biosynthesis pathway of gibberellin, HvGA20ox1. In wheat, TaGA20ox1 is expressed mainly in the nodes and ears of the elongating stem and in developing and germinating embryos (Appleford et al., 2006). The rice homolog OsGA20ox1 has a role in seedling vigor and plant stature (Abe et al., 2012) as well as biomass (Oikawa et al., 2004). Drought-related candidates represent HvPIP2;8 and the heat shock transcription factor HvHsfA1a (Supplementary Table S7). It is mainly known as a key factor of heat stress sensing in Arabidopsis (Liu et al., 2013); a role under drought in barley is so far unknown. However, in tomato, overexpression of HsfA1a was enhancing drought tolerance (Wang et al., 2015).
A constitutive biomass QTL is located on the short arm of 6HS at 24.5 cM (Figure 4G), although it failed the FDR threshold in drought treatment. At a very similar position (24.8 cM) a QTL for biomass in winter barley was identified (Table 1). Nearby, we detected a constitutive QTL for tiller number (30.1–30.2 cM), and it remains open if these are independent QTL or represent the same locus, especially as the SNP at 24.5 cM is not located on the physical map. There is no LD between SNPs of the two loci, indicating independence of the QTL. However, in the full barley panel, QTL for tiller number were identified at 24.5 cM and 28.5 cM along with a QTL for the leaf blade area at 28.5 cM (Table 1). Interestingly, 1-FEH encoding a β-fructan 1-exohydrolase is located at 28.6 cM (Nagaraj et al., 2004). A further gene at 32.0 cM shows high similarity to 1-FEH (Supplementary Table S7). In wheat, three homologs of the 1-FEH gene were mapped to 6A, 6B, and 6D (Zhang et al., 2008). 1-FEh w3 (6B) conferring a higher TKW under drought conditions shows highest sequence similarity with barley 1-FEH (Zhang et al., 2015), while 1-FEh w2 (6D) is involved in translocation of sugar from stem to grains (Yáñez et al., 2017).
The constitutive biomass QTL on 7HL at 140.9 cM (SCRI_RS_167617) was in both studies passing the FDR (Figure 4H). In control conditions the QTL started to be significant at DAS 33. By contrast,it started to disappear with progressing drought until plants were re-watered. Only the QTL at HvPPD-H1 explained a higher proportion of the genetic variance in the recovery phase. Therefore, the 7HL locus represents the most stable and important biomass QTL in our barley panel. The same SNP was associated with seedling shoot weight in a different spring barley population (George et al., 2014). In the full barley panel, the region was revealed as a hotspot for sshoot and root traits at seedling stage (Abdel-Ghani et al., 2019), indicating the relevance of this locus also at earlier developmental stages. Very close to the QTL resides HvDIM and further genes involved in growth (Supplementary Table S7).
While most constitutive biomass QTL were co-locating with QTL for biomass in winter barley (Wehner et al., 2015), the QTL on 7HS and 7HL seem to be of importance only in spring barley. More research is needed to understand the role and timing of biomass QTL in the different genetic backgrounds (six-rowed barley, winter types) and field studies have to be carried out to verify their relevance and their relation to grain yield.
Adaptive Biomass QTL
In total we classified nine biomass QTL across both studies as adaptive, seven of them were passing the FDR only in the current study for growth in drought conditions, while the remaining two QTL were detected only in the control treatment.
Adaptive Biomass QTL for Biomass Prior to Drought or During Early Drought Phase
Two adaptive seedling biomass QTL, located at 3HL at 105.9 cM and 4H at 43.6 cM were detected only under well-watered conditions (Supplementary Figures S17A, B). The discrepancy in QTL detection for early biomass in both studies reflects the different seasonal scheduling, and a slightly shorter observation period in the drought study. In control, significant QTL for early biomass were detected between DAS 10 and 12, but in the current study, side view images needed for estimation of biomass were available only from DAS 12 onwards. In the full barley panel, both QTL regions were associated with root traits at seedling stage (Abdel-Ghani et al., 2019; Zhongtao et al., 2019), underlining their relevance for seedling growth. A strong candidate gene for the QTL on 3HL is HvGA20ox3, while for 4H the candidate might be a WRKY transcription factor (Supplementary Table S7). In Arabidopsis some of the WRKYs were shown to promote brassinosteroid regulated plant growth (Chen and Yin, 2017).
One adaptive QTL located on 1HL at 119 cM was significant at the beginning of drought treatment (Supplementary Figure S17C). However, we obtained –log(p) > 3 already before the onset of drought. Agronomic and drought-related QTL were mapped to the same region in the full barley panel or different collections (Table 1). HvARF20, and a gene with high similarity with TaGA2ox8 reside very close to this QTL (Supplementary Table S7).
Another adaptive QTL on 3HL at 88 cM showed high –log(p)-values already prior drought but only turned significant at DAS 43 (Supplementary Figure S17D). It co-locates with a QTL for tiller number and leaf blade area in the full barley panel and with a QTL for biomass, DSI, and osmolality in winter barley (Table 1). Therefore, the region may be indeed related to both growth and drought tolerance. Four potential candidate genes were detected (Supplementary Table S7): pmei3, HvDof9, and ABF1 encoding for a bZIP transcription factor (Sarkar and Lahiri, 2013). In rice, OsABF1 was induced by abiotic stresses and connected with enhanced drought tolerance (Hossain et al., 2010). Additionally, a barley homolog to WUSCHEL-RELATED HOMEOBOX5 (WOX5) is located in 2.5 cM distance, involved in stem cell maintenance in the root apical meristem (Sarkar et al., 2007). It was shown that enhanced levels of cytokinin downregulate key root tip genes, including WOX5 and promote cell division in the root apical meristem (Zhang et al., 2013).
Drought and Recovery-Adaptive Biomass QTL
In total, five biomass QTL are classified as drought or recovery-adaptive.
Two drought-adaptive QTL on 2H (40.8 cM and 50.4 cM, Figures 5A, B), co-locate with QTL for biomass and agronomic traits (Table 1) and the genomic positions of the flowering time genes HvCO18 and HvFT4, respectively. However, the two genomic regions harbor also genes related to drought tolerance (Supplementary Table S7). Within the vicinity of the QTL at 40.8 cM HvHAK2, a potassium transporter of the KUP6 family and a second potassium transporter that shows 65% sequence similarity with HvHAK2 are located. For the QTL at 50.4 cM, a candidate could be MLOC_58500.1 with homology to the wheat heat transcription factor TabZIP28 that is upregulated by heat and drought (Geng et al., 2016).
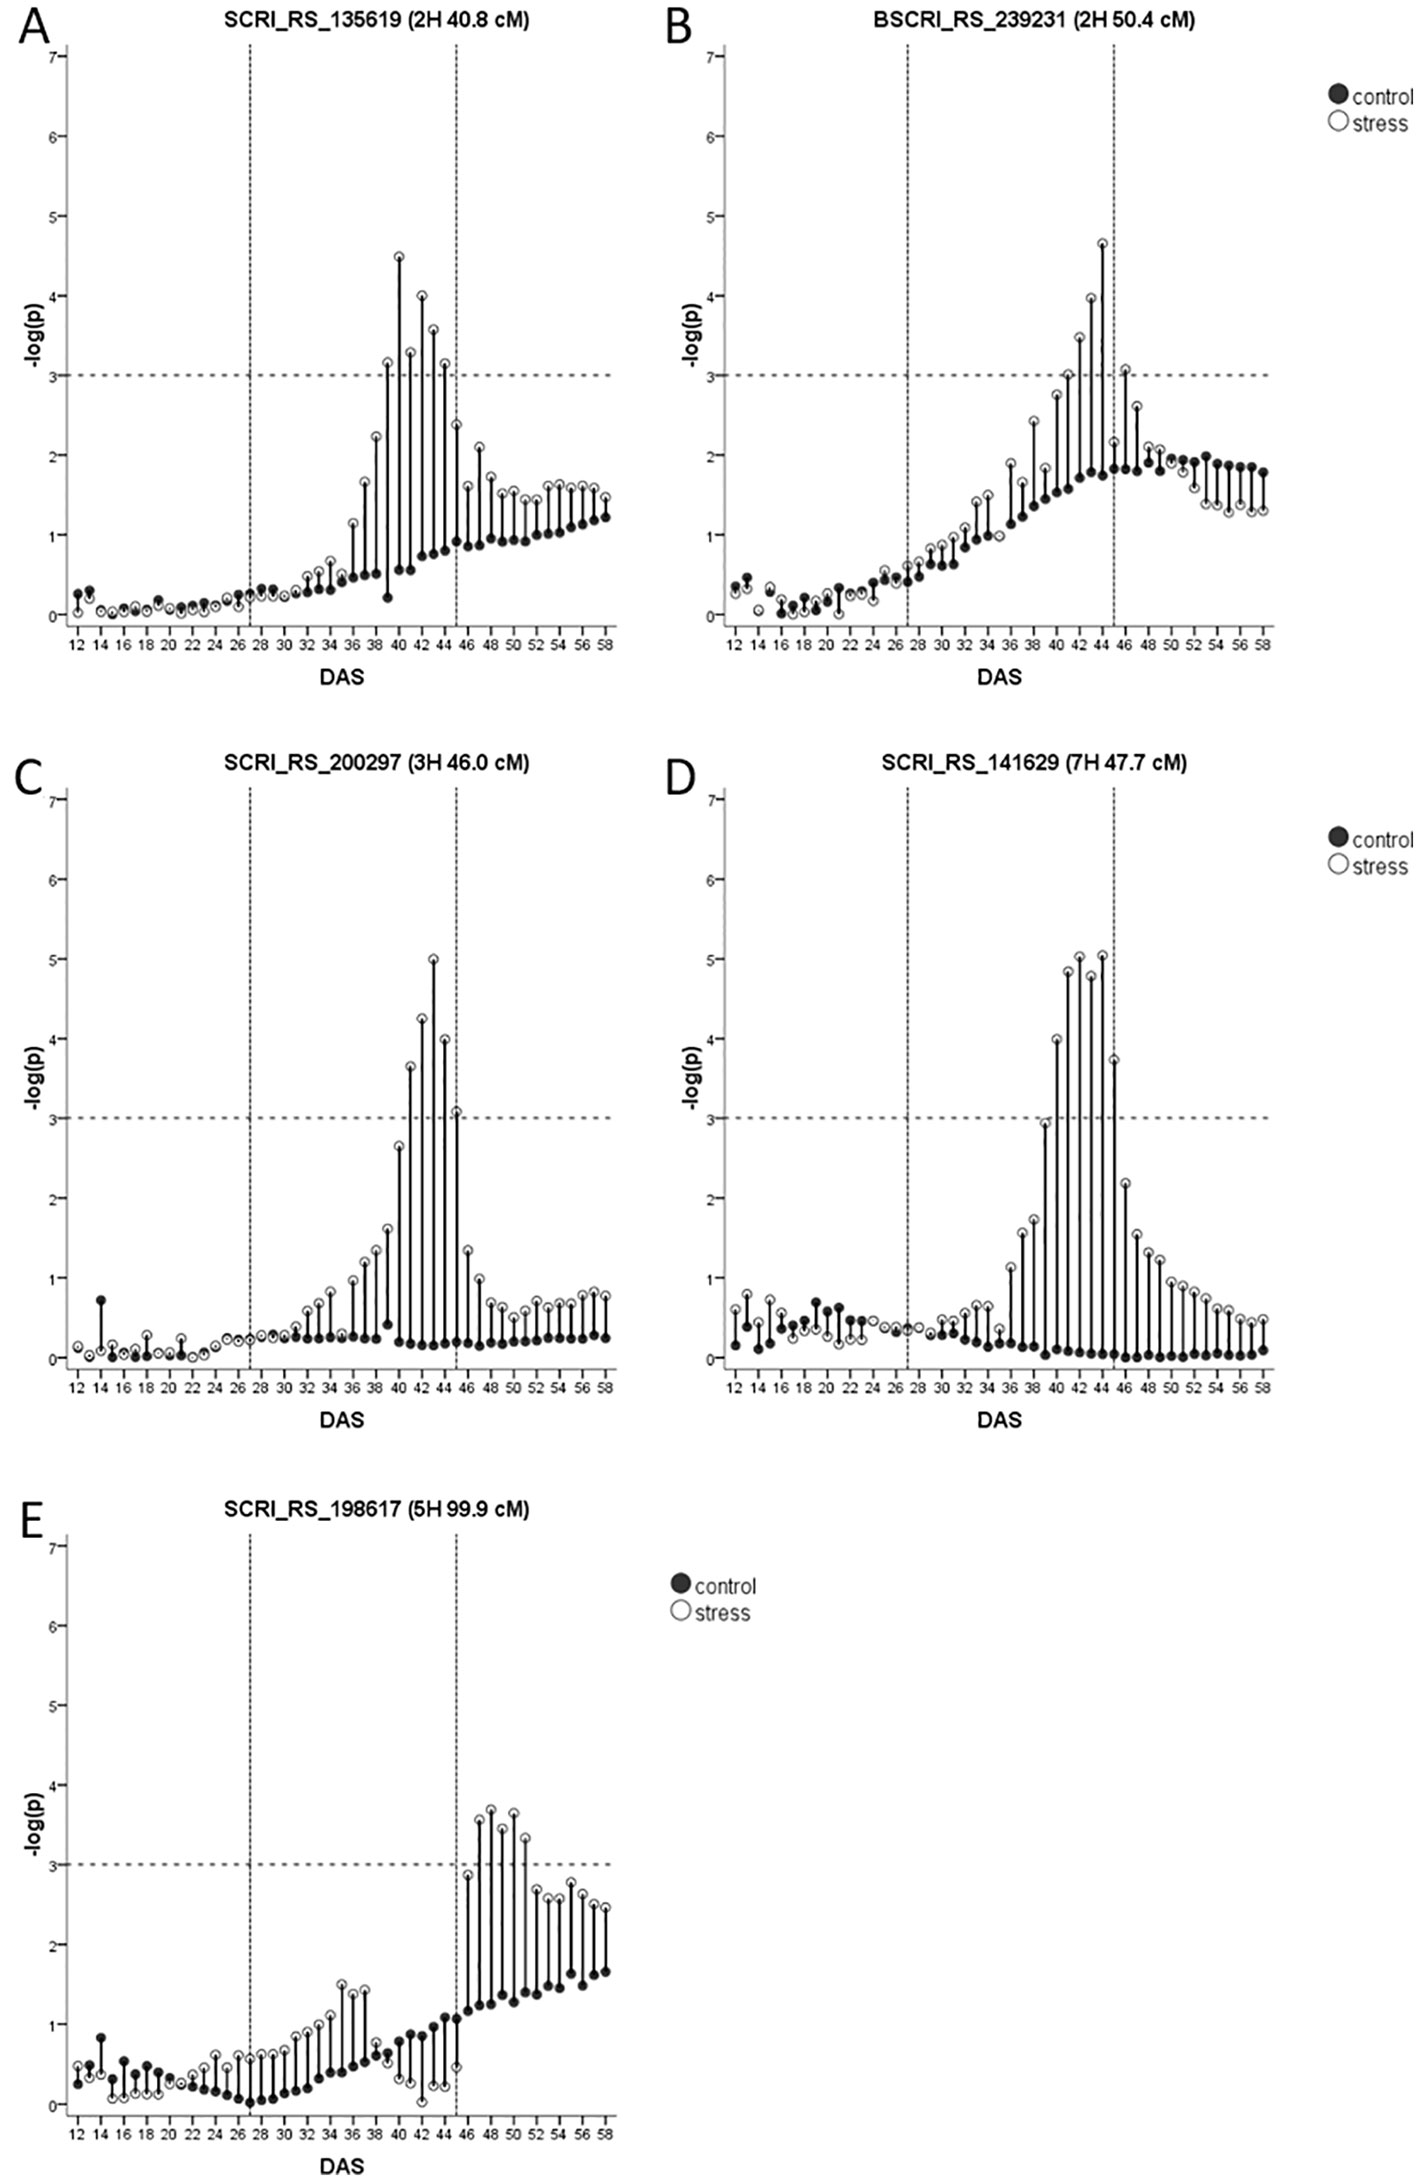
Figure 5 (A–E) Drought-adaptive biomass QTL with their –log(p)-values over time in days after sowing (DAS) in drought stress (unfilled) and well-watered (black) conditions. Presented is only the most significant SNP of each QTL (in case it consists of several SNPs). As the FDR is calculated for each day and in each treatment separately, the general significance level of –log(p)-value = 3 is indicated by a dashed horizontal line. The drought stress phase from DAS 27 to DAS 45 is indicated by the two dashed vertical lines.
A very interesting drought-adaptive QTL in the centromeric region of 3H (Figure 5C) co-locates with the known flowering time gene HvGI (Dunford et al., 2005). The QTL further coincided with the only QTL identified for fAW at time A. In the full barley panel, several QTL for root system angle and root system depth were residing in this genomic region (Zhongtao et al., 2019). Moreover, in winter barley, a biomass QTL under WW conditions and a QTL for leaf color under drought stress were detected in this region (Wehner et al., 2015). HvGI is reported to have pleiotropic effects on other traits like plant height, grain yield, harvest index (Wang et al., 2010) and in terms of physical map position it is indeed the closest candidate gene (Supplementary Table S7). However, the centromeric region also harbors other potential candidate genes. At 44.1 cM the barley homolog of rice CYP90D2/D2is located. It encodes a cytochrome P450, that was reported to be completely deleted in the BR mutant csdd1 (Li et al., 2013). Further, HvCKX1 is located at 45.8 cM (Mameaux et al., 2012). In tobacco and Arabidopsis, downregulation of cytokinin through overexpression of CKX1 led to increased drought tolerance (Lubovská et al., 2014; Prerostova et al., 2018). RNAi silencing of HvCKX1 led to a higher yield caused by an increased number of spikes and seeds (Zalewski et al., 2014). Another very interesting drought-candidate is HvABCG31/Eibi1 (46.3 cM) responsible for cuticle formation (Chen et al., 2011; Nevo, 2014). Variation in the promoter sequence of this gene was responsible for the variation in trait expression enabling wild barley plants to be more tolerant to drought conditions (Ma et al., 2012) and a drought-adaptive QTL in its vicinity encourages to study the effects of allelic variation within this genefor breeding purposes.
The last drought-adaptive QTL is located on 7HS at 47.7–48.3 cM (Figure 5D). It coincides with several QTL for seedling growth under control conditions and osmotic stress in the full barley panel and for leaf blade area (Table 1). QTL for biomass under stress and control conditions, and for DSI in winter barley (Wehner et al., 2015) are located in the same interval. A potential candidate could be a gene with 98% sequence similarity (Supplementary Table S7) to the type-B response regulator ARR12a of Lolium perenne (Roche et al., 2016). These transcription factors control cytokinin-dependent gene expression and are therefore critical for growth and the response to abiotic stress (Zubo et al., 2017). In close distance to the QTL, at 47.9 cM, resides an ethylene-responsive transcription factor (Supplementary Table S7).
The only recovery-adaptive QTL was detected on 5H at 99 cM (Figure 5E). It overlaps with the genomic region harboring the flowering time gene HvPRR95 (Supplementary Table S7). Several agronomic QTL and QTL for seedling biomass and osmotic adjustment were mapped in its vicinity (Table 1). Another major gene in this region is Vrs2. One natural allele of Vrs2 has been found correlated with plant development, leaf number, leaf area and tiller number in the full barley panel (Youssef et al., 2017) comprising two- and six-rowed genotypes. However, nothing is known about the effects of natural variation within one of the row type groups. Three more plausible drought-related candidates are located in the vicinity of the QTL. The first is HvPap-1 (HvSF42) encoding for a cysteine protease (CP) active during flag leaf senescence (Díaz-Mendoza et al., 2014). Its expression was upregulated after two weeks of drought, and interestingly, HvPap-1 knock-down lines showed an increase in cuticle thickness, stomata per area, ABA concentration and quantum efficiency of PSII under drought (Gomez-Sanchez et al., 2019). Accordingly, overexpression of the homologous wheat gene TaCP in Arabidopsis led to an increased survival after osmotic stress (Zang et al., 2010). The second drought-related candidate represents the heat stress transcription factor HvHsfB2c, playing a role in drought tolerance by possible control of expression of several subclasses of heat shock proteins (Reddy et al., 2014). A third drought-related candidate is the aquaporin HvPIP2;7.
QTL for Drought Tolerance Related Traits Obtained From Biomass Growth Curves
The genetic architecture of traits obtained from growth curve models has been studied here for the first time.
The stop of growth (and the onset of wilting) is reflected by the modeled parameter time A, which proofed to be very sensitive in case growth conditions are not sufficiently controlled (Neumann et al., 2015). After adjustment of greenhouse conditions, time A showed a high heritability, and four QTL could be detected. The dependence of time A on initial biomass in this diverse collection resulted in two out of four QTL for time A co-locating with QTL for biomass (Figure 6). The advantage of early flowering and thereby low biomass as a drought escape mechanism in severe drought conditions is well known (Shakhatreh et al., 2001; Paul et al., 2016; Shavrukov et al., 2017). Nevertheless, two QTL for time A were not associated with biomass in our study. The first positioned on 2HL (135.8 cM) is the second most important QTL for time A in respect to the explained genetic variance. It coincided with a QTL for tiller number at DAS 58 in control conditions and for root traits and leaf blade area in the full barley panel (Table 1). Further, QTL for osmotic adjustment and for the DSI in winter barley (Wehner et al., 2015) earmark this region as interesting to search for candidate genes for growth and for the delay of wilting (Supplementary Table S7). In this context, we identified HvGA3ox1 along with two copies of HvDof3, MLOC_73626.1 annotated as bZIP transcription factor, and HvEFP1, a member of the cysteine-rich EPIDERMAL PATTERNING FACTOR (EPF) family of secreted signaling peptides that is involved in stomatal development (Hughes et al., 2017). Barley plants overexpressing HvEFP1 showed a slower water loss during a drought period in a comparable growth stage as in our study and had higher water use efficiency and seed yield (Hughes et al., 2017). A QTL for delayed onset of wilting in its vicinity should emphasize evaluation of barley germplasm collections for natural variation of HvEFP1.
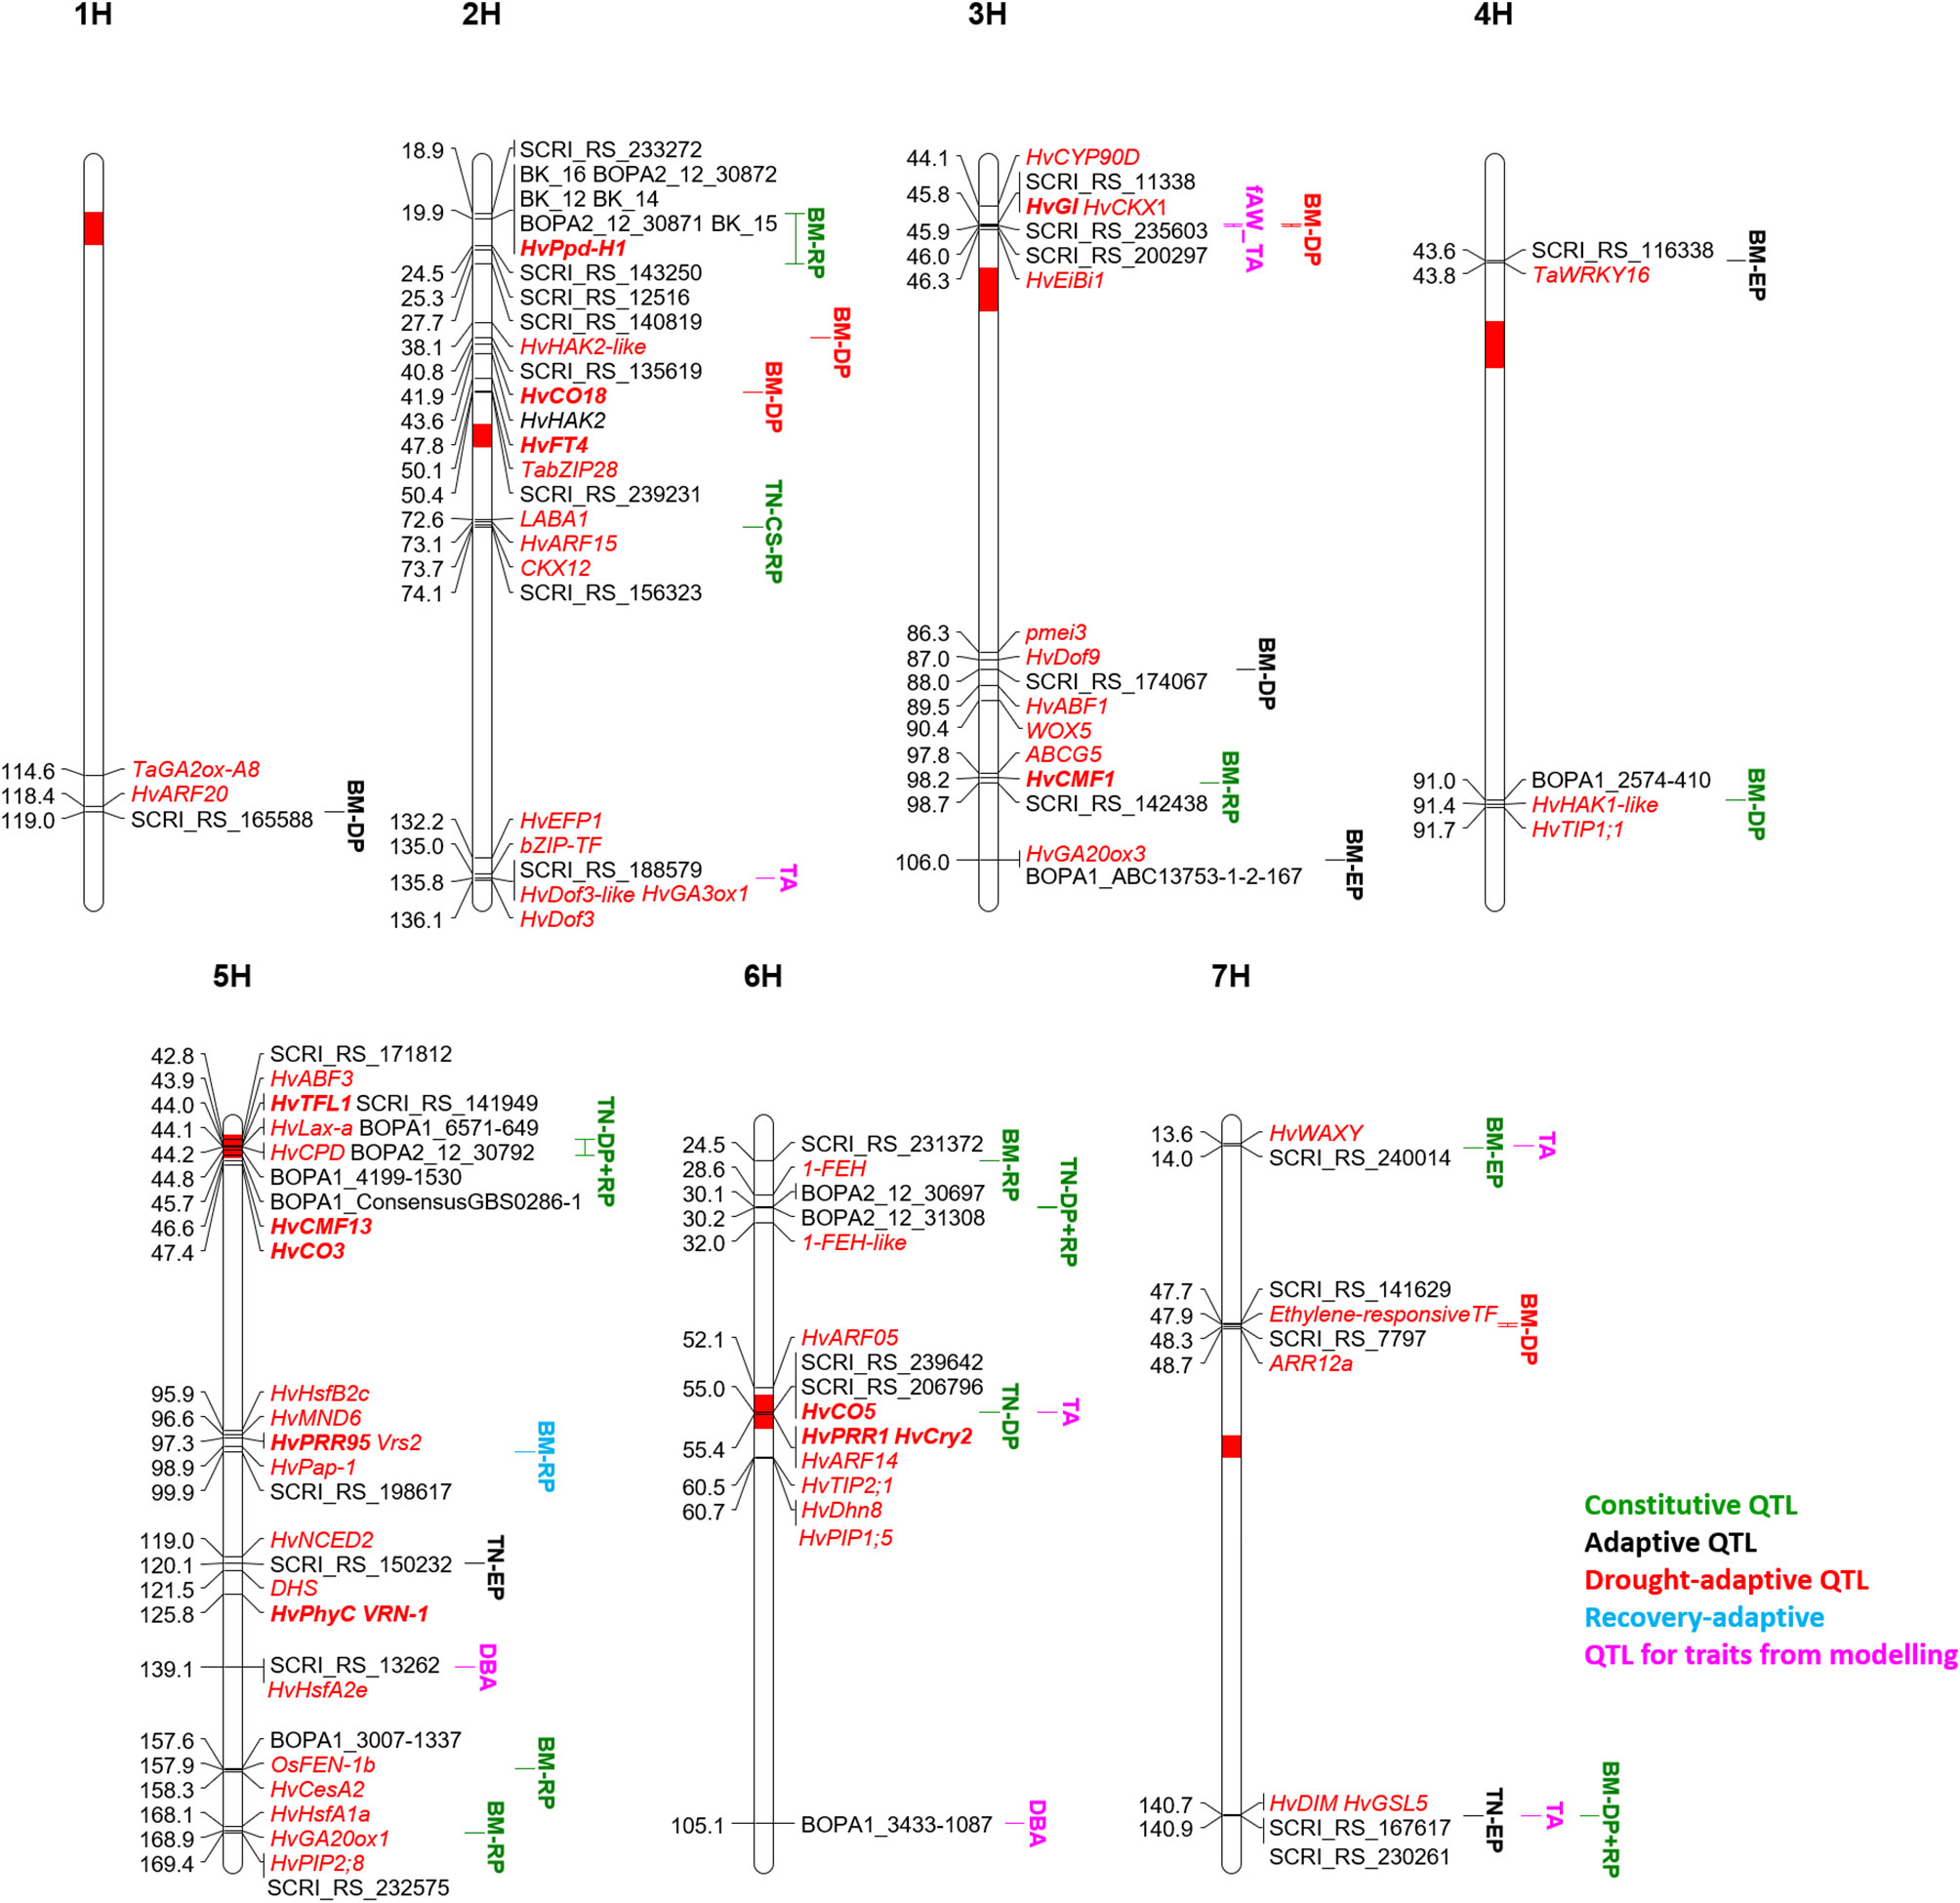
Figure 6 QTL map of the seven barley chromosomes 1H to 7H for classification of biomass (BM) and tiller number (TN) QTL along with QTL for traits from drought-growth pattern modelling: biomass at time A (DBA), time A (TA) and fraction of available water at time A (fAW_TA). The time period of significance of each QTL is indicated in the QTL name: early growth phase (EP), drought phase (DP), recovery phase (RP). All potential candidate genes are given in red and italic, the flowering time genes are additionally highlighted in bold.
The second QTL for time A is located on 6H at 55 cM and co-located with a QTL for tiller number at DAS 45 in both treatments, although coming from different SNPs. In the full barley panel, root QTL were located at the same position but also associated with different SNPs (Abdel-Ghani et al., 2019; Zhongtao et al., 2019). The centromeric region is reported to be associated with many QTL for agronomic traits and harbors several possible candidates, including three flowering time genes (Table 1). Further, HvARF05 and HvARF14 could be candidates for this locus. In winter barley, Wehner et al. (2015) observed with a QTL for osmotic adjustment under drought, which co-localizes with the QTL for time A. A candidate gene related to dehydration tolerance could be HvDhn8 (Supplementary Table S7), mainly induced by drought stress (Tommasini et al., 2008). Dehydration tolerance could also refer to HvTIP2;1 and HvPIP1;5.
For biomass at wilting time (DBA) no QTL passed the FDR. However, two out of six potential QTL (–log(p) values ≥ 3) were unique for this trait across both treatments: on 5HL at 139.1 cM and 6HL at 105.1 cM. Interestingly, a stress-specific QTL at the seedling stage was identified in the full barley panel at the same position of the QTL on 5HL, congruent with QTL for biomass and osmotic adjustment under drought stress in winter barley (Table 1). Two potential candidates were identified in a distance of 1 cM: the heat shock transcription factor HvHsfA2e and Dhn9 (Supplementary Table S7). Also, the DBA-QTL on 6HL co-locates with QTL for biomass and DSI in winter barley (Table 1). Drought-related candidates in that area represent Dhn4 and Dhn7 (Supplementary Table S7).
Similar as for DBA, also for the re-growth rate k no SNP passed the FDR, although 15 SNPs had –log (p) values ≥ 3. Nevertheless, no unique locus was detected, and so, k seems not to yield additional information on re-growth on the genetic level.
Genetic Architecture of Tiller Number Under the Influence of Drought Stress
In many cases, a higher number of tiller reflects higher biomass (Jaradat et al., 2005). Similar to biomass, the genetic architecture of tiller number changed over time according to earlier studies in rice (Yan et al., 1998; Abe et al., 2012; Alqudah et al., 2016) and wheat (Li et al., 2010). In total, we detected 14 QTL across both studies, six in the current study, and twelve in the control treatment (Neumann et al., 2017). Four QTL were found in the current study at DAS 27 in contrast to the previous study. The discrepancy may arise from the discussed differences in early plant development in both studies. As for biomass, we classified the tiller number loci into constitutive or adaptive QTL. In this way, four QTL were classified as constitutive (Figure 6), while ten QTL were classified as adaptive.
Constitutive Tiller Number QTL
The first constitutive QTL for tiller number on 2HL at 74.1 cM was detected as a hotspot for root and shoot traits at seedling stage in the full barley panel and co-located with other agronomic QTL in different studies (Table 1). A candidate might be MLOC_52145.1 (Supplementary Table S7) with high similarity to maize CKX12, which was shown to be highly expressed in the maize shoot at the five-leaf stage (Gu et al., 2010). In rice, down-regulation of a CKX lead to an increased tiller number in transgenics in the field (Yeh et al., 2015). Another candidate gene (MLOC_6463.1) has high similarity to LABA1 in rice (Supplementary Table S7). LABA1 is involved in the final step of bioactive CK biosynthesis. In rice, LABA1 is responsible for awn frequency and awn length mediated by CK in the awn primordia (Hua et al., 2015). A function of this gene for tillering in barley remains speculative, but also expression of MONOCULM 3 in rice was induced by cytokinin, a gene known to be required for axillary bud formation (Lu et al., 2015). Moreover, HvARF15 is located at 73.1 cM. In rice, miR167 is regulating ARFs, and miR167 overexpressing lines showed a lower tiller number in the vegetative stage in connection with downregulation of four OsARFs (Liu et al., 2012).
Tiller number at DAS 45 and 58 in the control treatment, and tiller number at all three time points under drought stress were mapped to the centromeric region of 5H, which harbors the gene HvLax-a (Jost et al., 2016). Together with its paralogue of Hvre-t4 (Uniculm 4) (Tavakol et al., 2015) is known to control tillering in barley. Accordingly, QTL for tiller number were also mapped to the same region in the full barley panel (Table 1) and in a different barley collection (Mora et al., 2016). Many further agronomically important genes and QTL map to the centromeric region (Table 1).
The most important locus for tiller number in both treatments is located on 6HS at 30.1-30.2 cM. It explained a high proportion of the genetic variance in both studies and was significant at DAS 45 and 58, while for DAS 27 it was only found significant in the current study. In close proximity, we also detected a constitutive biomass QTL at 24.5 cM. 1-FEH, a potential candidate for biomass and tiller number is located at 28.6 cM, between these two QTL (Supplementary Table S7).
The fourth constitutive QTL for tiller number on 6H at 55 cM was significant in both studies only at DAS 45. Accordingly, this QTL was earlier identified by Alqudah et al. (2016) within the two-rowed germplasm at the stage of awn primordium and tipping but not later. From a breeding perspective, stage-specific QTL might provide opportunities for genetic manipulation to maximize the number of tillers. The genomic region harbors flowering (HvCO5, HvPRR1, HvCry2) and growth-related genes (HvARF14, Supplementary Table S7).
Adaptive QTL for Tiller Number
Contrary to biomass, not a single adaptive QTL for tiller number was detected under drought stress. Two QTL were identified at DAS 27 in the current study, but being present only at the start of stress they can’t be regarded as drought-adaptive. The first of these two (5H 120.1 cM) was previously identified by Alqudah et al. (2016) for tiller number at the time of tipping. Within 5 cM distance Vrn-H1 and HvPhyc are located and may have pleiotropic effects on tiller number (Supplementary Table S7). However, the QTL region contains also HvNCED2 (119.0 cM), a gene involved in ABA biosynthesis (Wang et al., 2017) and ABA is involved in bud outgrowth (Kebrom et al., 2013). Further, MLOC_51599.3 with high sequence similarity to the wheat deoxyhypusine synthase (DHS) is located at 121.5 cM. DHS is involved in the activation of the eukaryotic translation initiation factor eIF5A that is essential for cell division (Tiburcio et al., 2014).
The second QTL for tiller number at DAS 27 is identical to the constitutive biomass QTL on 7HL at 140.9 cM. In the six-rowed subpanel, a QTL for non-productive tiller number at maturity was detected here (Alqudah et al., 2016). The current study shows that this QTL is also linked to tiller number in two-rowed spring barley at early developmental stages.
The eight remaining adaptive QTL for tiller number were identified only in the control treatment at DAS 45 and/or 58. They are located on 2H (58 cM, 124.9 cM, 135.8 cM), 5H (30.6 cM), 6H (24.5 cM), 7H (68 cM, 120.4 cM, 134.2 cM) (Neumann et al., 2017).
Summary
Non-invasive phenotyping allows for resolving the timing of QTL appearance. It can resolve which genetic loci are responsible for early growth vigor, growth per se, drought tolerance, and recovery from stress. The genetic architecture of biomass during the drought period was altered strongly compared to well-watered conditions. Drought tolerance related loci appeared mainly after the arrest of growth, reflected by the parameter time A obtained from growth modeling. During plant recovery, mainly a switch back to the genetic architecture observed under well-watered conditions was seen. After the end of drought, the HvPPD-H1-region revealed the highest effect, unlike in the well-watered treatment, where the HvDIM-locus was most prominent during the same time. In general, co-localisation of biomass and flowering time genes was expected and confirmed by the detection of candidate genes including HvCO18, HvFT4, HvGI, HvCMF1, or HvPRR95. However, also genes involved in dehydration tolerance were often located in QTL regions. No drought-related QTL were detected for tiller number, where the change in genetic architecture was marked by the disappearance of QTL compared to well-watered conditions. Our comprehensive case-study in barley demonstrates the potential of non-invasive phenotyping for resolving the genetic architecture of complex traits that changes throughout development and under contrasting growth conditions. Traits are highly heritable even if drought stress is applied — as long as conditions are controlled and strictly standardized. In future studies, replicates within experiments can be even further decreased, allowing for an increase in the number of genotypes and a concomitant increase in the power of genome-wide association scans. The drought and growth-related genes identified as candidates in the present study represent informed targets for further validation by re-sequencing in our barley panel. Natural variation is already known for HvABCG31/Eibi1, HvDof3, and HvPap-1. Drought-related QTL in the vicinity of these genes highlight their potential value as starting points to breed for enhanced drought tolerance.
Data Availability Statement
The datasets generated for this study can be found in the e!DAL – Plant Genomics & Phenomics Research Data Repository, DOI: 10.5447/IPK/2019/14. All other data are available on request to the corresponding author if not included in the Supplementary Files.
Author Contributions
SD and KN designed the study, conducted the experiments, and analyzed phenotypic data. DC modeled the biomass growth curves, MG evaluated fAW. GL and YZ analyzed performed statistical analysis and GWAS. SD and KN were the major contributors in writing the manuscript. JR, BK, and AG were involved designing the study, data interpretation and writing of the manuscript. All authors read and approved the final manuscript.
Funding
This work was conducted as part of the CROP.SENSe.net (FKZ 0315530E) and BARSELECT (FKZ 0315969D) consortia, both funded by the Federal Ministry of Education and Research of Germany (BMBF). We also thank the Humboldt foundation for support of Michele Grieco.
Conflict of Interest
The authors declare that the research was conducted in the absence of any commercial or financial relationships that could be construed as a potential conflict of interest.
Acknowledgments
The authors thank Ingo Mücke, Kerstin Wolf, Ute Krajewski, Heike Harms, Katrin Trnka, and the gardener team of Kathrin Gramel-Koch for technical support. This work was conducted as part of the CROP.SENSe.net (FKZ 0315530E) and BARSELECT (FKZ 0315969D) consortia, both funded by the Federal Ministry of Education and Research of Germany (BMBF). We also thank the Humboldt foundation for support of Michele Grieco.
Abbreviations
DAS, days after sowing.
Supplementary Material
The Supplementary Material for this article can be found online at: https://www.frontiersin.org/articles/10.3389/fpls.2019.01307/full#supplementary-material
References
Abdel-Ghani, A. H., Sharma, R., Wabila, C., Dhanagond, S., Owais, S. J., Duwayri, M. A., et al. (2019). Genome-wide association mapping in a diverse spring barley collection reveals the presence of QTL hotspots and candidate genes for root and shoot architecture traits at seedling stage. BMC Plant Biol. 19 (1), 216. doi: 10.1186/s12870-019-1828-5
Abe, A., Takagi, H., Fujibe, T., Aya, K., Kojima, M., Sakakibara, H., et al. (2012). OsGA20ox1, a candidate gene for a major QTL controlling seedling vigor in rice. Theor Appl Genet. 125, 647–657. doi: 10.1007/s00122-012-1857-z
Abeledo, L. G., Calderini, D. F., Slafer, G. A. (2003). Genetic improvement of barley yield potential and its physiological determinants in Argentina (1944–1998). Euphytica 130, 325–334. doi: 10.1023/A:1023089421426
Abou-Elwafa, S. F. (2016). Association mapping for drought tolerance in barley at the reproductive stage. C R Biol. 339, 51–59. doi: 10.1016/j.crvi.2015.12.002
Afzal, Z., Howton, T., Sun, Y., Mukhtar, M. (2016). The roles of aquaporins in plant stress responses. J. Dev. Biol. 4, 9. doi: 10.3390/jdb4010009
Al-Abdallat, A. M., Karadsheh, A., Hadadd, N. I., Akash, M. W., Ceccarelli, S., Baum, M., et al. (2017). Assessment of genetic diversity and yield performance in Jordanian barley (Hordeum vulgare L.) landraces grown under Rainfed conditions. BMC Plant. Biol. 17, 191. doi: 10.1186/s12870-017-1140-1
Alqudah, A. M., Sharma, R., Pasam, R. K., Graner, A., Kilian, B., Schnurbusch, T. (2014). Genetic dissection of photoperiod response based on GWAS of pre-anthesis phase duration in spring barley. PLoS ONE 9 (11), e113120. doi: 10.1371/journal.pone.0113120
Alqudah, A. M., Koppolu, R., Wolde, G. M., Graner, A., Schnurbusch, T. (2016). The genetic architecture of barley plant stature. Front. Genet. 7, 117. doi: 10.3389/fgene.2016.00117
Alqudah, A. M., Youssef, H. M., Graner, A., Schnurbusch, T. (2018). Natural variation and genetic make-up of leaf blade area in spring barley. Theor. Appl. Genet. 131, 873–886. doi: 10.1007/s00122-018-3053-2
Anscombe, F. J., Tukey, J. W. (1963). The examination and analysis of residuals. Technometrics 5, 141–160. doi: 10.1080/00401706.1963.10490071
Appleford, N. E. J., Evans, D. J., Lenton, J. R., Gaskin, P., Croker, S. J., Devos, K. M., et al. (2006). Function and transcript analysis of gibberellin-biosynthetic enzymes in wheat. Planta 223, 568–582. doi: 10.1007/s00425-005-0104-0
Austin, R., Bingham, J., Blackwell, R., Evans, L., Ford, M., Morgan, C., et al. (1980). Genetic improvements in winter wheat yields since 1900 and associated physiological changes. J. Agric. Sci. 94, 675–689. doi: 10.1017/S0021859600028665
Banerjee, A., Roychoudhury, A. (2016). Group II late embryogenesis abundant (LEA) proteins: structural and functional aspects in plant abiotic stress. J. Plant Growth Regul. 79, 1–17. doi: 10.1007/s10725-015-0113-3
Benjamini, Y., Hochberg, Y. (1995). Controlling the false discovery rate: a practical and powerful approach to multiple testing. J. R. Stat. Soc. Series B. Stat. Methodol. 57, 289–300. doi: 10.1111/j.2517-6161.1995.tb02031.x
Berger, B., Parent, B., Tester, M. (2010). High-throughput shoot imaging to study drought responses. J. Exp. Bot. 61, 3519–3528. doi: 10.1093/jxb/erq201
Blum, A., Ramaiah, S., Kanemasu, E. T., Paulsen, G. M. (1990). Wheat recovery from drought stress at the tillering stage of development. Field Crops Res. 24, 67–85. doi: 10.1016/0378-4290(90)90022-4
Boyer, J., Westgate, M. (2004). Grain yields with limited water. J. Exp. Bot. 55 (407), 2385–2394. doi: 10.1093/jxb/erh219
Brisson, N., Gate, P., Gouache, D., Charmet, G., Oury, F. X., Huard, F. (2010). Why are wheat yields stagnating in Europe? A comprehensive data analysis for France. Field Crops Res. 119, 201–212. doi: 10.1016/j.fcr.2010.07.012
Burton, R. A., Shirley, N. J., King, B. J., Harvey, A. J., Fincher, G. B. (2004). The CesA gene family of barley. Quantitative analysis of transcripts reveals two groups of co-expressed genes. J. Plant Physiol. 134, 224–236. doi: 10.1104/pp.103.032904
Butler, D. G., Cullis, B. R., Gilmour, A. R., Gogel, B. J. (2009). ASReml-R reference manual. Department of Primary Industries and Fisheries, Brisbane, Australia: The State of Queensland.
Carmona, M. J., Ortega, N., Garcia-Maroto, F. (1998). Isolation and molecular characterisation of a new vegetative MADS-box gene from Solanum tuberosum L. Planta 207, 181–188. doi: 10.1007/s004250050471
Ceccarelli, S., Grando, S. (1996). Drought as a challenge for the plant breeder. J. Plant Growth Regul. 20, 149–155. doi: 10.1007/BF00024011
Chen, D., Chen, M., Altmann, T., Klukas, C. (2014a). Approaches in Integrative Bioinformatics. Chen, M, Hofestädt, R, editors. . Berlin Heidelberg: Bridging genomics and phenomicsSpringer, 299–333. doi: 10.1007/978-3-642-41281-3_11
Chen, D., Neumann, K., Friedel, S., Kilian, B., Chen, M., Altmann, T., et al. (2014b). Dissecting the phenotypic components of crop plant growth and drought responses based on high-throughput image analysis. Plant Cell 26, 4636–4655. doi: 10.1105/tpc.114.129601
Chen, G. X., Komatsuda, T., Ma, J. F., Nawrath, C., Pourkheirandish, M., Tagiri, A., et al. (2011). An ATP-binding cassette subfamily G full transporter is essential for the retention of leaf water in both wild barley and rice. Proc. Natl. Acad. Sci. U.S.A. 108, 12354–12359. doi: 10.1073/pnas
Chen, J., Yin, Y. (2017). WRKY transcription factors are involved in brassinosteroid signaling and mediate the crosstalk between plant growth and drought tolerance. Plant Signal Behav. 12 (11), e1365212. doi: 10.1080/15592324.2017.1365212
Cockram, J., Thiel, T., Steuernagel, B., Stein, N., Taudien, S., Bailey, P. C., et al. (2012). Genome dynamics explain the evolution of flowering time CCT domain gene families in the poaceae. PLoS ONE 7 (9), e45307. doi: 10.1371/journal.pone.0045307
Colebrook, E. H., Thomas, S. G., Phillips, A. L., Hedden, P. (2014). The role of gibberellin signalling in plant responses to abiotic stress. J. Exp. Biol. 217, 67–75. doi: 10.1242/jeb.089938
Collins, N. C., Tardieu, F., Tuberosa, R. (2008). Quantitative trait loci and crop performance under abiotic stress: where do we stand? Plant Physiol. 147, 469–486. doi: 10.1104/pp.108.118117
Colmsee, C., Beier, S., Himmelbach, A., Schmutzer, T., Scholz, U., Mascher, M. (2015). BARLEX — the barley draft genome explorer. Mol. Plant 8, 964–966. doi: 10.1016/j.molp.2015.03.009
Díaz-Mendoza, M., Velasco-Arroyo, B., González-Melendi, P., Martínez, M., Díaz, I. (2014). C1A cysteine protease–cystatin interactions in leaf senescence. J. Exp. Bot. 65, 3825–3833. doi: 10.1093/jxb/eru043
Digel, B., Tavakol, E., Verderio, G., Tondelli, A., Xu, X., Cattivelli, L., et al. (2016). Photoperiod1 (Ppd-H1) controls leaf size. Plant Physiol. 172, 405–415. doi: 10.1104/pp.16.00977
Dunford, R. P., Griffiths, S., Christodoulou, V., Laurie, D. A. (2005). Characterisation of a barley (Hordeum vulgare L.) homologue of the Arabidopsis flowering time regulator GIGANTEA. Theor. Appl. Genet. 110, 925–931. doi: 10.1007/s00122-004-1912-5
Edmeades, G. O., Bolaños, J., Chapman, S. C., Lafitte, H. R., Bänziger, M. (1999). Selection improves drought tolerance in tropical maize populations. I. Gains in biomass, grain yield and harvest index. Crop Sci. 39, 1306–1315. doi: 10.2135/cropsci1999.3951306x
Gifford, R. M., Thorne, J. H., Hitz, W. D., Giaquinta, R. T. (1984). Crop productivity and photoassimilate partitioning. Science 225, 801–808. doi: 10.1126/science.225.4664.801
Fan, Y., Shabala, S., Ma, Y., Xu, R., Zhou, M. (2015). Using QTL mapping to investigate the relationships between abiotic stress tolerance (drought and salinity) and agronomic and physiological traits. BMC Genomics 16, 43. doi: 10.1186/s12864-015-1243-8
Farooq, M., Wahid, A., Kobayashi, N., Fujita, D., Basra, S. M. A. (2009). Plant drought stress: effects, mechanisms and management. Agron. Sustain. Dev. 29, 185–212. doi: 10.1051/agro:2008021
Fischer, R., Edmeades, G. O. (2010). Breeding and cereal yield progress. Crop Sci. 50, 85–98. doi: 10.2135/cropsci2009.10.0564
Forster, B., Ellis, R., Moir, J., Talame, V., Sanguineti, M. C., Tuberosa, R., et al. (2004). Genotype and phenotype associations with drought tolerance in barley tested in North Africa. Ann. Appl. Biol. 144, 157–168. doi: 10.1111/j.1744-7348.2004.tb00329.x
Fukai, S., Cooper, M. (1995). Development of drought-resistant cultivars using physiomorphological traits in rice. Field Crops Res. 40, 67–86. doi: 10.1016/0378-4290(94)00096-U
Gawenda, I., Thorwarth, P., Günther, T., Ordon, F., Schmid, K. J. (2015). Genome‐wide association studies in elite varieties of German winter barley using single‐marker and haplotype‐based methods. Plant Breed. 134, 28–39. doi: 10.1111/pbr.12237
Geng, X. L., Zang, X. S., Wang, F., Zhang, L. Y., Tian, X. J., Ni, Z. F., et al. (2016). Isolation and function analysis of heat stress related transcription factor gene TabZIP28 in wheat (Triticum aestivum). J. Agric. Biotechnol. 24, 157–167. doi: 10.3969/j.issn.1674-7968.2016.02.001
George, T. S., Brown, L. K., Ramsay, L., White, P. J., Newton, A. C., Russell, J., et al. (2014). Understanding the genetic control and physiological traits associated with rhizosheath production by barley (Hordeum vulgare). New Phytol. 203, 195–205. doi: 10.1111/nph.12786
Gomez-Sanchez, A., Gonzalez-Melendi, P., Estrella Santamaria, M., Arbona, V., Lopez-Gonzalvez, A., Garcia, A., et al. (2019). Repression of drought-induced cysteine-protease genes alters barley leaf structure and responses to abiotic and biotic stresses. J. Exp. Bot. 70, 2143–2155. doi: 10.1093/jxb/ery410
Graether, S. P., Boddington, K. F. (2014). Disorder and function: a review of the dehydrin protein family. Front. Plant Sci. 5, 576. doi: 10.3389/fpls.2014.00576
Gu, R., Fu, J., Guo, S., Duan, F., Wang, Z., Mi, G., et al. (2010). Comparative expression and phylogenetic analysis of maize cytokinin dehydrogenase/oxidase (CKX) gene family. J. Plant Growth Regul. 29, 428–440. doi: 10.1007/s00344-010-9155-y
Guo, P., Baum, M., Varshney, R. K., Graner, A., Grando, S., Ceccarelli, S. (2008). QTL for chlorophyll and chlorophyll fluorescence parameters in barley under post-flowering drought. Euphytica 163, 203–214. doi: 10.1007/s10681-007-9629-6
Habte, E., Muller, L. M., Shtaya, M., Davis, S. J., Von Korff, M. (2014). Osmotic stress at the barley root affects expression of circadian clock genes in the shoot. Plant Cell Environ. 37, 1321–1327. doi: 10.1111/pce.12242
Haseneyer, G., Stracke, S., Paul, C., Einfeldt, C., Broda, A., Piepho, H. P., et al. (2010). Population structure and phenotypic variation of a spring barley world collection set up for association studies. Plant Breeding 129, 271–279. doi: 10.1111/j.1439-0523.2009.01725.x
Han, M., Wu, W., Wu, W.-H., Wang, Y. (2016). Potassium Transporter KUP7 is involved in K+ acquisition and translocation in Arabidopsis root under K+-limited conditions. Mol. Plant 9, 437–446. doi: 10.1016/j.molp.2016.01.012
Haque, K. M. S., Karim, M. A., Bari, M. N., Islam, M. R. (2016). Genotypic variation in the effect of drought stress on phenology, morphology and yield of aus rice. Int. J. Biosci. 8, 73–82. doi: 10.12692/ijb/8.6.73-82
Hong, J., Kim, D. Y., Lee, T. G., Jeon, W. B., Seo, Y. W. (2010). Functional characterization of pectin methylesterase inhibitor (PMEI) in wheat. Genes Genet. Syst. 85, 97–106. doi: 10.1266/ggs.85.97
Honsdorf, N., March, T. J., Berger, B., Tester, M., Pillen, K. (2014). High-throughput phenotyping to detect drought tolerance QTL in wild barley introgression lines. PLoS ONE 9 (5), e97047. doi: 10.1371/journal.pone.0097047
Horie, T., Shiraiwa, T., Homma, K., Katsura, K., Maeda, S., Yoshida, H. (2005). Can yields of lowland rice resume the increases that they showed in the 1980s? Plant Prod. Sci. 8, 259–274. doi: 10.1626/pps.8.259
Hossain, A., Lee, M., Cho, Y., Ahn, C. H., Lee, S. K., Jeon, J. S., et al. (2010). The bZIP transcription factor OsABF1 is an ABA responsive element binding factor that enhances abiotic stress signaling in rice. Plant Mol. Biol. 72, 557. doi: 10.1007/s11103-009-9592-9
Houston, K., McKim, S. M., Comadran, J., Bonar, N., Druka, I., Uzrek, N., et al. (2013). Variation in the interaction between alleles of HvAPETALA2 and microRNA172 determines the density of grains on the barley inflorescence. Proc. Natl. Acad. Sci. U.S.A. 110 (41), 16675–16680. doi: 10.1073/pnas.1311681110
Hove, R. M., Ziemann, M., Bhave, M. (2015). Identification and expression analysis of the barley (Hordeum vulgare L.) aquaporin gene family. PLoS ONE 10 (6), e0128025. doi: 10.1371/journal.pone.0128025
Hua, L., Wang, D. R., Tan, L., Fu, Y., Liu, F., Xiao, L., et al. (2015). LABA1, a domestication gene associated with long, barbed awns in wild rice. Plant Cell 27, 1875–1888. doi: 10.1105/tpc.15.00260
Huang, Y., Wang, X., Ge, S., Rao, G.-Y. (2015). Divergence and adaptive evolution of the gibberellin oxidase genes in plants. BMC Evol. Biol. 15, 207. doi: 10.1186/s12862-015-0490-2
Hughes, J., Hepworth, C., Dutton, C., Dunn, J. A., Hunt, L., Stephens, J., et al. (2017). Reducing stomatal density in barley improves drought tolerance without impacting on yield. Plant Physiol. 174, 776–787. doi: 10.1104/pp.16.01844
Ingvordsen, C.H., Backes, G., Lyngkjaer, M.F., Peltonen-Sainio, P., Jahoor, A., Mikkelsen, T.N., et al. (2015). Genome-wide association study of production and stability traits in barley cultivated under future climate scenarios. Mol. Breed. 35, 84. doi: 10.1007/s11032-015-0283-8
Jakoby, M., Weisshaar, B., Dröge-Laser, W., Vicente-Carbajosa, J., Tiedemann, J., Kroj, T., et al. (2002). bZIP transcription factors in Arabidopsis. Trends Plant Sci. 7 (3), 106–111. doi: 10.1016/S1360-1385(01)02223-3
Jamieson, P. D., Martin, R. J., Francis, G. S. (1995). Drought influences on grain-yield of barley, wheat, and maize. N. Z. J. Crop Hortic. Sci. 23, 55–66. doi: 10.1080/01140671.1995.9513868
Jaradat, A. A., Shahid, M., Al-Maskri, A. Y. (2005). Biomass production potential in the Batini barley landrace from Oman. J. Sci. Food Agric. 3, 381–385. doi: 10.2135/cropsci2004.9970
Jedmowski, C., Bayramov, S., Brüggemann, W. (2014). Comparative analysis of drought stress effects on photosynthesis of Eurasian and North African genotypes of wild barley. Photosynthetica 52, 564–573. doi: 10.1007/s11099-014-0064-3
Jiang, Y., Zhao, Y., Rodemann, B., Plieske, J., Kollers, S., Korzun, V., et al. (2015). Potential and limits to unravel the genetic architecture and predict the variation of fusarium head blight resistance in European winter wheat (Triticum aestivum L.). Heredity 114, 18–26. doi: 10.1038/hdy.2014.104
Jones, H., Corlett, J. (1992). Current topics in drought physiology. J Agric. Sci. 119, 291–296. doi: 10.1017/S0021859600012144
Jost, M., Taketa, S., Mascher, M., Himmelbach, A., Yuo, T., Shahinnia, F., et al. (2016). A homolog of blade-on-petiole 1 and 2 (BOP1/2) controls internode length and homeotic changes of the barley inflorescence. Plant Physiol. 171, 1113–1127. doi: 10.1104/pp.16.00124
Kebrom, T. H., Spielmeyer, W., Finnegan, E. J. (2013). Grasses provide new insights into regulation of shoot branching. Trends Plant Sci. 18, 41–48. doi: 10.1016/j.tplants.2012.07.001
Kim, B. K., Fujioka, S., Takatsuto, S., Tsujimoto, M., Choe, S. (2008). Castasterone is a likely end product of brassinosteroid biosynthetic pathway in rice. Biochem. Biophys. Res. Commun. 374, 614–619. doi: 10.1016/j.bbrc.2008.07.073
Kimura, S., Furukawa, T., Kasai, N., Mori, Y., Kitamoto, H. K., Sugawara, F., et al. (2003). Functional characterization of two flap endonuclease-1 homologues in rice. Gene 314, 63–71. doi: 10.1016/S0378-1119(03)00694-2
Klukas, C., Chen, D., Pape, J. M. (2014). Integrated analysis platform: an open-source information system for high-throughput plant phenotyping. Plant Physiol. 65, 506–518. doi: 10.1104/pp.113.233932
Knipfer, T., Besse, M., Verdeil, J.-L., Fricke, W. (2011). Aquaporin-facilitated water uptake in barley (Hordeum vulgare L.) roots. J. Exp. Bot. 62, 4115–4126. doi: 10.1093/jxb/err075
Kondhia, A., Tabien, R. E., Ibrahim, A. (2015). Evaluation and selection of high biomass rice (Oryza sativa L.) for drought tolerance. Am. J. Plant Sci. 6, 1962–1972. doi: 10.4236/ajps.2015.612197
Kumar, R., Venuprasad, R., Atlin, G. (2007). Genetic analysis of rainfed lowland rice drought tolerance under naturally-occurring stress in eastern India: heritability and QTL effects. Field Crops Res. 103, 42–52. doi: 10.1016/j.fcr.2007.04.013
Lawlor, D. W., Day, W., Johnston, A. E., Legg, B. J., Parkinson, K. J. (1981). Growth of spring barley under drought: crop development, photosynthesis, dry-matter accumulation and nutrient content. J. Agric. Sci. 96, 167–186. doi: 10.1017/S002185960003197X
Lee, S., Choi, S. C., An, G. (2008). Rice SVP-group MADS-box proteins, OsMADS22 and OsMADS55, are negative regulators of brassinosteroid responses. Plant J. 54, 93–105. doi: 10.1111/j.1365-313X.2008.03406.x
Lee, S. E., Yim, H. K., Lim, M. N., Yoon, I. S., Kim, J. H., Hwang, Y. S. (2015). Abscisic acid prevents the coalescence of protein storage vacuoles by upregulating expression of a tonoplast intrinsic protein gene in barley aleurone. J. Exp. Bot. 66, 1191–1203. doi: 10.1093/jxb/eru467
Lehner, B., Döll, P., Alcamo, J., Henrichs, T., Kaspar, F. (2006). Estimating the impact of global change on flood and drought risks in Europe: a continental, integrated analysis. Clim Change 75, 273–299. doi: 10.1007/s10584-006-6338-4
Li, S. B., Xie, Z. Z., Hu, C. G., Zhang, J. T. (2016). A review of auxin response factors (ARFs) in plants. Front. Plant Sci. 7, 47. doi: 10.3389/fpls.2016.00047
Li, H., Jiang, L., Youn, J. H., Sun, W., Cheng, Z., Jin, T., et al. (2013). A comprehensive genetic study reveals a crucial role of CYP90D2/D2 in regulating plant architecture in rice (Oryza sativa). New Phytol. 200, 1076–1088. doi: 10.1111/nph.12427
Li, Z., Peng, T., Xie, Q., Han, S., Tian, J. (2010). Mapping of QTL for tiller number at different stages of growth in wheat using double haploid and immortalized F2 populations. J. Genet. 89, 409–415. doi: 10.1007/s12041-010-0059-1
Liu, H., Jia, S., Shen, D., Liu, J., Li, J., Zhao, H., et al. (2012). Four AUXIN RESPONSE FACTORs downregulated by microRNA167 are associated with growth and development in Oryza sativa. Funct. Plant Biol. 39, 736. doi: 10.1071/FP12106
Liu, Y., Zhang, C., Chen, J., Guo, L., Li, X., Li, W., et al. (2013). Arabidopsis heat shock factor HsfA1a directly senses heat stress, pH changes, and hydrogen peroxide via the engagement of redox state. Plant Physiol. Biochem. 64, 92–98. doi: 10.1016/j.plaphy.2012.12.013
Livingston, D. P., Hincha, D. K., Heyer, A. G. (2009). Fructan and its relationship to abiotic stress tolerance in plants. Cell. Mol. Life Sci. 66 (13), 2007–2023. doi: 10.1007/s00018-009-0002-x
Lloyd-Hughes, B., Saunders, M. A. (2002). A drought climatology for Europe. Int. J. Climatol. 22, 1571–1592. doi: 10.1002/joc.846
Long, N. V., Dolstra, O., Malosetti, M., Kilian, B., Graner, A., Visser, R. G., et al. (2013). Association mapping of salt tolerance in barley (Hordeum vulgare L.). Theor. Appl. Genet. 126 (9), 2335–2351. doi: 10.1007/s00122-013-2139-0
Lu, Z., Shao, G., Xiong, J., Jiao, Y., Wang, J., Liu, G., et al. (2015). MONOCULM 3, an ortholog of WUSCHEL in rice, is required for tiller bud formation. J. Genet. Genomics 42, 71–78. doi: 10.1016/j.jgg.2014.12.005
Lubovská, Z., Dobrá, J., Storchová, H., Wilhelmová, N., Vanková, R. (2014). Cytokinin oxidase/dehydrogenase overexpression modifies antioxidant defense against heat, drought and their combination in Nicotiana tabacum plants. J. Plant Physiol. 17, 1625–1633. doi: 10.1016/j.jplph.2014.06.021
Ma, X. Y., Sela, H., Jiao, G. L., Li, C., Wang, A., Pourkheirandish, M., et al. (2012). Population-genetic analysis of HvABCG31 promoter sequence in wild barley (Hordeum vulgare ssp. spontaneum). BMC Evol. Biol. 12, 188. doi: 10.1186/1471-2148-12-188
Mameaux, S., Cockram, J., Thiel, T., Steuernagel., B., Stein, N., Taudien, S., et al. (2012). Molecular, phylogenetic and comparative genomic analysis of the cytokinin oxidase/dehydrogenase gene family in the Poaceae. Plant Biotechnol. J. 10, 67–82. doi: 10.1111/j.1467-7652.2011.00645.x
Mascher, M., Gundlach, H., Himmelbach, A., Beier, S., Twardziok, S. O., Wicker, T., et al. (2017). A chromosome conformation capture ordered sequence of the barley genome. Nature 544, 427–433. doi: 10.1038/nature22043
Maurer, A., Draba, V., Pillen, K. (2016). Genomic dissection of plant development and its impact on thousand grain weight in barley through nested association mapping. J. Exp. Bot. 67, 2507–2518. doi: 10.1093/jxb/erw070
Maurer, A., Draba, V., Jiang, Y., Schnaithmann, F., Sharma, R., Schumann, E., et al. (2015). Modelling the genetic architecture of flowering time control in barley through nested association mapping. BMC Genomics 16, 290. doi.org/10.1186/s12864-015-1459-7
Mathew, I., Shimelis, H., Mutema, M., Clulow, A., Zengeni, R., Mbava, N., et al. (2019). Selection of wheat genotypes for biomass allocation to improve drought tolerance and carbon sequestration into soils. J. Agro. Crop Sci. 205, 385–400. doi: 10.1111/jac.12332
Mehravaran, L., Fakheri, B., Sharifi-Rad, J. (2014). Localization of quantitative trait loci (QTL) controlling drought tolerance in barley. Int. J. Biosci. 5, 248–259. doi: 10.12692/ijb/5.7.248-259
Mohammadi, M., Blake, T. K., Budde, A. D., Chao, S. M., Hayes, P. M., Horsley, R. D., et al. (2015). A genome-wide association study of malting quality across eight US barley breeding programs. Theor Appl Genet. 128, 705-721. doi: 10.1007/s00122-015-2465-5
Mora, F., Quitral, Y. A., Matus, I., Russell, J., Waugh, R., del Pozo, A. (2016). SNP-Based QTL Mapping of 15 complex traits in barley under rain-fed and well-watered conditions by a mixed modeling approach. Front. Plant Sci. 7, 909. doi: 10.3389/fpls.2016.00909
Moreno-Risueno, M.Á., Martínez, M., Vicente-Carbajosa, J., Carbonero, P. (2007). The family of DOF transcription factors: from green unicellular algae to vascular plants. Mol. Genet. Genomics 277, 379–390. doi: 10.1007/s00438-006-0186-9
Müller, K., Levesque-Tremblay, G., Bartels, S., Weitbrecht, K., Wormit, A., Usadel, B., et al. (2013). Demethylesterification of cell wall pectins in Arabidopsis plays a role in seed germination. Plant Physiol. 161, 305–316. doi: 10.1104/pp.112.205724
Muñoz-Amatriaín, M., Cuesta-Marcos, A., Endelman, J. B., Comadran, J., Bonman, J. M., Bockelman, H. E., et al. (2014). The USDA barley core collection: genetic diversity, population structure, and potential for genome-wide association studies. PLoS One 9 (4), e94688. doi: 10.1371/journal.pone.0094688
Nagaraj, V. J., Galati, V., Luescher, M., Boller, T., Wiemken, A. (2004). Cloning and functional characterization of a cDNA encoding barley soluble acid invertase (HvINV1). Plant Sci. 168, 249–258. doi: 10.1016/j.plantsci.2004.08.003
Negi, J., Hashimoto-Sugimoto, M., Kusumi, K., Iba, K. (2014). New approaches to the biology of stomatal guard cells. Plant Cell Physiol. 55, 241–250. doi: 10.1093/pcp/pct145
Neumann, K., Klukas, C., Friedel, S., Rischbeck, P., Chen, D., Entzian, A., et al. (2015). Dissecting spatiotemporal biomass accumulation in barley under different water regimes using high-throughput image analysis. Plant Cell Environ. 38, 1980–1996. doi: 10.1111/pce.12516
Neumann, K., Zhao, Y., Chu, J., Keilwagen, J., Reif, J. C., Kilian, B., et al. (2017). Genetic architecture and temporal patterns of biomass accumulation in spring barley revealed by image analysis. BMC Plant Biol. 17, 137. doi: 10.1186/s12870-017-1085-4
Nevo, E. (2014). Evolution of wild barley at “Evolution Canyon”: adaptation, speciation, pre-agricultural collection, and barley improvement. Isr. J. Plant Sci. 62, 22–32. doi: 10.1080/07929978.2014.940783
Noguero, M., Atif, R. M., Ochatt, S., Thompson, R. D. (2013). The role of the DNA-binding One Zinc Finger (DOF) transcription factor family in plants. Plant Sci. 209, 32–45. doi: 10.1016/j.plantsci.2013.03.016
Noleppa, S. (2016). The economic, social and environmental value of plant breeding in the European Union: An expost evaluation and ex ante assessment HFFA research paper 03/2016.
Oikawa, T., Koshioka, M., Kojima, K., Yoshida, H., Kawata, M. (2004). A role of OsGA20ox1, encoding an isoform of gibberellin 20-oxidase, for regulation of plant stature in rice. Plant Mol. Biol. 55, 687–700. doi: 10.1007/s11103-004-1692-y
Osakabe, Y., Arinaga, N., Umezawa, T., Katsura, S., Nagamachi, K., Tanaka, H., et al. (2013). Osmotic stress responses and plant growth controlled by potassium transporters in Arabidopsis. Plant Cell 25, 609–624. doi: 10.1105/tpc.112.105700
Osugi, A., Sakakibara, H. (2015). Q&A: how do plants respond to cytokinins and what is their importance? BMC Biol. 13, 102. doi: 10.1186/s12915-015-0214-5
Pasam, R. K., Sharma, R., Malosetti, M., van Eeuwijk, F. A., Haseneyer, G., Kilian, B., et al. (2012). Genome-wide association studies for agronomical traits in a world wide spring barley collection. BMC Plant Biol. 12, 16. doi: 10.1186/1471-2229-12-16
Paul, K., Pauk, J., Deák, Z., Sass, L., Vass, I. (2016). Contrasting response of biomass and grain yield to severe drought in Cappelle Desprez and Plainsman V wheat cultivars. PeerJ 4, e1708. doi: 10.7717/peerj.1708
Pauli, D., Muehlbauer, G. J., Smith, K. P., Cooper, B., Obert, D. E., Ullrich, S. E., et al. (2014). Association mapping of agronomic QTLs in U.S. Spring Barley Breeding Germplasm. Plant Genome 7. doi:10.3835/plantgenome2013.11.0037
Pavlů, J., Novák, J., Koukalová, V., Luklová, M., Brzobohatý, B., Černý, M. (2018). Cytokinin at the crossroads of abiotic stress signalling pathways. Int. J. Mol. Sci. 19 (8), 2450. doi: 10.3390/ijms19082450
Prerostova, S., Dobrev, P. I., Gaudinova, A., Knirsch, V., Körber, N., Pieruschka, R., et al. (2018). Cytokinins: Their impact on molecular and growth responses to drought stress and recovery in Arabidopsis. Front. Plant Sci. 9, 655. doi: 10.3389/fpls.2018.00655
Rajala, A., Hakala, K., Mäkelä, P., Peltonen-Sainio, P. (2010). Drought effect on grain weight at spike and spikelet level in six-row spring barley. J. Agric. Sci. 197, 103–112. doi: 10.1111/j.1439-037X.2010.00449.x
Rajendran, K., Tester, M., Roy, S. J. (2009). Quantifying the three main components of salinity tolerance in cereals. Plant Cell Environ. 32, 237–249. doi: 10.1111/j.1365-3040.2008.01916.x
Reddy, P. S., Kavi Kishor, P. B., Seiler, C., Kuhlmann, M., Eschen-Lippold, L., Lee, L., et al. (2014). Unraveling regulation of the small heat shock proteins by the heat shock factor HvHsfB2c in barley: its implications in drought stress response and seed development. PLoS ONE 9 (3), e89125. doi: 10.1371/journal.pone.0089125
Reif, J. C., Melchinger, A. E., Frisch, M. (2005). Genetical and mathematical properties of similarity and dissimilarity coefficients applied in plant breeding and seed bank management. Crop Sci. 45, 1–7. doi: 10.2135/cropsci2005.0001
Reynolds, M. P., Rajaram, S., Sayre, K. D. (1999). Physiological and genetic changes of irrigated wheat in the post–green revolution period and approaches for meeting projected global demand. Crop Sci. 39, 1611–1621. doi: 10.2135/cropsci1999.3961611x
Richards, R. A., Rebetzke, G. J., Condon, A. G., Van Herwaarden, A. F. (2002). Breeding opportunities for increasing the efficiency of water use and crop yield in temperate cereals. Crop Sci. 42, 111–121. doi: 10.2135/cropsci2002.1110
Richards, R. A. (2006). Physiological traits used in the breeding of new cultivars for water-scarce environments. Agric. Water Manag. 80, 197–211. doi: 10.1016/j.agwat.2005.07.013
Van Riet, L., Nagaraj, V., Van den Ende, W., Clerens, S., Wiemken, A., Van Laere, A. (2006). Purification, cloning and functional characterization of a fructan 6-exohydrolase from wheat (Triticum aestivum L.). J. Exp. Bot. 57, 213–223. doi: 10.1093/jxb/erj031
Roche, J., Love, J., Guo, Q., Song, J., Cao, M., Fraser, K., et al. (2016). Metabolic changes and associated cytokinin signals in response to nitrate assimilation in roots and shoots of Lolium perenne. Physiol. Plant 156, 497–511. doi: 10.1111/ppl.12412
Rosielle, A. A., Hamblin, J. (1981). Theoretical aspects of selection for yield in stress and non-stress environment. Crop Sci. 21, 943–946. doi: 10.2135/cropsci1981.0011183X002100060033x
Rouhian, S., Ahmadi, D. N., Sorkheh, K. (2017). Development of Dof (DNA binding with one finger) transcription factor gene-specific primers through data mining as a functional marker and their use for genetic diversity study in barley (Hordeum vulgare L.) germplasm. Genes Genom. 39, 567. doi: 10.1007/s13258-016-0510-7
Sanad, M. N. M. E., Smertenko, A., Garland-Campbell, K. A. (2019). Differential dynamic changes of reduced trait model for analyzing the plastic response to drought phases: a case study in spring wheat. Front. Plant Sci. 10, 504. doi: 10.3389/fpls.2019.00504
Santher, A., Calderon-Villalobos, L. I. A., Estelle, M. (2009). Plant hormones are versatile chemical regulators of plant growth. Nat. Chem. Biol. 5, 301–307. doi: 10.1038/nchembio.165
Sarkar, A. K., Luijten, M., Miyashima, S., Lenhard, M., Hashimoto, T., Nakajima, K., et al. (2007). Conserved factors regulate signalling in Arabidopsis thaliana shoot and root stem cell organizers. Nature 446, 811–814. doi: 10.1038/nature05703
Sarkar, A. K., Lahiri, A. (2013). Specificity determinants for the abscisic acid response element. FEBS Open Bio. 3, 101–105. doi: 10.1016/j.fob.2013.01.006
Schmitz, J., Franzen, R., Ngyuen, T. H., Garcia-Maroto, F., Pozzi, C., Salamini, F., et al. (2000). Cloning, mapping and expression analysis of barley MADS-box genes. Plant Mol. Biol. 42, 899–913. doi: 10.1023/A:1006425619953
Schmülling, T., Werner, T., Riefler, M., Krupková, E., Bartrina y Manns, I. (2003). Structure and function of cytokinin oxidase/dehydrogenase genes of maize, rice, Arabidopsis and other species. J. Plant Res. 116, 241–252. doi: 10.1007/s10265-003-0096-4
Sannemann, W., Huang, B. E., Mathew, B., Leon, J. (2015). Multi-parent advanced generation inter-cross in barley: high-resolution quantitative trait locus mapping for flowering time as a proof of concept. Mol. Breed. 35, 86. doi: 10.1007/s11032-015-0284-7
Shakhatreh, Y., Kafawin, O., Ceccarelli, S., Saoub, H. (2001). Selection of barley lines for drought tolerance in low-rainfall areas. J. Agro. Crop Sci. 186, 119–127. doi: 10.1046/j.1439-037X.2001.00459.x
Shavrukov, Y., Kurishbayev, A., Jatayev, S., Shvidchenko, V., Zotova, L., Koekemoer, F., et al. (2017). Early flowering as a drought escape mechanism in plants: how can it aid wheat production? Front. Plant Sci. 8, 1950. doi: 10.3389/fpls.2017.01950
Shinozuka, H., Cogan, N. O., Spangenberg, G. C., Forster, J. W. (2011). Comparative genomics in perennial ryegrass (Lolium perenne L.): identification and characterisation of an orthologue for the rice plant architecture-controlling gene OsABCG5. Int. J. Plant Genomics 2011, 291563. doi: 10.1155/2011/291563
Shu, X., Rasmussen, S. K. (2014). Quantification of amylose, amylopectin, and β-glucan in search for genes controlling the three major quality traits in barley by genome-wide association studies. Front. Plant Sci. 5, 197. doi: 10.3389/fpls.2014.00197
Szira, F., Balint, A. F., Börner, A., Galiba, G. (2008). Evaluation of drought-related traits and screening methods at different developmental stages in spring barley. J. Agro. Crop Sci. 194, 334–342. doi: 10.1111/j.1439-037X.2008.00330.x
Tavakol, E., Okagaki, R., Verderio, G., Shariati, J. V., Hussien, A., Bilgic, H., et al. (2015). The barley Uniculme4 gene encodes a BLADE-ON-PETIOLE-like protein that controls tillering and leaf patterning. Plant Physiol. 168, 164–174. doi: 10.1104/pp.114.252882
Teulat, B., Borries, C., This, D. (2001). New QTL identified for plant water status, water-soluble carbohydrate and osmotic adjustment in a barley population grown in a growth-chamber under two water regimes. Theor. Appl. Genet. 103, 161–170. doi: 10.1007/s001220000503
Tiburcio, A. F., Altabella, T., Bitrián, M., Alcázar, R. (2014). The roles of polyamines during the lifespan of plants: from development to stress. Planta 240, 1–18. doi: 10.1007/s00425-014-2055-9
Tombuloglu, H. (2019). Genome-wide analysis of the auxin response factors (ARF). gene family in barley (Hordeum vulgare L.). J. Plant Biochem. Biotechnol. 28, 14–24. doi: 10.1007/s13562-018-0458-6
Tommasini, L., Svensson, J. T., Rodriguez, E. M., Wahid, A., Malatrasi, M., Kato, K., et al. (2008). Dehydrin gene expression provides an indicator of low temperature and drought stress: transcriptome-based analysis of Barley (Hordeum vulgare L.). Funct. Integr. Genomics 8, 387–405. doi: 10.1007/s10142-008-0081-z
Tondelli, A., Xu, X., Moragues, M., Sharma, R., Schnaithmann, F., Ingvardsen, C., et al. (2013). Structural and temporal variation in genetic diversity of european spring two-row barley cultivars and association mapping of quantitative traits. Plant Genome 6. doi: 10.3835/plantgenome2013.03.0007
Trevaskis, B., Tadege, M., Hemming, M. N., Peacock, W. J., Dennis, E. S., Sheldon, C. (2007). Short vegetative phase-like MADS-box genes inhibit floral meristem identity in barley. Plant Physiol. 143, 225–235. doi: 10.1104/pp.106.090860
Wang, G., Schmalenbach, I., von Korff, M., Leon, J., Kilian, B., Rode, J., et al. (2010). Association of barley photoperiod and vernalization genes with QTL for flowering time and agronomic traits in a BC2DH population and a set of wild barley introgression lines. Theor. Appl. Genet. 120, 1559–1574. doi: 10.1007/s00122-010-1276-y
Wang, X., Ma, R., Cui, D., Cao, Q., Shan, Z., Jiao, Z. (2017). Physio-biochemical and molecular mechanism underlying the enhanced heavy metal tolerance in highland barley seedlings pretreated with low-dose gamma irradiation. Sci. Rep. 7, 14233. doi: 10.1038/s41598-017-14601-8
Wang, Y., Cai, S., Yin, L., Shi, K., Xia, X., Zhou, Y., et al. (2015). Tomato HsfA1a plays a critical role in plant drought tolerance by activating ATG genes and inducing autophagy. Autophagy 11, 2033–2047. doi: 10.1080/15548627.2015.1098798
Ward, B., Brien, C., Oakey, H., Pearson, A., Negrão, S., Schilling, R. K., et al. (2019). High-throughput 3D modelling to dissect the genetic control of leaf elongation in barley (Hordeum vulgare). Plant J. 98, 555–570. doi: 10.1111/tpj.14225
Wehner, G., Balko, C., Enders, M., Humbeck, K., Ordon, F. (2015). Identification of genomic regions involved in tolerance to drought stress and drought stress induced leaf senescence in juvenile barley. BMC Plant Biol. 15, 125. doi: 10.1186/s12870-015-0524-3
Witzenberger, A., Hack, H., van den Boom, T. (1989). Erläuterungen zum BBCH Dezimal-Code für die Entwicklungsstadien des Getreides – mit Abbildungen. Gesunde Pflanzen 41, 384–388.
Wormit, A., Usadel, B. (2018). The Multifaceted Role of Pectin Methylesterase Inhibitors (PMEIs). Int. J. Mol. Sci. 19 (10), 2878. doi: 10.3390/ijms19102878
Yamaguchi, S. (2008). Gibberellin metabolism and its regulation. Annu. Rev. Plant Biol. 59, 225–251. doi: 10.1146/annurev.arplant.59.032607.092804
Yan, J., Zhu, J., He, C. X., Benmoussa, M., Wu, P. (1998). Quantitative trait loci analysis for the developmental behavior of tiller number in rice (Oryza sativa L.). Theor. Appl. Genet. 97, 267–274. doi: 10.1007/s001220050895
Yáñez, A., Tapia, G., Guerra, F., del Pozo, A. (2017). Stem carbohydrate dynamics and expression of genes involved in fructan accumulation and remobilization during grain growth in wheat (Triticum aestivum L.) genotypes with contrasting tolerance to water stress. PLoS ONE 12 (5), e0177667. doi: 10.1371/journal.pone.0177667
Yeh, S. Y., Chen, H. W., Chun, Y. N., Lin, C. Y., Tseng, T. H., Li, W. H., et al. (2015). Down-regulation of cytokinin oxidase 2 expression increases tiller number and improves rice yield. Rice 8, 36. doi: 10.1186/s12284-015-0070-5
Youssef, H. M., Eggert, K., Koppolu, R., Alqudah, A. M., Poursarebani, N., Fazeli, A., et al. (2017). VRS2 regulates hormone-mediated inflorescence patterning in barley. Nat. Genet. 49, 157–161. doi: 10.1038/ng.3717
Zalewski, W., Gasparis, S., Boczkowska, M., Rajchel, I. K., Kała, M., Orczyk, W., et al. (2014). Expression Patterns of HvCKX Genes Indicate Their Role in Growth and Reproductive Development of Barley. PLoS ONE 9 (12), e115729. doi: 10.1371/journal.pone.0115729
Zang, O. W., Wang, C. X., Li, X. Y., Guo, Z. A., Jing, R. L., Zhao, J., et al. (2010). Isolation and characterization of a gene encoding a polyethylene glycol-induced cysteine protease in common wheat. J. Biosci. 35, 379–388. doi: 10.1007/s12038-010-0043-1
Zhang, J., Huang, S., Fosu-Nyarko, J., Dell, B., McNeil, M., Waters, I., et al. (2008). The genome structure of the 1-FEH genes in wheat (Triticum aestivum L.): new markers to track stem carbohydrates and grain filling QTLs in breeding. Mol. Breed. 22, 339–351. doi: 10.1007/s11032-008-9179-1
Zhang, J. J., Xu, Y. J., Chen, W., Dell, B., Vergauwen, R., Biddulph, B., et al. (2015). A wheat 1-FEH w3 variant underlies enzyme activity for stem WSC remobilization to grain under drought. New Phytol. 205, 293–305. doi: 10.1111/nph.13030
Zhang, W., Swarup, R., Bennett, M., Schaller, G. E., Kieber, J. J. (2013). Cytokinin induces cell division in the quiescent center of the Arabidopsis root apical meristem. Curr. Biol. 23, 1979–1989. doi: 10.1016/j.cub.2013.08.008
Zhongtao, J., Liu, Y., Gruber, B. D., Neumann, K., Kilian, B., Graner, A., et al. (2019). Genetic dissection of root system architectural traits in spring barley. Front. Plant Sci. 10, 400. doi: 10.3389/fpls.2019.00400
Zou, H. F., Zhang, Y. Q., Wei, W., Chen, H. W., Song, Q. X., Liu, Y. F., et al. (2013). The transcription factor AtDOF4.2 regulates shoot branching and seed coat formation in Arabidopsis. Biochem. J. 449, 373–388. doi: 10.1042/BJ20110060
Zubo, Y. O., Blakley, I. C., Yamburenko, M. V., Worthen, J. M., Street, I. H., Franco-Zorrilla, J. M., et al. (2017). Cytokinin induces genome-wide binding of the type-B response regulator ARR10 to regulate growth and development in Arabidopsis. Proc. Natl. Acad. Sci. U.S.A. 114 (29), E5995–E6004. doi: 10.1073/pnas.1620749114
Keywords: barley, biomass, drought stress, recovery, GWAS, growth, non-invasive
Citation: Dhanagond S, Liu G, Zhao Y, Chen D, Grieco M, Reif J, Kilian B, Graner A and Neumann K (2019) Non-Invasive Phenotyping Reveals Genomic Regions Involved in Pre-Anthesis Drought Tolerance and Recovery in Spring Barley. Front. Plant Sci. 10:1307. doi: 10.3389/fpls.2019.01307
Received: 10 May 2019; Accepted: 19 September 2019;
Published: 25 October 2019.
Edited by:
Hanwei Mei, Shanghai Agrobiological Gene Center, ChinaReviewed by:
Ken Chalmers, University of Adelaide, AustraliaBrigitte Uwimana, International Institute of Tropical Agriculture (IITA), Uganda
Copyright © 2019 Dhanagond, Liu, Zhao, Chen, Grieco, Reif, Kilian, Graner and Neumann. This is an open-access article distributed under the terms of the Creative Commons Attribution License (CC BY). The use, distribution or reproduction in other forums is permitted, provided the original author(s) and the copyright owner(s) are credited and that the original publication in this journal is cited, in accordance with accepted academic practice. No use, distribution or reproduction is permitted which does not comply with these terms.
*Correspondence: Kerstin Neumann, bmV1bWFubmtAaXBrLWdhdGVyc2xlYmVuLmRl