 Yongwang Sun
 Wenhua Liang1
 Tianzhen Zhang
- 1State Key Laboratory of Crop Genetics and Germplasm Enhancement, Cotton Hybrid R & D Engineering Center (the Ministry of Education), College of Agriculture, Nanjing Agricultural University, Nanjing, China
- 2Zhejiang Provincial Key Laboratory of Crop Genetic Resources, Institute of Crop Science, Plant Precision Breeding Academy, College of Agriculture and Biotechnology, Zhejiang University, Zhejiang, China
The importance of the actin cytoskeleton for proper cell development has been well established in a variety of organisms. Actin protein sequences are highly conserved, and each amino acid residue may be essential for its function. In this study, we report the isolation and characterization of GhLi1 from an upland cotton mutant Ligon lintless-1 (Li1), which harbors the G65V substitution in its encoded actin protein. Li1 mutants exhibit pleiotropic malformed phenotypes, including dwarf plants, distorted organs, and extremely shortened fibers. Cytological analysis showed that the actin cytoskeleton was disorganized and the abundance of F-actin was decreased in the Li1 cells. Vesicles were aggregated into patches, and excessive cellulose synthase complexes were inserted into the plasma membrane during the secondary cell wall biosynthesis stage, which dramatically affected the morphology of the Li1 cells. Molecular model prediction suggested that the G65V substitution may affect the three-bodied G-actin interaction during F-actin assembly. Biochemical assays demonstrated that the recombinant GhLi1 protein disturbs actin dynamics by inhibiting the nucleation and elongation processes. Therefore, our findings demonstrate that the G65V substitution in actin had dominant-negative effects on cell elongation, by disturbing actin polymerization and actin cytoskeleton-based biological processes such as intracellular transportation.
Introduction
The actin cytoskeleton is a fundamental and dynamic network in eukaryotic cells. It is not only involved in the maintenance of cell shape and structure, but also regulates a tremendous range of cellular processes, including cytoplasmic streaming, organelle movement, cell expansion, cell wall deposition and responses to internal and external signals (Staiger et al., 2000; Hussey et al., 2006). Actin exists in cells in a dynamic equilibrium between two principal forms: globular monomeric actin (G-actin) and filamentous polymeric actin (F-actin). Most of actin’s biological functions are conducted by F-actin, which is assembled from G-actin subunits into a helical structure polymer (Holmes et al., 1990). A sophisticated regulatory system, represented by a plethora of actin binding proteins (ABPs), has developed to modulate actin dynamics, including assembly and disassembly of F-actins, and also their organization into higher-order networks (Blanchoin et al., 2010). The highly dynamic and widely distributed actin cytoskeleton allows prompt responses of the cell to signals arising from developmental and environmental stimuli, ensuring the precise regulation of cell development (Staiger et al., 2000; Blanchoin et al., 2010).
Actin protein sequences vary little in length from 377 amino acid residues and share more than 80% protein sequence similarity (Šlajcherová et al., 2012). Amino acid substitutions in actin, especially those that have an impact on their surface properties, are very likely to alter actin-actin or actin-ABP interactions (McDowell et al., 1996; Feng and Marston, 2009). Numerous actin mutants caused by amino acid substitution have been found in both uni- and multi-cellular organisms. Some yeast actin mutations result in growth deficiencies, or even death of the cell (Ishiguro and Kobayashi, 1996; Teal and Dawson, 2007). In humans, many actin mutations have been found to be pathogenetic, and result in a range of congenital disorders, such as myopathy (Feng and Marston, 2009; Marston, 2018) and deafness (Bryan et al., 2006; Morin et al., 2009), depending on the site of mutation and the type of actin affected. In Arabidopsis, amino acid substitution in actin led to disruption of the F-actin network, resulting in various morphological malformations, such as dwarf plants and deformed organs (Ringli et al., 2002; Nishimura et al., 2003; Kato et al., 2010).
During plant cell growth, cell wall matrix precursors and membrane materials are constructed in the Golgi system, and then delivered to the existing cell wall at the site of expansion via exocytotic vesicles (Emons and Ketelaar, 2009). The membranes of these vesicles fuse with the plasma membrane (PM) causing the insertion of transmembrane proteins, typically represented by the cellulose microfibril-producing cellulose synthase complex (CSC), into the PM (Gardiner et al., 2003; Emons and Ketelaar, 2009). The importance of the actin cytoskeleton in plant cell growth had been well established by numerous pharmacological and genetic studies (Szymanski et al., 1999; Chen et al., 2009; Pei et al., 2012), and a growing body of evidence has confirmed that the actin cytoskeleton is essential in supporting the intracellular movement of cytoplasmic organelles (Miller et al., 1999; Mathur and Martin, 2002; Hussey et al., 2006; Akkerman et al., 2012). Any perturbation of the actin cytoskeleton by application of actin-depolymerizing drugs (Miller et al., 1999; Szymanski et al., 1999; Ketelaar et al., 2003; Chen et al., 2009), or spontaneous mutation or genetic manipulation of actin cytoskeleton related genes (Chen et al., 2002; Mathur and Martin, 2002; Nishimura et al., 2003; Wang et al., 2009; Kato et al., 2010; Yang et al., 2011; Zhang et al., 2011; Wu et al., 2015) affects cell elongation, expansion, and morphogenesis at various degrees. Accordingly, abnormal intracellular motility of organelles and vesicles has been observed, which directly results in altered cell morphogenesis (Wang et al., 2006; Gutierrez et al., 2009; Kato et al., 2010; Akkerman et al., 2012; Li et al., 2014).
Cotton is an important cash crop throughout the world, and its fibers are the primary raw material for the textile industry. The development of cotton fibers comprises four distinct, yet overlapping stages: fiber initiation, cell elongation, secondary cell wall (SCW) synthesis, and maturation (Haigler et al., 2012). There is a distinct rearrangement of the actin cytoskeleton during transition from fiber elongation to secondary wall deposition (Seagull, 1990; Wang et al., 2010). In line with the cytological observations, a variety of ABP encoding genes have been found to be preferentially expressed in developing fiber cells, such as those encoding actin deploymerizing factors (Wang et al., 2009), profilins (Wang et al., 2005; Wang et al., 2010; Bao et al., 2011), and LIM-domain proteins (Han et al., 2013; Li et al., 2013; Li et al., 2018). Moreover, studies of transgenic cotton suggest that some increases in F-actin abundance are beneficial for fiber quality improvement (Wang et al., 2009; Han et al., 2013), and formation of the higher actin cytoskeleton structure plays a determinant role in the progression of developmental phases of cotton fibers (Wang et al., 2010; Zhang et al., 2017). However, the detailed physiological roles of the actin cytoskeleton in cell and plant morphogenesis remain poorly understood.
In G. hirsutum, Ligon lintless-1 (Li1) is a monogenic dominant mutant that exhibits various abnormal morphological characteristics, including dwarf plants, twisted organs and extremely shortened fibers (Griffee and Ligon, 1929; Kohel, 1972). Therefore much work has been done to isolate the Li1 gene (Karaca et al., 2002; Rong et al., 2005; Gilbert et al., 2013; Jiang et al., 2015; Thyssen et al., 2015). Recently, Thyssen et al. (2017) reported that the actin gene Gh_D04G0865 is responsible for the Li1 mutants. However, the molecular mechanisms underlying the action of the Li1 gene are largely unknown. In this independent study, we isolated the same gene using a map-based cloning approach. Here, we named it GhLi1, which harbors a missense mutation that causes the 65th glycine to be substituted with valine (G65V) in its gene product. Further analysis indicated that the G65V substitution in GhLi1 affected the nucleation and elongation processes during the F-actin assembly, which disturbs actin cytoskeleton organization in a dominant manner. We also showed that GhLi1 negatively regulates cotton plant morphology and fiber elongation by disordering the actin cytoskeleton-based processes such as intracellular transportation. Our results confirm and extend the current understanding of the role of the actin cytoskeleton in plant cell elongation.
Materials and Methods
Plant Materials and Growth Conditions
The Li1 mutants were provided by Dr. Kohel (USDA-ARS, College Station, TX, USA). It had been self-pollinated for at least six generations in our laboratory. Hai7124 is a commercial Sea-island Verticillium-resistant cultivar. Three BC1 populations and two F2 populations were developed from crosses between Li1 and Hai7124 between 2011 and 2016 (Supplementary Table S1). Petals, ovules, and fibers were collected from the adult Li1 mutants and wild-type (WT) plants. Roots, stems, and leaves were collected 15 days after germination (DAG) from seedlings grown in a growth chamber (16-h light/8-h dark, 28°C).
Measurement of the Length of Root Elongation Zone and Cells From This Zone in 7 DAG Seedlings
The length of root elongation zone was determined by measuring the distance between the bottom of mature zone (characterized by root hairs) and the top of meristematic zone (V-shaped structure of apex) as described by Li et al. (2014). The length of cells from the root elongation zone was measured by the ImageJ software (https://imagej.nih.gov/ij/). Three-cm length root tips were incubated with FM4-64 staining buffer (5 mM) for 5 min at 25°C, and then observed under a LSM780 confocal laser microscope (Zeiss, Germany). The FM4-64 fluorescence was excited at 515 nm, with emission at 640 nm.
Scanning Electron Microscopy (SEM) Analysis
Cotyledons, ovules, and fibers were fixed with 2.5% glutaraldehyde in phosphate buffered saline (PBS, pH 7.0) for 24 h and washed three times with PBS for 15 min at each step. They were postfixed with 1% OsO4 in PBS for 2 h, washed three times, then dehydrated by a graded series of ethano (30%, 50%, 70%, 80%, 90%, and 95%) for 15 min at each step, and finally dehydrated two times by absolute ethanol for 20 min. They were then coated with gold-palladium, and observed under a SEM (Hitachi Model SU-8010, Japan).
Transmission Electron Microscopy (TEM) Analysis
Fibers were detached from the mature seeds and pre-treated as described in SEM analysis. After pre-treatment, samples were subjected to absolute acetone for 20 min, 1:1 mixture of acetone and Spurr resin for 1 h at room temperature, 1:3 mixture of acetone and Spurr resin for 3 h and to final Spurr resin for 24 h, and embedded in Spurr resin to heat at 70°C for 9 h. Six-µm sections were generated, stained by uranyl acetate and alkaline lead citrate for 10 min, and finally viewed using a TEM (Hitachi Model H-7650, Japan).
Measurements of Length and Weight of Cotton Fibers
Bolls from the WT and Li1 plants were harvested at 10–50 days post anthesis (DPA) at 10 day intervals. Seeds were separated from each other using a boiling method (Schubert et al., 1973). After washing in flowing water, the straightened fibers were measured using a vernier caliper. Fibers were then separated from seeds and fully dried, before being weighed on an analytical balance. Fiber density on each seed was calculated as the ratio of weight to length.
Determination of Cellulose Content in Cotton Fibers
Determination of the cellulose content in fibers was performed according to a method described previously (Zhang et al., 2017). Alcohol-insoluble fiber residues were treated with 2 M trifluoroacetic acid at 121°C for 90 min and centrifuged for 5 min. The pellets were re-suspended in 1-ml Updegraff reagent (acetic acid: nitric acid: water, 8:1:2) and incubated at 100°C for 30 min. After centrifugation, the residual materials were washed with water, 70% ethanol and acetone, in sequence, and then fully dried and weighed. Cellulose content was calculated as a percentage of the weight of the residual materials to that of the initial samples.
Mapping of the Li1 Gene
First, using three BC1 populations and microsatellite markers that were developed based on genome sequences of G. raimondii (Paterson et al., 2012), the Li1 locus was mapped to a 1.088-cm region on Chromosome D04 (Liang, 2015). To further delimit the mapping interval, we developed two F2 populations and insertion-deletion (InDel) markers based on genome sequences of G. hirsutum and G. barbadense (Liu et al., 2015; Zhang et al., 2015). Finally, the Li1 locus was delimited to a 630-kb interval on chromosome D04 of G. hirsutum. The cDNA and gDNA of 11 genes in this region were amplified from Li1 and WT plants, and compared by Clustal X 2.0 software (Larkin et al., 2007). A single-nucleotide polymorphism (SNP) marker was developed according to the base mutation in Gh_D04G0865. Primer sequences used for mapping and gene cloning are listed in Supplementary Table S2. A SMARTer RACE cDNA amplification kit (Clontech, USA) was used to isolate the 5’- and 3’-untranslated regions (UTRs) of Gh_D04G0865.
Quantitative RT-PCR (qRT-PCR) Analysis
qRT-PCR analysis was performed on the ABI 7500 Real Time System (Applied Biosystems, USA). The amplification parameters were as follows: 95°C for 10 min, followed by 40 cycles at 95°C for 15 s, 58°C for 15 s, and 72°C for 15 s. The cotton Histone 3 gene (His3, GenBank accession no. AF024716) was used as the internal control. Amplification efficiency and gene specificity of qRT-PCR primers (Supplementary Table S2) were tested by Sanger sequencing and polyacrylamide gel electrophoresis.
Characterization of Actin Family Genes in G. hirsutum
The genomic database of G. hirsutum acc. TM-1 was downloaded from http://mascotton.njau.edu.cn/ (Zhang et al., 2015). Eight Arabidopsis actin protein sequences (McDowell et al., 1996) were used as queries to perform BLASTP search against the G. hirsutum protein sequence database. The identified actin genes were named as GhACTs based on their chromosomal location (Supplementary Table S3). ClustalX 2.0 software (Larkin et al., 2007) was used for the alignment of actin sequences from cotton and Arabidopsis. A phylogenetic tree was constructed by the Neighbor-Joining (NJ) method by MEGA v5.0 software and the reliability of interior branches was assessed with 1,000 bootstrap re-samplings (https://www.megasoftware.net/). The high-throughput RNA-sequencing data of G. hirsutum acc. TM-1 were employed from the accession code SRA: PRJNA248163 in the National Center for Biotechnology Information (https://www.ncbi.nlm.nih.gov/). Expression levels were calculated using the fragments per kilobase of exon model per million mapped reads (FPKM) method using Cufflinks software with default parameters (Trapnell et al., 2012). Heat map represent the spatio and temporal expression of GhACTs was drawing by Heml 1.0 software (Deng et al., 2014). Eight GhACTs were randomly chosen for qRT-PCR experiment, and a correlation analysis was conducted to test the consistency in gene expression between qRT-PCR and RNA-Seq methods. Primers used for qRT-PCR are listed in Supplementary Table S2.
Virus Induced Gene Silencing (VIGS) Experiments in Cotton
Cotton VIGS assays were performed as described by Gao et al. (2011). Gene fragments were cloned into the pTRV2 vector and introduced into Agrobacterium tumefaciens strain GV3101. Agrobacterium cells were inoculated, harvested, and resuspended in infiltration medium (10-mM MgCl2, 10-mM MES, 200-mM acetosyringone), and adjusted to an OD600 of 1.5. Cell suspensions were incubated at 25°C for 3 h, and then Agrobacterium cultures carrying pTRV1 and pTRV2 or its derivatives were mixed at a 1:1 ratio. WT and Li1 seedlings (15 DAG) with fully expanded cotyledons and one true leaf were infiltrated by inserting the Agrobacterium suspension into the cotyledons. Primers used for vector construction and qRT-PCR analysis are listed in Supplementary Table S2.
Observation of the Actin Cytoskeleton in Fiber and Root Cells
Observation of the actin cytoskeleton in fiber cells was performed as described by Seagull (1990). Fibers were incubated in PBS buffer containing 100-mM PIPES, 0.05% Triton X-100, 1-mM MgCl2, 3-mM DTT, 0.3-mM PMSF, 5-mM EGTA, 0.25% glutaraldehyde, and 0.66-µM AlexaFluor488-phalloidin for 10 min. The actin cytoskeleton in root cells was stained using the method described by Yang et al. (2011). Samples were incubated in PME buffer (100-mM PIPES, 5-mM MgSO4, and 10-mM EGTA, pH 6.9) containing 300-µM MBS, 1.5% glycerol, and 0.1% Triton X-100 for 30 min. Samples were rinsed twice with PME buffer and then fixed in PME buffer containing 2% paraformaldehyde for 30 min. Samples were incubated in the staining buffer (PME, 1.5% glycerol, 0.1% Triton X-100, and 0.66-µM AlexaFluor488-phalloidin) at 4°C overnight, washed twice with PME and mounted onto glass slides. Observation of F-actin was performed under a LSM780 confocal laser microscope (Zeiss, Germany). AlexaFluor488 fluorescence was excited at 488 nm with emission at 543 nm.
Observation of Vesicles in Fiber and Root Cells
The distribution of vesicles in fiber and root cells was investigated according to the methods described by Zhao et al. (2010) and Li et al. (2014), respectively. Fibers and 1-cm root tips were respectively incubated with FM4-64 staining buffer (5 mM) for 10 min and 30 min at 25°C, and observed under a LSM780 confocal laser microscope (Zeiss, Germany). The FM4-64 fluorescence was excited at 515 nm, with emission at 640 nm.
Immunofluorescence Analysis of CSC Distribution in Fiber Cells
The distribution of CSC in fiber cells was investigated according to the method described by Wang et al. (2010). Twenty DPA fibers were fixed with 4% paraformaldehyde and 0.1% glutaraldehyde in PME buffer containing 0.1% Triton X-100 and 0.3 M mannitol. After three washes in PME buffer, fibers were incubated with 1% cellulase R-10 and 0.1% pectolase Y-23 in PME buffer for 5 min. Fibers were washed once in PME buffer and twice in PBS (pH 7.0), and further incubated in PBS containing 1% BSA for 15 min. The fibers were then probed with the primary antibody (anti-CesA7; Agrisera, Sweden) and the corresponding secondary antibody (AlexaFluor594-conjugated anti-rabbit IgG; Abbkine, USA), washed twice with PBS and observed. The AlexaFluor594 fluorescence was excited at 588 nm with emission at 612 nm.
Quantitative Analysis of Fluorescence Intensity
Quantification analysis of F-actin, vesicle, and CSC in fiber or root cells was conducted by ImageJ software (https://imagej.nih.gov/ij/) as described method by Zhang et al. (2011). Images belonging to the same comparison group were collected under the same condition, and then normalized to an equal grayscale. Sixty cells from six randomly selected visual fields were analyzed, and the region of interest size was 40 µm × 10 µm and 100 µm × 30 µm for fiber and root cell, respectively. The average pixel intensity were used to plot fluorescence intensity.
Molecular Model of G-Actin and F-Actin
The multiple alignment of 75 actin protein sequences (the 1–120 N terminal amino acids were presented) from yeast, Arabidopsis, rice, maize, poplar, and upland cotton was performed by Clustal X2.0 software. The accession number of these proteins are listed in Supplementary Tables S4 and S5. The molecular model of G-actin was constructed using SWISS-MODEL software (https://www.swissmodel.expasy.org/) using a previously reported G-actin structure, 3chw.1.A, as the template. The polymer structure 6anu.1.E was used as the template to construct an F-actin model, and the Swiss-PdbViewer software was used to simulate the structural changes caused by the G65V substitution (Guex et al., 2009).
Recombinant Protein Production
The CDS of GhLi1 and Ghli1 were cloned into pET30a plasmids to construct GhLi1-6×His and Ghli1-6×His vectors, respectively. Recombinant proteins were expressed in E. coli strain BL21 (DE3) and purified using nickel-nitrilotriacetic acid resin. Purified GhLi1-6×His and Ghli1-6×His proteins were dissolved in Buffer A (5-mM Tris-HCl, pH 8.0, 0.2-mM CaCl2, 0.2-mM ATP, 0.1-mM imidazole and 0.5-mM DTT) to generate Ca-ATP-actins.
Actin Nucleation Assay
Actin nucleation assays were conducted according to the methods described by Michelot et al. (2005). Mg-ATP-actin was prepared by incubation of Ca-ATP-actin with 1-mM EGTA and 0.1-mM MgCl2 for 2 min on ice. Monomeric rabbit skeletal muscle actin (2 µM; 10% pyrene-labeled) was incubated with different concentrations of GhLi1-6×His or Ghli1-6×His for 5 min at room temperature. Pyrene fluorescence was detected by an F-4600 fluorescence spectrophotometer (Hitachi, Japan) immediately after the addition of one-tenth volume of 10×KMEI buffer (500-mM KCl, 10-mM MgCl2, 10-mM EGTA, and 100-mM imidazole-HCl, pH 7.0). The fluorescence signal was detected every 50 s for a total of 20 min.
Fluorescence Microscopy of Actin Filaments inVitro
In vitro actin filaments were observed as described previously (Michelot et al., 2005). Ghli1-6×His and GhLi1-6×His proteins were mixed at different concentrations (2:0, 2:0.2, 0:2, in a unit of “µM”) in 1× KMEI buffer at 22°C for 5 or 20 min and labeled with an equimolar amount of rhodamine-phalloidin. The polymerized F-actin was diluted to 10 nM in fluorescence buffer (10-mM imidazole-HCl, pH 7.0, 50-mM KCl, 1-mM MgCl2, 100-mM DTT, 100-µg/ml glucose oxidase, 15 mg/ml glucose, 20 µg/ml catalase, and 0.5% methylcellulose). A dilute sample of 2 µl was applied to a 22 × 22-mm cover slip coated with poly-L-Lys (0.01%). Actin filaments were observed with an Axio Imager D2 microscope (Zeiss, Germany) equipped with a 60×, 1.42-numerical aperture oil objective. Images were collected with a Axiocam 503 color camera using ZEN 2010 software. After 5-min polymerization, the number of actin filaments were calculated to reflect actin nucleation capacity. Ten 50 × 50-µm regions were randomly selected from the images to calculate the number of actin filaments. The data was finally normalized to number per 1 mm2. After 20-min polymerization, the length of actin filaments were calculated to reflect actin elongation capacity. Ten 50 × 50-µm regions were randomly selected from the images to measure the length of actin filaments. The data represent means of each filament in each region. ImageJ software (https://imagej.nih.gov/ij/) were used in the measurement of filament number and length.
Results
Li1 Exhibits Defects in Cell Elongation
Compared with the WT, the Li1 heterozygote showed reduced root growth and wrinkled cotyledons at the seedling stage (Figure 1A and Table 1), and dwarf plants, distorted stems, short internodes, wrinkled leaves, and petals (Figures 1E–H), and extremely shortened fibers at the later stages of development (Figures 2A, B). The Li1 homozygote showed low survival rate and much weaker growth than the Li1 heterozygote (Figure 1E and Supplementary Table S1). The more greatly affected phenotype of homozygote Li1 than heterozygote indicates that the phenotypic differences are caused by a semi-dominant gene or a dosage effect, in line with our previous report (Liu et al., 2010). Since the Li1 plants exhibited pleiotropic morphological changes, it is reasonable to speculate that the Li1 gene is widely expressed in various organs/tissues. In addition, SEM analysis showed that the fiber development occurred at the same pace in the Li1 and WT between 0 and 2 DPA, whereas the Li1 fibers were obviously shorter than that of the WT on 3 DPA ovules (Supplementary Figure S1). Our observations are in agreement with those of previous studies (Karaca et al., 2002; Liang et al., 2015), suggesting that the Li1 gene is not expressed until 3 DPA in developing fibers.
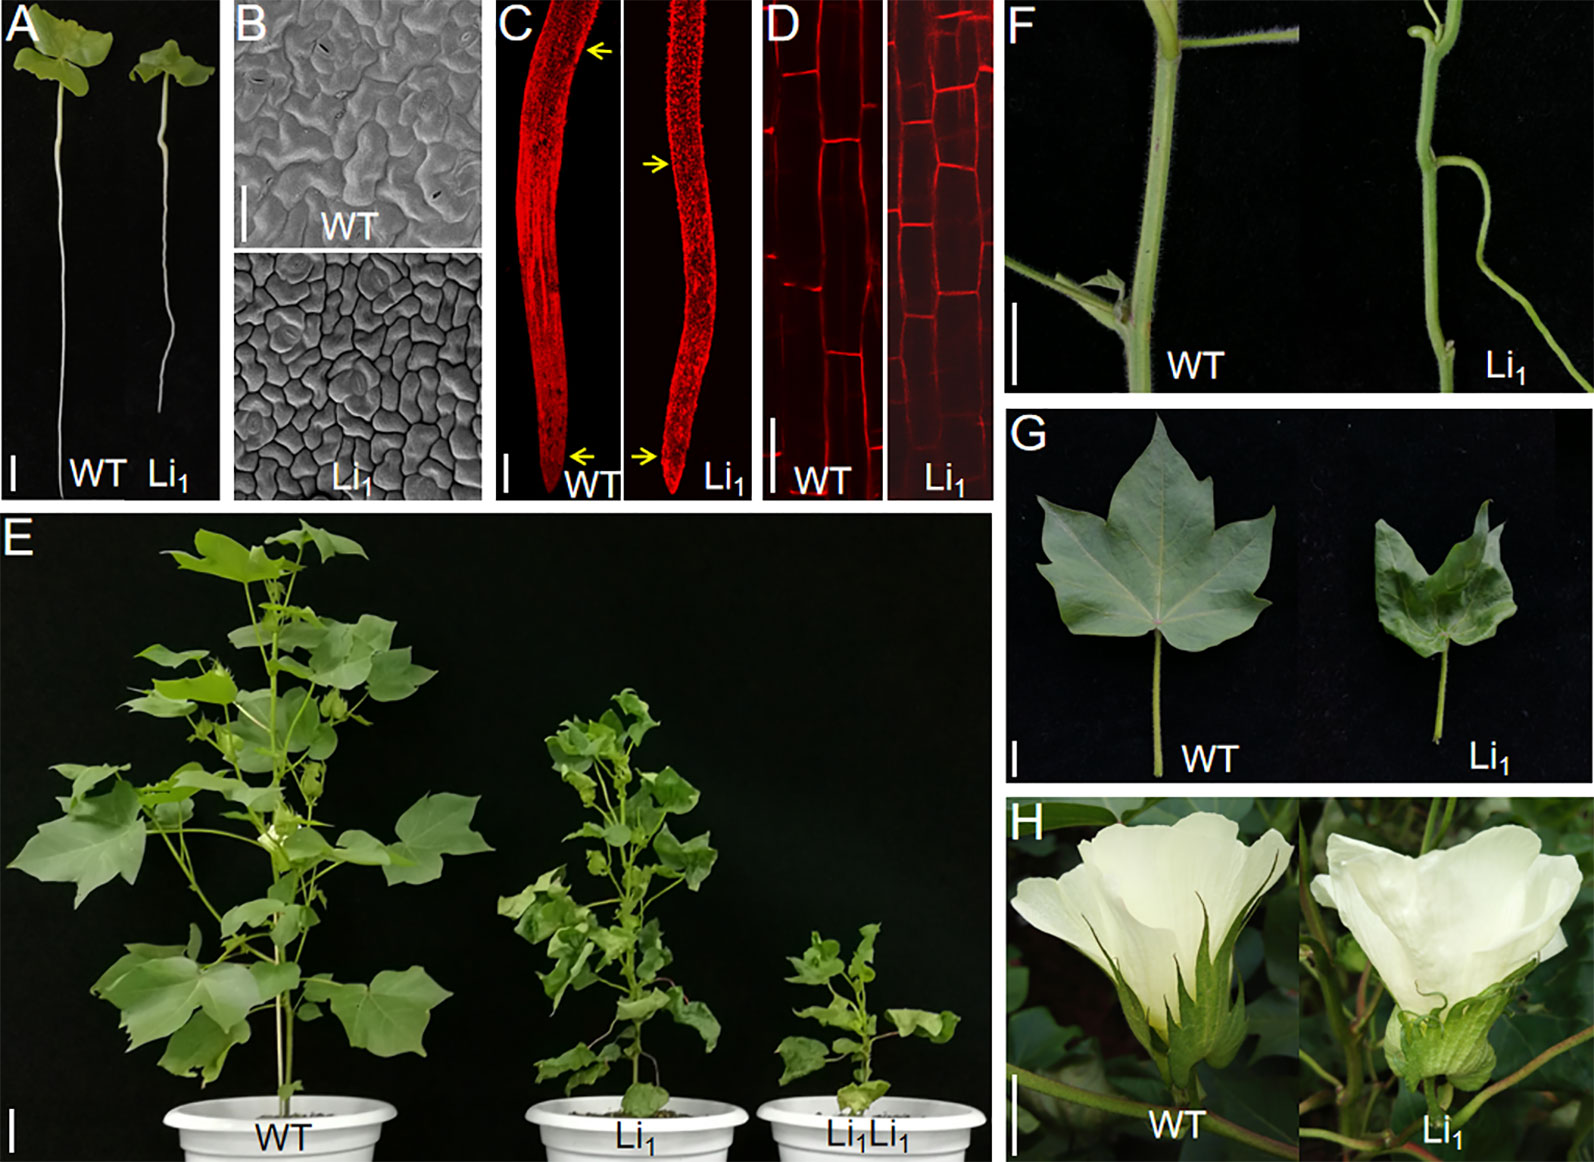
Figure 1 Phenotypic differences between WT and Li1. (A) WT and Li1 seedlings (7 DAG), showing reduced root growth and wrinkled cotyledons in the Li1. Bar = 2 cm. (B) SEM analysis of the cotyledon pavement cells of WT and Li1 seedlings (7 DAG), showing reduced surface area of the pavement cells in the Li1. Bar = 50 µm. (C) Root tips of WT and Li1 seedlings (7 DAG). Arrows indicate borders of the root elongation zone (between the bottom of mature zone and the top of meristematic zone), showing shorter length of the root elongating zone in the Li1. Bar = 0.1 cm. (D) Morphology of cortical cells in the root elongation zone of WT and Li1, showing shorter cell length in the Li1. Bar = 100 µm. (E) Compared with WT, the Li1 heterozygote and homozygote (Li1Li1) mutants exhibited semi and extremely dwarf plants, respectively. Bar = 5 cm. (F, G, H) Stems (F), leaves (G), and calyxes and petals (H) of WT and Li1 plants. Bars = 2 cm.
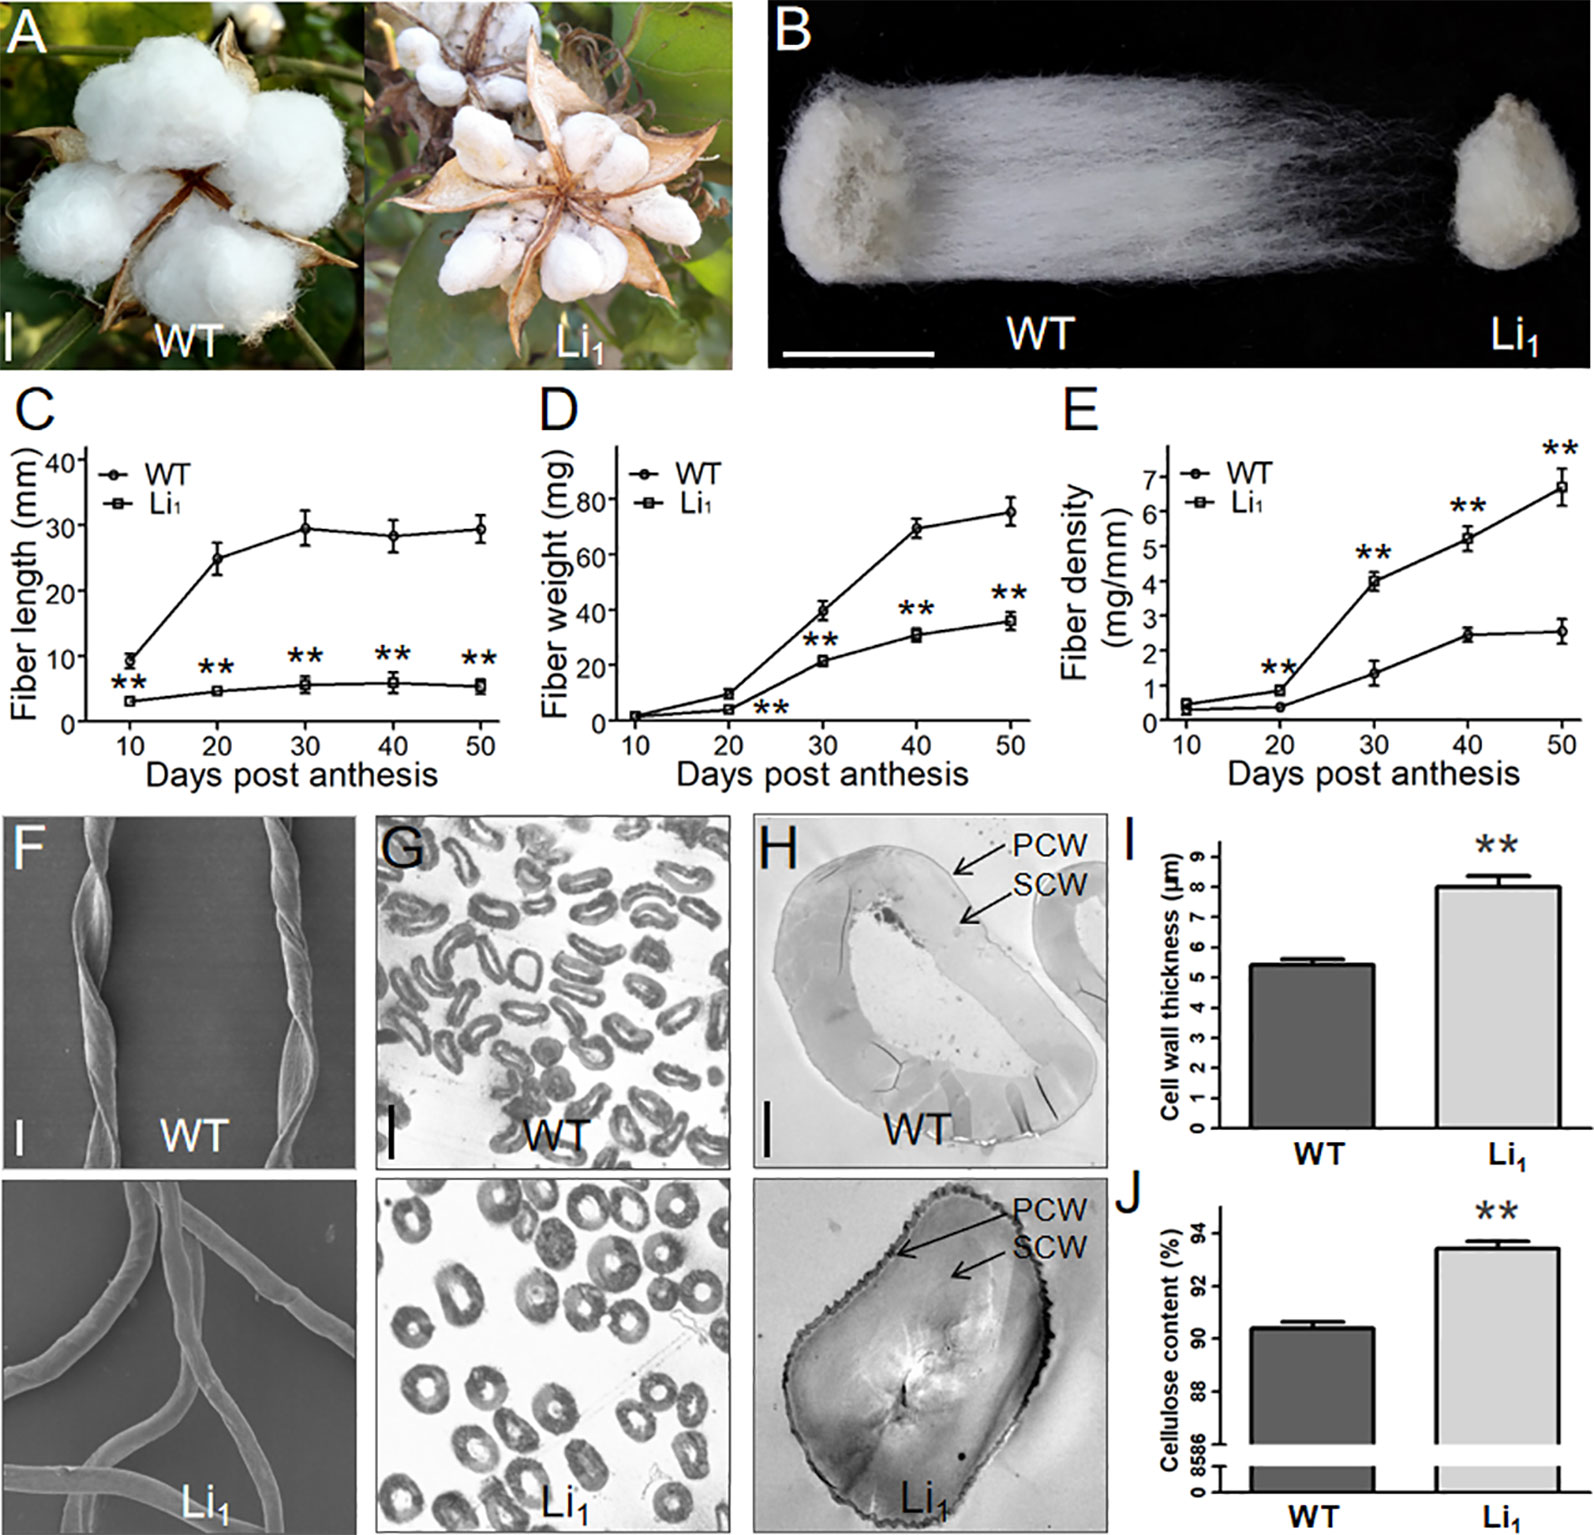
Figure 2 Comparison of the length, weight, density, and cell wall of WT and Li1 fiber cells. (A, B) Cracked bolls (A) and single seeds (B) of WT and Li1 showed extremely shortened fibers in the Li1 at maturity. Bars = 1 cm. (C, D, E) Measurement of the length (C), weight (D) and density (E) of WT and Li1 fibers at different developmental points. (F) SEM analysis of mature fibers of WT and Li1. Bar = 20 µm. (G) Cross sections of mature fibers of WT and Li1. Bar = 20 µm. (H) Transmission electron microscopy images of mature fibers of WT and Li1 plants. PCW, primary cell wall; SCW, secondary cell wall. Bar = 5 µm. (I) Cell wall thickness of mature fibers of WT and Li1 plants. (J) Cellulose content of mature fibers of WT and Li1 plants. Data in (C, D, E, I, J) show means ± SD of measurements from 30 biological replicates, Student’s t-test: **P < 0.01.
Given the smaller size of the Li1 mutants, we sought to compare the cellular morphology of cotyledons and roots in Li1 and WT plants. In the developing WT cotyledons, characteristic lobed and jigsaw-puzzle shaped pavement cells were found (Figure 1B). However, pavement cells in the Li1 plants had fewer lobes, and their surface area was significantly reduced in comparison to the WT (Figure 1B and Table 1). In the WT, pavement cells maintained a firm contact with their neighbors, whereas contiguous epidermal cells in the Li1 plants broke contact at their fringe, resulting in disconnected cells (Figure 1B). FM4-64 staining showed that the root elongation zone and cells from this zone were significantly shorter in Li1 seedlings than that in WT (Figures 1C, D and Table 1). These results suggest that polar growth and elongation of the Li1 cells was inhibited.
To gain more insights into the changes in developing Li1 fiber cells, we determined the length and weight of the Li1 and WT fibers at different developmental points. In the WT, fibers rapidly elongated between 10 and 20 DPA, and stopped at ∼30 DPA. Whereas the elongation of Li1 fibers nearly ceased at 10 DPA, and the Li1 fibers were significantly shorter than the WT (Figure 2C). Although the dry weights of both Li1 and WT fibers rapidly increased between 20 and 50 DPA (Figure 2D), the fiber density of Li1 plants during this period was significantly higher than that of WT (Figure 2E). SEM analysis showed that the WT fibers adopt a flat ribbon like structure with a continuous helix, while the Li1 fibers were shaped like circular tube and had no helix (Figure 2F). The increased density and altered shape of Li1 fibers prompted us to investigate their cell wall structure. Cross-sections analysis showed the cell wall (especially the SCW) of mature Li1 fibers had a much thicker appearance than that of the WT (Figures 2G, H). Statistical analysis showed that the thickness of the cell wall was significantly higher in the Li1 fiber cells (Figure 2I). Since the major component of mature cotton fiber cells is a SCW mainly consists of cellulose, the cellulose content of the mature fiber cells was measured. As shown in Figure 2J, the cellulose content of the Li1 mature fibers was significantly higher than that of the WT. Thus, more active cellulose synthesis may account for the thicker SCW, increased fiber density and non-helical fiber cell shape of the mutants.
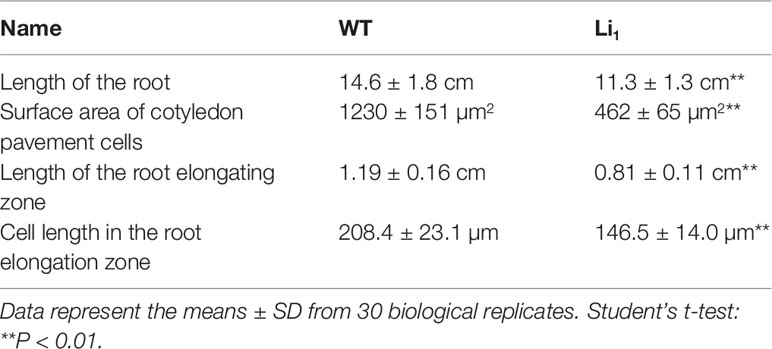
Table 1 Comparison of phenotypic differences between WT and Li1 seedlings (7 DAG).
Mapping of the Li1 Gene
To understand the mechanisms of Li1 gene response to Li1 mutant phenotype, we isolated the causative gene using a map-based cloning approach. The Li1 locus was first mapped on chromosome D04 between the microsatellite markers W4806 and W4571 using three BC1 populations, covering a 3.1 Mb interval (22.56–25.66 Mb) on chromosome D04 based on the genome sequence of G. hirsutum (Figure 3A; Liang, 2015; Zhang et al., 2015). Using two F2 populations and InDel markers, the Li1 locus was further narrowed down to a region between L408 and L440, covering a 630-kb interval that covering 11 annotated genes (Figures 3B, C and Supplementary Table S3) according to the G. hirsutum genome (Zhang et al., 2015). Sequence analysis showed that the 194th base of Gh_D04G0865 had changing from “G” to “T” in the Li1, resulting in the 65th amino acid residue being changed from glycine to valine (G65V) in the encoded actin (Figure 3D). Whereas the other ten genes had no sequence variation between the WT and Li1. The SNP marker designed by the base mutation in the CDS of Gh_D04G0865 was found to be co-segregated with the Li1 phenotype (Figure 3B). The expression of annotated genes in the mapping region was determined in various organs and developing ovules (0, 3, 5 DPA) and fibers (10 DPA) from the WT and Li1 plants (Supplementary Figure S2). Eight genes didn’t conform to the broad spectrum expression feature of the Li1 gene: Gh_D04G0861, Gh_D04G0867, Gh_D04G0868, and Gh_D04G0869 did not express in all tested tissues; both Gh_D04G0859 and Gh_D04G0866 not in petals; Gh_D04G0860 and Gh_D04G0862 not in roots and petals, respectively. These genes didn’t conform to the broad spectrum expression feature of the Li1 gene, so they were excluded from candidate genes. The expression level of Gh_D04G0863 and Gh_D04G0864 could not be distinguished due to their sequence similarity, and they expressed in all the tested tissues. The expression of Gh_D04G0865 could be found in all tissues except for the 0 DPA ovules. Statistical analysis showed the expression level of these genes were not significantly changed in Li1 tissues in comparison to that in WT. However, interestingly, spatiotemporal expression pattern of Gh_D04G0865 is highly consistent with the phenotypic features of Li1, including the mutant phenotype in various tissues and the onset time (3 DPA) of abnormal development in fibers (Figure 1 and Supplementary Figures S1 and S2). Therefore, it was supposed that the actin gene Gh_D04G0865 was the most likely candidate gene underlying the Li1 locus.
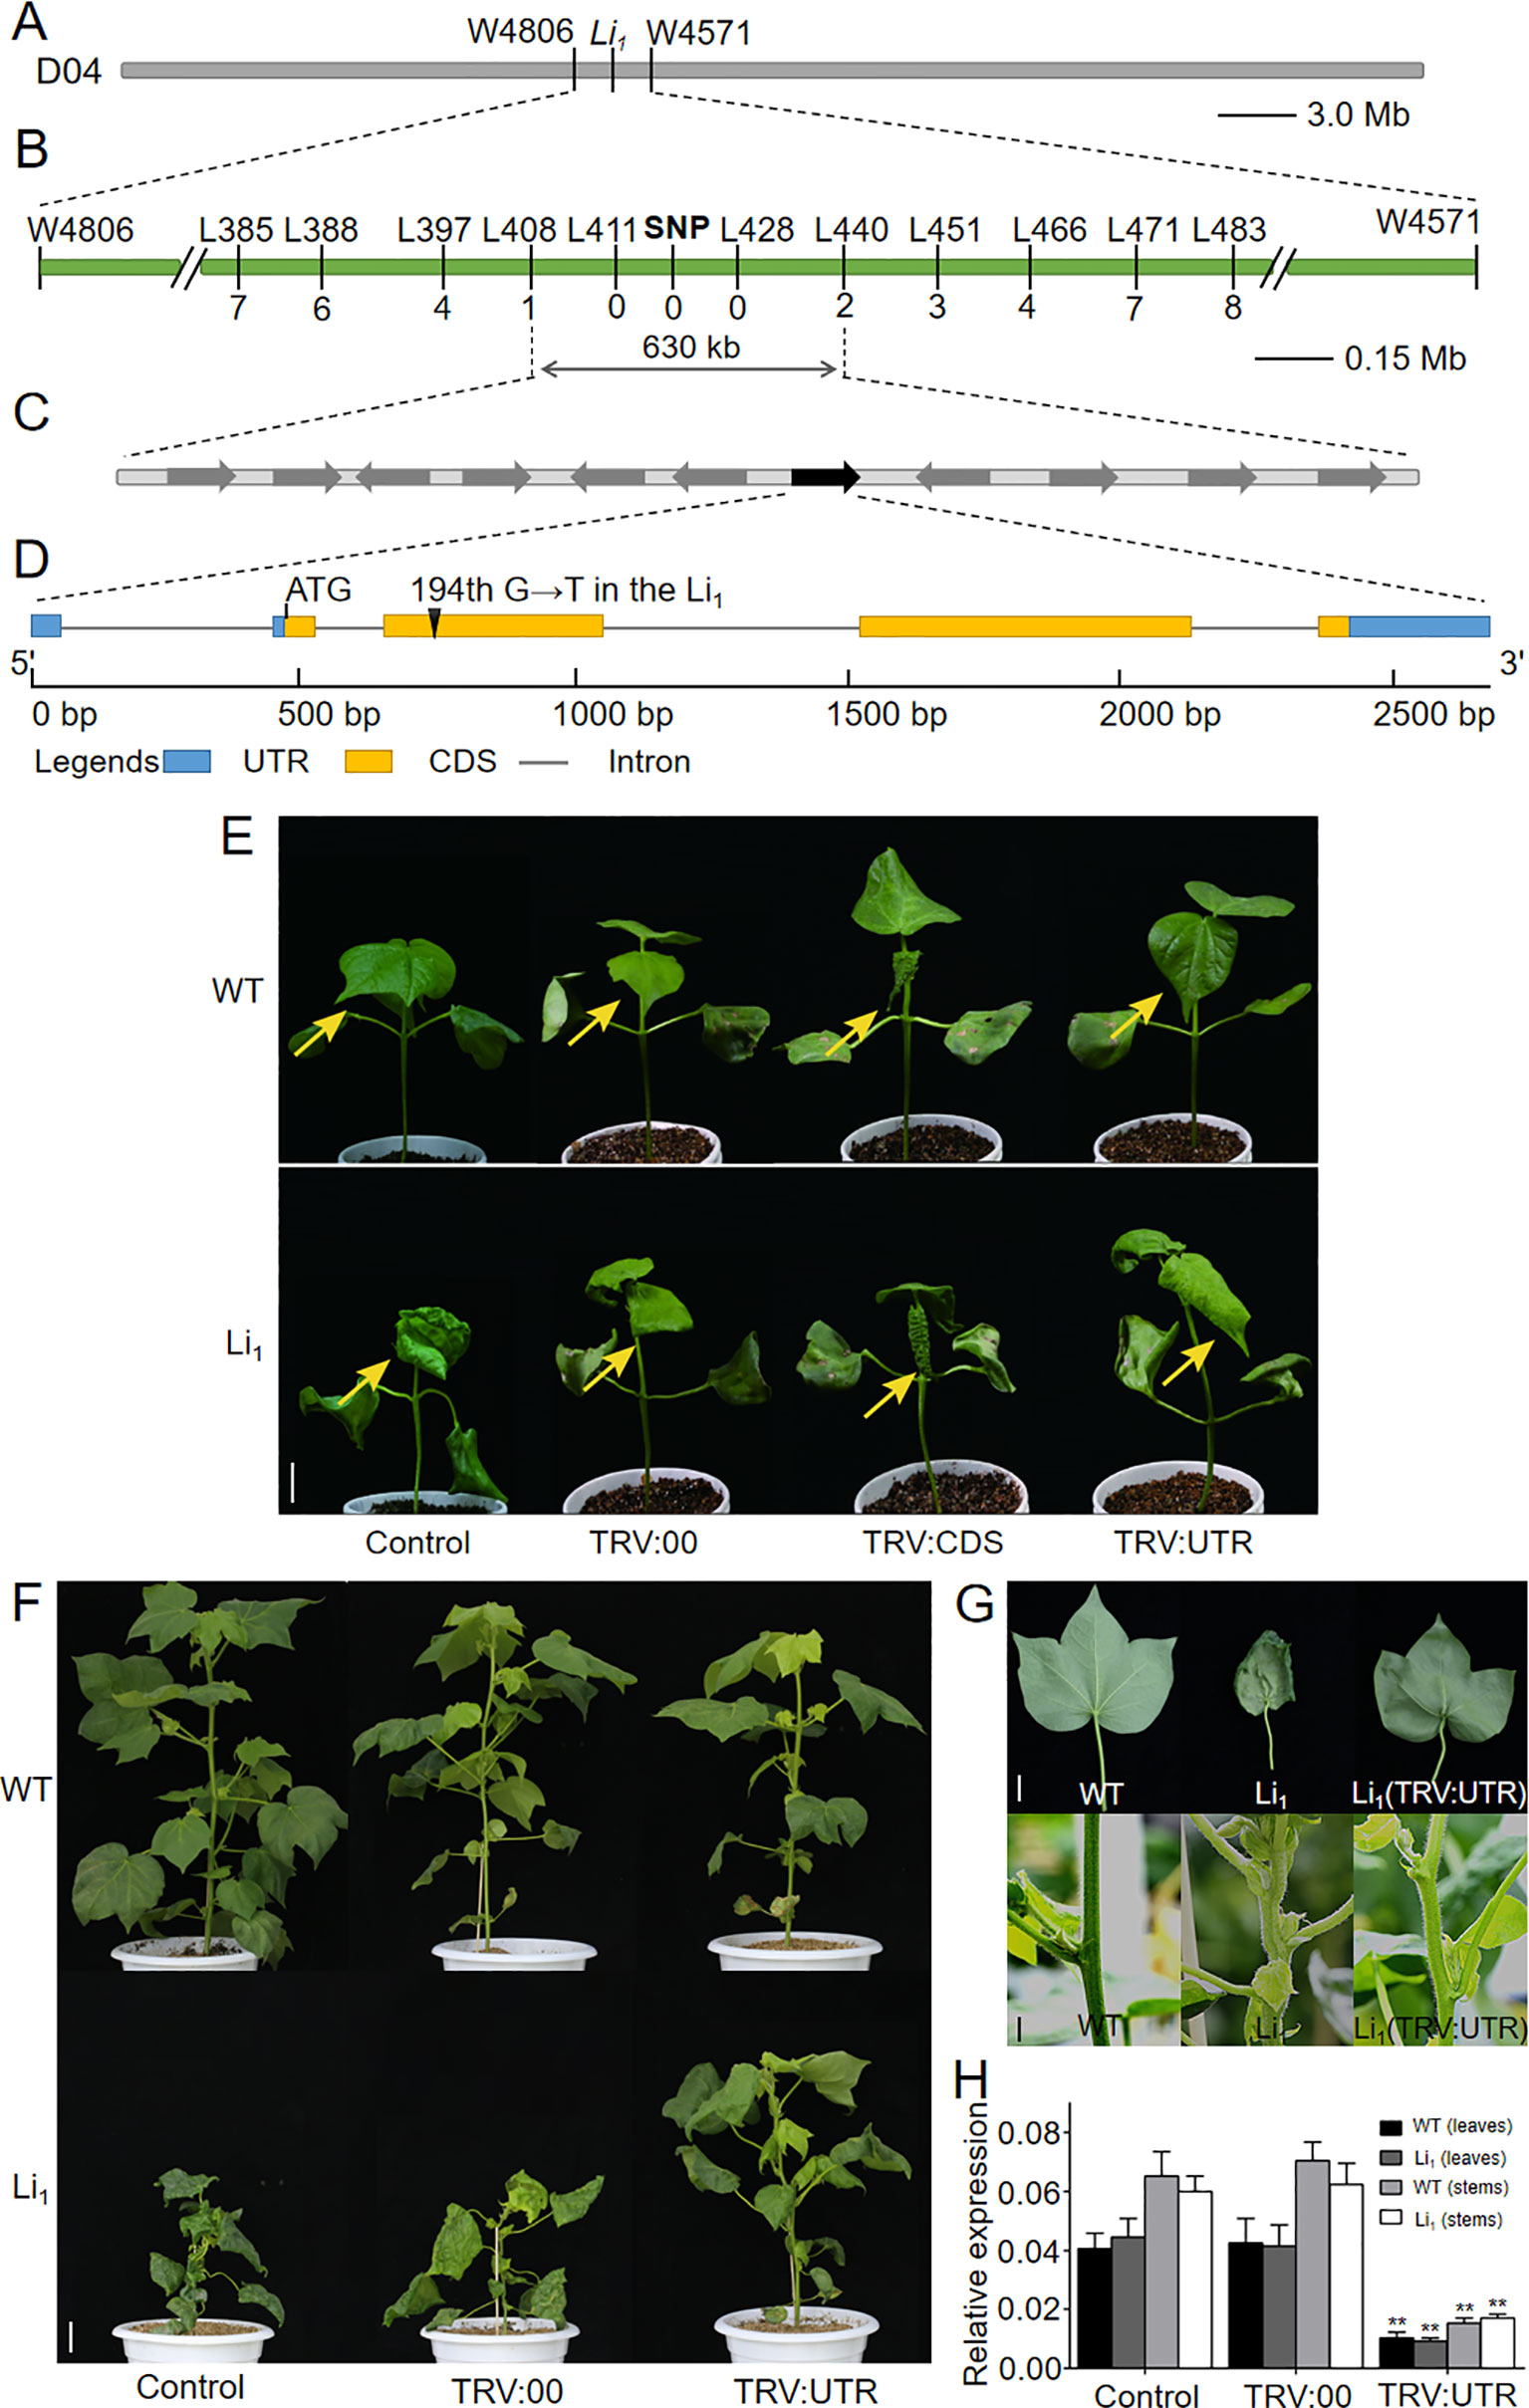
Figure 3 Map-based cloning and functional verification of the Li1 gene. (A) The Li1 locus was first mapped on chromosome D04 between the microsatellite markers W4806 and W4571 using three BC1 populations. (B) The Li1 locus was further fine-mapped to a region between InDel markers L408 and L440 using two F2 populations, and a SNP marker designed by the base mutation in Gh_D04G0865 was found to be co-segregated with the mutant phenotype. (C) The 630-kb mapping region includes eleven annotated genes, among which Gh_D04G0865 (indicated by green box) was the candidate gene responsible for the Li1 mutants. (D) Gene structure of Gh_D04G0865. In the Li1, the 194th base of Gh_D04G0865 had changed from “G” to “T”, resulting in the 65th amino acid residue being changed from glycine to valine (G65V) in the encoded actin. (E) Phenotypic changes were observed in the second true leaves (arrows indicated) 15 days after VIGS treatment. Bar = 2 cm. (F) The phenotypes of untreated (control), and pTRV2 (TRV:00) and pTRV2::UTR (TRV : UTR) treated WT and Li1 adult plants (90 day after VIGS treatment). Bar = 5 cm. (G) Phenotype of the leaves and stems of WT, Li1, and pTRV2::UTR treated Li1 plants. Bars = 2 cm. (H) Expression level of Gh_D04G0865 in leaves and stems in control, and TRV:00 and TRV : UTR treated WT and Li1 adult plants. Data in (H) represent the means ± SD of three biological replicates, Student’s t-test: **P < 0.01.
Actin Family Genes in G. hirsutum
In higher plants, actin is typically encoded by a multigene family, and one of the most important feature of actin genes is that they share high sequence similarity (Šlajcherová et al., 2012). Hence, understanding of the members, sequence characters, and expression patterns of the actin family genes in G. hirsutum is essential prior to the functional studies of Gh_D04G0865. A BLASTP search against the G. hirsutum genome identified 37 actin genes that dispersed on 20 of the 26 chromosomes. They were named as GhACT1A∼GhACT17A and GhACT1D∼GhACT17D according to their chromosomal location (Supplementary Figure S3 and Supplementary Table S4). Arabidopsis actin family genes were the most thoroughly studied actin family genes in higher plants, they were grouped into vegetative and reproductive classes based on their phylogenetic relationship and expression pattern (McDowell et al., 1996). Phylogenetic analysis showed cotton actin genes were also divided into two classes A and B that clustered together with the reproductive and vegetative Arabidopsis actin genes, respectively (Supplementary Figure S4). Subsequent divergence divided class A and B into three and two subclasses, respectively. Gene and protein sequence similarity of GhACTs with each other were higher than 80.17% and 90.64%, respectively. Gh_D04G0865 (named as GhACT9D in this nomenclature) shares higher than 81.74% CDS similarity with other GhACTs (Supplementary Figure S5). Transcriptomic data showed the expression pattern of GhACTs were in concordance with their phylogenetic divergence. With a few exceptions, most GhACTs in the group A were specially expressed in the reproductive organs such as stamens and developing ovules, while most GhACTs in the group B were expressed in almost all organs (Supplementary Figure S6). Eight GhACTs were randomly selected for qRT-PCR analysis, and their relative expression level were highly correlated with the transcriptomic data, indicating both of the two methods were credible in detection of gene expression level (Supplementary Figure S7). Expression pattern of GhACTs indicated that many members were likely to be simultaneously expressed in the given organs/tissues, and each gene product has the potential to participate in actin assembly to form hetero-polymer F-actins (Meagher et al., 1999).
Functional Verification of the Li1 Gene
Recently, Thyssen et al. (2017) reported that Gh_D04G0865, the same gene as we isolated, is responsible for the Li1 mutants. To verify that this gene is the causal gene for Li1, these researchers constructed a pTRV2 vector comprising its 781–1134-bp CDS (shares higher than 81.59% sequence similarity with other GhACTs) and 127 bp 3’-UTR, and VIGS experiments were performed in WT plants. The resultant decreased expression of Gh_D04G0865 and the abnormal phenotypes of VIGS treated plants suggested that this gene is responsible for the Li1 mutants. However, we have different opinions on the design of this experiment. Firstly, the VIGS vector constructed by Thyssen et al. (2017) may not be appropriate for specifically silencing the expression of the target actin gene. In plants, VIGS can reduce the expression of endogenous genes that are homologous to the inserted fragment in the VIGS vector via RNA-mediated defense (RMD) mechanisms (Baulcombe, 1999). RMD recognizes the complementary RNA sequence by base pairing, thus unintended off-target genes may also be silenced if they share high sequence similarity with the inserted fragment, and the interpretation of the observed phenotypic changes may be consequently obscured (Senthilkumar and Mysore, 2011). In fact, this phenomenon has long been attracted the attention of researchers (Burch-Smith et al., 2004; Xu et al., 2006; Fantini et al., 2013; Kumar, 2014). To specifically known down the expression of an actin gene, GhACT1, in cotton, researchers have used its gene-specific 3’-UTR fragment for RNAi vector construction (Li et al., 2005). However, a conserved fragment could simultaneously knockdown the expression of other members of a gene family or other genes that share high sequence similarity with the trigger sequence (Ramachandran et al., 2000; Burch-Smith et al., 2004; Kandoth et al., 2007). Our present analysis of the actin family genes in G. hirsutum showed that the CDS of GhACTs share more than 80% sequence similarity with each other (Supplementary Figure S5). This is high enough for efficient gene silencing (Holzberg et al., 2002; Zhai et al., 2016). Secondly, the use of receptor plants in the VIGS experiment by Thyssen et al. (2017) is not suitable. Genetic study has proved that the Li1 mutant was caused by a semi-dominant gene, thus the “gain-of-function” gene Li1 is required for the formation of the mutant phenotype in Li1. To verify the function of Li1, phenotypic changes in Li1 plants after silencing of the dominant gene Li1 should be examined, since phenotypic changes in the WT plants after the reduced expression of the recessive gene cannot represent the function of Li1. This principle is supported by many previous RNAi and VIGS studies, such as those in rice (Huang et al., 2009; Jiao et al., 2010; Tang et al., 2011; Li et al., 2015) and cotton (Chang et al., 2016; Si et al., 2018).
To investigate whether the mutated actin gene Gh_D04G0865 is the gene underlying the Li1 locus, we firstly attempted to develop transgenic lines that overexpress the mutated Gh_D04G0865 driven by the 35S promoter in WT cotton line W0 (Wu et al., 2008). However, we failed to generate positive plant with the expressed target gene, probably due to the detrimental effects on cell elongation of the mutated Gh_D04G0865. To investigate whether the mutated Gh_D04G0865 is responsible for the Li1 mutant, and at the same time to verify our different opinions with Thyssen et al. (2017), we performed two groups of VIGS experiments. One fragment corresponding to 730–1121-bp CDS (shares higher than 81.22% sequence similarity with other GhACTs) and another corresponding to 1–297-bp 3’UTR of Gh_D04G0865 were separately cloned into pTRV2 vector, generating pTRV2::CDS (TRV : CDS) and pTRV2::UTR (TRV : UTR) constructs. Li1 and WT seedlings were used as receptors to observe their phenotypic changes after VIGS treatment. Fifteen days after inoculation, the newly grown leaves were used for phenotypic observation since the morphology of older leaves had already formed before VIGS treatment. Leaves from all TRV : UTR treated WT plants had little change in comparison to that from untreated and TRV:00 (empty vector for control) treated WT plants (Figure 3E), probably due to the functional redundancy of actin genes as reported in Arabidopsis (for example: act2, act4, and act7 T-DNA mutants showed little phenotype changes; Gilliland et al., 1998). Compared with untreated and TRV:00 treated Li1 plants, more flatten leaves were observed in 55 out of 60 TRV : UTR treated plants (Figure 3E). In contrast, very seriously deformed leaves were produced from 55 out of 60 TRV : CDS treated Li1, and 57 out of 60 TRV : CDS treated WT plants in TRV : CDS treated Li1 and WT plants, and this phenotype was radically different with untreated Li1 leaves (Figure 3E). Moreover, viability of these plants became too weak to produce the third true leaf. qRT-PCR was used to determine the expression level of nine-leaf-expression GhACTs as indicated by the transcriptomic data (Supplementary Figures S6 and S8). As we expected, only Gh_D04G0865 was significantly silenced in TRV : UTR treated Li1 and WT plants. In contrast, TRV : CDS significantly reduced the expression level of all of the tested GhACTs in Li1 and WT plants. These results demonstrated that this VIGS phenotype could not be used to explain the function of the targeted gene. Phenotypic changes in the VIGS experiment were more obvious at 90 days after treatment: TRV : UTR treated WT plants had little difference with untreated and TRV:00 treated plants; TRV : UTR treated Li1 plants exhibited relieved mutant phenotype characterized by taller plants (Figure 3F), more flatten leaves and straighter stems than that from two groups of control plants (Figure 3G). Expression level of Gh_D04G0865 in the leaves and stems from TRV : UTR treated plants were significantly decreased (Figure 3H). These results suggested that the mutated Gh_D04G0865 expression was tightly linked to the degree performance of Li1 plants and confirmed that the mutated Gh_D04G0865 was responsible for the Li1 mutant. Given the dominant inherited feature of the Li1 mutants, Gh_D04G0865 was named Ghli1 and GhLi1 for the wild and mutant types, respectively.
Changes in Actin Cytoskeleton and Vesicle Distribution in Elongating Cells
Although it is clear that GhLi1 encodes a mutated actin, the mechanisms by which the G65V substituted actin affects the organization of the actin cytoskeleton in elongating cells remains to be explored. In 10 DPA fibers, which undergo fast elongation, many fine F-actin cables were formed, and further arranged longitudinally to the axis of the fiber cell in the WT (Figure 4A). However, the F-actin cables in 10 DPA Li1 fibers were arranged horizontally or obliquely, and their distribution was obviously sparser than that of the WT. In some cases, F-actin cables in the Li1 fiber cells were fragmented (Figure 4A). The same differences in the organization of the F-actin cytoskeleton between the Li1 mutants and the WT were observed in cortical cells from the root elongation zone (Figure 4B). A quantitative measurement of the fluorescence intensity of the confocal images showed that the amount of F-actin in the Li1 elongating root and fiber cells was significantly lower than that in the WT (Figure 4C).
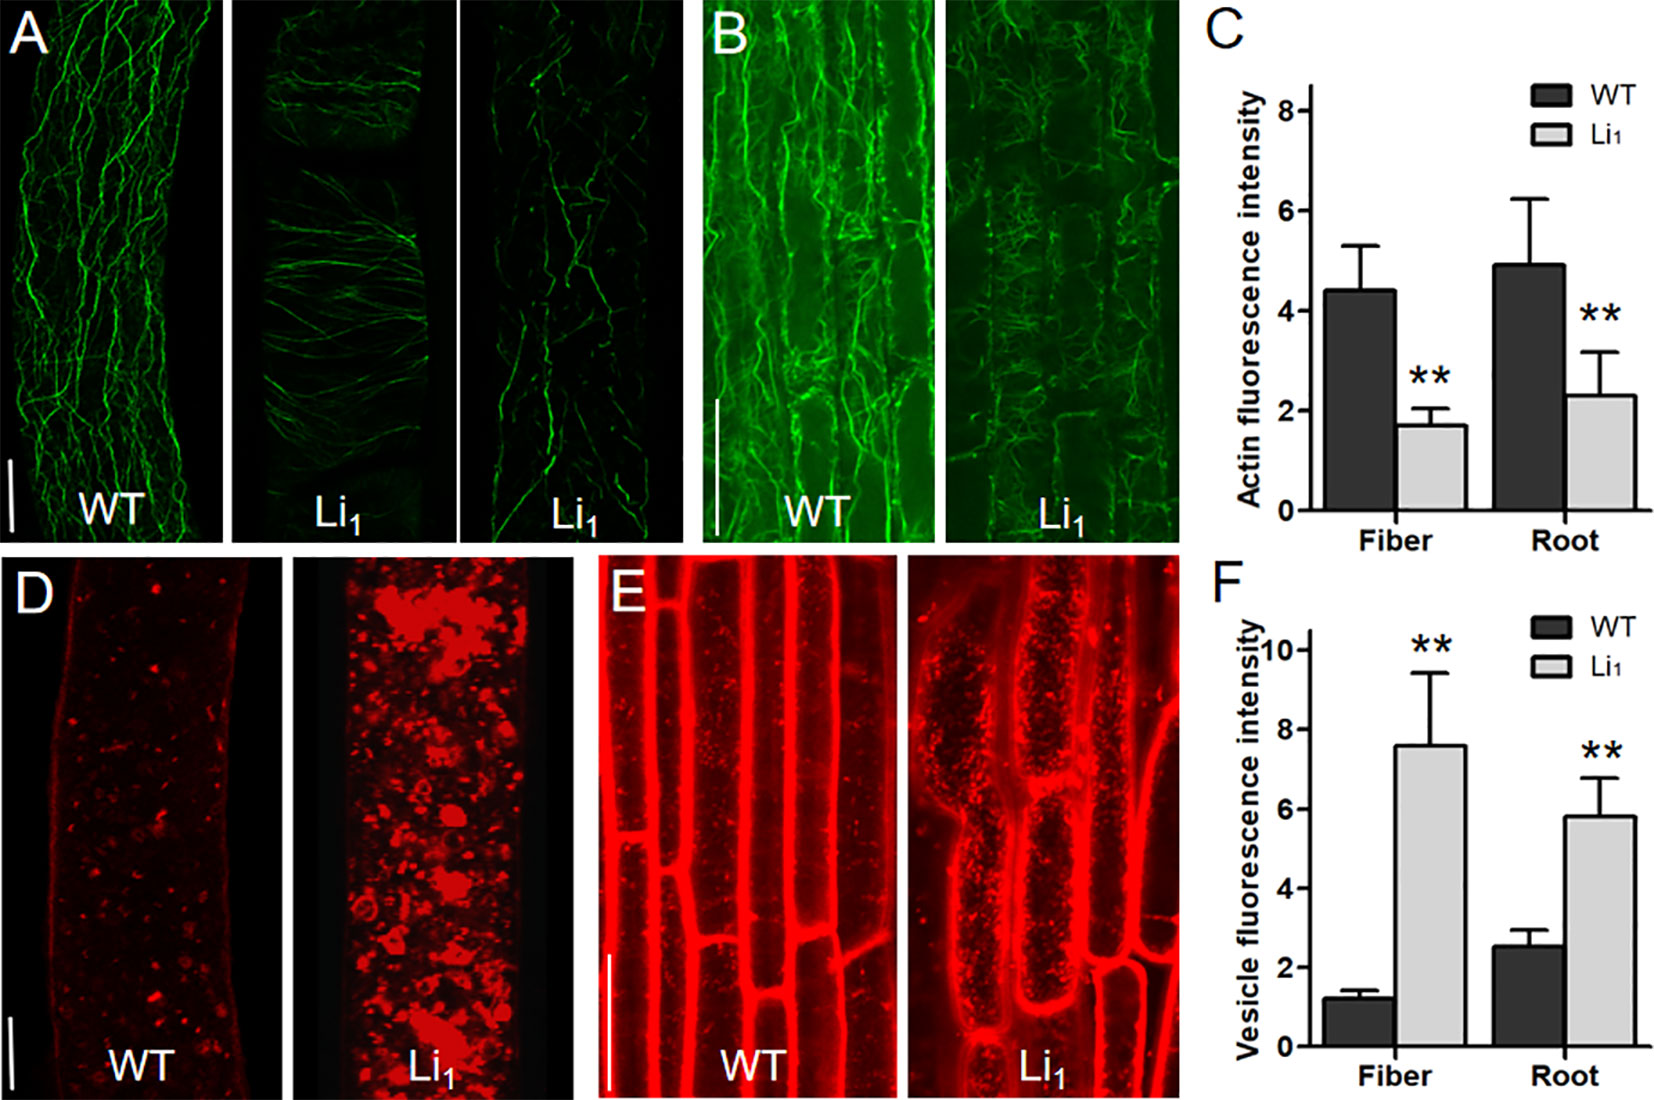
Figure 4 Distribution of F-actin and vesicles in elongating fiber and root cells. (A) F-actin organization in 10 DPA fiber cells of WT and Li1 plants. Bar = 10 µm. (B) F-actin organization in cortical cells from the root elongation zone of WT and Li1 plants. Bar = 100 µm. (C) Determination of the fluorescence intensity representing the amount of F-actin. (D) Vesicle distribution in 10 DPA fiber cells of WT and Li1 plants. Bar = 10 µm. (E) Vesicle distribution in cells from the root elongation zone of WT and Li1 plants. Bar = 100 µm. (F) Determination of the fluorescence intensity representing vesicle abundance. Data in (C, F) represent means ± SD of 60 biological replicates (60 cells), Student’s t-test: **P < 0.01.
The actin cytoskeleton has been found to serve as tracks for intracellular transportation (Gutierrez et al., 2009). To investigate whether the intracellular transportation in the Li1 cells is affected, the distribution of vesicles in elongating fiber and root cells was observed. FM4-64 staining showed that vesicles were distributed evenly in the WT fiber cells; however, massive vesicles aggregated into patches were observed in the Li1 fiber cells (Figure 4D). Similarly, more labeled vesicles were present in the Li1 cells from root elongation zone than that in the WT (Figure 4E). Measurement of the fluorescence intensity showed significantly more vesicles in the Li1 elongating root and fiber cells than in the WT (Figure 4F). These observations suggest that intracellular transportation was disturbed in the Li1 elongating cells.
Changes in the Distribution of the Actin Cytoskeleton, Vesicles, and CSC in Fiber Cells During SCW Biosynthesis
The more thickened SCW and higher cellulose content of Li1 fibers compared to WT fibers (Figures 2G–J) offers an ideal model for investigating the role of the actin cytoskeleton in SCW biosynthesis. We therefore examined whether the distribution of the actin cytoskeleton, vesicles, and CSC were affected in Li1 fiber cells at 20 DPA, when they undergo active SCW biosynthesis. As shown in Supplementary Figure S9A, the F-actin cables in the WT fiber cells became thick and straight; while fewer thick F-actin cables were formed, and those that did were fragmented and randomly arranged in the Li1 fiber cells. As in elongating fibers, vesicles in the Li1 fiber cells were aggregated into patches during SCW biosynthesis, a distribution dramatically different to that in corresponding WT fiber cells (Supplementary Figure S9B). To determine the CSC distribution in the Li1 and WT fibers, the commercial antibody anti-CesA4 was used for immunostaining experiments (Gardiner et al., 2003). As shown in Supplementary Figure S9C, the distribution of CSC was obviously increased in the Li1 fibers in comparison to the WT. Quantitative analysis showed the amount of F-actin was significantly reduced, while the number of vesicles and CSC were significantly increased in the Li1 fiber cells (Supplementary Figure S9D–F). Based on these results, we propose that the disturbed intracellular transportation and excessive distribution of CSC at the PM is the major reasons for the increased content of cellulose and thickened SCW of Li1 fiber cells.
Effects of G65V Substitution on Actin Polymerization
Amino acid substitution in a protein as conserved as actin may dramatically affect its function, thus we investigated the influence of the G65V substitution in GhLi1. An extensive protein sequence alignment showed that the 65G was highly conserved in actin (Supplementary Figure S10 and Supplementary Table S5), indicating that it may be necessary for actin’s basic function. The 65G is located on the surface-exposed region of subdomain 2, also known as a junction among G-actins in an F-actin (Figures 5A–C; Holmes et al., 1990). Simulation of G65V substitution in the F-actin molecule gave rise to a steric hindrance and a hydrogen bond between the 65V in molecule A and the 175H and 288D in molecule C, respectively (Figures 5D, E). Holmes et al. (1990) reported the atomic structure of F-actin and proposed that the hydrophobic “plug-pocket” interaction is essential for F-actin stabilization. According to the structural correspondence between the protein sequences of GhLi1 and the rabbit skeletal muscle actin used in the “Holmes model”, the occurrence of “plug-pocket” interactions in cotton actin can be depicted as shown in Figure 5C. In a normal F-actin, eight residues (positions 42–47, 65, and 66) of molecule A and six residues (positions 168, 171, 173, 175, 287, and 291) of molecule C form a hydrophobic pocket. At the same time, a hydrophobic loop (residues 266–275) of molecule B in the opposing strand generates a hydrophobic plug, which inserts into the hydrophobic pocket to bring about a strong three-bodied G-actin interaction. Moreover, some salt bridges are formed near this interaction zone to stabilize the F-actin structure, including one between the 41R of molecule A and the 288D of molecule C. According to our model, the steric hindrance and hydrogen bond caused by G65V substitution may affect the three-bodied G-actin interaction by changing the structure of the hydrophobic pocket and influencing the formation of the salt bridge, leading to instability of the F-actin.
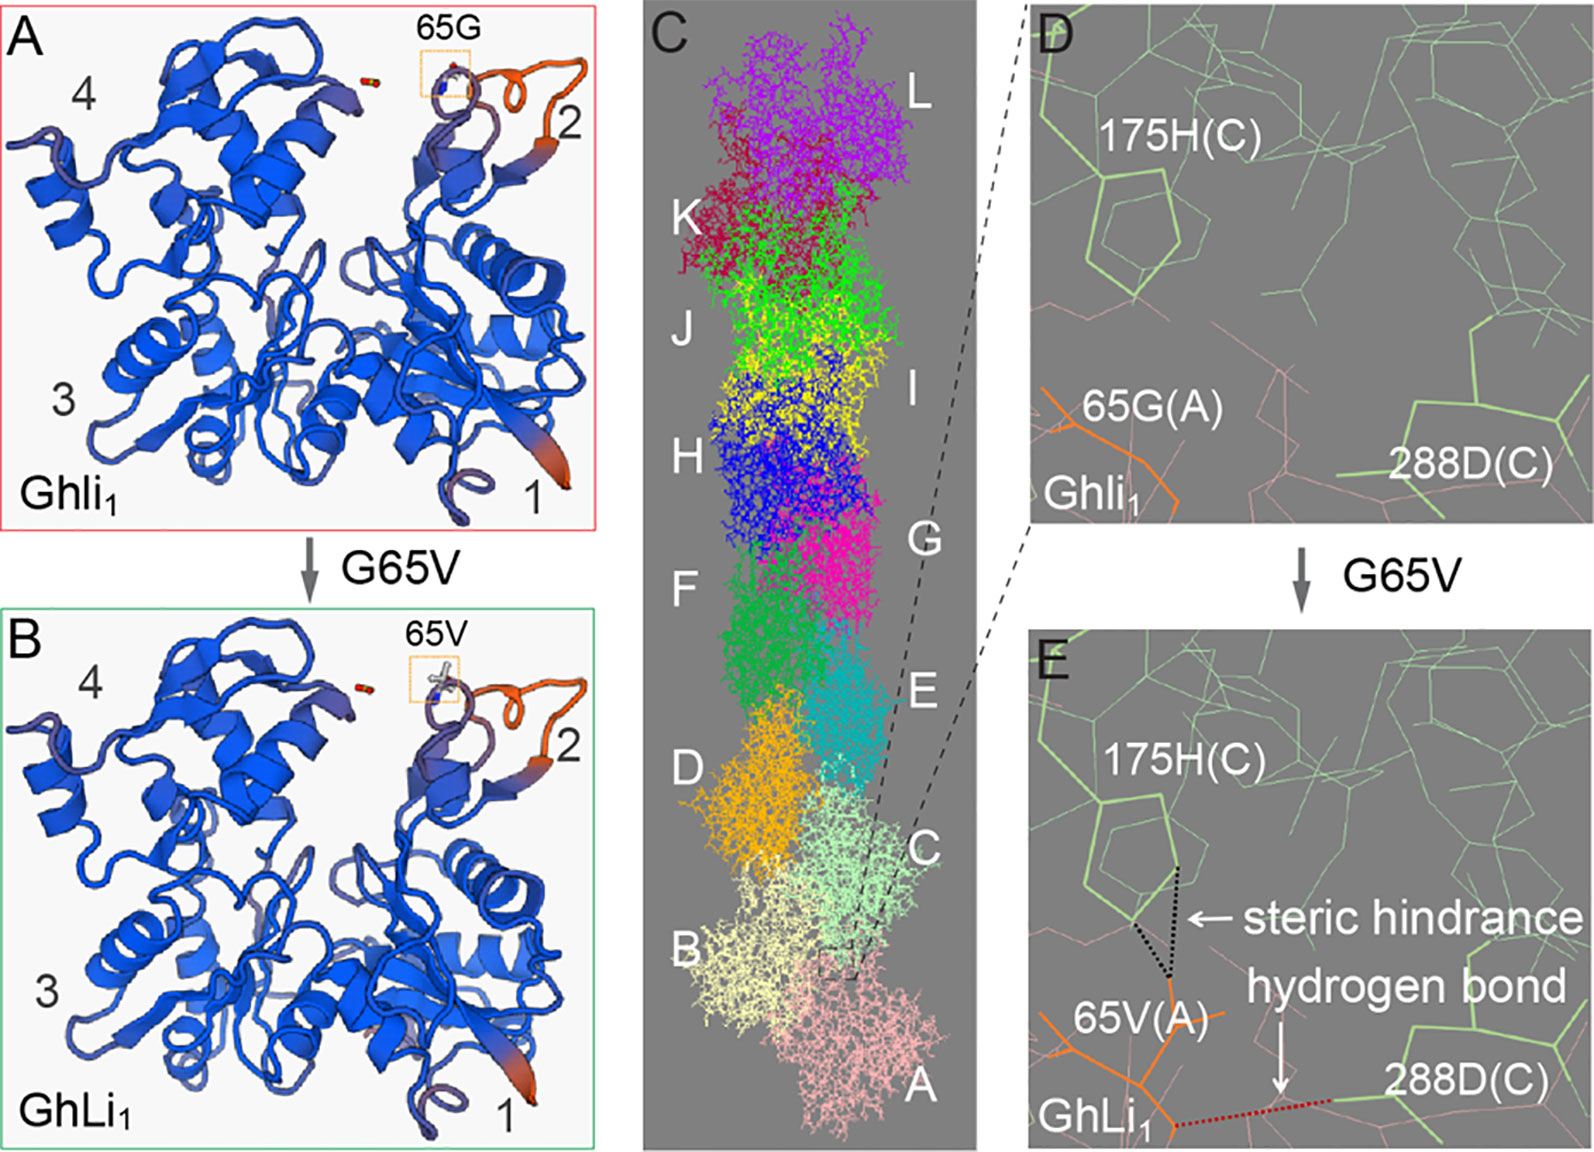
Figure 5 Molecular model prediction of the effect of G65V substitution in GhLi1. (A, B) Monomer structures of Ghli1(A) and GhLi1(B) were produced using SWISS-MODEL software with 3chw.1.A as the template. (C) The structure of an F-actin polymerized by Ghli1 was constructed using 6anu.1.E as the template; different monomer molecules (A–I) are colored distinctly. (D, E) Simulation of G65V substitution in GhLi1 showing that a steric hindrance (indicated by black dotted line) and a H-bond (indicated by red dotted line) emerged between the 65V in molecule A and 175H and 288D in molecule C, respectively. The side chain of 65V in molecule A, and 175H and 288D in molecule C are highlighted in bold.
We next produced 6×His-tag fused GhLi1 and Ghli1 proteins to investigate their functional differences through in vitro biochemical assays (Figure 6A). To generate a new F-actin, three G-actin molecules must interact to create a seed, which is the rate-limiting step during spontaneous F-actin assembly (Pollard and Cooper, 1986). We performed in vitro analysis using the recombinant GhLi1 and Ghli1 proteins to test their nucleation ability. Actin monomers (10% pyrene labeled) from rabbit skeletal muscle were incubated with different concentrations of GhLi1 and Ghli1, and the actin assembly status was monitored by pyrene fluorescence measurement. As shown in Figure 6B and Supplementary Table S6, Ghli1 decreased the initial lag of the actin polymerization curve in a dose-dependent manner, which is indicative of their active roles in actin nucleation (Michelot et al., 2005). In contrast, the initial lag of the actin polymerization curve was increased as the increase of GhLi1 concentration, indicating that GhLi1 disturbs actin nucleation. The final amplitude of pyrene fluorescence, which is directly proportional to the actin filament concentration, was dramatically decreased with the addition of GhLi1, suggesting that actin polymerization was disturbed by this mutated actin.
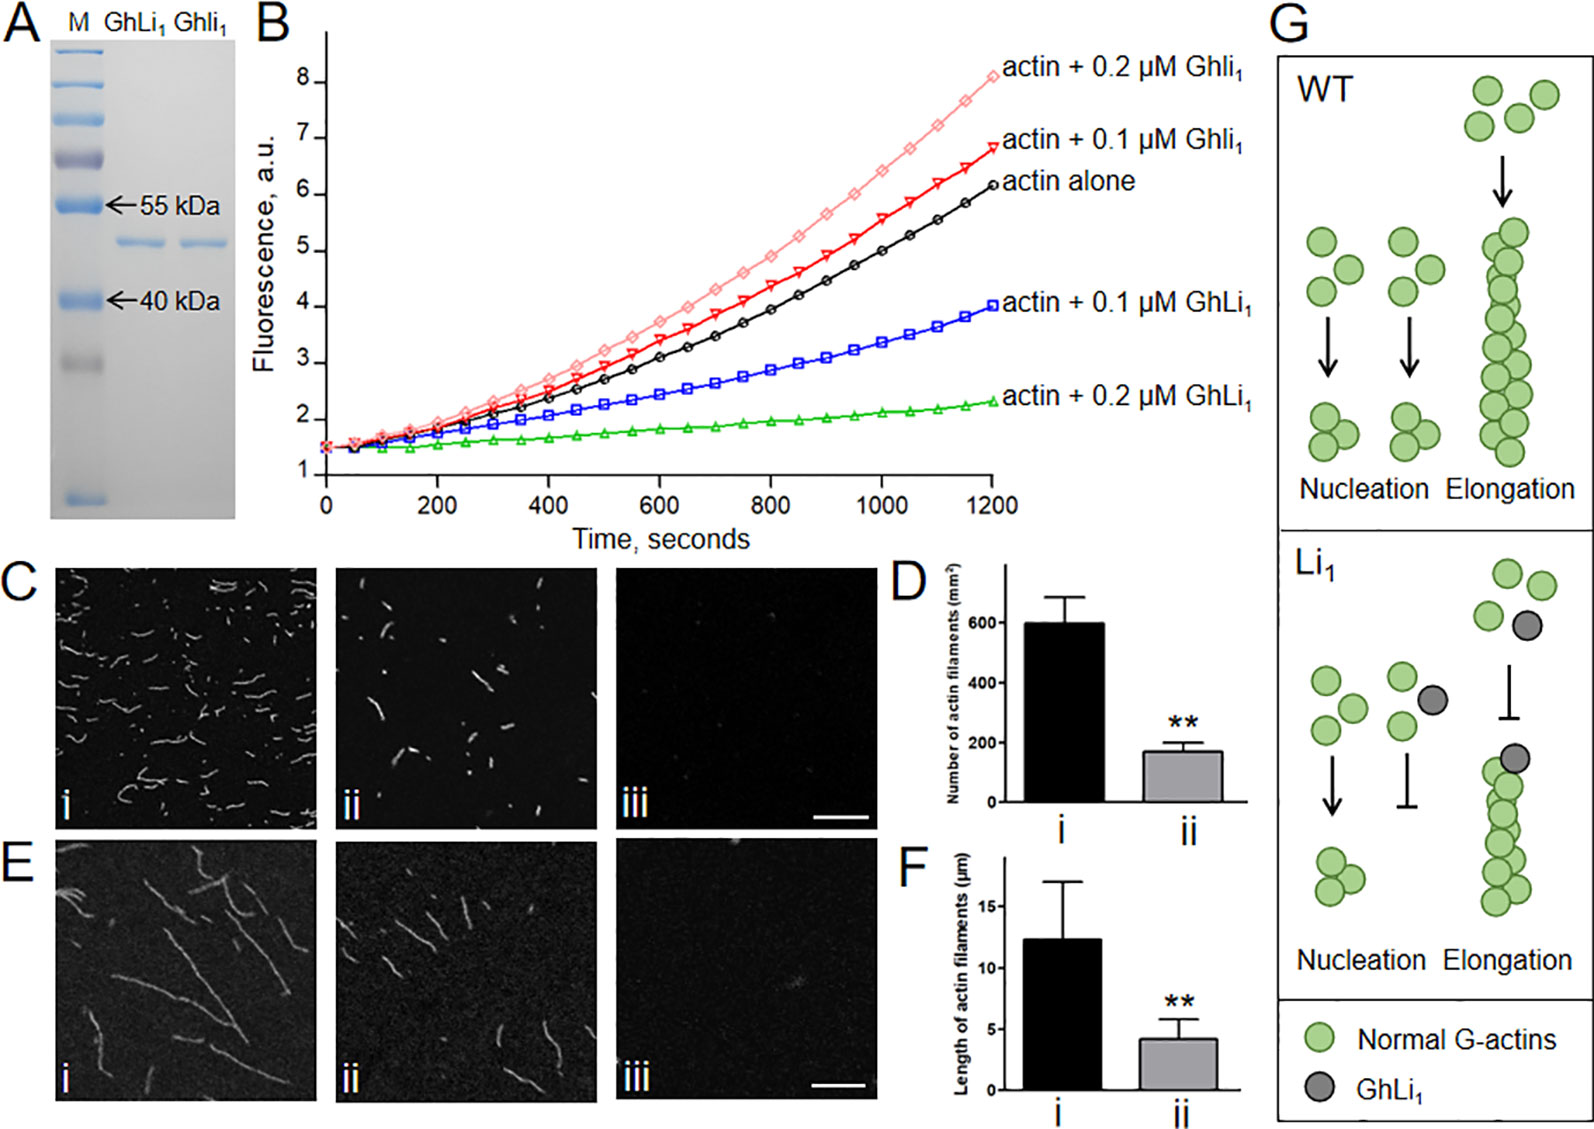
Figure 6 Determination of the polymerization capability of Ghli1 and GhLi1. (A) Purified 6×His tag fused GhLi1 and Ghli1 proteins were analyzed by SDS-PAGE and stained with Coomassie Brilliant BlueR 250. The protein marker (M) was loaded in the left lane. (B) Time course of actin polymerization in the presence of GhLi1 or Ghli1 monitored by pyrene fluorescence. The detailed data represent means, SD, and statistical analysis were listed in Supplementary Table 6. Different concentrations of GhLi1 or Ghli1 were added to 2 µM of 10% pyrene-labeled actin before initiation of polymerization. a.u. absorbance units. (C–F) 2 µM Ghli1 (i), mixture of 2 µM Ghli1 and 0.2 µM GhLi1 (ii) and 2 µM GhLi1 (iii) were polymerized in 1×KMEI buffer for 5 or 20 min, and visualized under fluorescence microscopy. After 5-min polymerization, actin filaments were observed (C) and the number of actin filaments per 1 mm2 of the visual field was calculated (D). After 20-min polymerization, actin filaments were observed (E) and the mean length of actin filaments were determined (F). Bars = 10 µm. Data in (D, F) represent the means ± SD of three biological replicates, Student’s t-test: **P < 0.01. (G) Proposed model for interpreting the effects of GhLi1 in F-actin dynamics. In WT, G-actins nucleate and elongate to bring about long F-actins; whereas in Li1, the existence of GhLi1 could disrupt F-actin assembly by inhibiting nucleation and elongation.
To further investigate the polymerization capability of the recombinant GhLi1 and Ghli1 proteins, we observed actin filaments under fluorescence microscope. After 5-min polymerization, Ghli1 produced a large number of short actin filaments, whereas there were significantly fewer actin filaments produced from the mixture of Ghli1 and GhLi1, and GhLi1 alone did not produce any actin filaments under the same conditions (Figures 6C, D). After 20-min polymerization, Ghli1 produced long actin filaments, whereas actin filaments from the mixture of Ghli1 and GhLi1 were significantly shorter, and no actin filaments were produced by GhLi1 (Figures 6E, F). These results further confirm that GhLi1 disturbs nucleation and elongation of F-actin. Thus, it is fully reasonable to infer that the polymerization status in tissues with GhLi1 expression in the Li1 differs to that in the WT. We propose that, in the Li1 cells, GhLi1 could partake in, but disturbed, actin’s physical interactions (Figure 6G). When GhLi1 was involved in nucleation, normal seeds could not be formed. When GhLi1 was added onto the elongating end of an F-actin molecule by chance, it inhibited further polymerization by creating a “dead end”.
Discussion
The actin cytoskeleton plays important roles in almost all cellular processes (Staiger et al., 2000; Blanchoin et al., 2010). Mutations in actin cause a range of malformed morphologies due to specific molecular changes that often disturb cytoskeleton functions (Feng and Marston, 2009; Kato et al., 2010). In this study, we report the isolation and characterization of GhLi1, which encodes a mutated actin with a G65V substitution in its gene product, from the Li1 mutants. Our results demonstrate that GhLi1 disorders actin cytoskeleton organization and intracellular transportation, and consequently alters the morphogenesis of cotton plants and cells.
The Actin Cytoskeleton Plays Crucial Roles in Cell Elongation and the SCW Biosynthesis in Cotton
Actin cytoskeleton has been reported to essential for plant morphology. Previous studies had showed that disorganized actin cytoskeleton caused by pharmacological perturbation, mutation, or misexpression of actin and actin cytoskeleton-associated genes inhibited cell growth and altered the plant architecture (Kato et al., 2010; Wu et al., 2015). Cotton is a mainstay of the global economy and is prized for its excellent natural fiber properties. In this study, we showed that the dominant mutated actin gene GhLi1 disorganized actin cytoskeleton, disrupts proper cell elongation, and resulted in various twisted organs. Thus, this report establishes that the mutation of a single actin can cause dramatic morphogenetic defects in cotton. Many studies have found that the actin cytoskeleton regulates cotton fiber development. Reduction in F-actin abundance inhibits fiber elongation (Seagull, 1990; Li et al., 2005), while thicker and more abundant F-actin cables promote fiber length and strength (Wang et al., 2009; Wang et al., 2010; Zhang et al., 2017). In this study, we found that the F-actin cables in Li1 were disorganized and fragmented (Figure 4 and Supplementary Figure S9), which resulted in shortened and thickened fiber cells (Figure 2). Our findings provide solid genetic evidence of the pivotal roles of the actin cytoskeleton in regulating cotton fiber development.
During cell growth, vesicles containing cell wall matrix materials are delivered to expansion sites and fuse with the PM to deposit their contents to the cell wall (Ketelaar et al., 2003). Previous studies proposed that longitudinally oriented actin cables were the primary tracks for organelle movement (Gutierrez et al., 2009; Kato et al., 2010; Akkerman et al., 2012). During the fast elongation stage, cotton fibers undergo enormous polar growth, while massive cellulose molecules are synthesized during SCW deposition stage (Haigler et al., 2012). Thus, active cellular transport must take place in fiber cells during these development stages. It is conceivable that the reduction in longitudinal actin cables in the Li1 cells leads to abnormal vesicle transportation. Indeed, our cytological observations showed that vesicles were aggregated into patches, and more CSCs were inserted into the PM of Li1 cells than that of WT, which inhibited cell elongation and caused excessive cellulose deposition (Figure 4 and Supplementary Figure S9). Based on these results, we hypotheses that F-actin may acts as a track for vesicle movement thus regulating elongation and SCW deposition in fiber cells.
G65V Substitution in Actin Disturbs F-Actin Assembly
Actin is one of the most ancient proteins that is essential for the survival of eukaryotes. In accordance with actin’s high evolutionary conservation, most amino acid residues are critical for actin’s function. Over the past few decades, hundreds of actin mutants, responsible for various morphological changes, have been identified in both uni- and multi-cellular organisms (Ishiguro and Kobayashi, 1996; Feng and Marston, 2009; Kato et al., 2010). Actin mutants in human are the most thoroughly studied because they are causal for genetic diseases (Pierick et al., 2014; Marston, 2018). At the molecular level, these mutated actins were unable to fold properly to form functional actin, were incapable of polymerization, or had changes in their ability to interact with ABPs (Costa et al., 2004; Feng and Marston, 2009). With the availability of abundant information for actin mutants, a framework for genotype-phenotype correlation could be built and used for molecular diagnosis of human diseases (Marston, 2018), and also probably for the characterization of abnormal developments of animals and plants in view of the functional conservation of actin cytoskeleton. Prediction on the possible effects of each mutation based on its structural location and our knowledge of actin structure-function relationships is an efficient approach in understanding of their molecular mechanisms.
According to the Holmes model, the hydrophobic “plug-pocket” structure constitutes a three-bodied interaction that is essential for F-actin stability (Holmes et al., 1990). Many amino acid substitutions in, or near, this region exhibit different effects, for example I64N, T66I, G268C, D286G, and D291V in human skeletal actin ACTA1 exhibited reduced or completely lost polymerization capability, and resulted in various congenital myopathies (Feng and Marston, 2009). G273D in yeast actin ACT1 give rise to abnormal cell growth, probably because the amino acid substitution affects the hydrophobic “plug-pocket” interaction (Ishiguro and Kobayashi, 1996), and similar structural changes were proposed in E272K in Arabidopsis ACT8 (Kato et al., 2010). Position 65 in GhLi1, which is structurally identical to position 63 in the rabbit actin used by Holmes et al. (1990), participates in the hydrophobic “pocket” formation. Mutation in this position is novel and different from previously reported actin mutants. According to our model, the steric hindrance and hydrogen bond caused by G65V substitution may affect the three-bodied interaction by changing the hydrophobic pocket structure and influencing the formation of the salt bridge, which could be unfavorable for F-actin assembly (Figure 5; Holmes et al., 1990). Our biochemical assays demonstrated that GhLi1 was completely lost polymerization capability. In addition, it also inhibited nucleation and elongation activities normally occurred in F-actin assembly process (Figure 6). Thus, G65V substitution may converts GhLi1 from a normal linker to a “disturbing or capping protein”. Our results are in agreement with previous studies on actin mutants, and provide a new genotype-phenotype example of deciphering the process of abnormal development in plants. This model may also be useful for other eukaryotes.
Data Availability Statement
The datasets generated for this study are available on request to the corresponding author.
Author Contributions
TZ conceptualized the research program. TZ and YH designed the experiments and coordinated the project. YS, WL, WS, HF, and ZS conducted map-based cloning and functional analysis of the Li1 gene. YS and JC developed the molecular markers. YS, YH, and TZ analyzed all of the data and wrote the paper.
Funding
This study was financially supported in part by grants from the National Research and Development Project of Transgenic Crops of China (2015ZX08009-003) to YH, the earmarked fund for the China Agriculture Research System, and the Distinguished Discipline Support Program of Zhejiang University to TZ.
Conflict of Interest
The authors declare that the research was conducted in the absence of any commercial or financial relationships that could be construed as a potential conflict of interest.
Supplementary Material
The Supplementary Material for this article can be found online at: https://www.frontiersin.org/articles/10.3389/fpls.2019.01486/full#supplementary-material
References
Akkerman, M., Overdijk, E. J., Schel, J. H., Emons, A. M., Ketelaar, T. (2012). Golgi body motility in the plant cell cortex correlates with actin cytoskeleton organization. Plant Cell Physiol. 52, 1844–1855. doi: 10.1093/pcp/pcr122
Bao, Y., Hu, G. J., Flagel, L. E., Salmon, A., Bezanilla, M., Paterson, A. H., et al. (2011). Parallel up-regulation of the profilin gene family following independent domestication of diploid and allopolyploid cotton (Gossypium). Proc. Natl. Acad. Sci. U. S. A. 108, 21152–21157. doi: 10.1073/pnas.1115926109
Baulcombe, D. C. (1999). Fast forward genetics based on virus induced gene silencing. Curr. Opin. Cell Biol. 2, 109–113. doi: 10.1016/S1369-5266(99)80022-3
Blanchoin, L., Boujemaa-Paterski, R., Henty, J. L., Khurana, P., Staiger, C. (2010). Actin dynamics in plant cells: a team effort from multiple proteins orchestrates this very fast-paced game. Curr. Opin. Cell Biol. 13, 714–723. doi: 10.1016/j.pbi.2010.09.013
Bryan, K. E., Wen, K. K., Zhu, M., Rendtorff, N. D., Feldkamp, M., Tranebjaerg, L., et al. (2006). Effects of human deafness gamma-actin mutations (DFNA20/26) on actin function. J. Biol. Chem. 281, 20129–20139. doi: 10.1074/jbc.M601514200
Burch-Smith, T. M., Anderson, J. C., Martin, G. B., Dinesh-Kumar, S. P. (2004). Applications and advantages of virus-induced gene silencing for gene function studies in plants. Plant J. 39, 734–746. doi: 10.1111/j.1365-313x.2004.02158.x
Chang, L., Fang, L., Zhu, Y. J., Wu, H. T., Zhang, Z. Y., Liu, C. X., et al. (2016). Insights into interspecific hybridization events in allotetraploid cotton formation from characterization of a gene regulating leaf shape. Genetics 204, 799–806. doi: 10.1534/genetics.116.193086
Chen, C. Y., Wong, E. I., Vidali, L., Estavillo, A., Helper, P. K., Wu, H. M., et al. (2002). The regulation of actin organization by actin-depolymerizing factor in elongating pollen tubes. Plant Cell 14, 2175–2190. doi: 10.1105/tpc.003038
Chen, N. Z., Qu, X. L., Wu, Y. J., Huang, S. J. (2009). Regulation of actin dynamics in pollen tubes: control of actin polymer level. J. Integer. Plant Biol. 51, 740–750. doi: 10.1111/j.1744-7909.2009.00850.x
Costa, C. F., Rommelaere, H., Waterschoot, D., Sethi, K. K., Nowak, K. J., Laing, N. G., et al. (2004). Myopathy mutations in alpha-skeletal-muscle actin cause a range of molecular defects. J. Cell Sci. 117, 3367–3377. doi: 10.1242/jcs.01172
Deng, W. K., Wang, Y. B., Liu, Z. X., Cheng, H., Xue, Y. (2014). HemI: a toolkit for illustrating heatmaps. PloS One 9, e111988–111993. doi: 10.1371/journal.pone.0111988
Emons, A. M. C., Ketelaar, T. (2009). Intracellular organization: a prerequisite for root hair elongation and cell wall deposition. Root Hairs, (Berlin, Heidelberg, New York: Springer), 12, 69–86. doi: 10.1007/7089_2008_4
Fantini, E., Falcone, G., Frusciante, S., Giliberto, L., Giuliano, G. (2013). Dissection of tomato lycopene biosynthesis through virus-induced gene silencing. Plant Physiol. 163, 986–998. doi: 10.1104/pp.113.224733
Feng, J. J., Marston, S. (2009). Genotype-phenotype correlations in ACTA1 mutations that cause congenital myopathies. Neuromuscul. Disord. 19, 6–16. doi: 10.1016/j.nmd.2008.09.005
Gao, X. Q., Wheeler, T., Li, Z. H., Kenerley, C. M., He, P., Shan, L. B. (2011). Silencing GhNDR1 and GhMKK2 compromises cotton resistance to Verticillium wilt. Plant J. 66, 293–305. doi: 10.1111/j.1365-313X.2011.04491.x
Gardiner, J. C., Taylor, N. G., Turner, S. R. (2003). Control of cellulose synthase complex localization in developing xylem. Plant Cell 15, 1740–1748. doi: 10.1105/tpc.012815
Gilbert, M. K., Turley, R. B., Kim, H. J., Li, P., Thyssen, G., Tang, Y. H., et al. (2013). Transcript profiling by microarray and marker analysis of the short cotton (Gossypium hirsutum L.) fiber mutant Ligon lintless-1 (Li1). BMC Genomics 14, 403–403. doi: 10.1186/1471-2164-14-403
Gilliland, L. U., Mckinney, E. C., Asmussen, M. A., Meagher, R. B. (1998). Detection of deleterious genotypes in multigenerational studies. I. Disruptions in individual Arabidopsis actin genes. Genetics 149, 717–725. doi: 10.1017/S0016672398003267
Griffee, F., Ligon, L. L. (1929). Occurrence of lintless cotton plants and the inheritance of the character lintless. J. Am. Soc Agron. 21, 711–717. doi: 10.2134/agronj1929.00021962002100070001x
Guex, N., Peitsch, M. C., Schwede, T. (2009). Automated comparative protein structure modeling with SWISS-MODEL and Swiss-PdbViewer: a historical perspective. Electrophoresis 30, 162–173. doi: 10.1002/elps.200900140
Gutierrez, R., Lindeboom, J. J., Paredez, A. R., Emons, A. M., Ehrhardt, D. W. (2009). Arabidopsis cortical microtubules position cellulose synthase delivery to the plasma membrane and interact with cellulose synthase trafficking compartments. Nat. Cell Biol. 11, 797–806. doi: 10.1038/ncb1886
Haigler, C. H., Lissete, B., Stiff, M. R., Tuttle, J. R. (2012). Cotton fiber: a powerful single-cell model for cell wall and cellulose research. Front. Plant Sci. 3, 104–110. doi: 10.3389/fpls.2012.00104
Han, L. B., Li, Y. B., Wang, H. Y., Wu, X. M., Li, C. L., Luo, M., et al. (2013). The dual functions of WLIM1a in cell elongation and secondary wall formation in developing cotton fibers. Plant Cell 25, 4421–4438. doi: 10.1105/tpc.113.116970
Holmes, K. C., Popp, D., Gebhard, W., Kabsch, W. (1990). Atomic model of the actin filament. Nature 347, 44–49. doi: 10.1038/347044a0
Holzberg, S., Brosio, P., Gross, C., Pogue, G. P. (2002). Barley stripe mosaic virus-induced gene silencing in a monocot plant. Plant J. 30, 315–327. doi: 10.1046/j.1365-313X.2002.01291.x
Huang, X. Z., Qian, Q., Liu, Z. B., Sun, H. Y., He, S. Y., Luo, D., et al. (2009). Natural variation at the DEP1 locus enhances grain yield in rice. Nat. Genet. 41, 494–497. doi: 10.1038/ng.352
Hussey, P. J., Ketelaar, T., Deeks, M. J. (2006). Control of the actin cytoskeleton in plant cell growth. Annu. Rev. Plant Biol. 57, 109–125. doi: 10.1146/annurev.arplant.57.032905.105206
Ishiguro, J., Kobayashi, W. (1996). An actin point-mutation neighboring the ‘hydrophobic plug’ causes defects in the maintenance of cell polarity and septum organization in the fission yeast Schizosaccharomyces pombe. FEBS Lett. 392, 237–241. doi: 10.1016/0014-5793(96)00819-8
Jiang, Y. R., Ding, M. Q., Cao, Y. F., Yang, F., Zhang, H., He, S. E., et al. (2015). Genetic fine mapping and candidate gene analysis of the Gossypium hirsutum Ligon lintless-1 (Li1) mutant on chromosome 22(D). Mol. Genet. Genomics 290, 2199–2211. doi: 10.1007/s00438-015-1070-2
Jiao, Y. Q., Wang, Y. H., Xue, D. W., Wang, J., Yan, M. X., Liu, G. F., et al.(2010). Regulation of OsSPL14 by OsmiR156 defines ideal plant architecture in rice. Nat. Genet. 42, 541–544. doi: 10.1038/ng.591
Kandoth, P. K., Ranf, S., Pancholi, S. S., Jayanty, S., Walla, M. D., Miller, W., et al. (2007). Tomato MAPKs LeMPK1, LeMPK2, and LeMPK3 function in the systemin-mediated defense response against herbivorous insects. Proc. Natl. Acad. Sci. U. S. A. 104, 12205–12210. doi: 10.1073/pnas.0700344104
Karaca, M., Saha, S., Jenkins, J. N., Zipf, A., Kohel, R., Stelly, D. M. (2002). Simple sequence repeat (SSR) markers linked to the Ligon lintless (Li1) mutant in cotton. J. Hered. 93, 221–224. doi: 10.1093/jhered/93.3.221
Kato, T., Morita, M. T., Tasaka, M. (2010). Defects in dynamics and functions of actin filament in Arabidopsis caused by the dominant-negative actin fiz1-induced fragmentation of actin filament. Plant Cell Physiol. 51, 333–338. doi: 10.1093/pcp/pcp189
Ketelaar, T., Ruijter, N. C., Emons, A. M. (2003). Unstable F-Actin specifies the area and microtubule direction of cell expansion in Arabidopsis root hairs. Plant Cell 15, 285–292. doi: 10.1105/tpc.007039
Kohel, R. J. (1972). Linkage tests in upland cotton, Gossypium hirsutum L. II. Crop Sci. 5, 66–69. doi: 10.2135/cropsci1965.0011183X000500060029x
Kumar, S. (2014). RNAi (RNA Interference) vectors for functional genomics study in plants. Natl. Acad. Sci. Lett. 37, 289–294. doi: 10.1007/s40009-014-0234-7
Larkin, M. A., Blackshields, G., Brown, N. P., Chenna, R., McGettigan, P. A., McWilliam, H., et al. (2007). Clustal W and Clustal X version 2.0 . Bioinformatics 23, 2947–2948. doi: 10.1093/bioinformatics/btm404
Li, X. B., Fan, X. P., Wang, X. L., Cai, L., Yang, W. C. (2005). The cotton ACTIN1 gene is functionally expressed in fibers and participates in fiber elongation. Plant Cell 17, 859–875. doi: 10.1105/tpc.104.029629
Li, Y., Jiang, J., Li, L., Wang, X. L., Wang, N. N., Li, D. D., et al. (2013). A cotton LIM domain-containing protein (GhWLIM5) is involved in bundling actin filaments. Plant Physiol. Biochem. 66, 34–40. doi: 10.1016/j.plaphy.2013.01.018
Li, G., Liang, W. Q., Zhang, X. Q., Ren, H. Y., Hu, J. P., Bennett, M. J., et al. (2014). Rice actin-binding protein RMD is a key link in the auxin-actin regulatory loop that controls cell growth. Proc. Natl. Acad. Sci. U. S. A. 111, 10377–10382. doi: 10.1073/pnas.1401680111
Li, X. M., Chao, D. Y., Wu, Y., Huang, X. H., Chen, K., Cui, L. G., et al. (2015). Natural alleles of a proteasome α2 subunit gene contribute to thermotolerance and adaptation of African rice. Nat. Genet. 47, 827–833. doi: 10.1038/ng.3305
Li, Y., Wang, N. N., Wang, Y., Liu, D., Gao, Y., Li, L., et al. (2018). The cotton XLIM protein (GhXLIM6) is required for fiber development via maintaining dynamic F-actin cytoskeleton and modulating cellulose biosynthesis. Plant J. 96, 1269–1282. doi: 10.1111/tpj.14108
Liang, W., Fang, L., Xiang, D., Hu, Y., Feng, H., Chang, L. J., et al. (2015). Transcriptome analysis of short fiber mutant Ligon lintless-1 (Li1) reveals critical genes and key pathways in cotton fiber elongation and leaf development. PloS One 10, e0143503–0143521. doi: 10.1371/journal.pone.0143503
Liang, W.(2015). Fine-mapping of short fiber mutant gene Li1 and transcriptome analysis of Ligon lintless-1 (Li1) mutant in Upland cotton. Nanjing: Doctoral dissertation of Nanjing Agriculture University (in Chinese with English abstract).
Liu, F. J., Liang, W. H., Zhang, T. Z. (2010). Genetic analysis of homozygous-dominant-surviving Ligon lintless recombinants in cotton (Gossypium hirsutum L.). Acta Agron. Sin. 36, 2020–2027. doi: 10.1016/s1875-2780(09)60086-9
Liu, X., Zhao, B., Zheng, H. J., Hu, Y., Lu, G., Yang, C. Q., et al. (2015). Gossypium barbadense genome sequence provides insight into the evolution of extra-long staple fiber and specialized metabolites. Sci. Rep. 5 (1), 14139–14152. doi: 10.1038/srep14139
Marston, S. (2018). The molecular mechanisms of mutations in actin and myosin that cause inherited myopathy. Int. J. Mol. Sci. 19, 2020–2037. doi: 10.3390/ijms19072020
Mathur, J., Martin, H. (2002). Microtubules and microfilaments in cell morphogenesis in higher plants. Curr. Biol. 12, 669–676. doi: 10.1016/s0960-9822(02)01164-8
McDowell, J. M., Huang, S. R., Mckinney, E. C., An, Y. Q., Meagher, R. B. (1996). Structure and evolution of the actin gene family in Arabidopsis thaliana. Genetics 142, 587–602. doi: 10.1073/pnas.79.2.495
Meagher, R. B., Mckinney, E. C., Kandasamy, M. K. (1999). Isovariant dynamics expand and buffer the responses of complex systems: The diverse plant actin gene family. Plant Cell 11, 995–1005. doi: 10.2307/3870793
Michelot, A., Guérin, C., Huang, S. J., Ingouff, M., Richard, S., Rodiuc, N., et al. (2005). The formin homology 1 domain modulates the actin nucleation and bundling activity of Arabidopsis FORMIN1 . Plant Cell 17, 2296–2313. doi: 10.1111/j.1465-7295.2008.00159.x
Miller, D. D., Ruijter, N. C., Bisseling, T., Emons, A. M. (1999). The role of actin in root hair morphogenesis: studies with lipochito-oligosaccharide as a growth stimulator and cytochalasin as an actin perturbing drug. Plant J. 17, 141–154. doi: 10.1046/j.1365-313X.1999.00358.x
Morin, M., Bryanm, K. E., Mayo, F., Goodyear, R., Mencia, A., Modamino, S., et al. (2009). In vivo and in vitro effects of two novel gamma-actin (ACTG1) mutations that cause DFNA20/26 hearing impairment. Hum. Mol. Genet. 18, 3075–3089. doi: 10.1093/hmg/ddp249
Nishimura, T., Yokota, E., Wada, T., Shimmen, T., Okada, K. (2003). An Arabidopsis ACT2 dominant-negative mutation, which disturbs F-actin polymerization, reveals its distinctive function in root development. Plant Cell Physiol. 44, 1131–1140. doi: 10.1093/pcp/pcg158
Paterson, A. H., Wendel, J. F., Gundlach, H., Guo, H., Jenkins, J., Jin, D. C., et al. (2012). Repeated polyploidization of Gossypium genomes and the evolution of spinnable cotton fibres. Nature 492, 423–427. doi: 10.1038/nature11798
Pei, W. K., Du, F., Zhang, Y., He, T., Ren, H. Y. (2012). Control of the actin cytoskeleton in root hair development. Plant Sci. 187, 10–18. doi: 10.1016/j.plantsci.2012.01.008
Pierick, A. R., Mckane, M., Wen, K. K., Bartlett, H. L. (2014). Aip1p dynamics are altered by the R256H mutation in actin. Jove-J Vis Exp. 89, e51551–e51557. doi: 10.3791/51551
Pollard, T. D., Cooper, J. A. (1986). Actin and actin-binding proteins. A critical evaluation of mechanisms and functions. Annu. Rev. Biochem. 55, 987–1035. doi: 10.1146/annurev.bi.55.070186.005011
Ramachandran, S., Christensen, H. E. M., Ishimaru, Y., Dong, C. H., Wen, C. M., Cleary, A. L., et al. (2000). Profilin plays a role in cell elongation, cell shape maintenance, and flowering in Arabidopsis. Plant Physiol. 124, 1637–1647. doi: 10.1104/pp.124.4.1637
Ringli, C., Baumberger, N., Diet, A., Frey, A., Keller, B. (2002). ACTIN2 is essential for bulge site selection and tip growth during root hair development of Arabidopsis. Plant Physiol. 129, 1464–1472. doi: 10.1002/pssb.2221880214
Rong, J. K., Pierce, G. J., Waghmare, V. N., Rogers, C., Desai, A., Chee, P. W., et al. (2005). Genetic mapping and comparative analysis of seven mutants related to seed fber development in cotton. Theor. Appl. Genet. 111, 1137–1146. doi: 10.1007/s00122-005-0041-0
Schubert, A. M., Benedict, C. R., Berlin, J. D., Kohel, R. J. (1973). Cotton fiber development-kinetics of cell elongation and secondary wall thickening. Crop Sci. 13, 704–709. doi: 10.2135/cropsci1973.0011183X001300060035x
Seagull, R. W. (1990). The effects of microtubule and microfilament disrupting agents on cytoskeletal arrays and wall deposition in developing cotton fibers. Protoplasma 159, 44–59. doi: 10.1007/bf01326634
Senthilkumar, M., Mysore, K. S. (2011). Caveat of RNAi in plants: The off-target effect. Methods Mol. Biol. 744, 13–25. doi: 10.1007/978-1-61779-123-9_2
Si, Z., Liu, H., Zhu, J. K., Chen, J. D., Wang, Q., Fang, L., et al. (2018). Mutation of SELF-PRUNING homologs in cotton promotes short-branching plant architecture. J. Exp. Bot. 69, 2543–2553. doi: 10.1093/jxb/ery093
Šlajcherová, K., Fišerová, J., Fischer, L., Schwarzerová, K. (2012). Multiple actin isotypes in plants: diverse genes for diverse roles?. Front. Plant Sci. 3, 226–234. doi: 10.3389/fpls.2012.00226
Staiger, C. J., Baluška, F., Volkmann, D., Barlow, P. W. (2000).Actin: a dynamic framework for multiple plant cell functions. Dordrecht, The Netherlands: Kluwer Academic Publishers. doi: 10.1007/978-94-015-9460-8
Szymanski, D. B., Marks, M. D., Wick, S. M. (1999). Organized F-actin is essential for normal trichome morphogenesis in Arabidopsis. Plant Cell 11, 2331–2347. doi: 10.2307/3870959
Tang, J. Y., Zhu, X. D., Wang, Y. Q., Liu, L. C., Xu, B., Li, F., et al. (2011). Semi-dominant mutations in the CC-NB-LRR-type R gene, NLS1, lead to constitutive activation of defense responses in rice. Plant J. 66, 996–1007. doi: 10.1111/j.1365-313X.2011.04557.x
Teal, D. J., Dawson, J. F. (2007). Yeast actin with a subdomain 4 mutation (A204C) exhibits increased pointed-end critical concentration. Biochem. Cell Biol. 85, 319–325. doi: 10.1016/S0378-7796(03)00022-1
Thyssen, G. N., Fang, D. D., Turley, R. B., Florane, C., Li, P., Naoumkina, M. (2015). Mapping-by-sequencing of Ligon-lintless-1 (Li1) reveals a cluster of neighboring genes with correlated expression in developing fibers of Upland cotton (Gossypium hirsutum L.). Theor. Appl. Genet. 128, 1703–1712. doi: 10.1007/s00122-015-2539-4
Thyssen, G. N., Fang, D. D., Turley, R. B., Florane, C. B., Li, P., Mattison, C. P., et al. (2017). A Gly65Val substitution in an actin, GhACT_LI1, disrupts cell polarity and F-actin organization resulting in dwarf, lintless cotton plants. Plant J. 90, 111–121. doi: 10.1111/tpj.13477
Trapnell, C., Roberts, A., Goff, L., Pertea, G., Kim, D., Kelley, D. R., et al. (2012). Differential gene and transcript expression analysis of RNA-seq experiments with TopHat and Cufflinks. Nat. Protoc. 7, 562–578. doi: 10.1038/nprot.2012.016
Wang, H. Y., Yu, Y., Chen, Z. L., Xia, G. X. (2005). Functional characterization of Gossypium hirsutum profilin 1 gene (GhPFN1) in tobacco suspension cells: Characterization of in vivo functions of a cotton profilin gene. Planta 222, 594–603. doi: 10.1007/s00425-005-0005-2
Wang, X. H., Teng, Y., Wang, Q. L., Li, X. J., Sheng, X. Y., Zheng, M. Z., et al. (2006). Imaging of dynamic secretory vesicles in living pollen tubes of Picea meyeri using evanescent wave microscopy. Plant Physiol. 141, 1591–1603. doi: 10.1104/pp.106.080168
Wang, H. Y., Wang, J., Gao, P., Jiao, G. L., Zhao, P. M., Li, Y., et al. (2009). Down-regulation of GhADF1 gene expression affects cotton fibre properties. Plant Biotechnol. J. 7, 13–23. doi: 10.1111/j.1467-7652.2008.00367.x
Wang, J., Wang, H. Y., Zhao, P. M., Han, L. B., Jiao, G. L., Zheng, Y. Y., et al. (2010). Overexpression of a proflin (GhPFN2) promotes the progression of developmental phases in cotton fibers. Plant Cell Physiol. 51, 1276–1290. doi: 10.1093/pcp/pcq086
Wu, S. J., Wang, H. H., Li, F. F., Chen, T. Z., Zhang, J., Jiang, Y. J., et al. (2008). Enhanced Agrobacterium-mediated transformation of embryogenic calli of upland cotton via efficient selection and timely subculture of somatic embryos. Plant Mol. Biol. Rep. 26, 174–185. doi: 10.1007/s11105-008-0032-9
Wu, S. Y., Xie, Y. R., Zhang, J. J., Ren, Y. L., Zhang, X., Wang, J. L., et al. (2015). VLN2 regulates plant architecture by affecting microfilament dynamics and polar auxin transport in rice. Plant Cell 27, 2829–2845. doi: 10.1105/tpc.15.00581
Xu, P., Zhang, Y. J., Kang, L., Roossinck, M. J., Mysore, K. S. (2006). Computational estimation and experimental verification of off-target silencing during posttranscriptional gene silencing in plants. Plant Physiol. 142, 429–440. doi: 10.1104/pp.106.083295
Yang, W. B., Ren, S. L., Zhang, X. M., Gao, M. J., Ye, S. H., Qi, C. B., et al. (2011). BENT UPPERMOST INTERNODE1 encodes the class II formin FH5 crucial for actin organization and rice development. Plant Cell 23, 661–680. doi: 10.1105/tpc.110.081802
Zhai, S. N., Li, G. Y., Sun, Y. W., Song, J. M., Liu, J. H., Song, G. Q., et al. (2016). Genetic analysis of phytoene synthase 1 (Psy1) gene function and regulation in common wheat. BMC Plant Biol. 16, 228–240. doi: 10.1186/s12870-016-0916-z
Zhang, Z., Zhang, Y., Tan, H. X., Wang, Y., Li, G., Liang, W. Q., et al. (2011). RICE MORPHOLOGY DETERMINANT encodes the type II formin FH5 and regulates rice morphogenesis. Plant Cell 23, 681–700. doi: 10.1105/tpc.110.081349
Zhang, T. Z., Hu, Y., Jiang, W. K., Fang, L., Guan, X. Y., Chen, J. D., et al (2015). Sequencing of allotetraploid cotton (Gossypium hirsutum L. acc. TM-1) provides a resource for fiber improvement. Nat. Biotechnol. 2015 33, 531–537. doi: 10.1038/nbt.3207
Zhang, M., Han, L. B., Wang, W. Y., Wu, S. J., Jiao, G. L., Su, L., et al. (2017). Overexpression of GhFIM2 propels cotton fiber development by enhancing actin bundle formation. J. Integer. Plant Biol. 59, 531–534. doi: 10.1111/jipb.12552
Keywords: actin polymerization, cell elongation, cotton, map-based cloning, plant morphology, short fiber
Citation: Sun Y, Liang W, Shen W, Feng H, Chen J, Si Z, Hu Y and Zhang T (2019) G65V Substitution in Actin Disturbs Polymerization Leading to Inhibited Cell Elongation in Cotton. Front. Plant Sci. 10:1486. doi: 10.3389/fpls.2019.01486
Received: 04 August 2019; Accepted: 25 October 2019;
Published: 15 November 2019.
Edited by:
Masahiko Furutani, Fujian Agriculture and Forestry University, ChinaReviewed by:
Guixian Xia, Chinese Academy of Sciences, ChinaTomokazu Kawashima, University of Kentucky, United States
Copyright © 2019 Sun, Liang, Shen, Feng, Chen, Si, Hu and Zhang. This is an open-access article distributed under the terms of the Creative Commons Attribution License (CC BY). The use, distribution or reproduction in other forums is permitted, provided the original author(s) and the copyright owner(s) are credited and that the original publication in this journal is cited, in accordance with accepted academic practice. No use, distribution or reproduction is permitted which does not comply with these terms.
*Correspondence: Tianzhen Zhang, Y290dG9uQG5qYXUuZWR1LmNu