 Changwei Tan1*†
 Pengpeng Zhang1†
 Yongjiang Zhang2†
 Xinxing Zhou1Zhixiang Wang1Ying Du1Wei Mao3Wenxi Li3Dunliang Wang1Wenshan Guo1*
- 1Jiangsu Key Laboratory of Crop Genetics and Physiology/Jiangsu Co-Innovation Center for Modern Production Technology of Grain Crops/Joint International Research Laboratory of Agriculture and Agri-Product Safety of the Ministry of Education of China, Yangzhou University, Yangzhou, China
- 2College of Agronomy, Hebei Agricultural University/Key Laboratory of Crop Growth Regulation of Hebei Province, Baoding, China
- 3Station of Land Protection of Yangzhou City, Yangzhou, China
Wheat spike number, which could be rapidly and accurately estimated by the image processing technology, serves as the basis for crop growth monitoring and yield prediction. In this research, simple linear iterative clustering (SLIC) was performed for superpixel segmentation of the digital images of field-grown wheat. Firstly, certain characteristic color parameters were extracted and analyzed from the digital images, and the classifiers with the highest accuracy were chosen for subsequent image classification. Next, the main body of wheat spike was extracted through a series of morphological transformation and estimate was performed for each region. Backbone of the head was extracted, and the number of inflection points of backbone was detected. Then the wheat spike number was determined by combining the estimate of inflection points of backbone and the estimate for each region. Finally, the wheat spike number estimate was verified under four nitrogen fertilizer levels. The results were as follows: (1) Super green value (Eg) and normalized red green index (Dgr) were used as classification features to recognize wheat spikes, soil and leaves; (2) compared with pixel-based image processing, wheat spike recognition effect was much better after superpixel segmentation, as the main body of wheat spike extracted was more clear and morphology more intact; and (3) wheat plants had better growth under high nitrogen fertilizer level, and the accuracy of wheat spike number estimation was also the highest, which was 94.01%. The growth status was the worst under no nitrogen fertilizer application, and the accuracy of wheat spikes number estimation was also the lowest, which was only 80.8%. After excluding the no nitrogen condition, the accuracy of wheat spikes number estimation among mixed samples with more uniform growth status was up to 93.8%, which was an increase by 10.1% than before the exclusion. Wheat spikes number estimate based on superpixel segmentation and color features was a rapid and accurate method that was applicable to the field environment. However, this method was not recommended for use when the growth status of wheat was poor or of high heterogeneity. The findings provided reference for field-grown wheat yield estimate.
Introduction
Wheat has been the most important cereal crop worldwide and also one of the most important food crops in China. For China, a major importer of wheat, standardization of production management and quality stabilization of wheat varieties were key pathways toward yield improvement, and this in turn was closely related to the national economy and food security. Number of spikes per unit area has been an important component of wheat yield, and fast and accurate estimate of wheat spike number was of high significance for high-yield cultivation and superior species selection and breeding (Nerson, 1980; Siddique and Whan, 1993). However, conventional field survey based on manpower was time- and labor-consuming. Along with the rising of agricultural informatization and mechanization level, image processing technology has found extensive applications in crop production. Moreover, computer vision with its advantages of high precision and intelligence attracted it as an alternative to human inspection. This technology was a dramatic boost for pest detection (Boissard et al., 2008; Shahin and Symons, 2011; Ding and Taylor, 2016; Senthilkumar et al., 2017), growth monitoring (Clevers and Leeuwen, 1996; Chaerle and Straeten, 2000; Wang et al., 2013; Silva et al., 2014), yield prediction (Salazar et al., 2007; Dunn and Martin, 2010; Aggelopoulou et al., 2011; Aguate et al., 2017) and species recognition (Neuman et al., 1987; Lópezgranados et al., 2006; Tellaeche et al., 2011; Pantazi et al., 2016).
A large number of studies have been conducted on capturing wheat phenotypic traits by using the image processing technology. Jin et al. (2017) proposed a method for high-throughput phenotype information extraction of wheat seedling density in field environment during the seedling stage by using images from low-altitude high-resolution unmanned aerial vehicle. Hosoi and Omasa (2009) used three-dimensional portable lidar imaging technology to estimate the density profile of vertical planting area and growth parameters of wheat canopy at different growth stages, and achieved good results. Walter et al. (2017) performed 3D point cloud processing to estimate wheat canopy height and harvest index reliably. The model reliability was further improved by increasing the number of images fitted. Wheat spike was one of the important agronomic components, and accurate determination of wheat spike number was very important for estimating wheat yield, which was the key step of field phenotype study (Zhang et al., 2007). spikeDue to the complexity of the field environment (e.g. light intensity, soil reflectivity, weeds, etc. changing color, texture and shape of the image of wheat spike), accurate segmentation and identification of wheat spike has remained a major challenge. Balasubramaniam et al. proposed intuitionistic fuzzy C-means color clustering algorithm to segment the nutrition-deficient pixels in crop images after normalization. By comparing other methods, the effectiveness of this method was proved (Balasubramaniam and Ananthi, 2016). Li et al. (2017) detected wheat spikes by using the neural network based on Laws texture energy measure. The detection effect was improved by combining area and height thresholds to well over 80%. The spike area was effectively measured as well (Li et al., 2017). Schirrmann et al. (2016) used the wheat field images obtained by unmanned aerial vehicle (UAV) to analyze the relationship between biophysical parameters and image variables, proving the applicability of UAV images in identifying the temporal and spatial patterns of wheat canopy development. Zhou et al. (2018) proposed a new algorithm that used computer vision to accurately identify wheat spikes in digital images, and adopted multi-feature optimization and a twin-support-vector-machine segmentation (TWSVM-Seg) model to determine the number of spikes. Jose et al. applied Laplacian filter and median filter to the digital wheat photos captured in field environment to extract the main part of wheat spikes. Peak detection algorithm was used to extract image peaks and to determine spike number. Moreover, the relationship between spike number and yield at different stages was analyzed, and it was found that the spike number at the flowering stage had the highest correlation to yield (Fernandez-Gallego et al., 2018).
Previous studies on wheat spike recognition were mostly based on pixel segmentation, and the influence of varying growth status on the recognition effect was rarely considered. Here, after certain pre-processing, pixels on the digital images of wheat were grouped together into superpixels, and wheat spikes were recognized based on superpixel segmentation, to reduce the interference from non-relevant pixels in the process of extracting image features and to improve the recognition effect. Moreover, variation of wheat growth status was simulated by applying nitrogen gradient to the seedlings, and the wheat spike number estimate was compared under different nitrogen fertilizer application levels, to improve the reliability of wheat spike number estimate. In order to estimate wheat spike number in field environment rapidly and accurately, simple linear iterative clustering (SLIC) was applied to the digital images for superpixel segmentation, and the wheat spikes were recognized based on color features. Then backbone of the head was extracted and the wheat spike number was estimated based on the number of inflection points of backbone. Accuracy of wheat spike number estimate was compared under different nitrogen fertilizer application levels. The influence of varying growth status on the recognition effect was discussed. The purpose was to provide a new reliable pathway to accurate wheat spike estimate.
Materials and Methods
Experimental Design
Experiments were conducted in the experimental field of Agricultural College of Yangzhou University in 2018 (119°23′26″ E, 32°23′53″ N), and a completely randomized design was adopted (Figure 1). Representative wheat cultivars were Yangmai 16 and Yangmai 17, both were spring wheat cultivars with medium maturity and long awn, and the spike types were spinning type and rectangle type, respectively. The former crop was rice, while sandy loam was the soil texture. In the soil layer of 0–30 cm, soil organic matter was 22.7 g⋅kg–1 and available nitrogen was 101.8 mg; moreover, available phosphorus was 27.2 mg and available potassium was 84.6 mg. To investigate differences in the growth and biochemical composition of wheat, four levels of nitrogen fertilizer application (urea) were set up, namely, 0 (N1), 225 kg⋅ha–1 (N2, 1/2 of the normal level), 450 kg⋅ha–1 (N3, normal level), and 900 kg⋅ha–1 (N4, excessive level). Each level had two replicates, and 16 plots for the two winter wheat varieties were prepared. Other field management measures were administered as usual. Data source was digital images of wheat in the field.
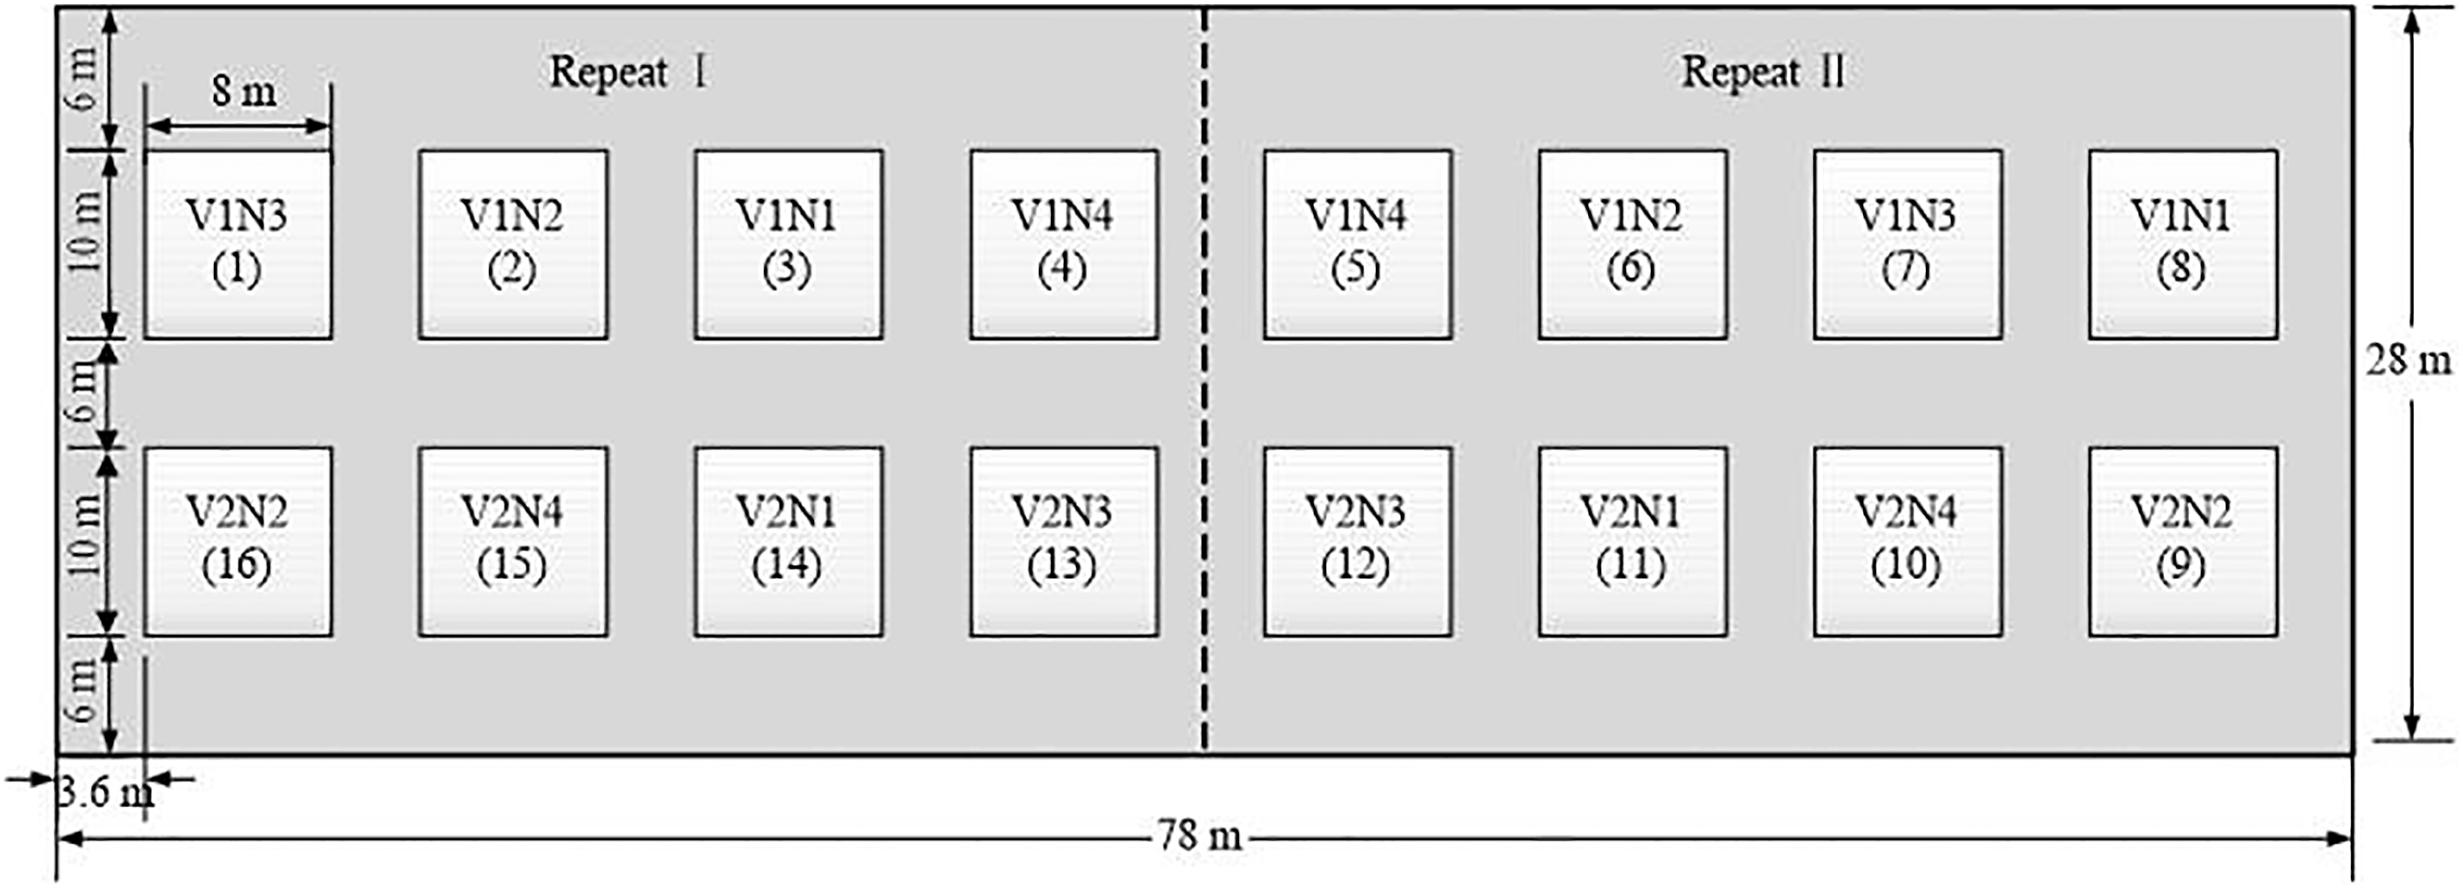
Figure 1. Experimental design. (V1 and V2 represent Yangmai 16 and Yangmai 17 varieties, respectively. N1, N2, N3 and N4 represent different nitrogen treatments of 0, 225 kg⋅ha–1,450 kg⋅ha–1,900 kg⋅ha–1, respectively. Each level had two replicates. A total of 16 plots, the area of each experimental plot was 8*10 m2).
Data Acquisition
Acquisition of Digital Images of Wheat
At 5:00 p.m. on May 22st, 2018 (grain filling stage, solar zenith angle 65°04′54″, azimuth 94°38′27″), which was a sunny windless day, digital images of wheat were shot with SONY DSC-H9 camera against the light and in a vertical direction. The filming height was about 1m above the wheat canopy. The area shot was about 0.75 m2 per image. For each plot, four wheat images with resolution of 2592∗1944 were shot, thus 64 images were obtained in total.
Artificial Wheat Spike Number Estimate
Artificial and automatic wheat spike number estimate was combined in this study (Figure 2). First, the digital images of wheat were interpreted by researchers, who marked out the portions of wheat spikes. Then the marked points were extracted from the images using MATLAB R2016a. These points were counted and numbered in the images so as to accurately and intuitively determine the wheat spike number.
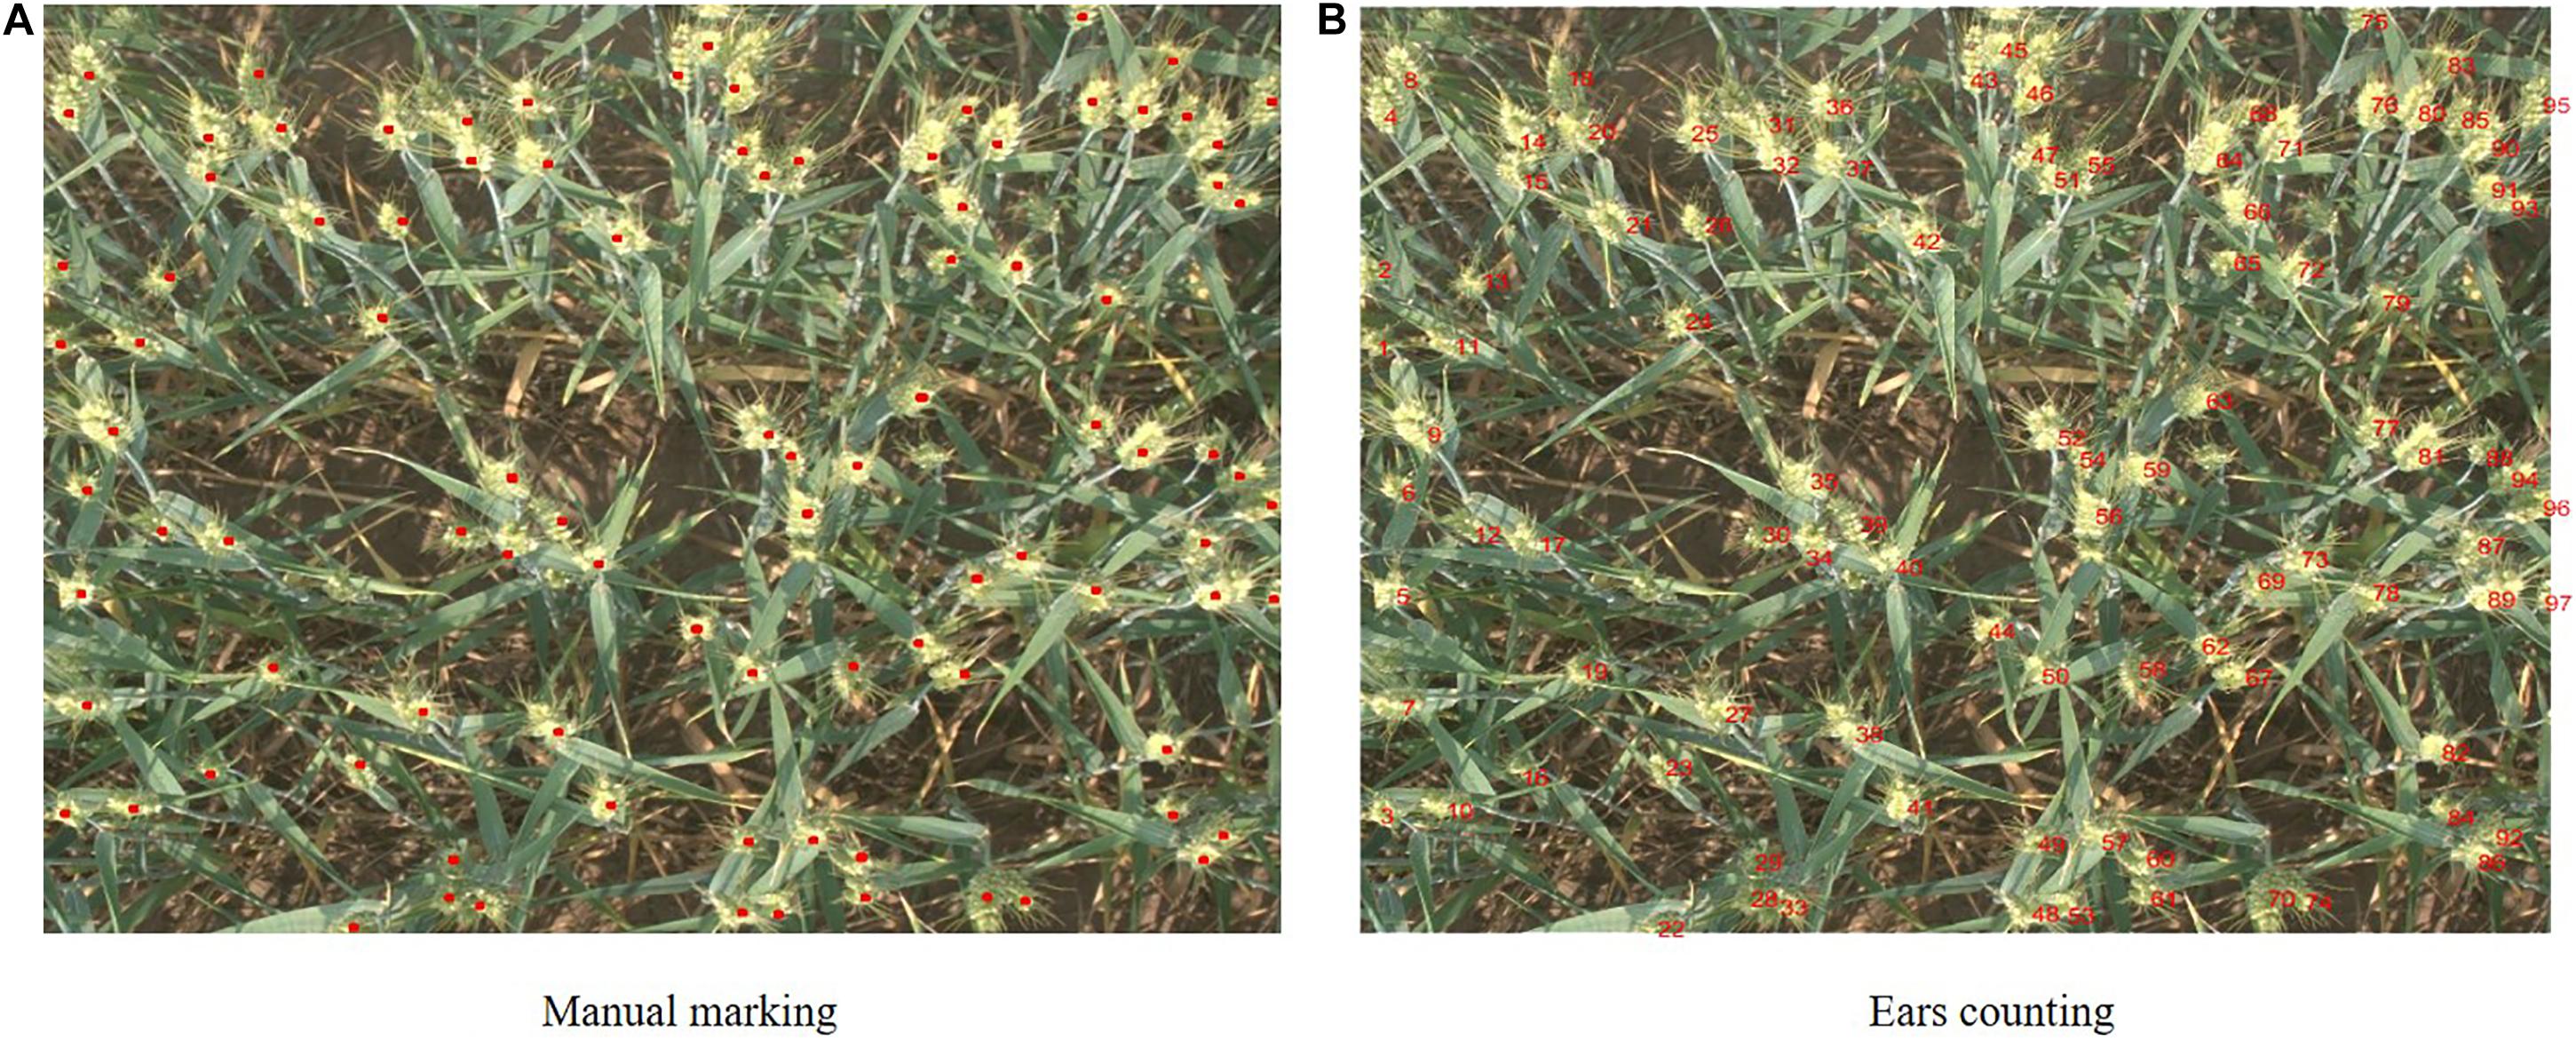
Figure 2. Wheat spikes manual counting process. [The location of wheat spikes were manually marked and the marked points were extracted and counted. The red points marked in panel (A) indicated the position of wheat spikes, and the red numbers in panel (B) indicated the serial number of wheat spikes in the picture].
Method of Wheat Spike Recognition
Wheat spike recognition consisted of the following steps: superpixel segmentation, sample labeling, color feature analysis, classifier training and recognition (Figure 3). To be specific,
(1) SLIC-based superpixel segmentation was applied to the digital images of wheat for pre-processing. Superpixels refer to the image blocks composing adjacent pixels with homogeneous features. Superpixel segmentation, which is to group these pixels into superpixels, has been widely used in image pre-processing (Kavzoglu and Tonbul, 2018). SLIC is the representative algorithm among a myriad of superpixel segmentation methods. SLIC is based on color similarity and spatial distance and employs K-means clustering for local iterative clustering to form superpixels (Radhakrishna et al., 2012; Akyilmaz and Leloglu, 2016; Zu et al., 2019). This algorithm involves two key parameters: pixel number of pre-segmetation (n) and pixel compactness (m). Pixel number n is the number of clusters centers in the image, which is uniformly assigned in the image according to the preset n. Generally speaking, the larger the n, the smaller the superpixels and the better the segmentation effect, though this may bring about the problems of higher calculation load and lower overall efficiency. Therefore, the n value should be reasonably set according to image size. Pixel compactness m is the weight assigned to the maximum distance within each cluster (including spatial distance and color distance). The larger the m value, the more regular the superpixel boundaries will be. For a more complex image, a smaller m value is usually needed. The main parameters of the algorithm included pixel number and pixel compactness of pre-segmentation, which were set to 10,000 and 10 based on the size of images used in the experiment (2592∗1944).
(2) Under each nitrogen fertilizer application level (regardless of wheat variety), five wheat images of 500∗500 were randomly clipped as samples for artificial pre-segmentation. Then the superpixels were labeled based on the results of artificial pre-segmentation. That is, pixels with proportion of wheat spikes exceeding 0.8 were labeled 1, and those below it 0.
(3) Some commonly used color indices were analyzed and appropriate ones were chosen as classification features (Stajnko et al., 2004; Moffett and Gorelick, 2013), which included super green value (Eg), normalized red green index (Dgr) and normalized blue green index (Dgb), given by:
where g, r and b are green, red and blue component values, respectively.
(4) Classification Learner in MATLAB R2016a was used to select appropriate indices based on color feature analysis as feature values for classification. Two classifiers, support vector machine (SVM) and K nearest neighbor (KNN), were trained (Table 1). The one with the better accuracy based on the training results was chosen as the classier.
(5) The selected classifier was then applied to superpixel classification for preprocessed images. The classification results were subjected to simple morphological processing (removing the fragments) to obtain the final wheat spike, namely wheat spikes recognition.
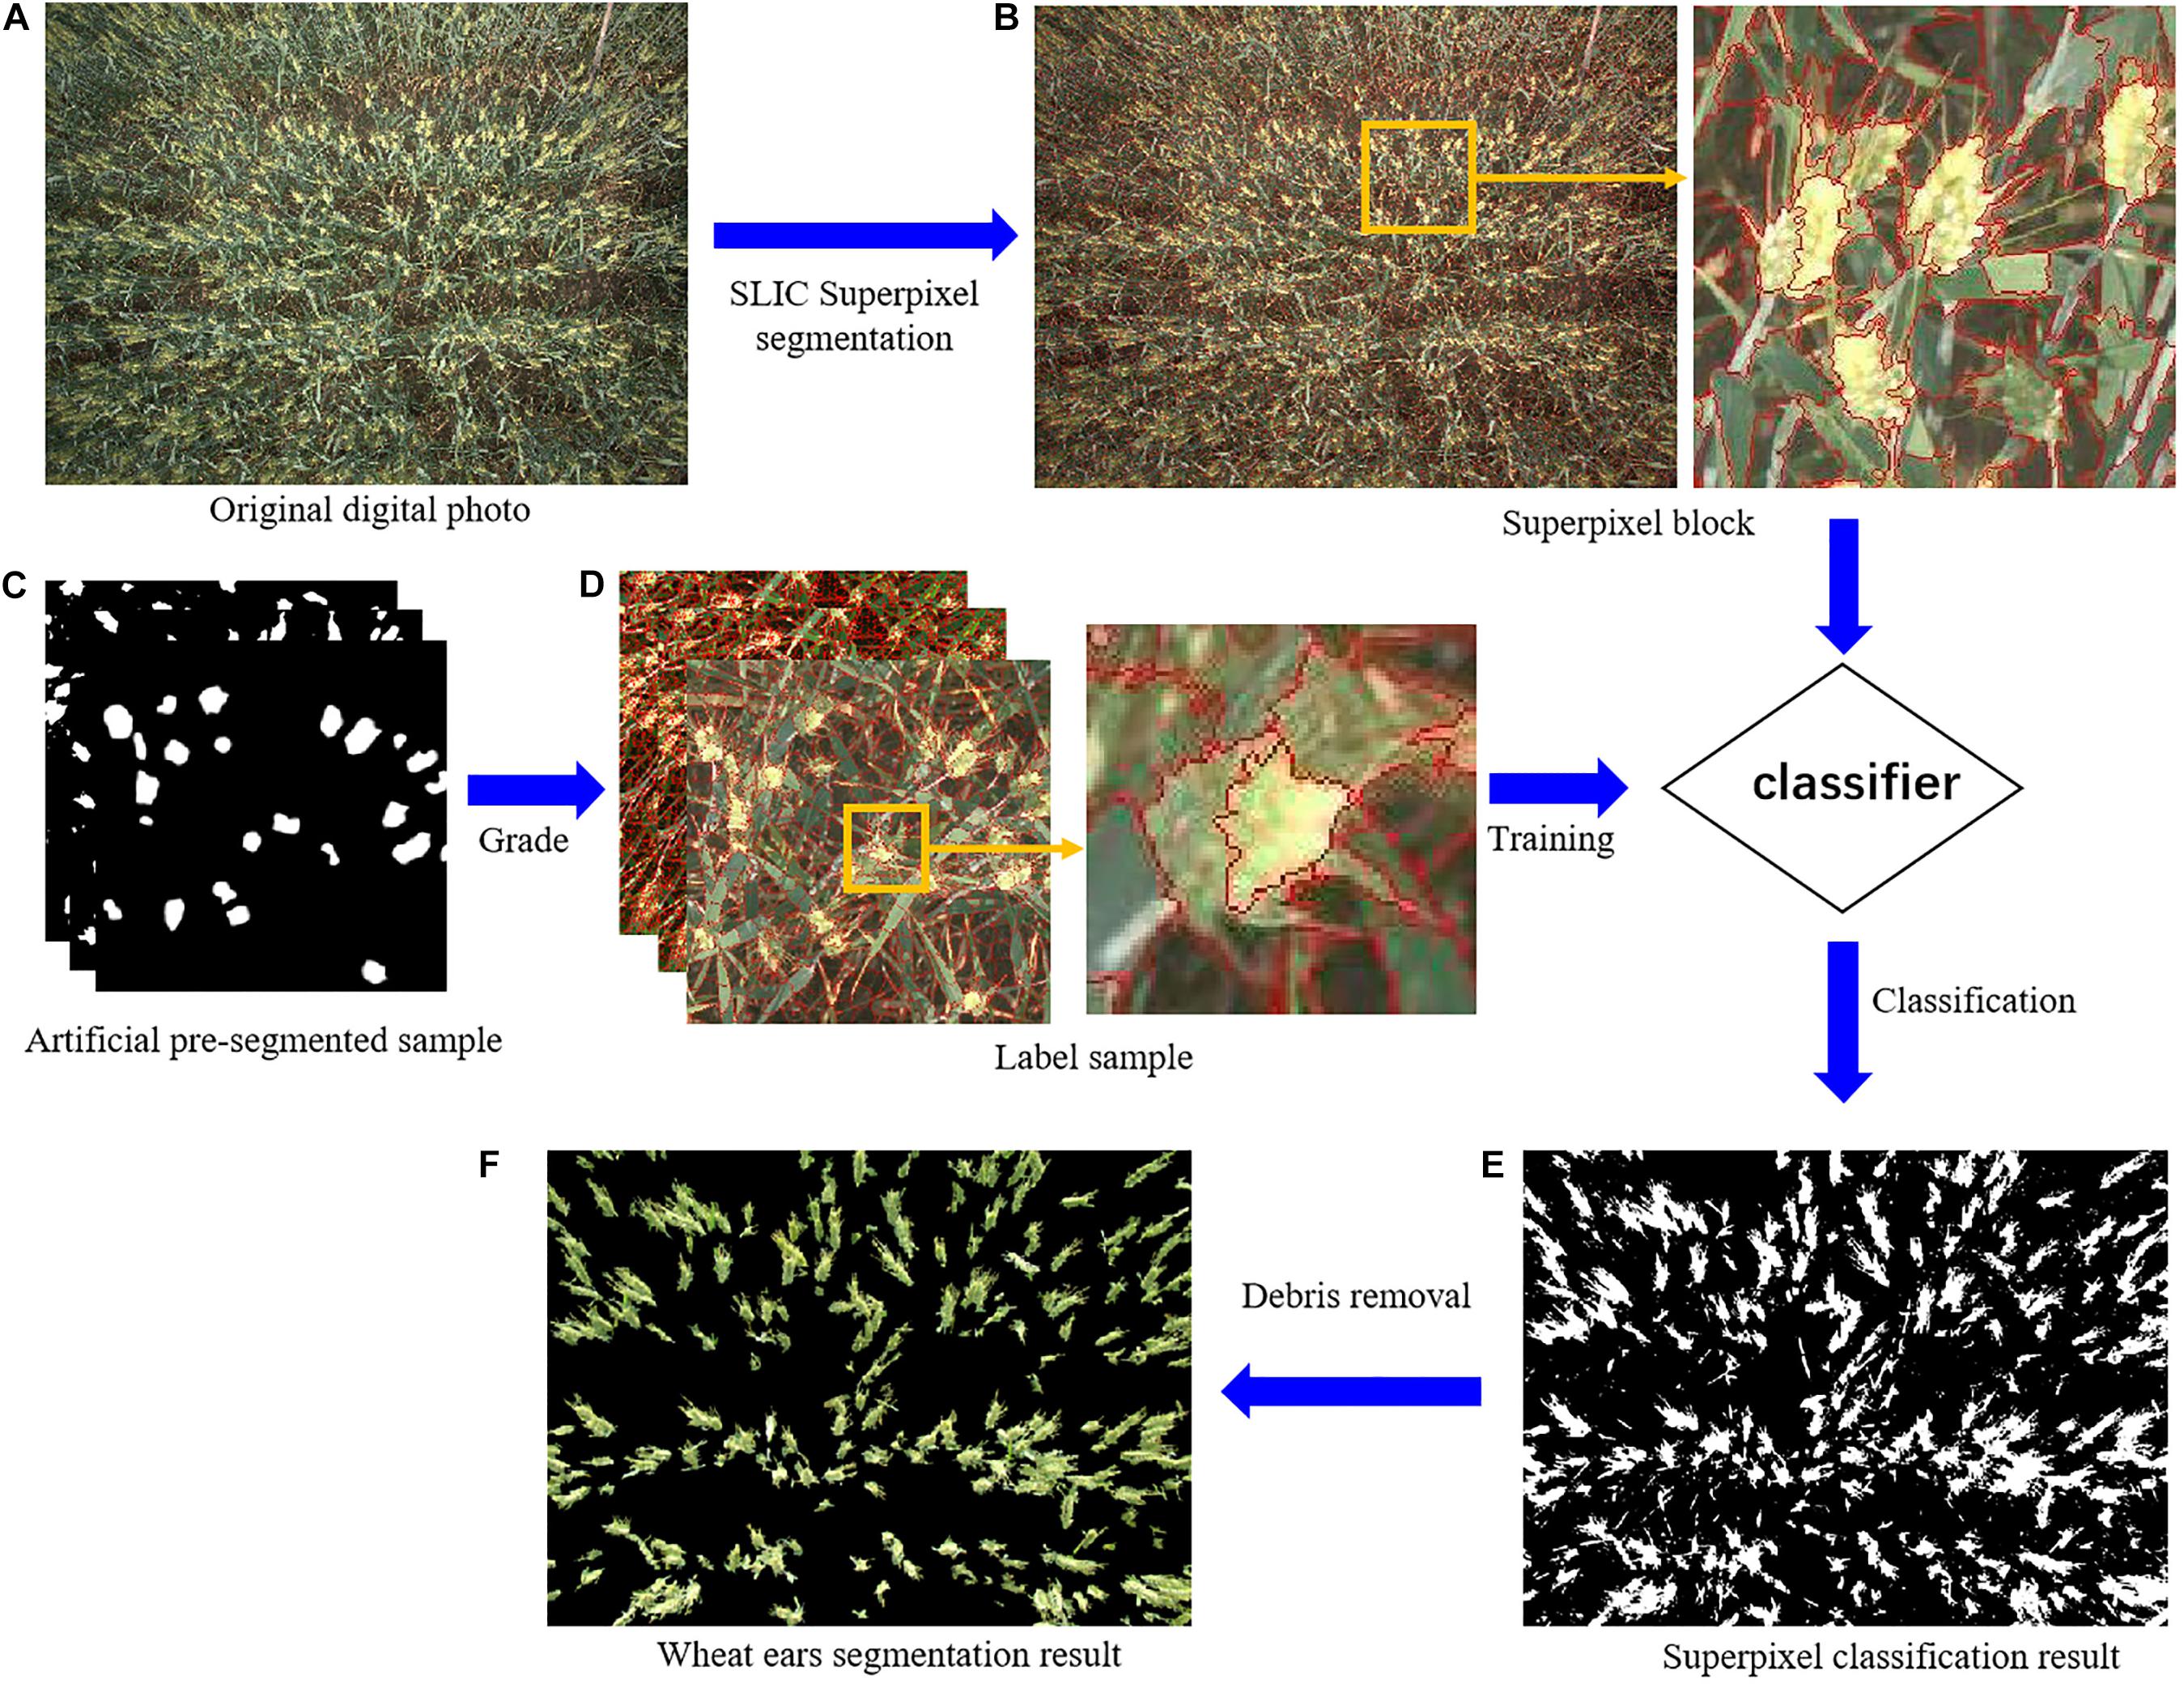
Figure 3. Wheat spikes recognition process. [A was the original digital photo. SLIC was Simple linear iterative clustering. (B) was the superpixel block. (C) was the artificial pre-segmentation sample. (D) was the label sample. Two classifiers were support vector machine (SVM) and K nearest neighbor (KNN). (E) was the superpixel classification result, and F was the wheat spikes segmentation result].
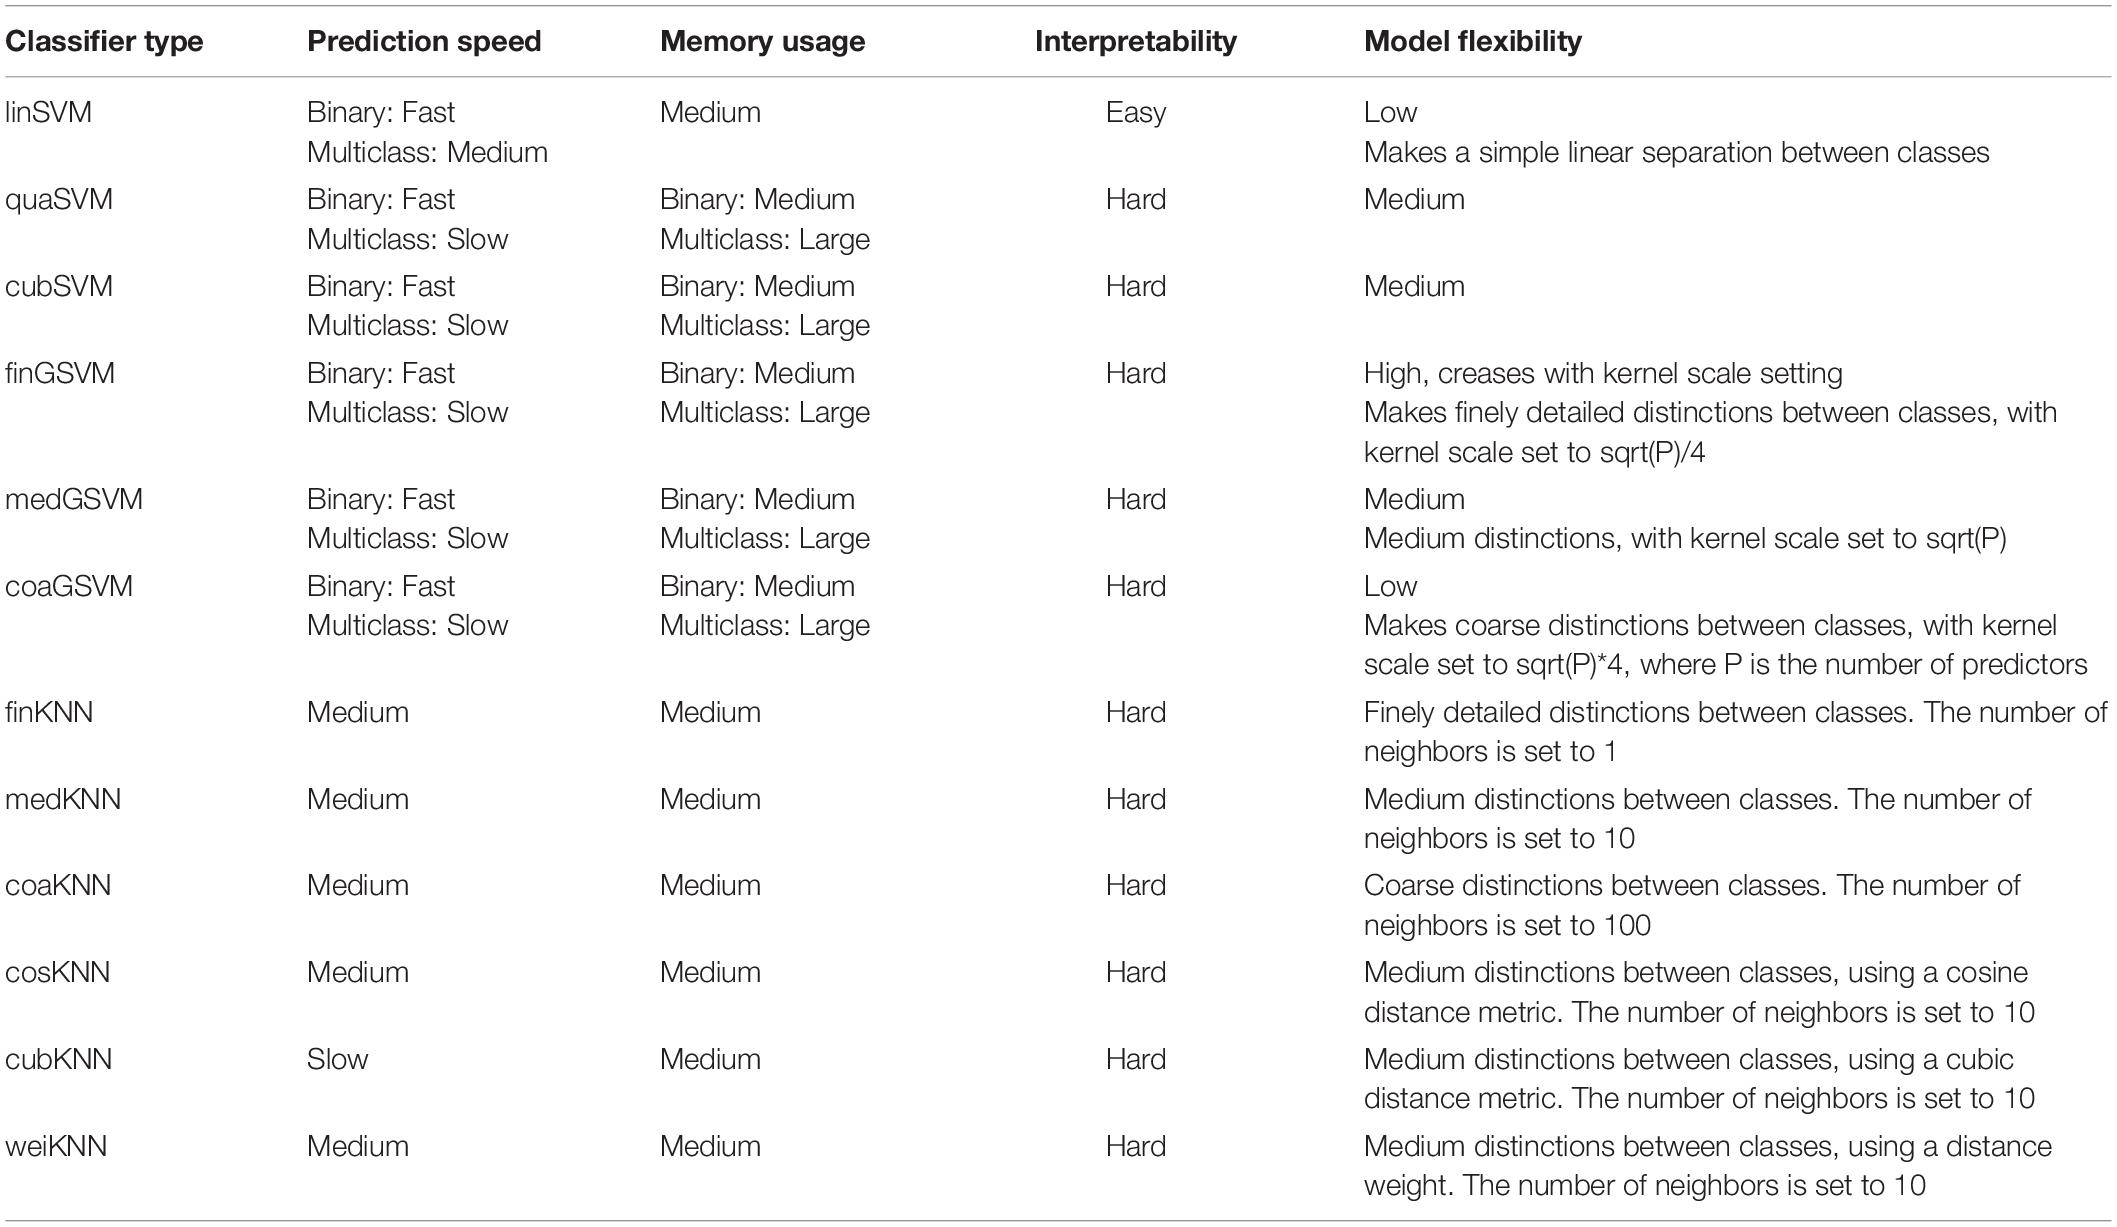
Table 1. Different types of classifier features.
Determination of Wheat Spike Number
As shown in Figure 4, the wheat spike recognition results were binarized. During wheat spike counting, greater emphasis was given to the main part of spikes and not to morphology. The main part of spikes was preserved by morphological transformation such as erosion and dilation operation (Possa et al., 2014), while the edges were weakened to reduce adhesion to adjacent spikes. Statistics were performed for the regions in the binarized images. Traits such as number (nregion) and area of regions in the binarized images were calculated. In addition to the complex field environment, the grains were plump and the spikes were larger in size during the grain filling stage. Therefore, the binarized images after morphological transformation still contained a few wheat spike overlap. These overlaps were screened based on the area and morphology (length-to-width ratio) of the regions. Backbone of the head was extracted from the overlaps (Cremers et al., 2007; Delgado-Friedrichs et al., 2015) and the number of inflection points of backbone (Liu et al., 2001) (npoint) was calculated. The wheat spike number for the overlaps was npoint + 1, and the total wheat spike number was nregion + npoint.
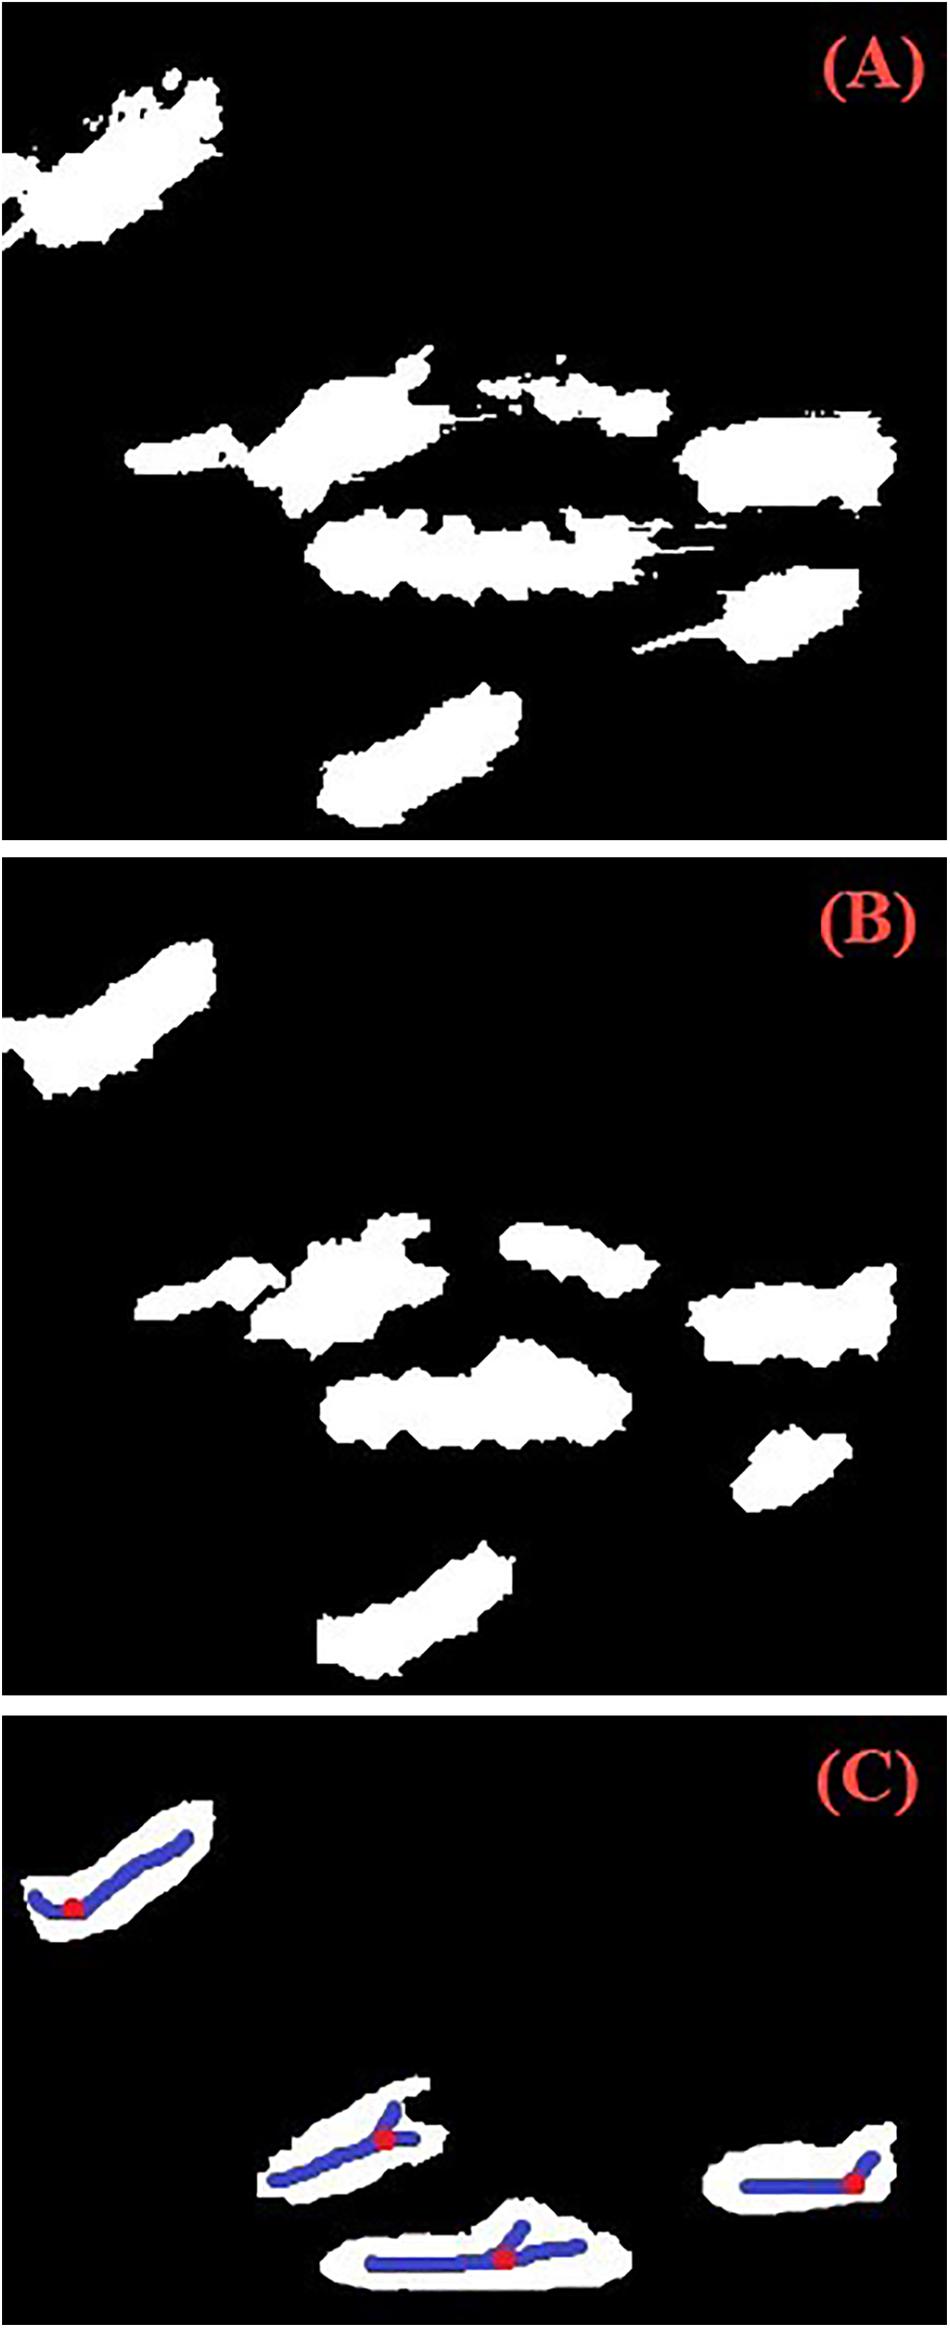
Figure 4. Wheat spikes counting process. [(A) Segmentation of wheat spikes: binarization of recognition results. (B) Morphological transformation: mathematical morphology open operator was used to reduce the disturbances. (C) Skeleton inflection point in the overlap area of wheat spikes: the overlapping region was detected according to the shape and area parameters of the region].
Statistical Analysis
SPSS 22.0 software was used for statistical analysis. The relationship between automatic count and artificial count was analyzed based on Pearson’s correlation coefficient (r) and linear regression analysis. Such correlations were compared under different nitrogen fertilizer application levels, and the accuracy (A) was calculated by using the artificial count as benchmark. Thus accuracy of wheat spike number estimate was compared under different nitrogen fertilizer application levels to discuss the influence of growth status on the recognition effect. Accuracy A was given below:
where Nc is the automatic count; Na is the artificial count; A is accuracy.
Results and Analysis
Wheat Spike Recognition
Analysis of Classification Features
Three color indices associated with G component, namely, super green value (Eg), normalized red green index (Dgr) and normalized blue green index (Dgb), were applied to the calculation in wheat spike, leaf and soil samples during the grain filling stage, respectively, (Figure 5). The results showed that Eg of soil samples was generally smaller and had a concentrated distribution, with nearly no overlap with the spikes; the distribution range and curve morphology of Eg in leaf and wheat spike samples were very close to each other, resulting in severe overlap. Therefore, Eg was fit for differentiation between spikes and soil, but not for reducing leaf interferences in the images (Figure 5A). Dgr of the soil samples was generally small and there was serious overlap in the above-zero part with the curve of wheat spikes. However, Dgr of leaf samples was distributed within a broader range, showing little overlap with the curve of wheat spike samples and having large peak difference, which was helpful to discriminate between the wheat spikes and leaves. Dgb curves of the three types of samples almost coincided with each other, indicating little value for wheat spike recognition.
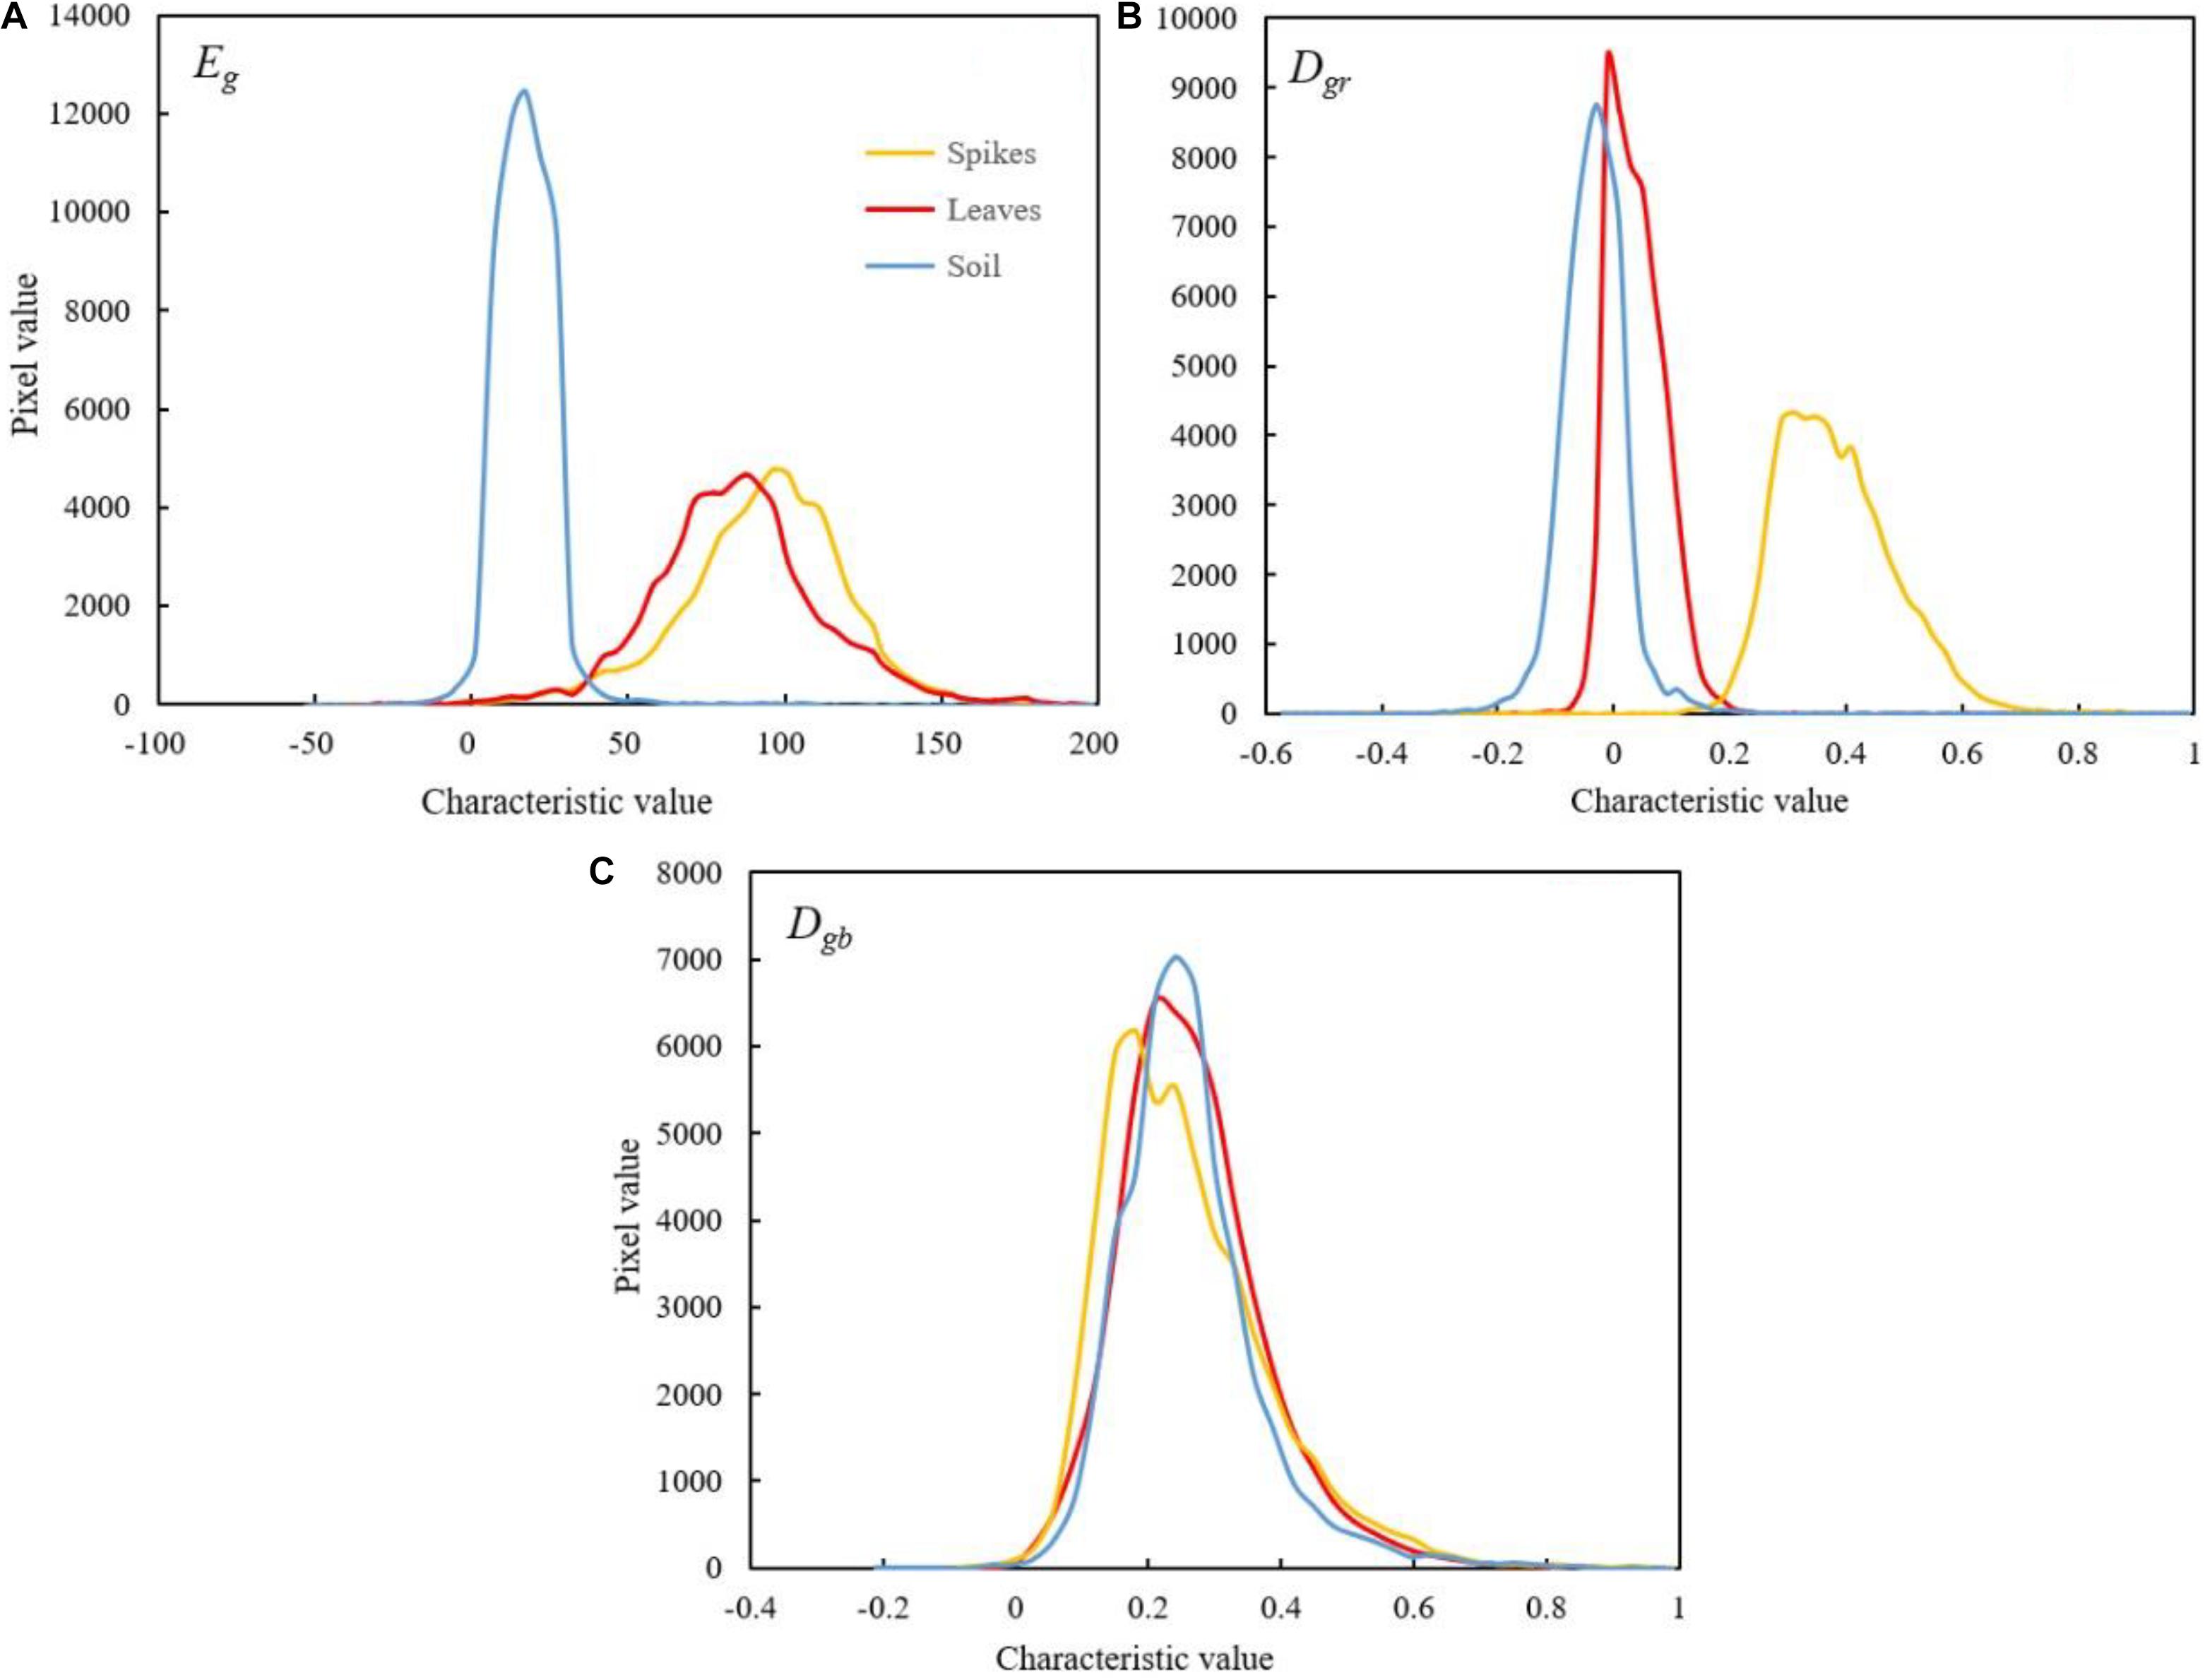
Figure 5. Color histogram of wheat spike, leaf and soil samples. [(A) Super green index, Eg=2g-r-b. (B) Normalized red green index, Dgr= (g-r)/(g+r). (C) Normalized blue green index, Dgb = (g-b)/(g+b). The yellow, red and blue lines represented spikes, leaves and soil, respectively].
Results of Classifier Training
Eg and Dgr were chosen as classification features to train the SVM and KNN classifiers (Table 1) in the MTLAB R2016a toolbox. Then the appropriate classifier was chosen based on the training results (Table 2). The results showed that the classifier accuracy was 80% without nitrogen fertilizer application (N1), and medGSVM took on the highest level with the accuracy of 85.63%. Under low nitrogen fertilizer application level (N2), different classifiers varied little in accuracy, which was generally around 88%. finGSVM was the optimal classifier under this level, with accuracy reaching 90.93%. Under normal nitrogen fertilizer application level (N3), nearly all classifiers had accuracy above 90%. medGSVM was the optimal one, with the accuracy of 93.82%. Under high nitrogen fertilizer application level (N4), all classifiers had accuracy above 90%. cubSVM was the optimal one under this level, with the accuracy of 94.01%. Under mixed nitrogen fertilizer application level, weiKNN was the optimal classifier with the accuracy of 90.61%. In a word, SVM classifiers had a higher performance under single nitrogen fertilizer application level and had higher accuracy; but under mixed nitrogen fertilizer application level, KNN classifiers outperformed SVM classifiers in terms of accuracy. As the nitrogen fertilizer application level increased, the classification accuracy also rose and trended to a stable level. For example, as compared with N1 level, the classifiers had an improvement of accuracy by 5.3% under N2 level; as compared with N2 level, the accuracy increased by 2.89% under N3 level; the accuracy under N4 level only improved by 0.19% as compared with N3 level. On the whole, the classification accuracy was close with the two classifiers on samples with nitrogen fertilizer application (N2, N3 and N4). The growth status of wheat seedlings was worse without nitrogen fertilizer application, and there were considerable differences in uniformity, color and size as compared with those with nitrogen fertilizer application. Therefore, the greater the heterogeneity within the mixed samples, the lower the classification accuracy.
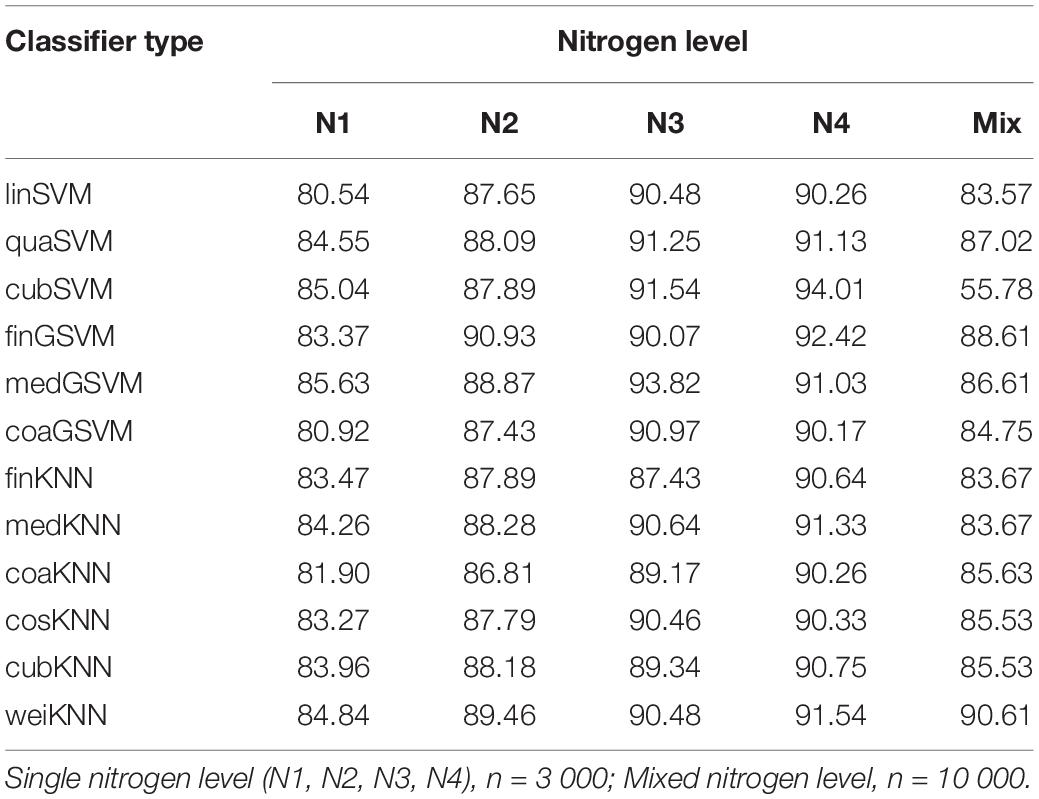
Table 2. Classifier training results (Classification classification accuracy,%; single nitrogen level, n = 3 000; mixed nitrogen level, n = 10 000).
Results of Wheat Spike Recognition
Based on the above analysis, the classifiers established were applied to wheat spike classification recognition from preprocessed images (Figure 6). As control, color features Eg and Dgr were used for automatic thresholding. The results of two thresholding segmentation were superimposed for pixel-wise segmentation of spikes. The results showed that the recognition effect was better with superpixel classifiers under single nitrogen fertilizer application level than under the mixed level, with significantly less leaf confounding. As compared with pixel-based thresholding segmentation, superpixel recognition led to higher integrity of the main body of spikes, effective improvement of patches in spikes, and better representation of spikes in morphology and size. As the nitrogen fertilizer application level increased, the wheat spike morphology was more clearly visualized and the recognition effect was improved. The spikes in regions with nitrogen fertilizer application (N2, N3 and N4) could be all effectively recognized. The actual classification results were consistent with the training results of the classifiers.
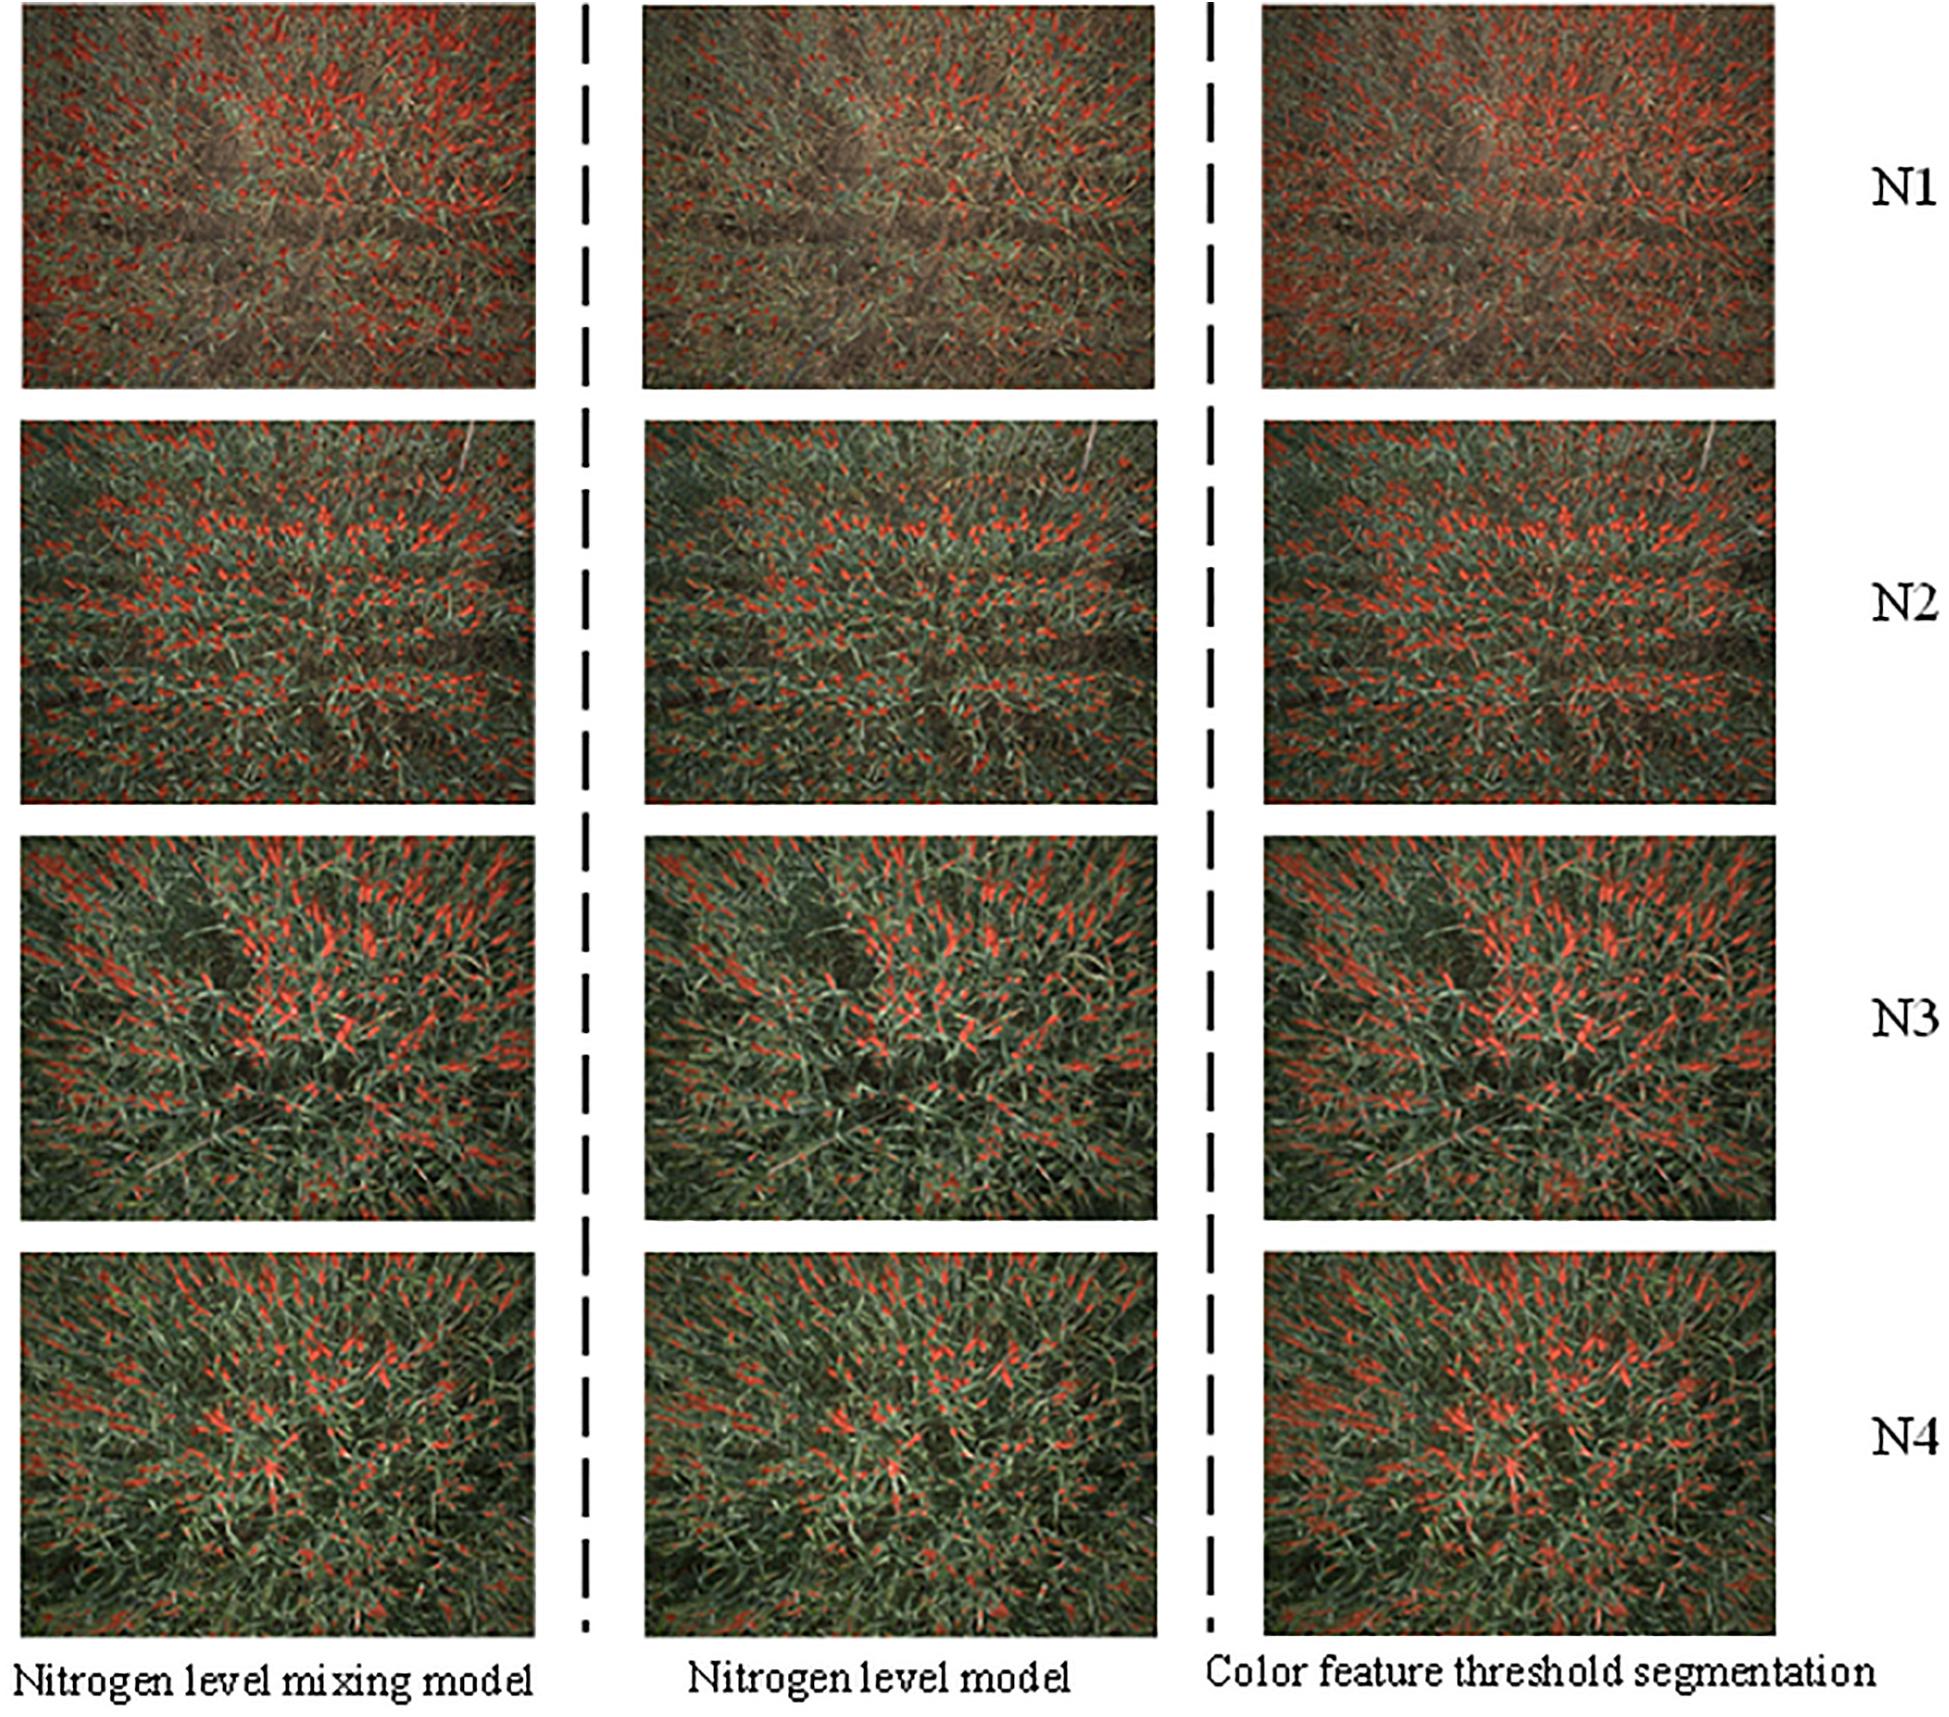
Figure 6. Wheat spikes recognition results. [For nitrogen level mixing model, nitrogen level model, and color feature threshold segmentation model, recognition under different nitrogen level gradient. The left picture was nitrogen level mixing model, the middle picture was nitrogen level model, the right picture was color feature threshold segmentation. N1, N2, N3 and N4 represented 0 (nitrogen-free), 225 kg⋅ha–1 (1/2 of the normal nitrogen level), 450 kg⋅ha–1 (normal nitrogen level), and 900 kg⋅ha–1 (excessive nitrogen level), respectively].
Wheat Spikes Number Estimate
Wheat Spike Number Estimate Under Different Nitrogen Fertilizer Application Levels
The samples were mixed together under single nitrogen fertilizer application level and under mixed level, respectively. The classifiers were trained for wheat spike extraction based on superpixel blocks. Then based on wheat spike recognition result, the wheat spike number was automatically determined. The artificially counted wheat spike number was used as benchmark to calculate the accuracy. Linear regression was performed between automatic count and actual count to form a 1:1 relationship diagram (Figure 7). Automatic counts were compared under different nitrogen fertilizer application levels. The overall accuracy was 80.8% under no nitrogen fertilizer application. Severe deviation was observed in the automatic count under a small wheat spike number, and the correlation between automatic count and artificial count was also worse (R2 = 0.23, p > 0.05), respectively. That is to say, the difference was of no statistical significance and the automatic count was less satisfying. By contrast, higher accuracy was achieved under all other three nitrogen fertilizer application levels (Alow = 92.8%, Anormal = 93.1%, Ahigh = 94.2%). Besides, there was good correlation between automatic count and actual count (R2low = 0.71, R2normal = 0.76, R2high = 0.79), which was of extreme statistical significance (P < 0.01). The accuracy of automatic wheat spike number estimate was generally high. As the nitrogen fertilizer application level increased, the automatic wheat spike number estimate was also improved and it was the best under high nitrogen fertilizer application level, with accuracy reaching up to 94.2%. Automatic wheat spike number estimate was based on processing and statistics of regions in binarized image of wheat spike segmentation. Therefore, the automatic wheat spike number estimate and wheat spike segmentation were consistent under different nitrogen fertilizer application levels. However, the classifiers were of poor applicability under no nitrogen fertilizer application, while all statistics were effective for regions with nitrogen fertilizer application. When all samples were mixed together regardless of the nitrogen fertilizer application level, the accuracy of automatic wheat spike number estimate was 83.7%, and R2 was 0.22. Under the condition of 240 spikes per image in the present study, this accuracy was quite low and could not meet the requirements of wheat production practice.
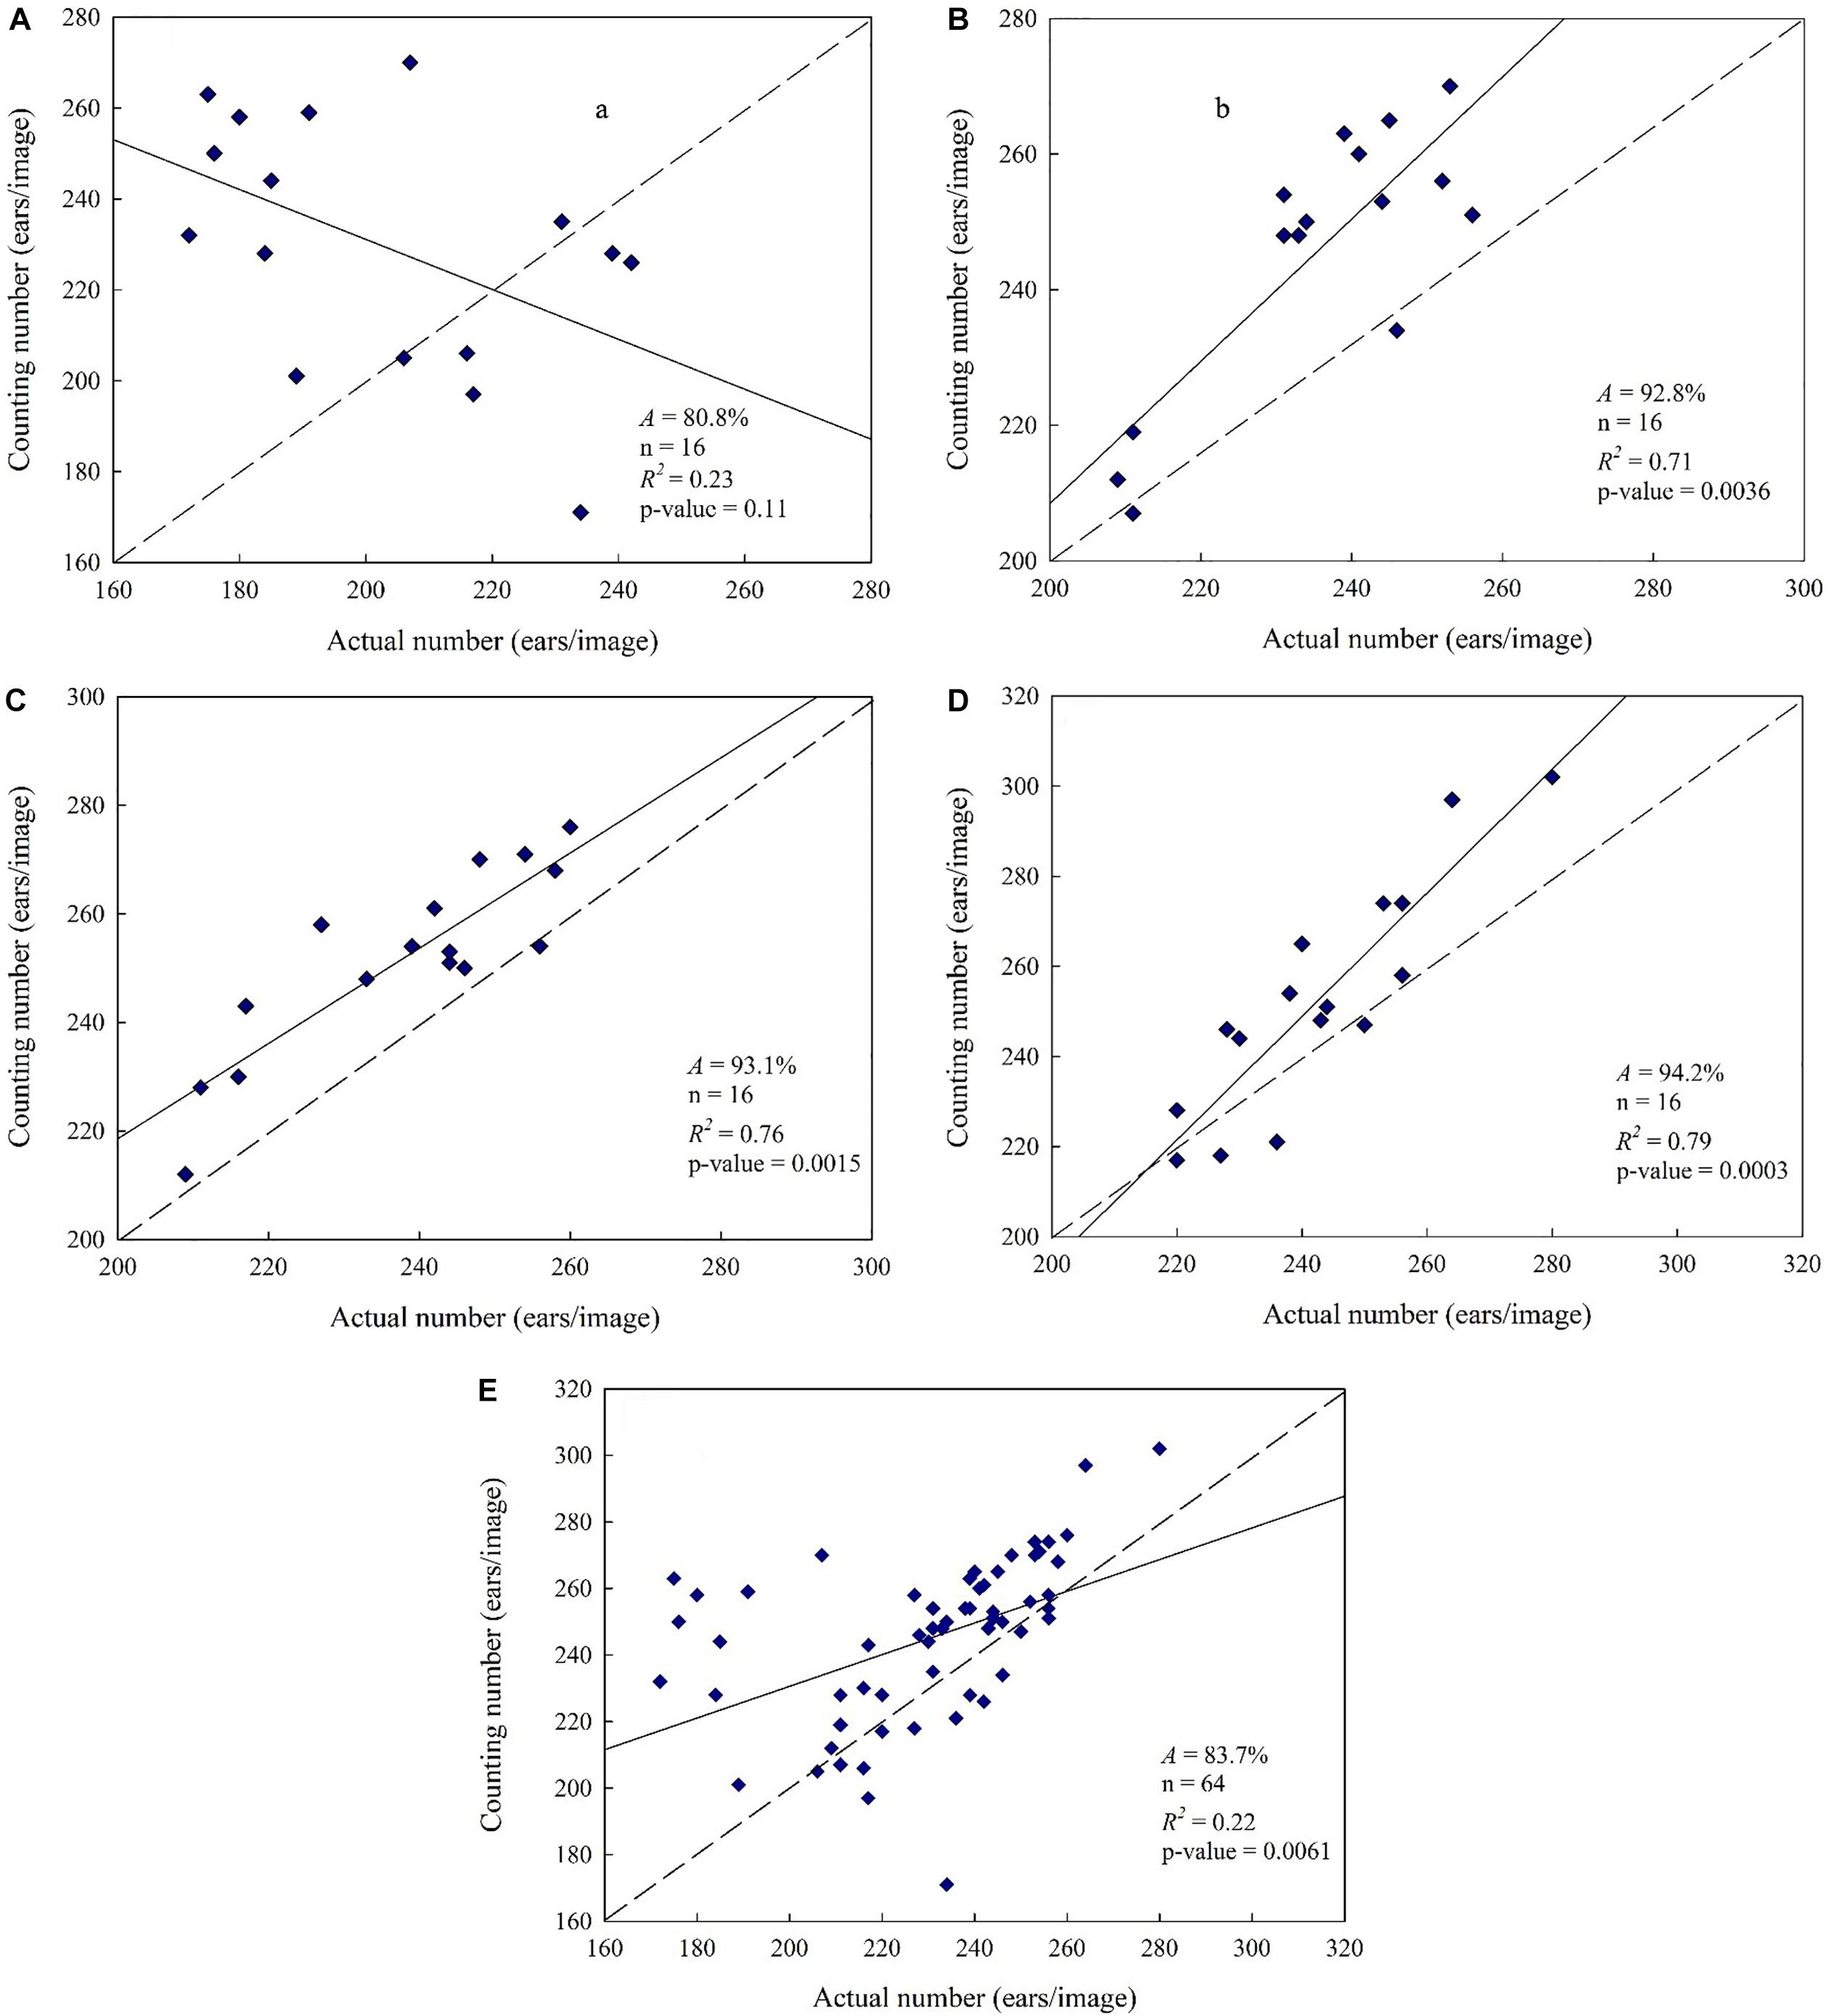
Figure 7. Wheat spikes recognition results. [(A) Nitrogen-free, 0 kg⋅ha–1. A = 80.8%, n = 16, R2 = 0.23, p-value = 0.1. (B) Low-nitrogen, 225 kg⋅ha–1. A = 92.8%, n = 16, R2 = 0.71, p-value = 0.0036. (C) Normal nitrogen, 450 kg⋅ha–1. A = 93.1%, n = 16, R2 = 0.76, p-value = 0.0015. (D) High nitrogen, 900 kg⋅ha–1. A = 94.2%, n = 16, R2 = 0.79, p-value = 0.0003. (E) Mixed nitrogen, samples were mixed at four nitrogen levels. A = 83.7%, n = 64, R2 = 0.22, p-value = 0.0061].
Wheat Spike Number Estimates for Plots Applied With Nitrogen Fertilizer
Based on the above results, samples under no nitrogen fertilizer application were removed from the training samples. In order to establish representative mixed samples set applied to train the classifiers, the remaining samples were mixed and used to train the classifiers after K-means clustering. Overall accuracy and wheat spike segmentation accuracy was determined according to the training results (Table 3), and weiKNN classifier was further used for superpixel classification to extract the spikes. Finally, automatic wheat spike number estimate was obtained (Figure 8). As compared with the statistics under the mixed nitrogen fertilizer application level (Figure 7E), the estimate performance was significantly improved. Accuracy increased from 83.7 to 93.8%, and the correlation between the automatic count and actual count was also improved significantly, with R2 rising from 0.22 to 0.74. Therefore, in regions with nitrogen fertilizer application, segmentation and statistics might be performed without considering the differences in nitrogen level, and the estimate is reliable.
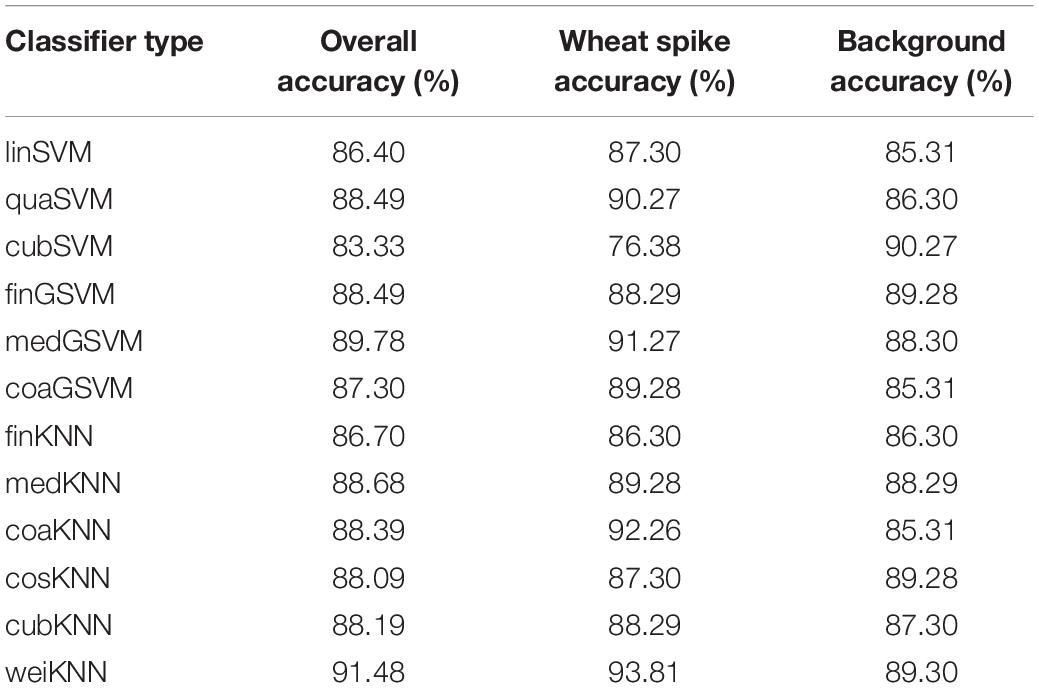
Table 3. Classification training results of nitrogen application samples (n = 10 000).
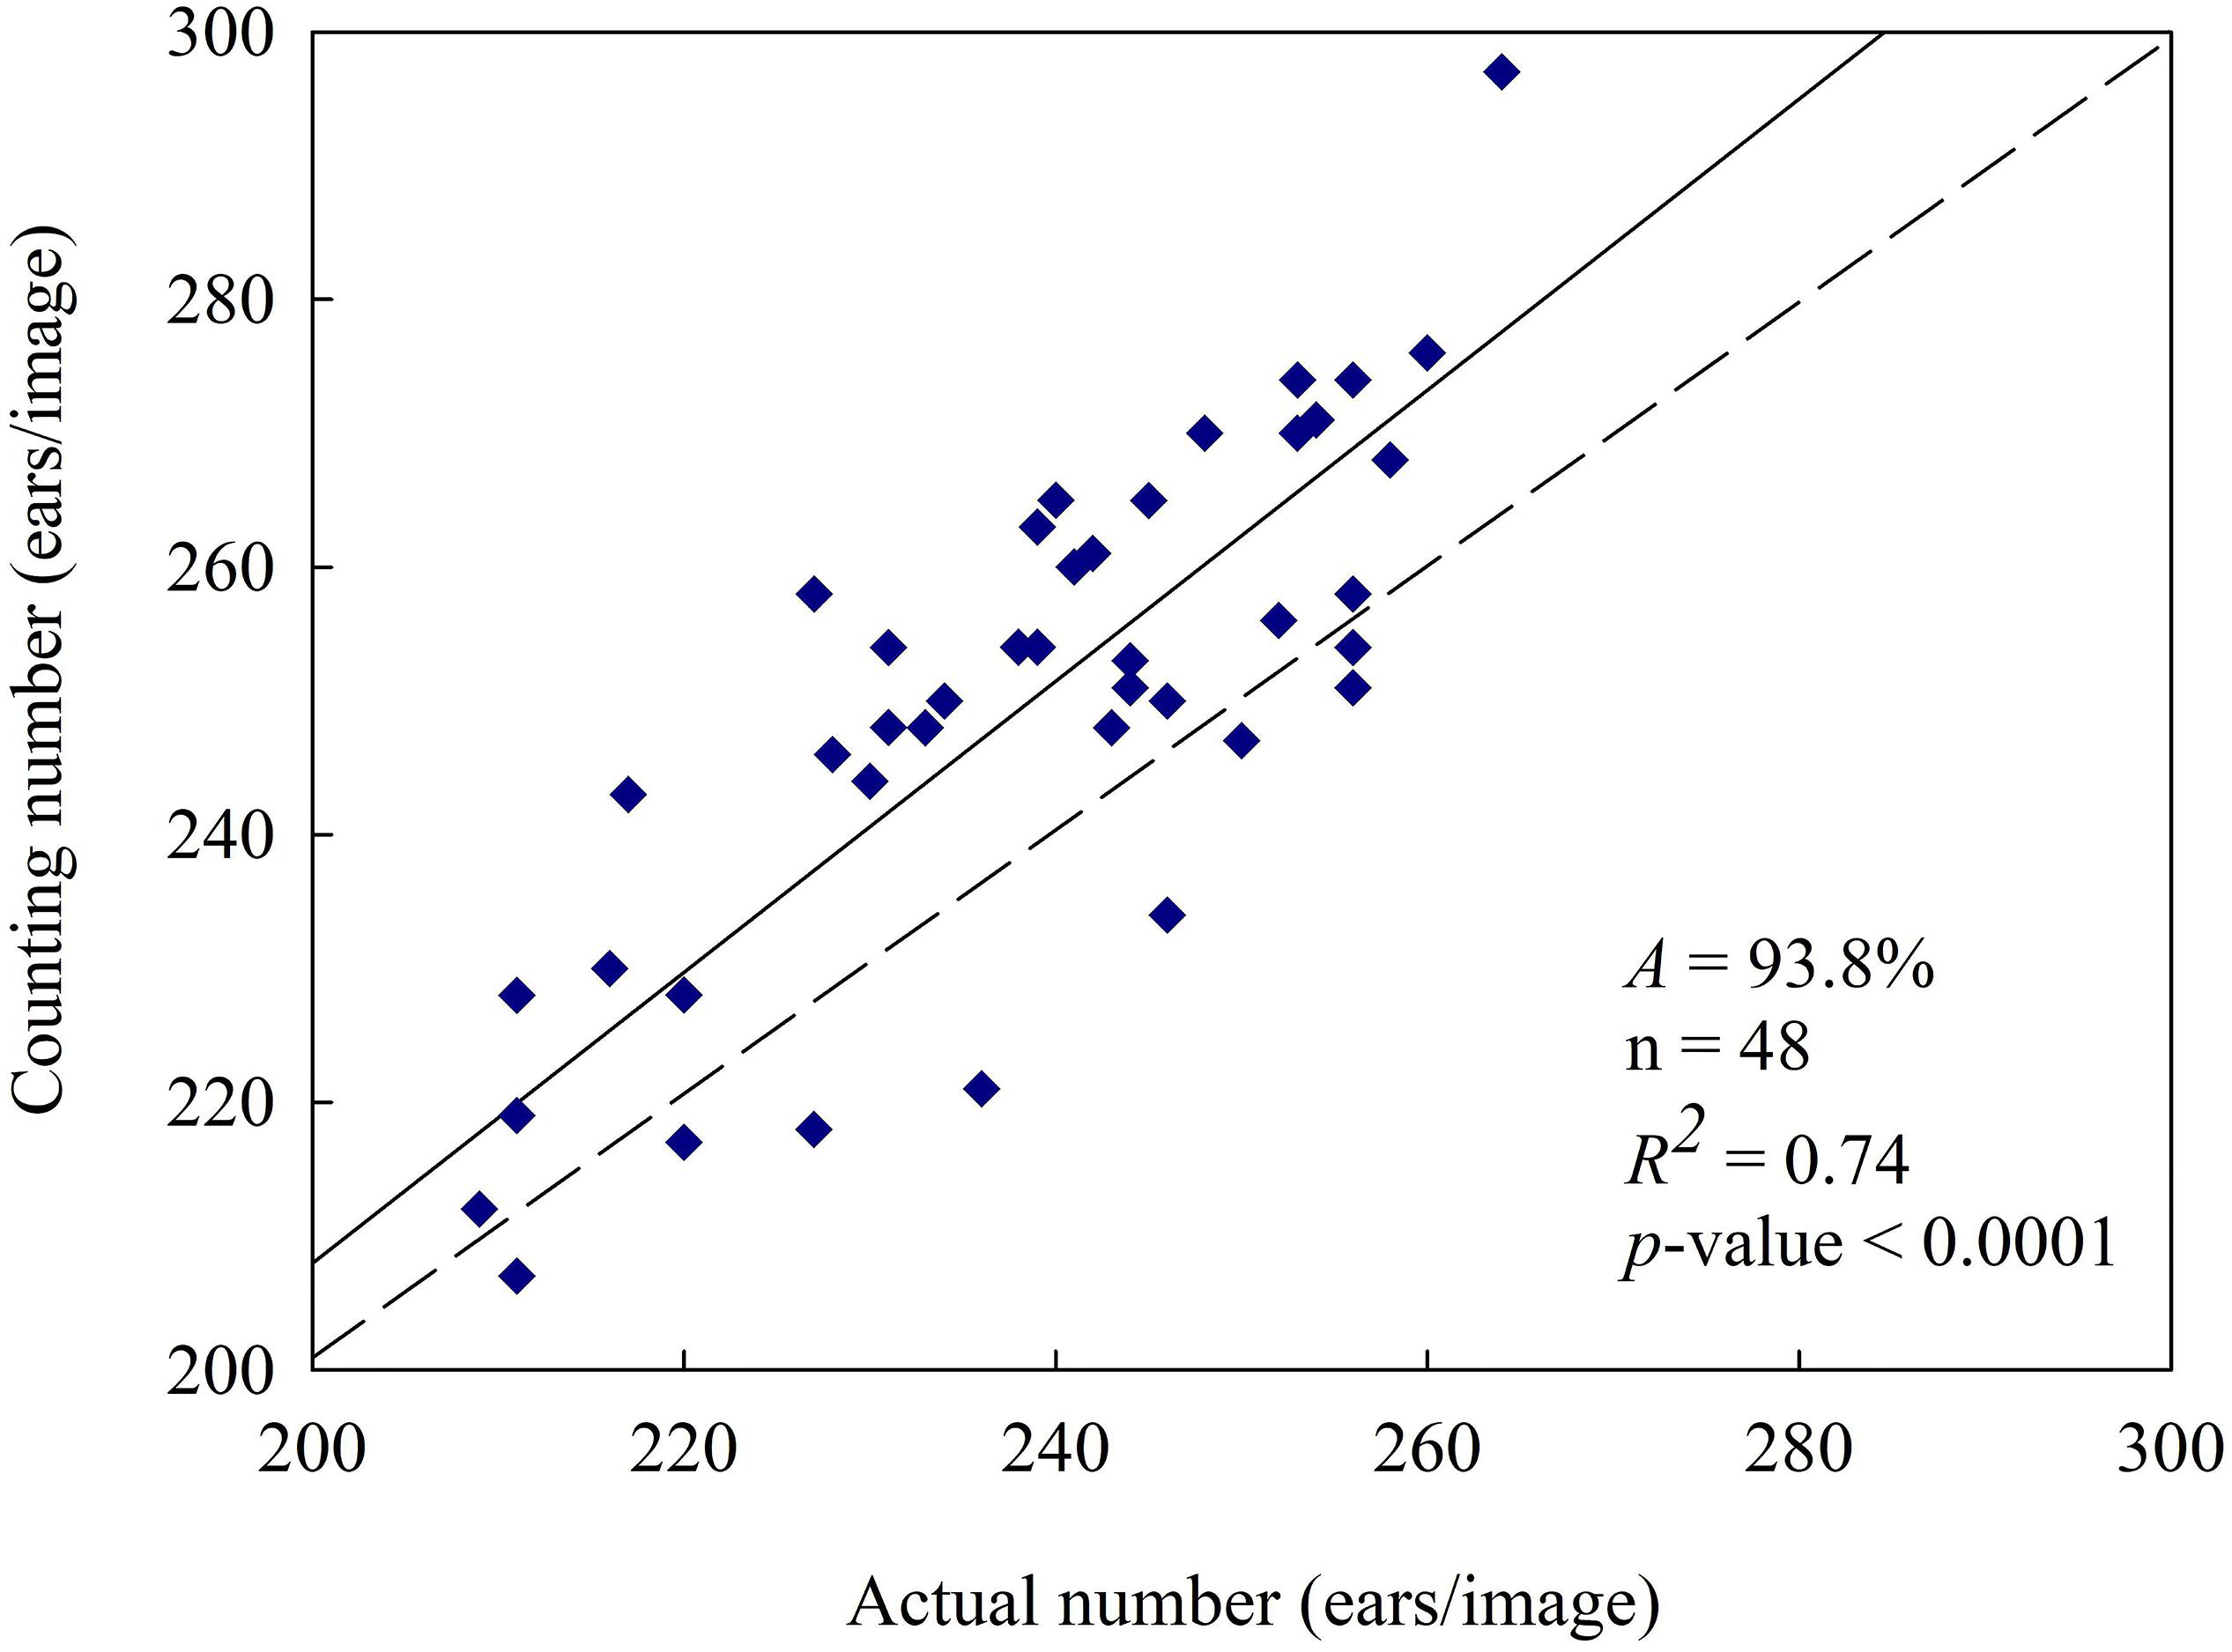
Figure 8. Wheat spikes counting result in nitrogen application. [Eliminate 16 nitrogen-free samples and mix the remaining 48 samples for identification verification. The result was A = 93.8% and R2 = 0.74, at p-value < 0.0001 level].
Discussion
The accuracy of automatic ear number estimate relies upon reliable segmentation of ear images. Among the existing image segmentation methods, image features extracted based on target features mainly included color, texture and shape (Caelli and Reye, 1993; Mukherjee et al., 2015). However, texture features received large interference from the leaves in the process of spike image segmentation during the grain filling stage, and the segmentation effect was less satisfactory (Felzenszwalb and Huttenlocher, 2004). Moreover, due to large number of wheat plants during the grain filling stage, the spikes overlapped with each other, which increased the difficulty in extracting shape features as well. According to field observation, wheat spikes changed substantially in color during the grain filling stage, namely, from green to yellowish green, while the stalks and leaves still remain green. So, color features were fit for wheat spike image segmentation at this stage, which was in agreement with previous researches. Besides, most of the image segmentation algorithms were based on pixels while ignoring the inherent spatial relationship between the pixels. As a result, the image processing effect was poor under non-structured natural scenes (Zhang et al., 2017). Recent years have witnessed an increasing application of remote sensing technology. For large-scale remote sensing images, pixel-based segmentation could hardly meet the requirements on calculation efficiency. Compared with pixels, superpixels had the following advantages: effective utilization of spatial relationship between pixels, reducing object scale and complexity of subsequent processing, while increasing processing efficiency (Alex et al., 2009; Derksen et al., 2019). Based on previous studies (Mangasarian and Wild, 2006; Xiong et al., 2017), we used superpixel segmentation for image pre-processing and extracted color information as wheat spike features, so as to improve the wheat spike recognition effect.
Then, based on the extracted image features, SVM and KNN classifiers were applied to wheat spike recognition, respectively. The results showed that the SVM classifier outperformed KNN classifier under a single nitrogen fertilizer application level and had higher classification accuracy. But for mixed samples, the accuracy of KNN classifier was higher than that of SVM classifier. SVM, built upon the theory of statistical learning, was more adapted to the classification problems with small sample size, non-linearity and high dimensionality. However, the recognition effect might be poor when applied to the classification problems with large number of training samples and support vectors (Weinberger et al., 2009). KNN, a classical lazy learning algorithm, usually has the features of large computation load and low efficiency, but for samples with much overlap or of large scale, it might be a favored method (Zhang and Zhou, 2007). In this study, SVM classifier outperformed the KNN classifier when the sample size was small, while KNN classifier was better in the case of larger sample size, which is typical of the two types of classifiers.
Moreover, recognition results under different nitrogen fertilizer application levels indicated a worse wheat spike recognition effect without nitrogen fertilizer application than with nitrogen fertilizer application. Wheat seedlings grown on nitrogen-deficient soils would have tender stalks and yellowish green leaves, stalks and spikes. In that case, the use of color features extracted from the images for wheat spike recognition would lead to misclassification and poor recognition effect. Moreover, Nitrogen status affects the accumulation of dry matter and nitrogen in the spike (Demotes-Mainard and Jeuffroy, 2004). Wheat spikes are short and small when nitrogen is deficient. They might be easily misinterpreted as background fragments and removed in post-classification processing, leading to severe missed classification. That is why the wheat spike recognition effect is poor without nitrogen fertilizer application.
Here, digital images of wheat in field environment during the grain filling stage were subject to classification. After flowering, the grains were fertilized and the spikes kept expanding in size. During the grain filling stage, the spikes would finally grow to its maximum size, and spikes would be the main components in the digital images at this stage. But in the flowering stage, leaves took up higher proportion in the images, while the proportion of spikes were lower, which was not conducive to feature extraction and analysis. During the maturity stage after the grain fillings stage, as the grains mature and leaves age, the wheat seedlings on the whole showed a golden color, with little distinction between the spikes and stalks. Moreover, due to disturbance from the soil background in the images, it was difficult to extract image features. Therefore, we believed that the grain filling stage was the optimal time for wheat spike recognition. Given the distinct morphology and color changes of wheat during the grain filling stage, we only chose digital images of wheat during this single stage. Field image analysis and wheat spike recognition of wheat during multiple reproductive stages were worthy of further investigation. Field environment might be complex for wheat spike image acquisition due to a diversity of leave and wheat spike postures, which further leaded to variation of illumination conditions even for the same spikes. As the color features of spikes in the images vary significantly, the accuracy of image segmentation based on color features would be impaired. All of the above factors could affect the wheat spike recognition effect, and more studies should be conducted to find out an appropriate method for image acquisition and processing which better represents wheat spike feature. The methods are important for improving the wheat spike recognition effect and accuracy of wheat spike number estimate.
Furthermore, through color histogram analysis, wheat spikes during the grain filling stage were effectively recognized based on color features Eg and Dgr. As compared with pixel-based segmentation, segmentation based on superpixel block produced more intact wheat spike morphology, better preserved edge information and reduced missed classification. The growth status of wheat seedlings varied under different nitrogen fertilizer application levels. The best wheat spike recognition effect was achieved under higher nitrogen fertilizer application level (Ahigh = 94.2%), and the effect was also good under normal (Anormal = 93.1%) and low (Alow = 92.8%) nitrogen fertilizer application levels. The recognition effect was the worst without nitrogen fertilizer application (Ano nitrogen = 80.8%). For mixed samples, after excluding those under no nitrogen fertilizer application, the wheat spike number estimate was improved significantly, with accuracy reaching up to 93.8%, which was a 10.1% increase. To conclude, automatic wheat spike number estimate based on superpixel segmentation and color features is a rapid and accurate method that applies to the general field environment. However, this method is not recommended for use when the growth status of wheat is poor or when the regions are of high heterogeneity.
Deep learning methods have been currently very popular (Sadeghi-Tehran et al., 2019), but their methods are mainly based on a large amount of sample data and high-configuration hardware. Sample preparation requires a lot of manpower and time. Compared with the complex neural network algorithms, this method based on traditional machine vision superpixel segmentation is more easily accepted. It is not limited by the performance of hardware computing, simple and efficient, and has certain stability. This experimental method has high accuracy in wheat spikes recognition and is suitable for popularization and application.
Data Availability Statement
All datasets generated for this study are included in the article/supplementary material.
Author Contributions
CT and WG conceived the research. CT, PZ, and XZ designed and performed the experiments. CT, YZ, YD, and ZW prepared and revised the manuscript. CT and DW analyzed the data. WM and WL provided technical. All authors discussed the results and commented on the manuscript.
Funding
This work was financially supported in part by the National Key Research and Development Program of China (2018YFD0300805), the National Natural Science Foundation of China (41271415 and 31771711), the Project Funded by China Postdoctoral Science Foundation (2019M650125), and the Priority Academic Program Development of Jiangsu Higher Education Institutions (PAPD).
Conflict of Interest
The authors declare that the research was conducted in the absence of any commercial or financial relationships that could be construed as a potential conflict of interest.
Acknowledgments
The authors are thankful to PAPD, the Co-innovation Center for Modern Production Technology of Grain Crops for Jiangsu Province and the reviewers and editor for their valuable comments in improving the quality of the manuscript.
References
Aggelopoulou, A. D., Bochtis, D., Fountas, S., Swain, K. C., Gemtos, T. A., and Nanos, G. D. (2011). Yield prediction in apple orchards based on image processing. Precis. Agric. 12, 448–456. doi: 10.1007/s11119-010-9187-0
Aguate, F., Trachsel, S., Pérez, L. G., Burgueño, J., Crossa, J., Balzarini, M., et al. (2017). Use of hyperspectral image data outperforms vegetation indices in prediction of maize yield. Crop Sci. 57, 5–37. doi: 10.2135/cropsci2017.01.0007
Akyilmaz, E., and Leloglu, U. (2016). Segmentation of SAR images using similarity ratios for generating and clustering superpixels. Electron. Lett. 52, 654–656.
Alex, L., Adrian, S., Kutulakos, K. N., Fleet, D. J., Dickinson, S. J., and Kaleem, S. (2009). TurboPixels: fast superpixels using geometric flows. IEEE Trans. Pattern Anal. Mach. Intell. 31, 2290–2297. doi: 10.1109/TPAMI.2009.96
Balasubramaniam, P., and Ananthi, V. P. (2016). Segmentation of nutrient deficiency in incomplete crop images using intuitionistic fuzzy C-means clustering algorithm. Nonlinear Dynam. 83, 849–866. doi: 10.1007/s11071-015-2372-y
Boissard, P., Martin, V., and Moisan, S. (2008). A cognitive vision approach to early pest detection in greenhouse crops. Comput. Electron. Agric. 62, 81–93. doi: 10.1016/j.compag.2007.11.009
Caelli, T., and Reye, D. (1993). On the classification of image regions by colour, texture and shape. Pattern Recogn. 26, 461–470. doi: 10.1016/0031-3203(93)90102-3
Chaerle, L., and Straeten, D. V. D. (2000). Imaging techniques and the early detection of plant stress. Trends Plant Sci. 5, 495–501. doi: 10.1016/S1360-1385(00)01781-7
Clevers, J. G. P. W., and Leeuwen, H. J. C. V. (1996). Combined use of optical and microwave remote sensing data for crop growth monitoring. Remote Sens. Environ. 56, 42–51. doi: 10.1016/0034-4257(95)00227-8
Cremers, D., Rousson, M., and Deriche, R. (2007). A review of statistical approaches to level set segmentation: integrating color, texture, motion and shape. Int. J. Comput. Vision. 72, 195–215. doi: 10.1007/s11263-006-8711-1
Delgado-Friedrichs, O., Robins, V., and Sheppard, A. (2015). Skeletonization and partitioning of digital images using discrete morse theory. IEEE Trans. Pattern Anal. Mach. Intell. 37, 654–666. doi: 10.1109/TPAMI.2014.2346172
Demotes-Mainard, S., and Jeuffroy, M. (2004). Effects of nitrogen and radiation on dry matter and nitrogen accumulation in the spike of winter wheat. Field Crop. Res. 87, 221–233. doi: 10.1016/j.fcr.2003.11.014
Derksen, D., Inglada, J., and Michel, J. (2019). Scaling up SLIC superpixels using a tile-based approach. IEEE T. Geosci. Remote. 1, 3073–3085. doi: 10.1109/TGRS.2018.2880248
Ding, W., and Taylor, G. (2016). Automatic moth detection from trap images for pest management. Comput. Electron. Agric. 123, 17–28. doi: 10.1016/j.compag.2016.02.003
Dunn, G. M., and Martin, S. R. (2010). Yield prediction from digital image analysis: a technique with potential for vineyard assessments prior to harvest. Aust. J. Grape Wine Res. 10, 196–198. doi: 10.1111/j.1755-0238.2004.tb00022.x
Felzenszwalb, P. F., and Huttenlocher, D. P. (2004). Efficient graph-based image segmentation. Int. J. Comput. Vision. 59, 167–181. doi: 10.1023/B:VISI.0000022288.19776.77
Fernandez-Gallego, J. A., Kefauver, S. C., Gutiérrez, N. A., Nieto-Taladriz, M. T., and Araus, J. L. (2018). Wheatear counting in-field conditions: high throughput and low-cost approach using RGB images. Plant Methods 14:22. doi: 10.1186/s13007-018-0289-4
Hosoi, F., and Omasa, K. (2009). Estimating vertical plant area density profile and growth parameters of a wheat canopy at different growth stages using three-dimensional portable lidar imaging. ISPRS-J. Photogramm. Remote Sens. 64, 151–158. doi: 10.1016/j.isprsjprs.2008.09.003
Jin, X., Liu, S., Frederic, B., Hemerle, M., and Comar, A. (2017). Estimates of plant density of wheat crops at emergence from very low altitude UAV imagery. Remote Sens. Environ. 198, 105–114. doi: 10.1016/j.rse.2017.06.007
Kavzoglu, T., and Tonbul, H. (2018). An experimental comparison of multi-resolution segmentation, SLIC and K-means clustering for object-based classification of VHR imagery. Int. J. Remote Sens. 39, 1–17.
Li, Q., Cai, J., Berger, B., Okamoto, M., and Miklavcic, S. J. (2017). Detecting spikes of wheat plants using neural networks with Laws texture energy. Plant Methods 13, 83–96. doi: 10.1186/s13007-017-0231-1
Liu, W. Y., Hua, L., and Zhu, G. X. (2001). A fast algorithm for corner detection using the morphologic skeleton. Pattern Recogn. Lett. 22, 891–900. doi: 10.1016/S0167-8655(01)00029-0
Lópezgranados, F., Juradoexpósito, M., Peñabarragán, J. M., and Garcíatorres, L. (2006). Using remote sensing for identification of late-season grass weed patches in wheat. Weed Sci. 54, 346–353. doi: 10.1043/0043-1745200654
Mangasarian, O. L., and Wild, E. W. (2006). Multisurface proximal support vector machine classification via generalized eigenvalues. IEEE Trans. Pattern Anal. Mach. Intell. 28, 69–74. doi: 10.1109/TPAMI.2006.17
Moffett, K. B., and Gorelick, S. M. (2013). Distinguishing wetland vegetation and channel features with object-based image segmentation. Int. J. Remote Sens. 34, 1332–1354. doi: 10.1080/01431161.2012.718463
Mukherjee, D., Wu, Q. M. J., and Wang, G. (2015). A comparative experimental study of image feature detectors and descriptors. Mach. Vis. Appl. 26, 443–466. doi: 10.1007/s00138-015-0679-9
Nerson, H. (1980). Effects of population density and number of ears on wheat yield and its components. Field Crop. Res. 3, 225–234. doi: 10.1016/0378-4290(80)90031-3
Neuman, M., Sapirstein, H. D., Shwedyk, E., and Bushuk, W. (1987). Discrimination of wheat class and variety by digital image analysis of whole grain samples. J. Cereal Sci. 6, 125–132. doi: 10.1016/S0733-5210(87)80049-8
Pantazi, X. E., Moshou, D., and Bravo, C. (2016). Active learning system for weed species recognition based on hyperspectral sensing. Biosyst. Eng. 146, 193–202. doi: 10.1016/j.biosystemseng.2016.01.014
Possa, P. R., Mahmoudi, S. A., Harb, N., Valderrama, C., and Manneback, P. (2014). A multi-resolution FPGA-based architecture for real-time edge and corner detection. IEEE T. Comput. 63, 2376–2388. doi: 10.1109/TC.2013.130
Radhakrishna, A., Appu, S., Kevin, S., Aurelien, L., Pascal, F., and Sabine, S. (2012). SLIC superpixels compared to state-of-the-art superpixel methods. IEEE Trans. Pattern Anal. Mach. Intell. 34, 2274–2282. doi: 10.1109/TPAMI.2012.120
Sadeghi-Tehran, P., Virlet, N., Ampe, E., Reyns, P., and Hawkesford, M. (2019). DeepCount: in-field automatic quantification of wheat spikes using simple linear iterative clustering and deep convolutional neural networks. Front. Plant Sci. 10:1176. doi: 10.3389/fpls.2019.01176
Salazar, L., Kogan, F., and Roytman, L. (2007). Use of remote sensing data for estimation of winter wheat yield in the United States. Int. J. Remote Sens. 28, 3795–3811. doi: 10.1080/01431160601050395
Schirrmann, M., Giebel, A., Gleiniger, F., Pflanz, M., and Dammer, K. H. (2016). Monitoring agronomic parameters of winter wheat crops with low-cost UAV imagery. Remote Sens. 8, 706–725. doi: 10.3390/rs8090706
Senthilkumar, T., Jayas, D. S., White, N. D. G., Fields, P. G., and Gräfenhan, T. (2017). Detection of ochratoxin A contamination in stored wheat using near-infrared hyperspectral imaging. Infrared Phys. Techn. 81, 228–235. doi: 10.1016/j.infred.2017.01.015
Shahin, M. A., and Symons, S. J. (2011). Detection of fusarium damaged kernels in Canada western red spring wheat using visible/near-infrared hyperspectral imaging and principal component analysis. Comput. Electron. Agric. 75, 107–112. doi: 10.1016/j.compag.2010.10.004
Siddique, K. H. M., and Whan, B. R. (1993). Ear:stem ratios in breeding populations of wheat: significance for yield improvement. Euphytica 73, 241–254. doi: 10.1007/bf00036703
Silva, F. D. F. D., Luz, P. H. C., Romualdo, L. M., Marin, M. A., and Bruno, O. M. (2014). A diagnostic tool for magnesium nutrition in maize based on image analysis of different leaf sections. Crop Sci. 54, 738–757. doi: 10.2135/cropsci2013.03.0165
Stajnko, D., Lakota, M., and Hočevar, M. (2004). Estimation of number and diameter of apple fruits in an orchard during the growing season by thermal imaging. Comput. Electron. Agric. 42, 31–42. doi: 10.1016/s0168-1699(03)00086-3
Tellaeche, A., Pajares, G., Burgos-Artizzu, X. P., and Ribeiro, A. (2011). A computer vision approach for weeds identification through support vector machines. Appl. Soft Comput. 11, 908–915. doi: 10.1016/j.asoc.2010.01.011
Walter, J., Edwards, J., Mcdonald, G., and Kuchel, H. (2017). Photogrammetry for the estimation of wheat biomass and harvest index. Field Crop. Res. 216, 165–174. doi: 10.1016/j.fcr.2017.11.024
Wang, Y., Wang, D., Zhang, G., and Wang, J. (2013). Estimating nitrogen status of rice using the image segmentation of G-R thresholding method. Field Crop. Res. 149, 33–39. doi: 10.1016/j.fcr.2013.04.007
Weinberger, K. Q., Blitzer, J., and Saul, L. K. (2009). Distance metric learning for large margin nearest neighbor classification. J. Mach. Learn. Res. 10, 207–244. doi: 10.1007/s10845-008-0108-2
Xiong, X., Duan, L., Liu, L., Tu, H., Yang, P., Wu, D., et al. (2017). Panicle-SEG: a robust image segmentation method for rice panicles in the field based on deep learning and superpixel optimization. Plant Methods 13, 104–116. doi: 10.1186/s13007-017-0254-7
Zhang, H., Turner, N. C., Poole, M. L., and Asseng, S. (2007). High ear number is key to achieving high wheat yields in the high-rainfall zone of south-western Australia. Crop Pasture Sci. 58, 21–27.
Zhang, M. L., and Zhou, Z. H. (2007). ML-KNN: a lazy learning approach to multi-label learning. Pattern Recogn. 40, 2038–2048. doi: 10.1016/j.patcog.2006.12.019
Zhang, Y., Li, X., Gao, X., and Zhang, C. (2017). A simple algorithm of superpixel segmentation with boundary constraint. IEEE Trans. Circuits Syst. Video Technol. 27, 1502–1514. doi: 10.1109/TCSVT.2016.2539839
Zhou, C., Dong, L., Yang, X., Hao, Y., Yue, J., and Yang, G. (2018). Wheatears counting in field conditions based on multi-feature optimization and TWSVM. Front. Plant Sci. 9:1024. doi: 10.3389/fpls.2018.01024
Keywords: wheat spike, recognition, superpixel segmentation, digital images, estimation
Citation: Tan C, Zhang P, Zhang Y, Zhou X, Wang Z, Du Y, Mao W, Li W, Wang D and Guo W (2020) Rapid Recognition of Field-Grown Wheat Spikes Based on a Superpixel Segmentation Algorithm Using Digital Images. Front. Plant Sci. 11:259. doi: 10.3389/fpls.2020.00259
Received: 27 September 2019; Accepted: 19 February 2020;
Published: 06 March 2020.
Edited by:
Xiyin Wang, North China University of Science and Technology, ChinaReviewed by:
Jitendra Kumar, University of Minnesota Twin Cities, United StatesShailender Kumar Verma, Central University of Himachal Pradesh, India
Copyright © 2020 Tan, Zhang, Zhang, Zhou, Wang, Du, Mao, Li, Wang and Guo. This is an open-access article distributed under the terms of the Creative Commons Attribution License (CC BY). The use, distribution or reproduction in other forums is permitted, provided the original author(s) and the copyright owner(s) are credited and that the original publication in this journal is cited, in accordance with accepted academic practice. No use, distribution or reproduction is permitted which does not comply with these terms.
*Correspondence: Changwei Tan, dGFud2VpMDEwQDEyNi5jb20=; Wenshan Guo, Z3Vvd3NAeXp1LmVkdS5jbg==
†These authors have contributed equally to this work