 Alessio Scalisi
 Giulia Marino
 Francesco Paolo Marra
 Tiziano Caruso
 Riccardo Lo Bianco
- 1Department of Agricultural, Food and Forest Sciences (SAAF), University of Palermo, Palermo, Italy
- 2Agriculture Victoria, Department of Jobs, Precincts and Regions, Tatura, VIC, Australia
- 3Department of Plant Sciences, University of California, Davis, Davis, CA, United States
Sustainable irrigation is crucial to reduce water use and management costs in modern orchard systems. Continuous plant-based sensing is an innovative approach for the continuous monitoring of plant water status. Olive (Olea europaea L.) genotypes can respond to drought using different leaf and fruit physiological and morphological mechanisms. This study aimed to identify whether fruit and leaf water dynamics of two different olive cultivars were differently affected by water deficit and their response to changes of midday stem water potential (Ψstem), the most common indicator of plant water status. Plant water status indicators such as leaf stomatal conductance (gs) and Ψstem were measured in the Sicilian olive cultivars Nocellara del Belice (NB) and Olivo di Mandanici (MN), in stage II and III of fruit development. Fruit gauges and leaf patch clamp pressure probes were mounted on trees and their raw data were converted in relative rates of fruit diameter change (RRfruit) and leaf pressure change (RRleaf), sensitive indicators of tissue water exchanges. The analysis of diel, diurnal and nocturnal fluctuations of RRfruit and RRleaf highlighted differences, often opposite, between the two cultivars under water deficit. A combination of statistical parameters extrapolated from RRfruit and RRleaf diurnal and nocturnal curves were successfully used to obtain significant multiple linear models for the estimation of midday Ψstem. Fruit and leaf water exchanges suggest that olive cultivar can either privilege fruit or leaf water status, with MN likely preserving leaf water status and NB increasing fruit tissue elasticity under severe water deficit. The results highlight the advantages of the integration of fruit and leaf water dynamics to estimate plant water status and the need for genotype-specific models in olive.
Introduction
In recent years, sustainable irrigation has become a crucial aspect of orchard management to reduce inputs in agricultural systems. In the current global warming and desertification scenario, both environmentally and economically oriented reasons provide the basis for a water saving approach, which has become paramount in irrigated orchards. Automated irrigation management is even more important in high-density systems in which growers tend to increase orchard productivity and reduce management costs by mechanizing operations. In the past, irrigation management was commonly based on soil water status or environmental indices. However, tree water status provides the most precise drought stress indices, in spite of soil and environmental conditions. Indeed, plants represent the intermediate component of the soil-plant-atmosphere continuum, and their physiological responses are the result of an integration of both soil and environment. This implies an advantage of plant-based over soil-based methods for an accurate irrigation scheduling (Fernández, 2017).
Plant water requirements differ among species and even cultivars, making irrigation scheduling and management a complex task for growers. The physiological responses of plants to decreasing water availability are various and depend on evolutionary adaptation and acclimation to new climatic conditions. The olive species (Olea europaea L.) has a very wide genetic pool, and includes genotypes that can respond to drought using different mechanisms of leaf dehydration tolerance and leaf morphological and structural adaptations (Bacelar et al., 2004, 2006; Ennajeh et al., 2010; Lo Bianco and Scalisi, 2017; Scalisi et al., 2019a). Gucci et al. (2000) and Lo Bianco and Scalisi (2017) found different leaf stomatal regulation among olive cultivars. Connor (2005) suggested that olive genotypes use avoidance (i.e., low leaf conductance, low leaf area, low xylem hydraulic conductivity and large roots) and tolerance mechanisms (i.e., high turgor through cell osmotic adjustments, small cell size, and changes in cell-wall elasticity) under drought. Midday stem water potential (Ψstem) is considered a very sensitive parameter of plant water status for irrigation management (Moriana and Fereres, 2002; Fernández et al., 2006; Moriana et al., 2012, Marino et al., 2018). However, Ψstem is mostly measured by the Scholander pressure chamber, which does not allow for continuous monitoring and automated irrigation.
Recently, plant-based sensing technologies are taking hold for the continuous plant water status monitoring in fruit trees. In most of cases, sensors are mounted on aboveground organs such as stem, fruit and leaves (Fernández, 2014, 2017; Scalisi et al., 2017). In olive, trunk dendrometers have been associated with tree water stress thresholds and proposed for irrigation management due to their relatively easy installation and stability across the season (Moreno et al., 2006; Cuevas et al., 2010; Fernández et al., 2011b).
In the last few years, emphasis has been given to the use of leaf patch clamp pressure (LPCP) probes for the continuous assessment of olive leaf water status (Fernández et al., 2011a; Ehrenberger et al., 2012; Rodriguez-Dominguez et al., 2012, 2019; Marino et al., 2016; Padilla-Díaz et al., 2016; Fernándes et al., 2017). The output of LPCP probes is expressed as attenuated pressure of leaf patches (pp), which is inversely related to cell turgor pressure (pc) (Zimmermann et al., 2008). Therefore, the highest values of pp occur around solar noon, as that is the moment in which leaf cell turgor is the lowest. Ben-Gal et al. (2010) found an inversion of the pp curve in severely drought-stressed olive trees. Thereafter, Fernández et al. (2011a) classified water deficit states based on the degree of inversion of the curve. State I represented no drought stress and leaves with a non-inverted curve, state II grouped leaves experiencing partial inversion of the curve and mild water deficit, and state III enclosed all leaves experiencing severe water deficit and full inversion of the curve.
Fruit-based probes based on linear variable displacement transducers (LVDTs) can provide good information on fruit growth, which on a diel scale is mostly dominated by water in- and out-flows, rather than carbon gain; thus, fruit diameter (FD) variations respond to water deficit (Scalisi et al., 2017). Fernandes et al. (2018) studied olive FD dynamics in response to water deficit, suggesting the appropriateness of fruit gauges for continuous plant water status monitoring. Although FD and pp are strictly related to soil water availability and plant water status, they are also influenced by environmental variables, crop load, genetic factors and phenology. The derived values of FD and pp (namely relative rate of fruit diameter change, RRfruit and relative rate of leaf pressure change, RRleaf) represent good indicators of the rate at which water enters and exits leaf or fruit, respectively. The reasoning behind this assumption resides in the fact that they both represents rates of changes – pressure and diameter, respectively – from an initial state, which, in the short term (≤15-minute intervals) are mainly driven by tissue water exchanges. The combined use of RRfruit and RRleaf was recently introduced to estimate water deficit in nectarine (Scalisi et al., 2019b, c). Plants modulate water movements to and from the two main transpiring organs (i.e., leaf and fruit) using several strategies such as osmotic adjustments, stomatal closure or cell-wall elasticity regulation. As a result, we hypothesized that either leaf or fruit water status might be privileged under increasing water deficit in olive genotypes with different drought tolerance/avoidance mechanisms.
This work aimed to study olive fruit and leaf water dynamics in relation to tree water status. Our hypothesis was that, similarly to what found in nectarine (Scalisi et al., 2019c), the combination of RRfruit and RRleaf might provide an even more accurate identification of plant water status, rather than monitoring each parameter independently. In addition, this study aimed to identify cultivar-specific RRfruit/RRleaf relationships to determine whether the genotypes under study preserve leaf or fruit water exchanges under increasing water deficit, as sink power for water might differ among genotypes.
Materials and Methods
Experimental Design
The experiment was carried out in summer 2016 in a high-density (6 × 3 spacing, ∼ 555 trees/ha) olive orchard located near Sciacca, in South-western Sicily (37°29′56.8″ N and 13°12′13.4″ E, 138 m a.s.l.). Three-year-old self-rooted trees were trained to “free palmette” along a hedgerow in North-to-South rows. The experimental orchard is part of a large survey on the Sicilian autochthonous germplasm (Marino et al., 2019). Olive alternates high and low cropping seasons and this experiment considered only trees in an ON-year (heavy crop load). In this trial, the two Sicilian cultivars Nocellara del Belice (NB) and Olivo di Mandanici (MN) were selected for their different vigor and fruit characteristics (Marino et al., 2016, 2017). Trees belonging to NB have low vigor, spreading canopy habit and yield large fruit, mainly processed as table olives, whereas MN trees show high vigor, upright canopy habit and yield smaller fruit, exclusively utilized for olive oil extraction. NB trees are particularly sensitive to leaf dehydration (Lo Bianco and Scalisi, 2017) and to water deficit overall (Scalisi et al., 2019a). The soil was a sandy clay loam (60% sand, 18% silt, and 22% clay) with pH of 7.7 and <5% of active carbonates. Trees were regularly fertilized and pruned according to conventional practices.
Meteorological data were retrieved from the meteorological station of Sciacca (Servizio Informativo Agrometeorologico Siciliano). Reference evapotranspiration (ET0) and vapor pressure deficit (VPD) were calculated using the methods described by Allen et al. (1998). Crop evapotranspiration (ETc) was estimated by weighing ET0 with an average Kc of 0.50 ± 0.05 (Allen et al., 1998).
Trees were irrigated at weekly intervals using self-compensating in-line drippers delivering 16 L/h. Four irrigation levels were imposed to generate a large variability in tree water status: full irrigation (FI) supplied with a volume of water equal to 100% of ETc, and three sustained deficit irrigation levels at 66% (DI-66), 33% (DI-33), and 0% (DI-0) of FI. Six, four, two and no drippers per plant were used for FI, DI-66, DI-33, and DI-0, respectively. Trees were arranged according to a completely randomized experimental design, with twelve tree-replicate per cultivar, and three trees for each irrigation level. Measurements were carried out at stages II (pit-hardening) and III (cell enlargement) of fruit development, as during the stage I (mid-May/beginning July) spring rainfall saturated the soil and canceled any possible effect of deficit irrigation. Data are reported in local time.
Plant Water Status
Leaf stomatal conductance (gs) was measured using a Delta-T AP4 dynamic porometer (Delta-T Devices LTD, Cambridge, United Kingdom) on three sun-exposed leaves in three trees per irrigation level. Daily measurements of gs were taken at 2-hour intervals, from 0800 to 2000 h in a day at stage II (day of the year, DOY = 209) and from 0800 to 1800 h in a day at stage III (DOY = 287).
A pressure chamber (PMS Instrument Co., Corvallis, OR, United States) was used for the determination of Ψstem, on twigs covered by plastic and aluminum foil 1 h before measurement, as described by Turner (1988). Daily measurements of Ψstem were carried out on three twigs per tree, on the same trees and DOY of gs measurements, at 2-hour intervals and from pre-dawn (0430 h) to 2000 h at DOY 209, and to 1800 h at DOY 287. Midday Ψstem was measured at around 1400 h, once a week from 196 to 287 DOY, and using three twigs per tree.
Fruit- and Leaf-Based Sensing
The fruit gauges based on LVDT sensors described by Morandi et al. (2007) were installed on olive drupes for continuous FD measurements. Gauges were wired to four CR-1000 data loggers (Campbell scientific, Inc., Logan, UT, United States) and data were downloaded manually. A total of 16 gauges (eight on each cultivar, two trees per irrigation level) were mounted on sun exposed fruit at medium canopy height (1.5 m above ground). In addition, early in the morning, LPCP probes (Yara International, Oslo, NO, United States) were clamped on sun exposed, mature leaves for continuous measurement of pp. LPCP clamping was done a day after irrigation to ensure optimal leaf turgor, carefully avoiding central leaf nerves and placing the piezoresistive sensor on the abaxial side of leaves. The initial LPCP clamping pressure ranged from 15 to 25 kPa. Data of pp were recorded continuously and sent to an online server through a system equipped with radio transmitters and a main GPRS/radio controller. LPCP probes were mounted on leaves nearby the fruit monitored with fruit gauges, using the same number of sensors (i.e., 16). Both fruit gauges and LPCP probes were mounted on the same trees used for gs and Ψstem measurements.
Fruit gauges and LPCP probes were set to record FD and pp at 15-minute intervals for 8 days at fruit growth stages II and III. A buffer period corresponding to the first 3 days after sensor mounting was discarded to allow adjustments and/or re-clamping in fruit and leaves. Raw FD and pp data were processed using a 15-point convoluted spline function (Savitzky and Golay, 1964) to smooth the sensor signal and erase noise. Following data filtering, FD and pp values were standardized by using z-scores [i.e., z = (x−mean)/standard deviation) to allow comparison among fruits with different initial diameter or leaf with different initial turgor pressure when sensors were mounted. After standardization, FD and pp obtained from different sensors on the same tree were averaged. Second derivatives of FD and pp were calculated to determine RRfruit and RRleaf as shown in Eqs. 1, 2, respectively. A standardization of RRfruit and RRleaf was not carried out as they are based on standardized FD and pp, allowing possible comparisons among outputs from different sensors.
where, FD2 and FD1 are FD at time 2 (t2) and 1 (t1), and pp2 and pp1 are pp at t2 and t1, respectively.
Diel data were subdivided in diurnal (0600 to 2000 h) and nocturnal (2015 to 0545 h) intervals. Subsequently, diel, diurnal and nocturnal statistical parameters were extrapolated from data series for RRfruit and RRleaf in order to find the best predictor of midday Ψstem. The parameters considered for each time interval (i.e., 24 h, night or day) were: (a) the minimum value (MIN), (b) the maximum value (MAX), (c) the summation of values at 15-minute intervals (SUM), and (d) the difference between MAX and MIN (RANGE). The relative standard deviation (standard deviation divided by the mean, RSD) was calculated as an additional parameter to allow comparison among variances expressed in different units. A graphical representation of all RRfruit statistical parameters calculated on diel basis is shown in Figure 1. Similarly, all parameters were calculated for diurnal and nocturnal intervals. Raw data obtained from sensors that either caused damage to the organs or that were displaced by strong wind were discarded.
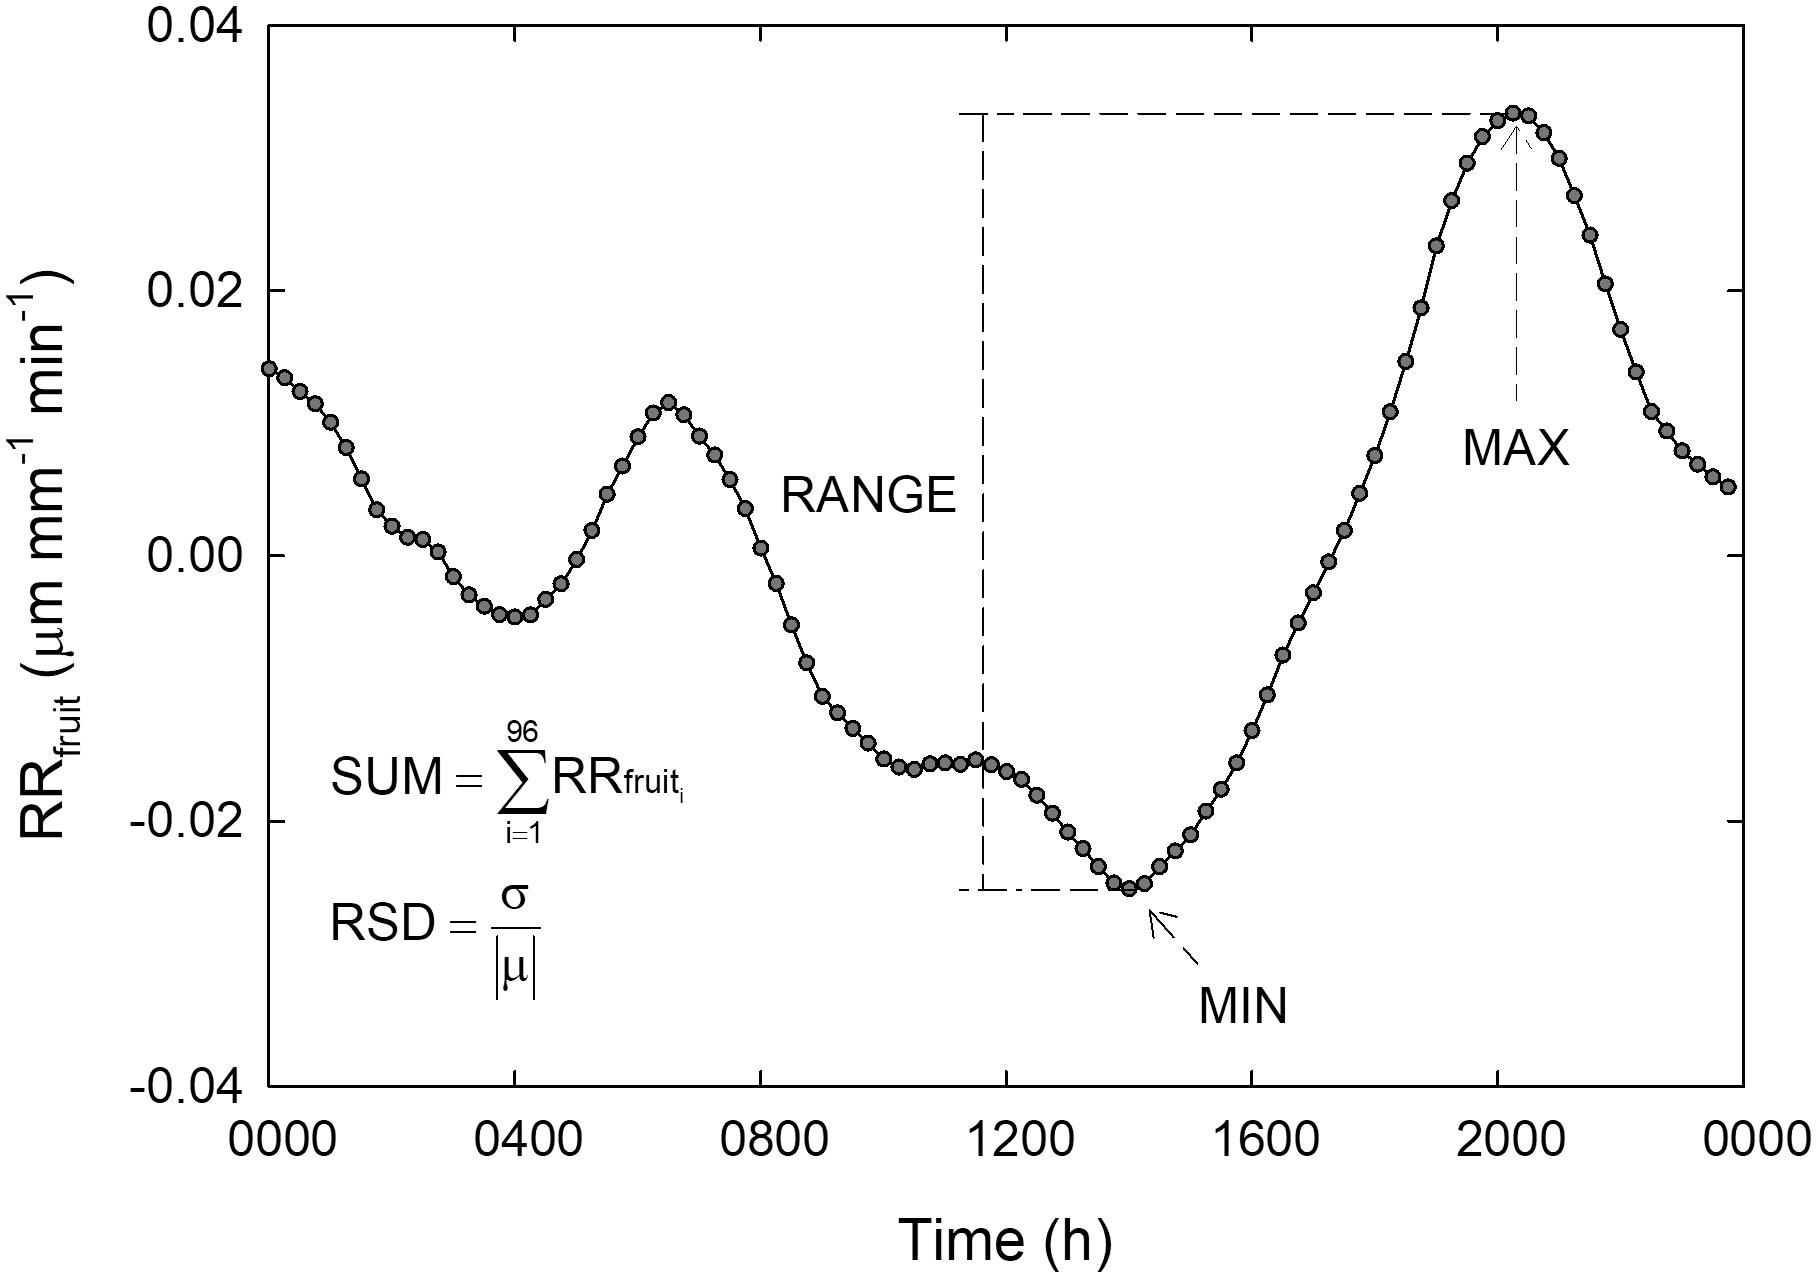
Figure 1. Schematization of statistical parameters calculated on a relative rate of fruit diameter change (RRfruit) diel curve. MIN = minimum value of RRfruit, MAX = maximum value of RRfruit, RANGE = MAX-MIN, SUM = summation of RRfruit values taken at 15-minute intervals from 1 (0000 h) to 96 (2345 h), RSD = relative standard deviation, where σ is the standard deviation and —μ— is the absolute value of the mean.
For each cultivar, the statistical parameters from nocturnal and diurnal timeframes were fitted into multiple regression models to predict midday Ψstem. A backward stepwise procedure was used to discard the parameters that did not significantly contribute to Ψstem estimation.
Results and Discussion
Weather Conditions and Irrigation
As expected, temperature (T) and vapor pressure deficit (VPD) were the highest in the measured fraction of stage II, as it occurred in full summer (Jul 8 to Sep 8) (Figure 2A). Relatively low T and VPD were recorded in stage III from 280 to 290 DOY (Figure 2A), due to frequent precipitations. In stage II, only sporadic rainfall occurred, and irrigation was approximately constant, ranging from 19 to 26 mm per week in FI trees. Lower weekly volumes of water were supplied in stage III due to the precipitations occurred from 252 to 289 DOY (Figure 2B). However, at this stage, precipitation led to an average higher weekly crop water supply (CWS, i.e., irrigation + rainfall) compared to stage II (Figure 2B). Specifically, in stage II the total CWS was mainly made up of irrigation water (Table 1), whereas precipitations at stage III contributed to the 63, 72, 83, and 100% of CWS in FI, DI-66, DI-33, and DI-0 trees, respectively.
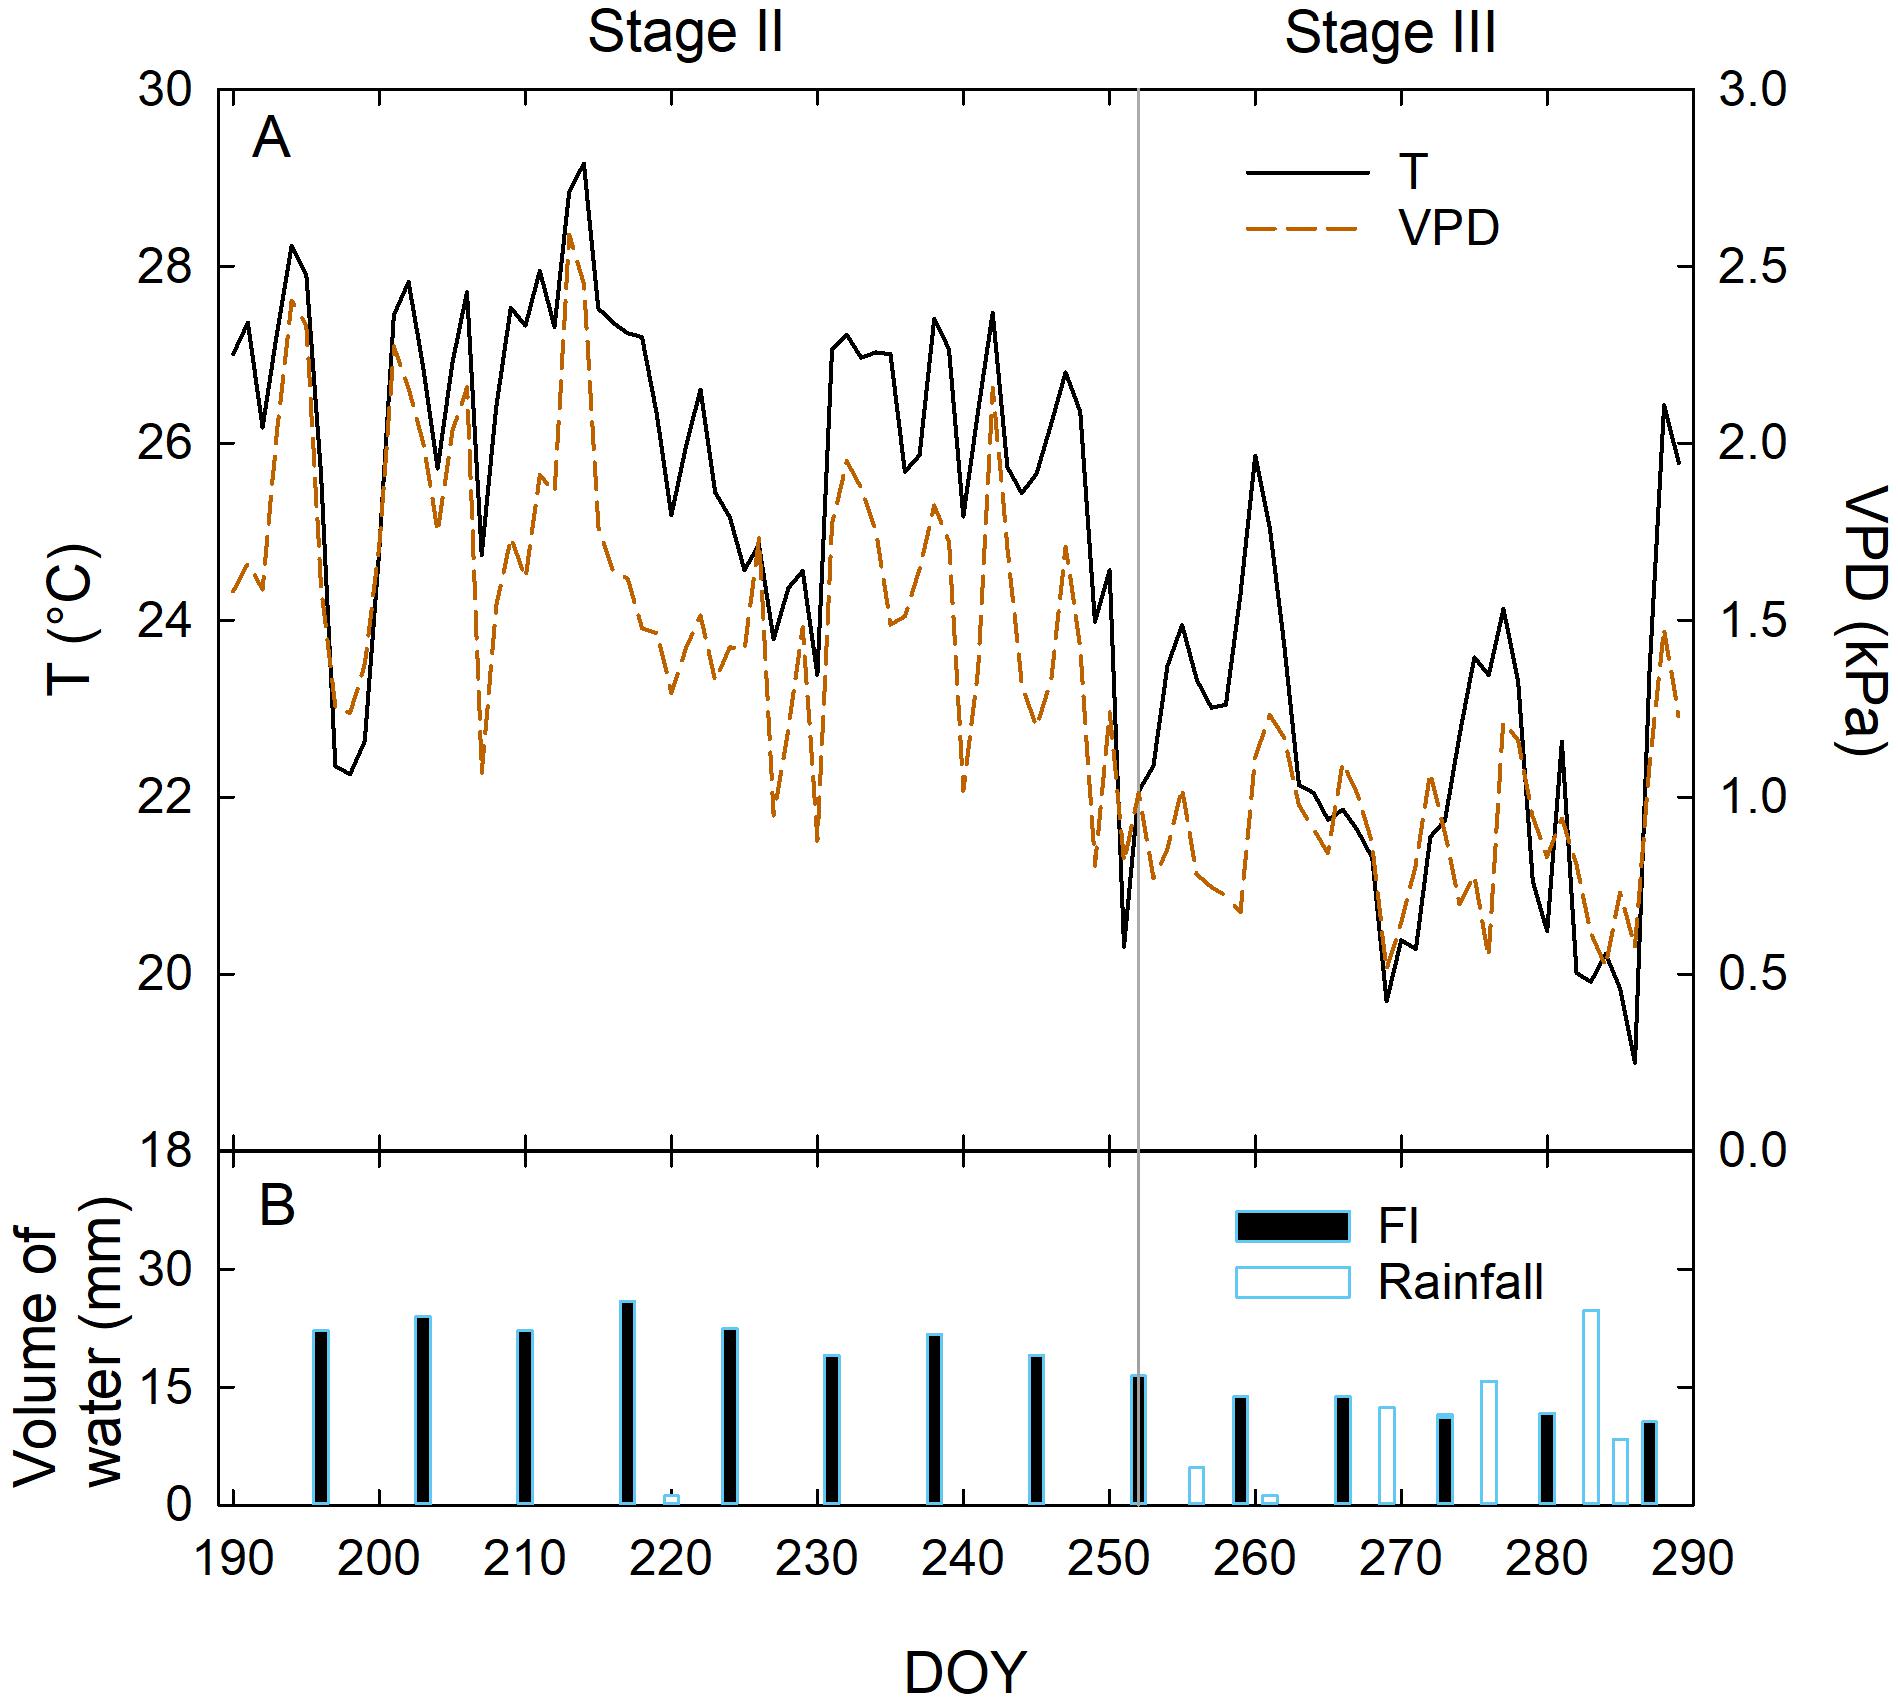
Figure 2. Daily mean temperature (T) and vapor pressure deficit (VPD) (A), daily volumes of water supplied with full irrigation (FI) and rainfall (B) at fruit growth stages II and III, from 190 to 290 days of the year (DOY).
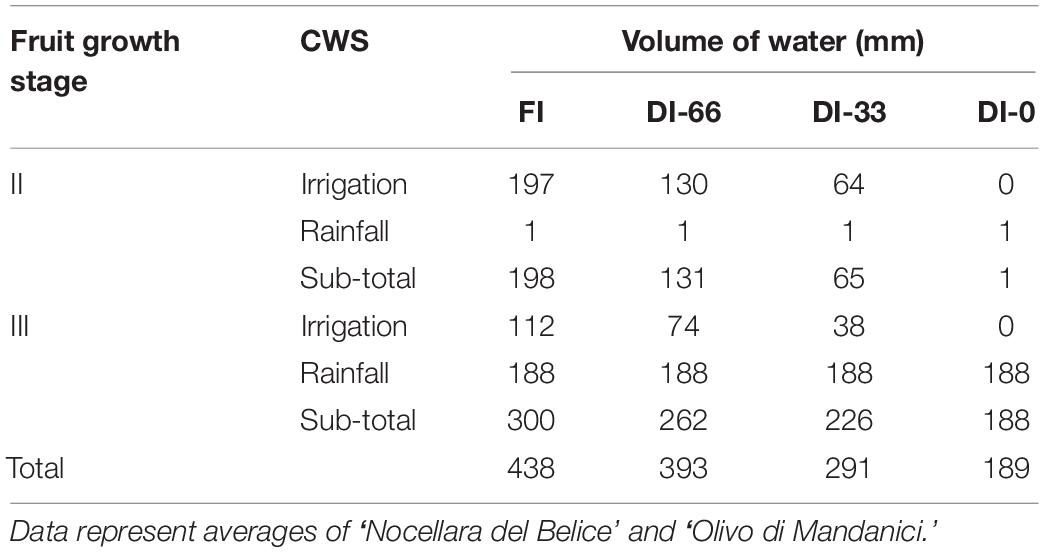
Table 1. Crop water supply (CWS) in FI (full irrigated, 100% of crop evapotranspiration), DI-66 (66% of FI), DI-33 (33% of FI) and DI-0 (rainfed) olive trees at fruit growth stages II and III.
Fruit Characteristics
The two cultivars showed different fruit shape (i.e., NB fruit were almost spherical whereas MN fruit were oblong in shape) from the beginning of fruit diameter measurements at stage II until harvest. Fruit size was also consistently greater in NB than in MN (Figure 3), with nearly no fruit growth during stage II in either cultivars, as expected in the pit hardening stage (Scalisi et al., 2019c). Stage III was characterized by a faster fruit diameter increment in MN compared to NB. The latter is related to the first part of stage III (i.e., the part shown in Figure 3), as in the remaining part of stage III until harvest, MN fruit reached an average final diameter of ∼16 mm. On the other hand, NB fruit reached an average final diameter of ∼23 mm at harvest, suggesting that they had a steeper growth after the end of the period considered in this study (i.e., after 290 DOY).
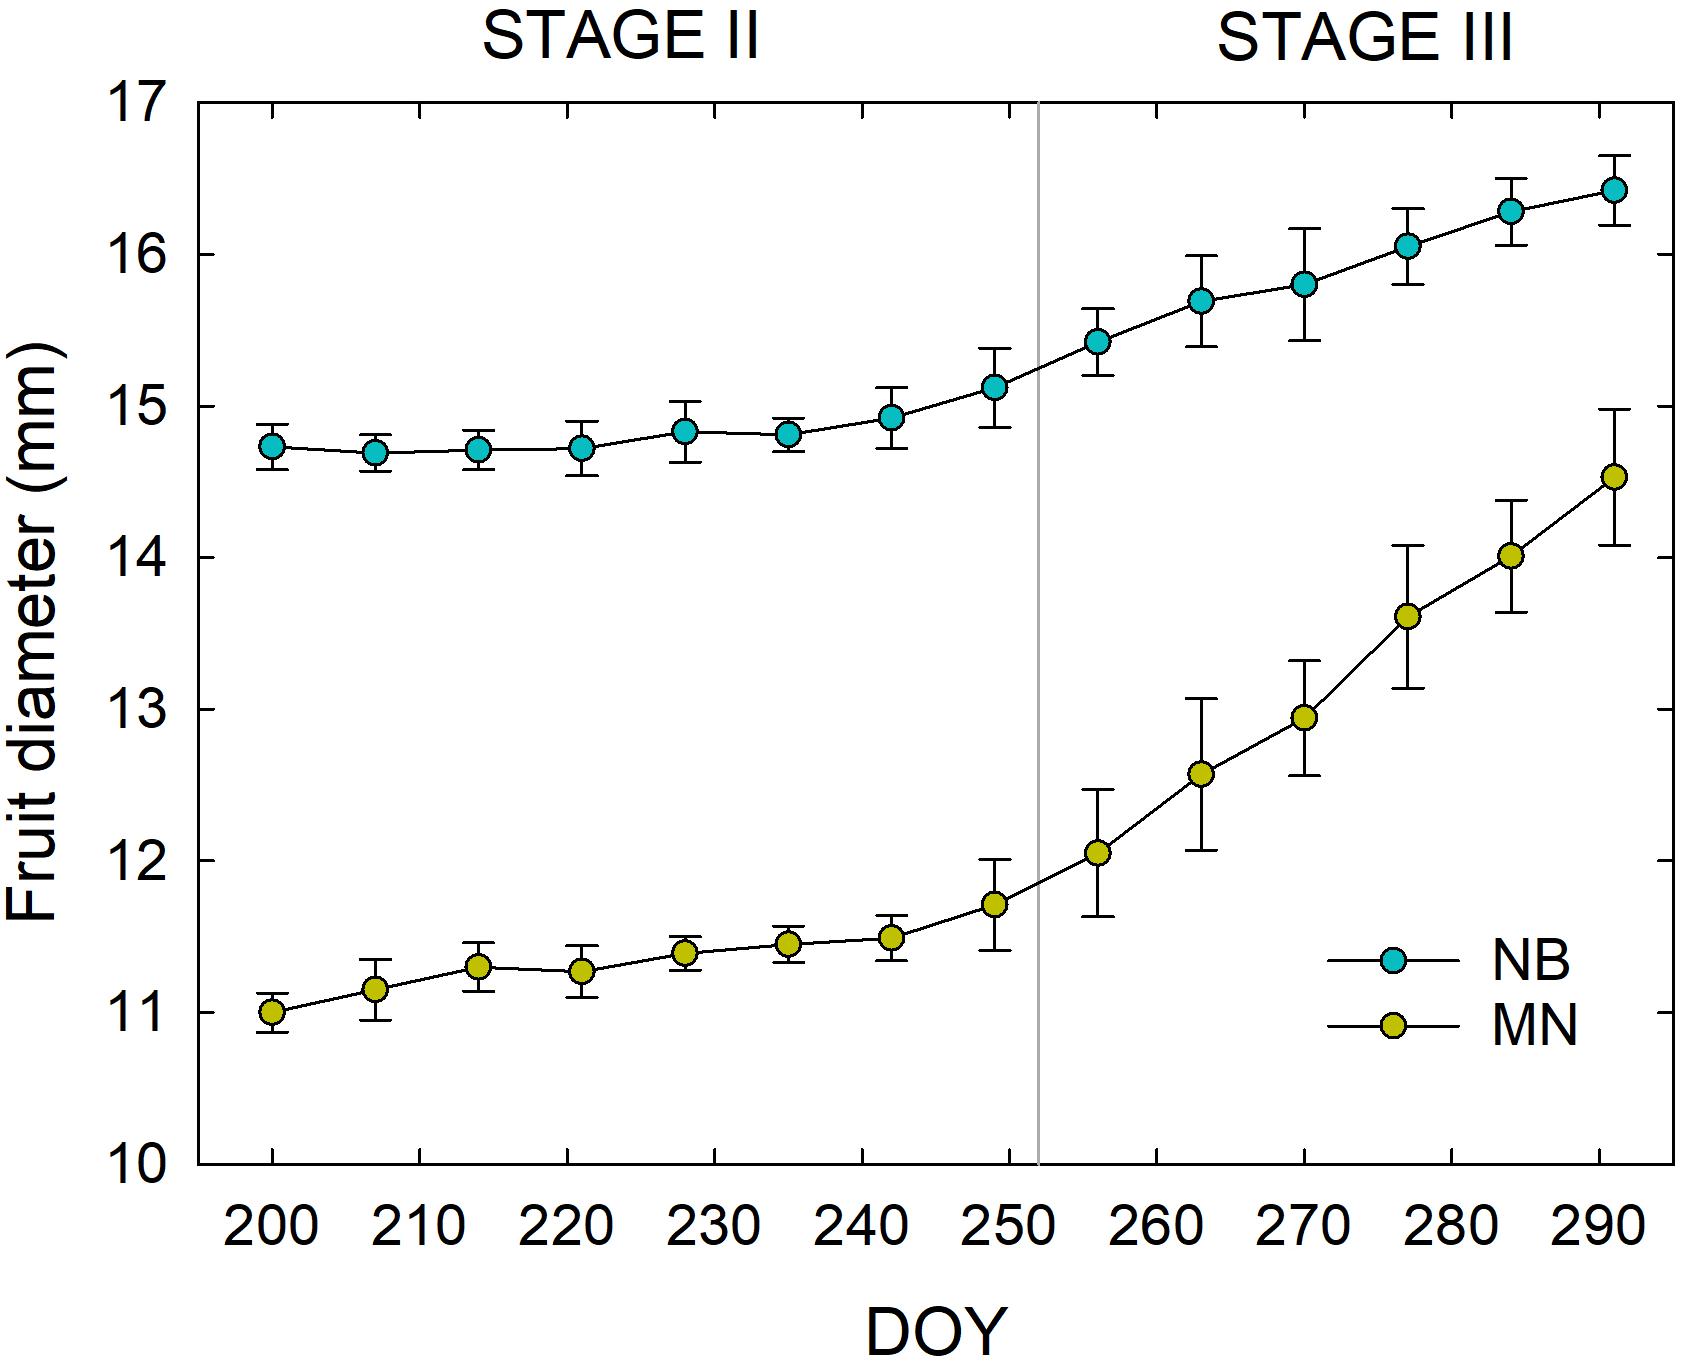
Figure 3. Weekly fruit diameter variations in ‘Nocellara del Belice’ (NB) and ‘Olivo di Mandanici’ (MN) olive cultivars at fruit growth stages II and III from 200 to 291 days of the year (DOY). Error bars represent standard deviations of means (n = 60).
Linear regression analyses between fruit diameter and weight highlighted a different relationship of these two fruit parameters in both stages II (Figure 4A) and III (Figure 4B), as the slopes were significantly higher in NB than in MN (P < 0.001 from t-test) due to different pulp-stone ratios. These findings confirm once again the different fruit morphological characteristics of the two cultivars under study.
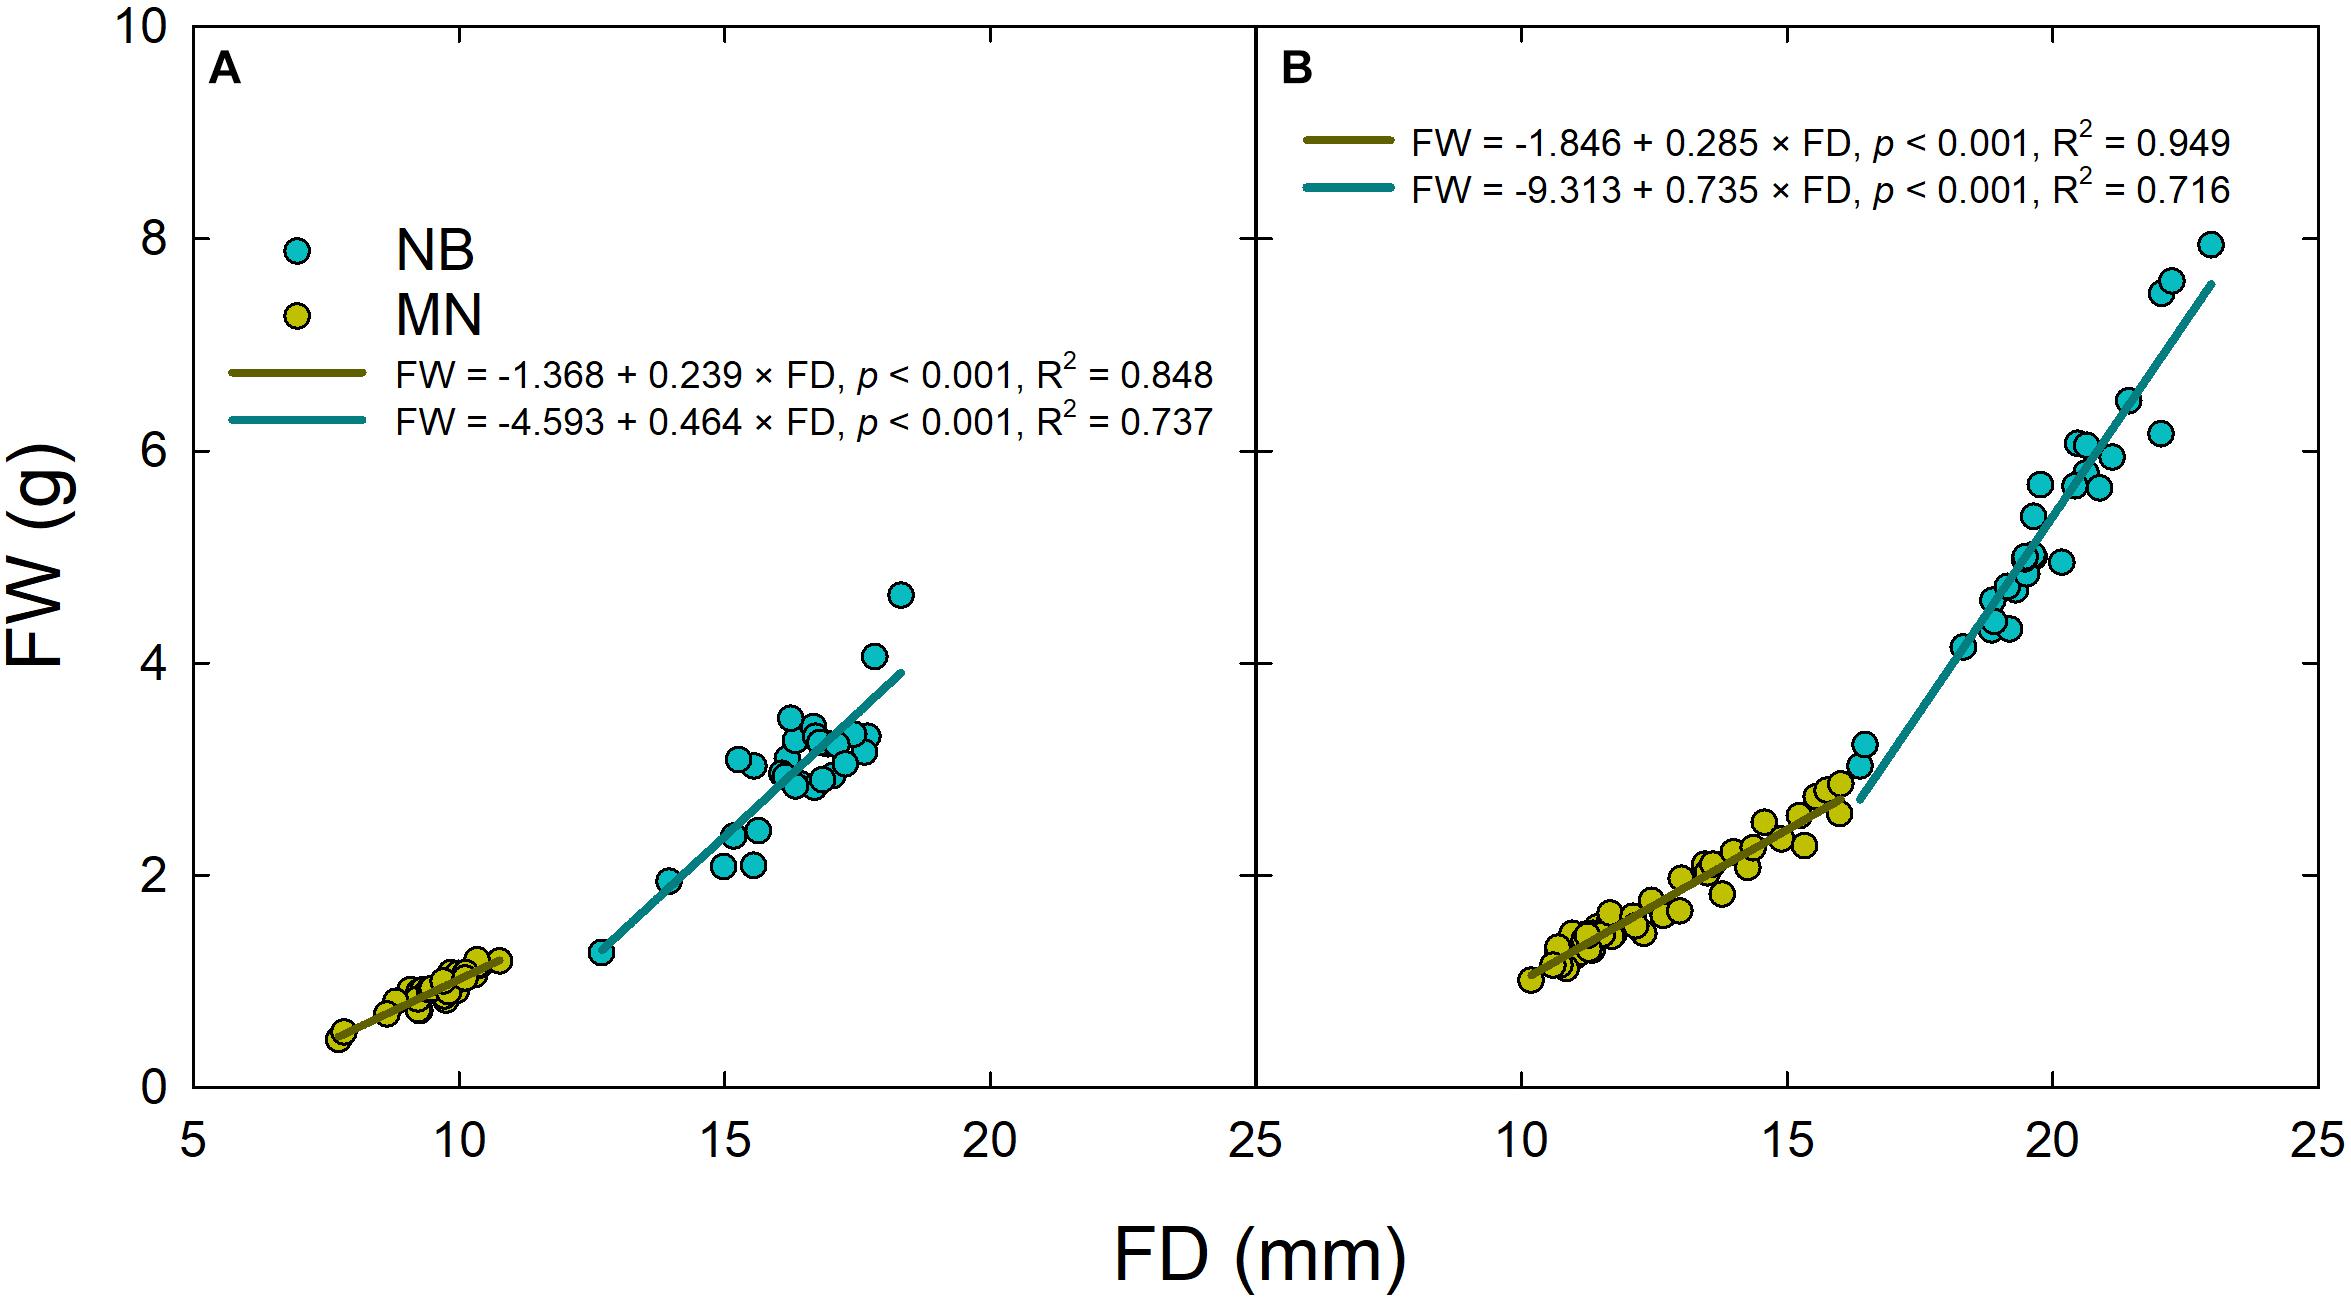
Figure 4. Linear regressions of fruit weight (FW) vs. fruit diameter (FD) in ‘Nocellara del Belice’ (NB) and ‘Olivo di Mandanici’ (MN) olive sampled at stage II (A) and stage III (B) of fruit development.
Plant Water Status
Results from daily gs measurements carried out at 209 and 287 DOY did not show significantly different patterns between the 2 days of measurements and among irrigation levels. Figure 5 shows gs trends in NB and MN at stage II (A) and III (B). In MN, an overall peak of gs occurred at mid-morning (1000 h) with a subsequent sudden decrease at 1200 h in response to increasing noon T and VPD. On the other hand, NB leaves did not show a clear peak of gs in the morning and kept stomatal aperture stable from 0800 h to 1800 h (Figures 5A,B), with a significant drop at 2000 h (Figure 5A). MN leaves showed significantly higher gs than NB at 1000 h, implying a likely higher tree water consumption in the morning. This hypothesis is supported by dynamics of sap flux density measured with thermal dissipation probes in the previous year (Marino et al., unpublished), where MN trees showed higher daily water consumption, especially because of greater flows in the first part of the morning. In the afternoon, NB leaves showed higher gs than MN, with significant differences occurring at 1800 h (Figures 5A,B), suggesting a tendency to maintain higher photosynthetic activity late in the day, when T and VPD are lower.
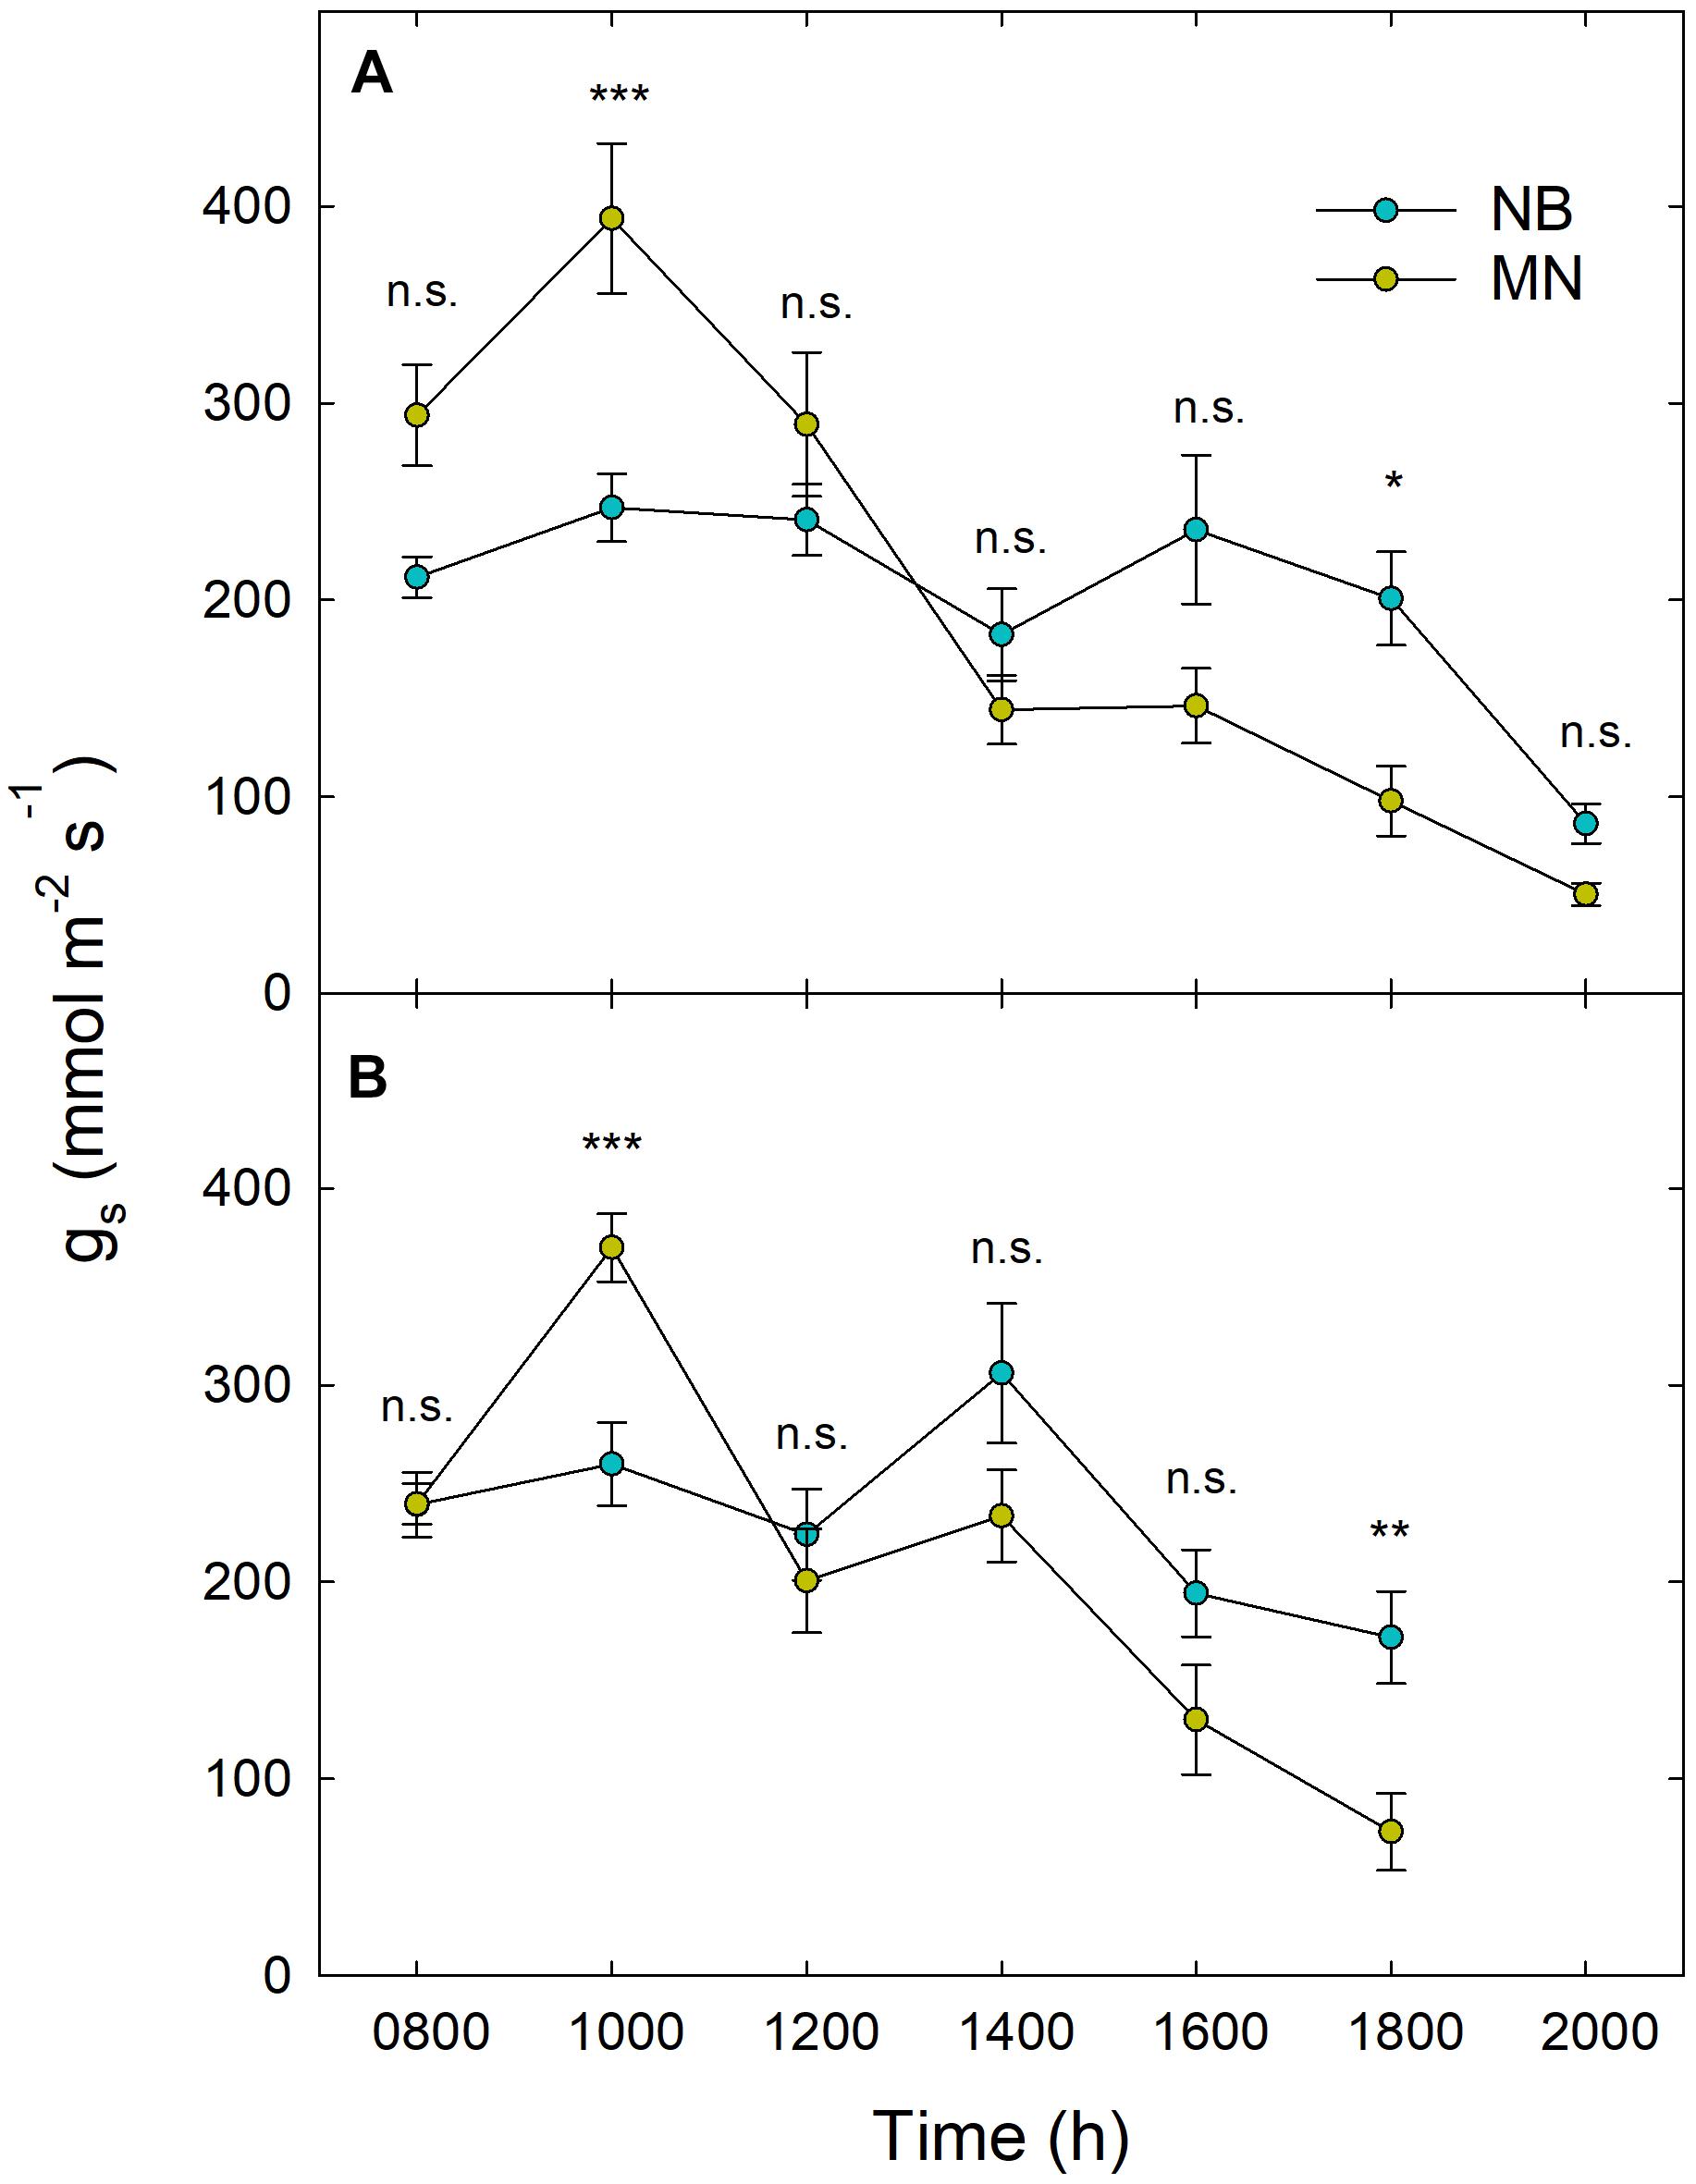
Figure 5. Daily curves of stomatal conductance (gs) in ‘Nocellara del Belice’ (NB) and ‘Olivo di Mandanici’ (MN) olive leaves at fruit growth stages II (A) and III (B). Data averaged across different irrigation levels at 209 (A) and 287 (B) days of the year. Error bars indicate standard deviations of means. N.s., non-significant; *, significantly different for P < 0.05; **, significantly different for P < 0.01; ***, significantly different for P < 0.001 by Tukey’s test.
Daily curves of Ψstem at stages II (209 DOY) and III (287 DOY) showed the typical overall decreasing potential at solar noon in both cultivars, with a subsequent increase late in the afternoon (Figure 6). When tested with ANOVA, only Ψstem in stage III showed significant differences among irrigation levels and a significant interaction with time (i.e., Figures 6B,D), with the lowest daily values always occurring between 1400 and 1600 h and in DI-0 trees (Figures 6B,D). During the pit hardening phase (i.e., stage II), it is well established that deficit irrigation has little effect on Ψstem (Dell’Amico et al., 2012). The minimum Ψstem was significantly lower in NB (−2.53 MPa ± 0.03) than in MN (−2.33 MPa ± 0.03, P < 0.001). Pre-dawn observations at stage III suggest a different behavior in the two cultivars, with only MN trees fully recovering to FI levels during the night in DI-0 and DI-33 levels (Figures 6B,D). A rise of Ψstem was observed in NB and MN trees at 1800 h, with DI-0 MN trees recovering completely to FI levels (Figure 6D).
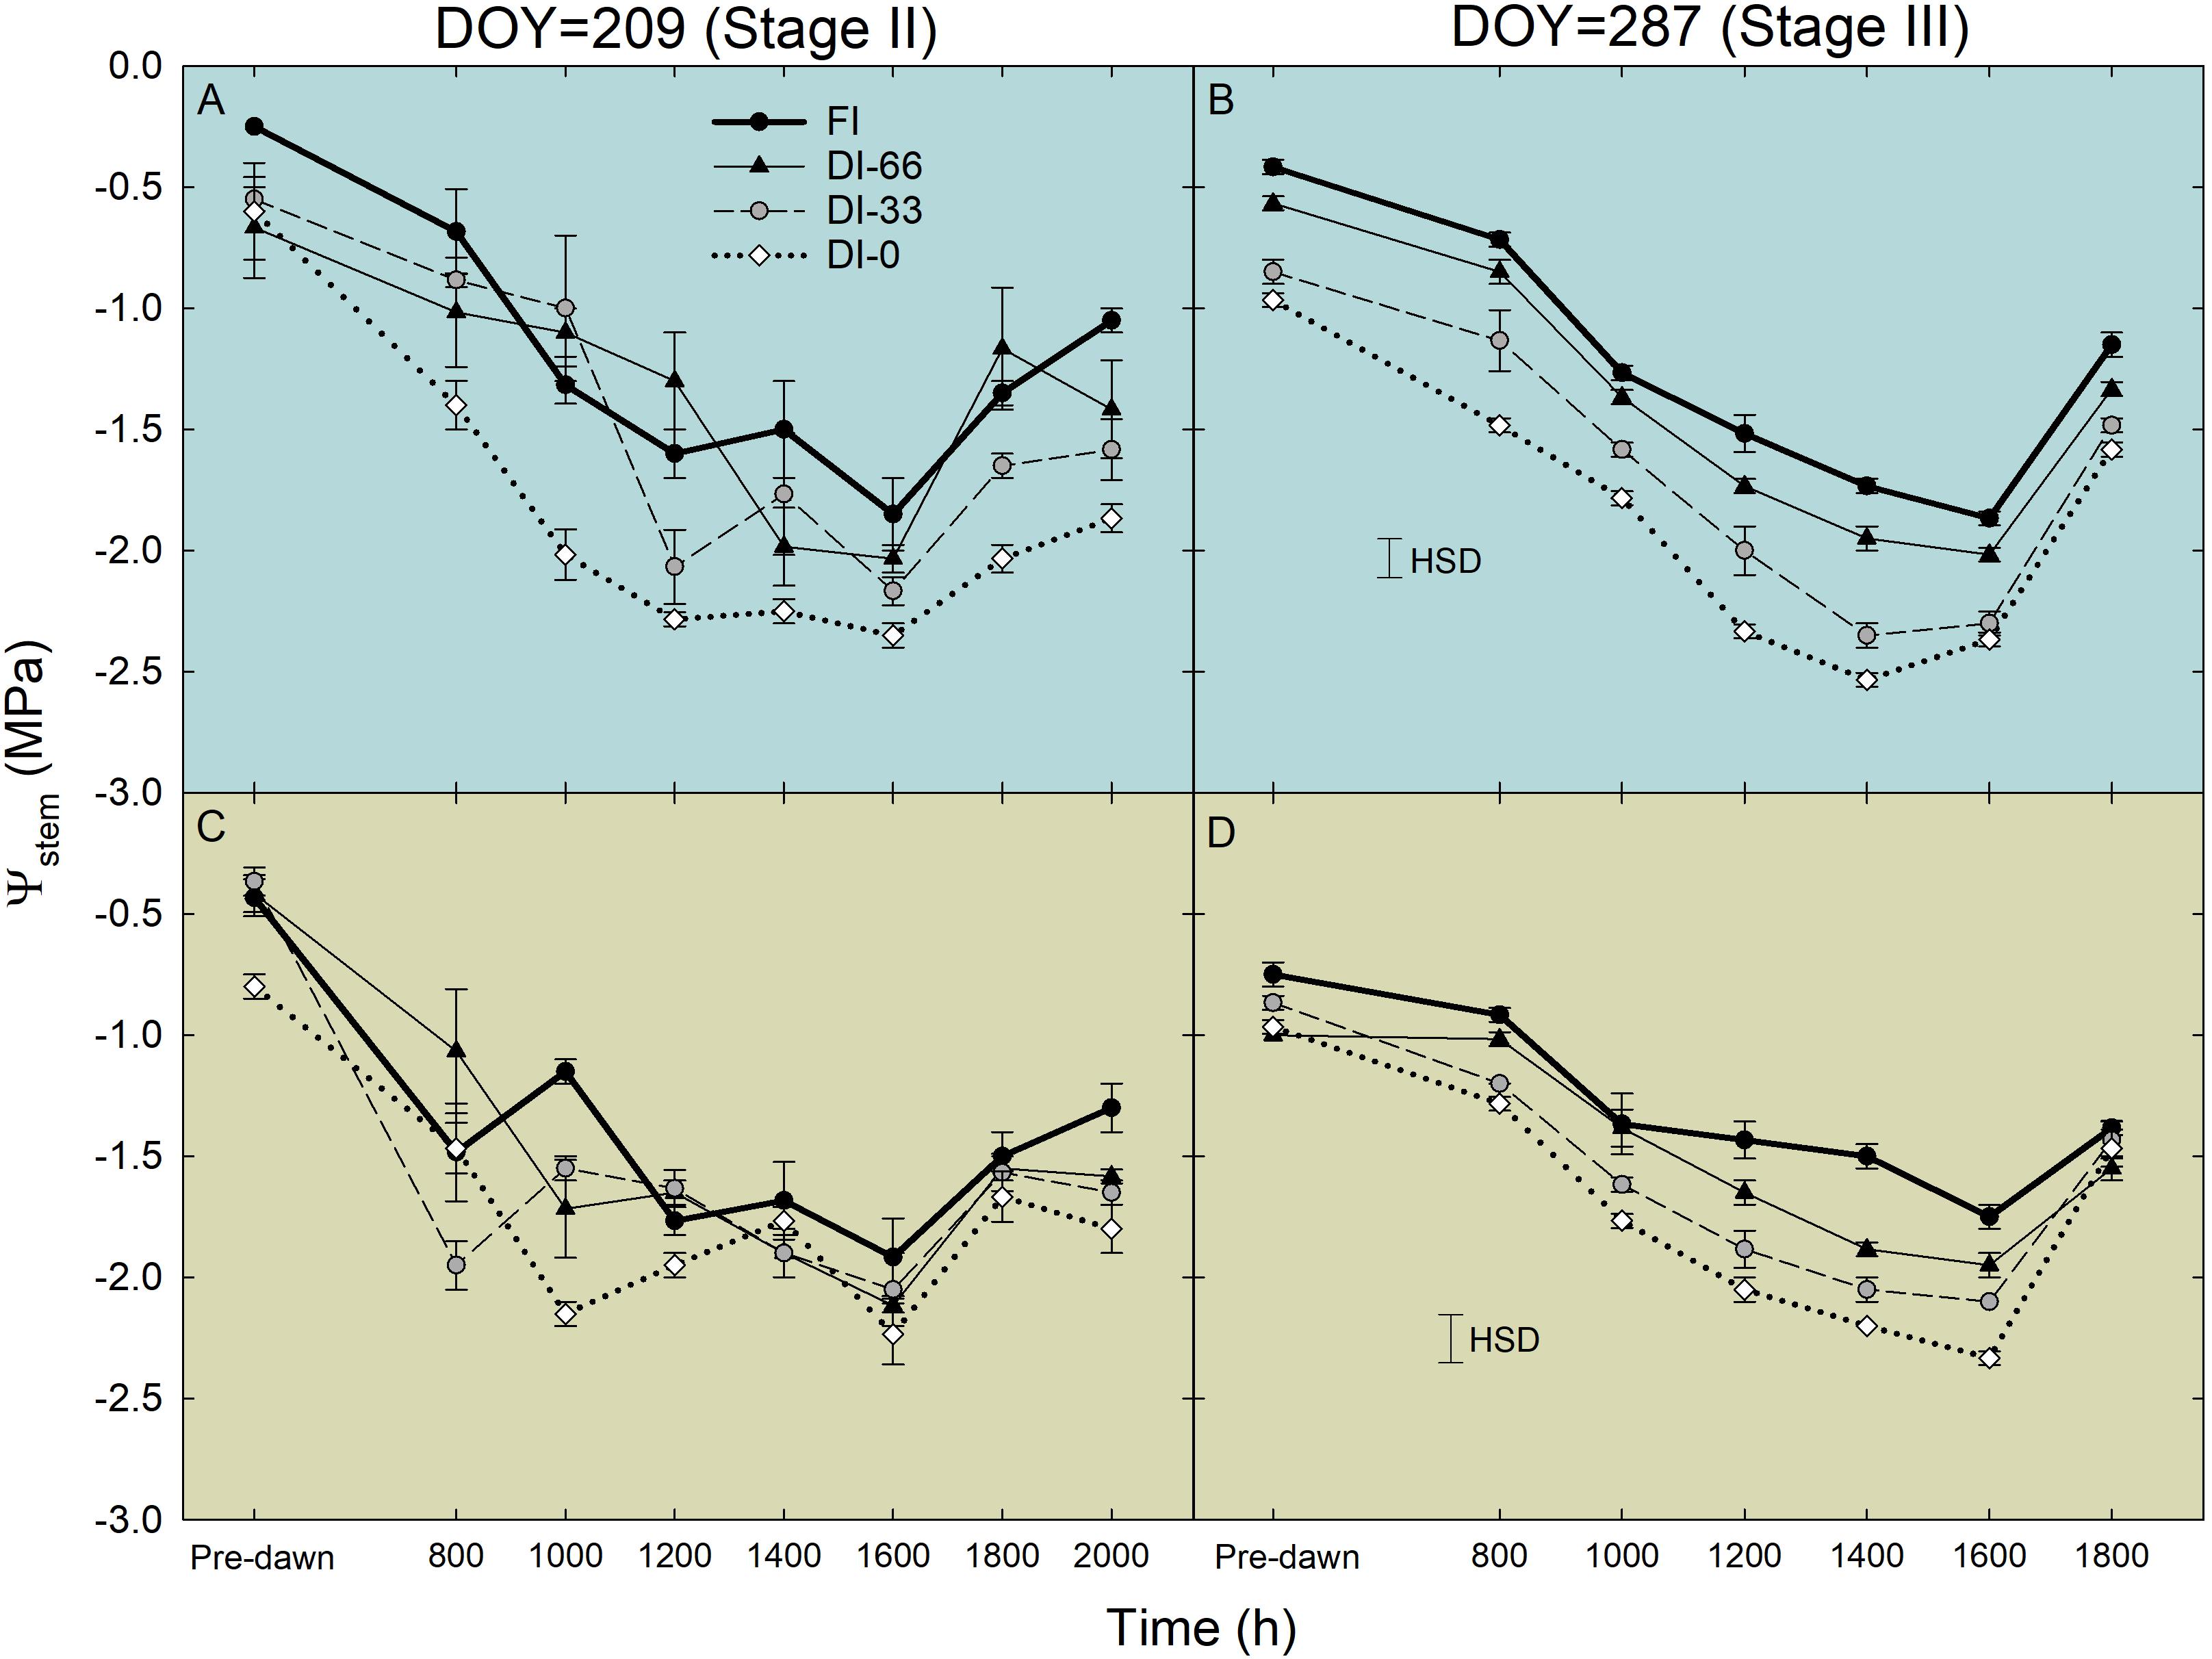
Figure 6. Daily curves of stem water potential (Ψstem) in ‘Nocellara del Belice’ (NB) (A,B) and ‘Olivo di Mandanici’ (MN) (C,D) olive trees under full irrigation (FI), 66% of FI (DI-66), 33% of FI (DI-33) and no irrigation (DI-0) at 209 (stage II) and 287 (stage III) days of the year (DOY). Error bars represent standard deviations of means (n = 3). Significant differences determined by Tukey’s Honestly Significant Difference (HSD, P < 0.05).
Weekly measurements of midday Ψstem from 196 to 287 DOY generally reflected the irrigation levels (Figure 7). Indeed, DI-0 trees experienced the lowest midday Ψstem both in stages II and III. As expected, midday Ψstem was higher at stage II than at stage III, although T and VPD were generally higher in the former (Figure 2). In this phenological phase, water deficit slows down the overall plant activity, inducing a reduction of vegetative growth and photosynthesis, which in turn might limit transpiration (Parent et al., 2009). Indeed, even gs was similar in stages II and III (Figure 5), despite differences in T and VPD (Figure 2). Consequently, as water loss by transpiration is likely to be reduced, plants under deficit irrigation at stage II do not reach as low Ψstem as when the same irrigation is applied in stages I and III. The only exception occurred at 244 DOY, where DI-0 trees experienced a very low Ψstem in both cultivars, due to both particularly high T and VPD (Figure 2A) and to the transition toward the beginning of stage III which was completed the following week. In stage III, the sudden steep increases of Ψstem at 287 DOY was determined by high precipitations (Figure 2). Overall, the cultivars showed a significantly different drop of midday Ψstem in response to DI-0 (t-test P < 0.05). Indeed, across the monitoring period, rainfed NB trees showed a lower average midday Ψstem (−2.75 ± 0.07 MPa) than MN trees (−2.54 ± 0.08 MPa). Combining observations on gs and Ψstem, it can be said that MN avoids excessive Ψstem lowering, not by reduced stomatal aperture, as gs is significantly higher in MN than in NB in the morning (Figure 5), but by other mechanisms. Despite deficit irrigation, NB trees kept their stomata open in the afternoon (Figure 5), when ET0 is highest, and might have not been able to limit water loss from transpiration, inducing low Ψstem. Marino et al. (2016) suggested that osmotic adjustments might be responsible of the relatively higher Ψstem in a clone of MN. Furthermore, changes in the leaf cell elastic modulus occur in other olive genotypes under drought (Karamanos, 1984; Dichio et al., 2003; Bacelar et al., 2006). Both osmotic adjustments and reduced cell wall elasticity contribute to turgor preservation (Patakas and Noitsakis, 1997) and might have led to the high Ψstem found in MN.
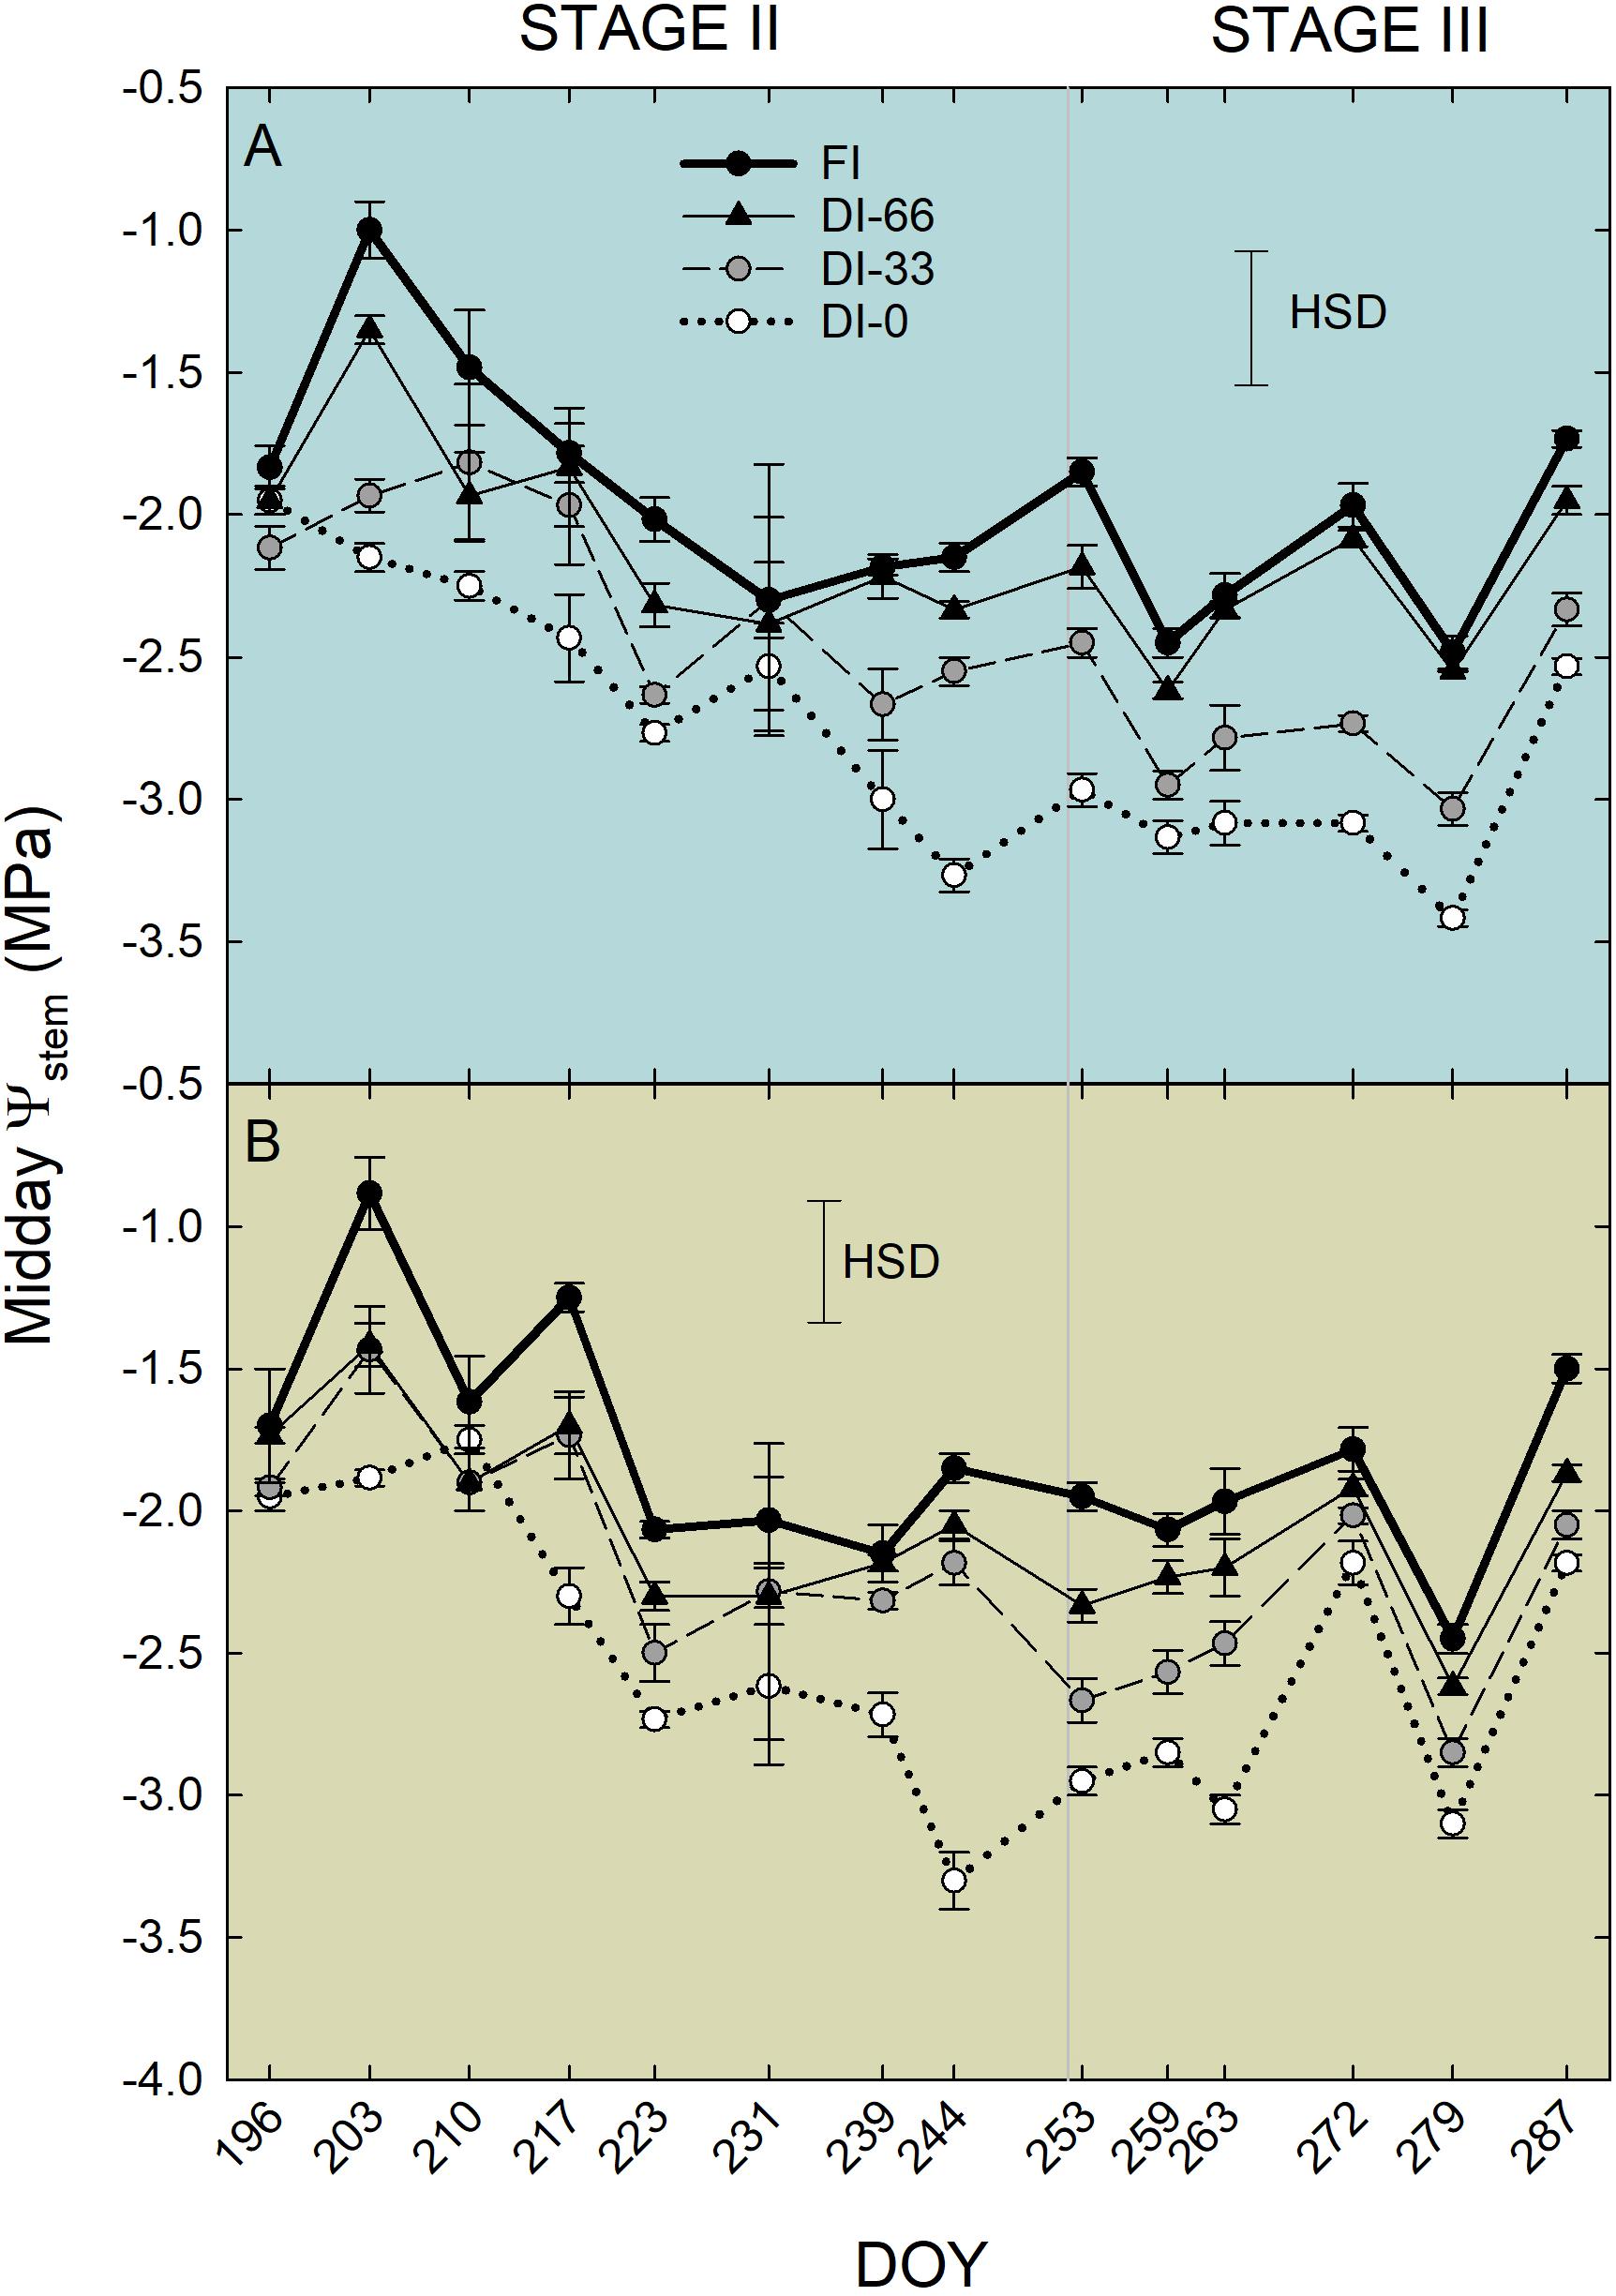
Figure 7. Midday stem water potential (Ψstem) in ‘Nocellara del Belice’ (NB) (A) and ‘Olivo di Mandanici’ (MN) olive trees (B) under full irrigation (FI), 66% of FI (DI-66), 33% of FI (DI-33) and no irrigation (DI-0) during stage II (from 196 to 252 DOY) and stage III (from 253 to 287 DOY) of fruit growth. Error bars represent standard deviations of means (n = 3). Significant differences determined by Tukey’s Honestly Significant Difference (HSD, P < 0.05).
Fruit and Leaf-Based Sensing
After removing the three-day buffer period from FD, pp, RRfruit, and RRleaf data, a 5-day interval in stage II was obtained (Figure 8). Trends of FD (Figures 8A,E) did not highlight different fruit growth dynamics among irrigation levels in stage II, for both NB and MN. FI induced sharper fruit shrinkage than deficit irrigation at 222 and 223 DOY, as fruit with an optimal water status are likely to exchange more water in the warmest hours of the day.
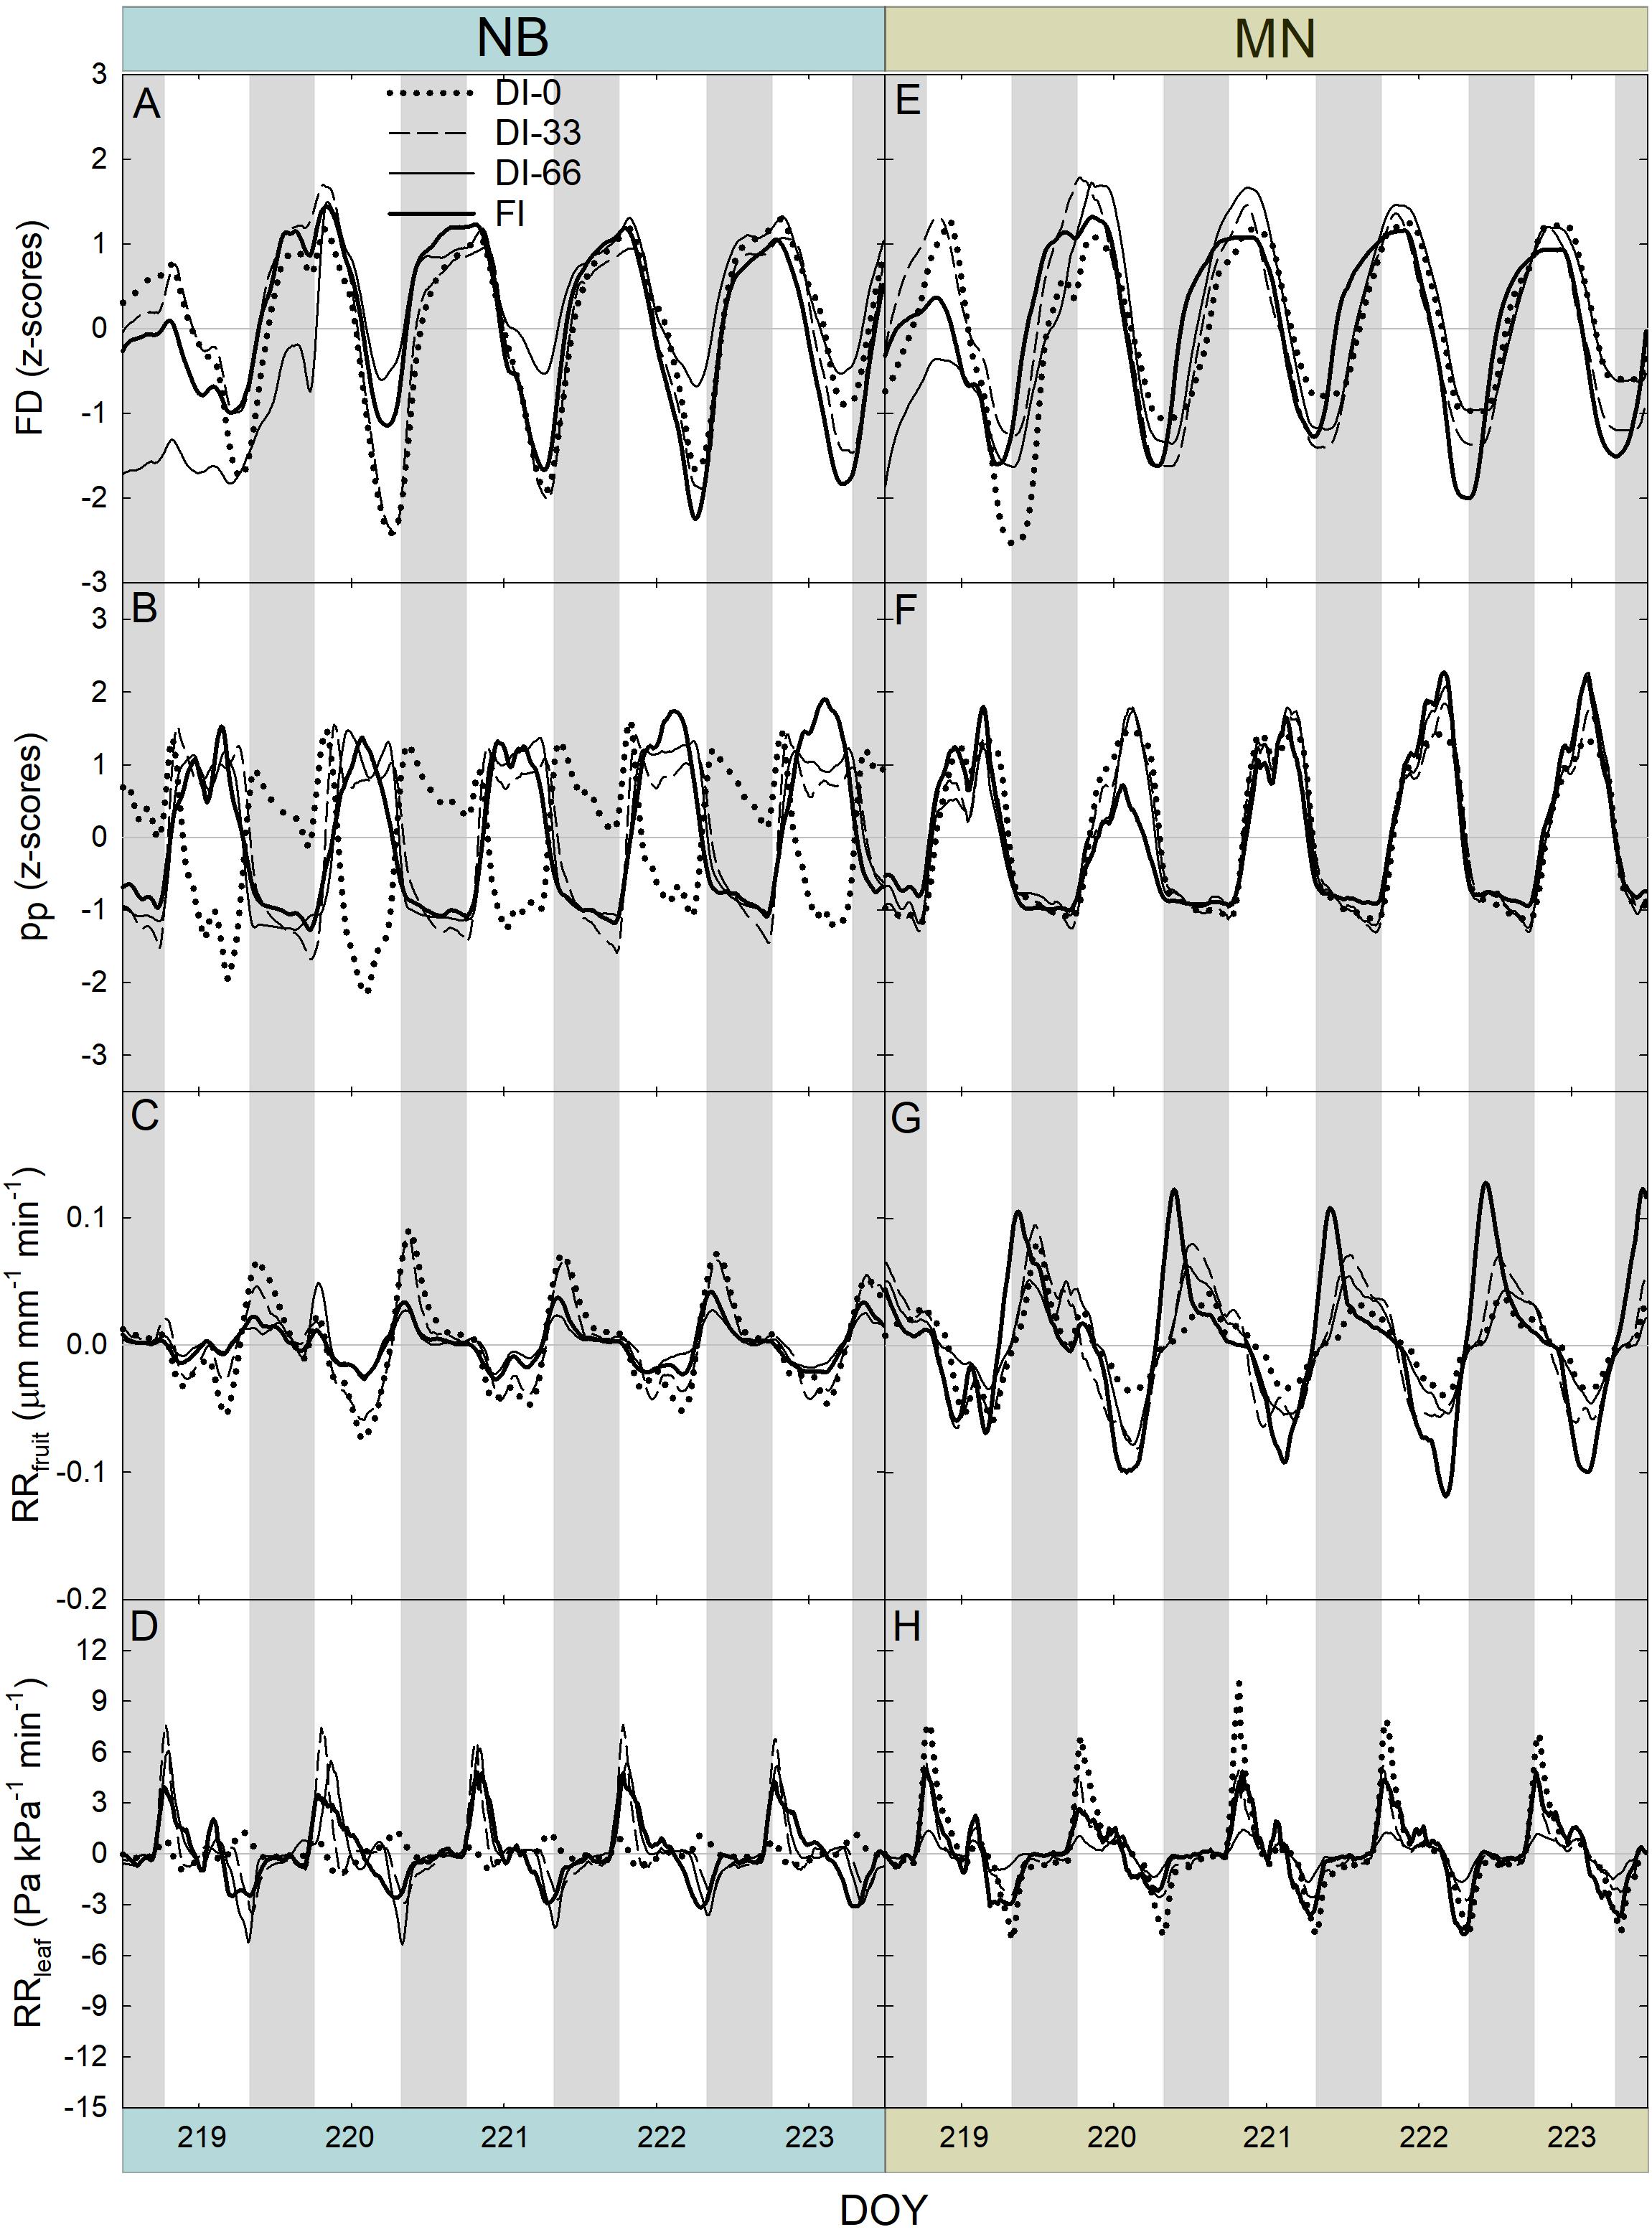
Figure 8. Fruit diameter (FD), leaf patch clamp pressure (pp), relative rate of fruit diameter change (RRfruit) and relative rate of leaf pressure change (RRleaf) recorded at 15-minute intervals for 5 days during stage II of fruit growth in ‘Nocellara del Belice’ (NB) (A–D) and ‘Olivo di Mandanici’ (MN) olive trees (E–H) under full irrigation (FI), 66% of FI (DI-66), 33% of FI (DI-33) and no irrigation (DI-0). Gray and white areas show nocturnal and diurnal hours, respectively.
Dynamics of pp highlighted the typical inversion phenomenon of the diel curve in olive leaves from trees under deficit irrigation (Fernández et al., 2011a). In NB, DI-66 and DI-33 leaves exhibited the half-inverted state (state II), whereas DI-0 leaves showed a total inversion of the curve (state III) (Figure 8B). In MN trees, a clear shift from state I to II was not observed, despite the slight tendency to enter state II at 219 and 221 DOY, with no apparent differences among irrigation levels (Figure 8F). This suggests that MN leaves can maintain high cell turgor, probably by reduced cell wall elasticity or osmotic adjustments, as found in other olive genotypes (Bacelar et al., 2009; Dichio et al., 2009; Lo Bianco and Scalisi, 2017).
The highest RRfruit always occurred early in the night as fruit quickly rehydrated their tissues (Figures 8C,G). As expected, the most negative RRfruit rate (i.e., the highest fruit shrinkage rate) always occurred in the warmest hours of the day. RRfruit dynamics were also affected by deficit irrigation in NB, as the diel RANGE was greater in DI-0 and DI-33 than in DI-66 and FI fruit (Figure 8C). A completely different behavior was observed in MN fruit, which instead had the widest diel RANGE in FI trees (Figure 8G). In addition, the overall diel RANGE of RRfruit in MN was almost double than in NB, implying larger water in- and out-flows per unit of fruit volume in the former, determined by high fruit sink power for water.
A general positive peak of RRleaf was exhibited early in the morning (Figures 8D,F), representing a quick leaf turgor loss (i.e., RRleaf is equivalent to the inverse of the relative change in pc) after pre-dawn highest turgor in the 24-hour timeframe. Even in this case, the two cultivars responded differently to water deficit, with NB DI-0 trees exhibiting minimal diel fluctuations (i.e., RANGE) while MN DI-0 trees showing the largest RANGE. This suggested that the oscillations of RRleaf might be linked to those of RRfruit.
Another 5-day interval was considered at stage III of fruit development (Figure 9). Differently from stage II, FD responses were characterized by an evident diameter increase across the 5 days and within the 24-hour period in both cultivars (Figures 9A,E), as in stage III fruit are in full cell enlargement phase (Figures 9A,E). Daily curves of pp (Figures 9B,F) did not show pronounced inversion phenomena, as this week was characterized by high rainfall (Figure 2B) and general higher midday Ψstem (Figure 7). Only NB DI-0 trees showed a partially inverted pp curve. Diel RANGE of RRfruit was found to be greatly reduced at stage III (Figures 9C,G) compared to stage II (Figures 8C,G). In the former, low VPD (Figure 2A) and good soil water availability determined by abundant precipitations (Figure 2B) led to an increase of water content in fruit and lower fruit water exchanges. For similar reasons, the diel RANGE of RRleaf was reduced in stage III (Figures 9D,H), although NB and MN maintained the same differences in response to deficit irrigation levels observed at stage II (Figures 8D,H).
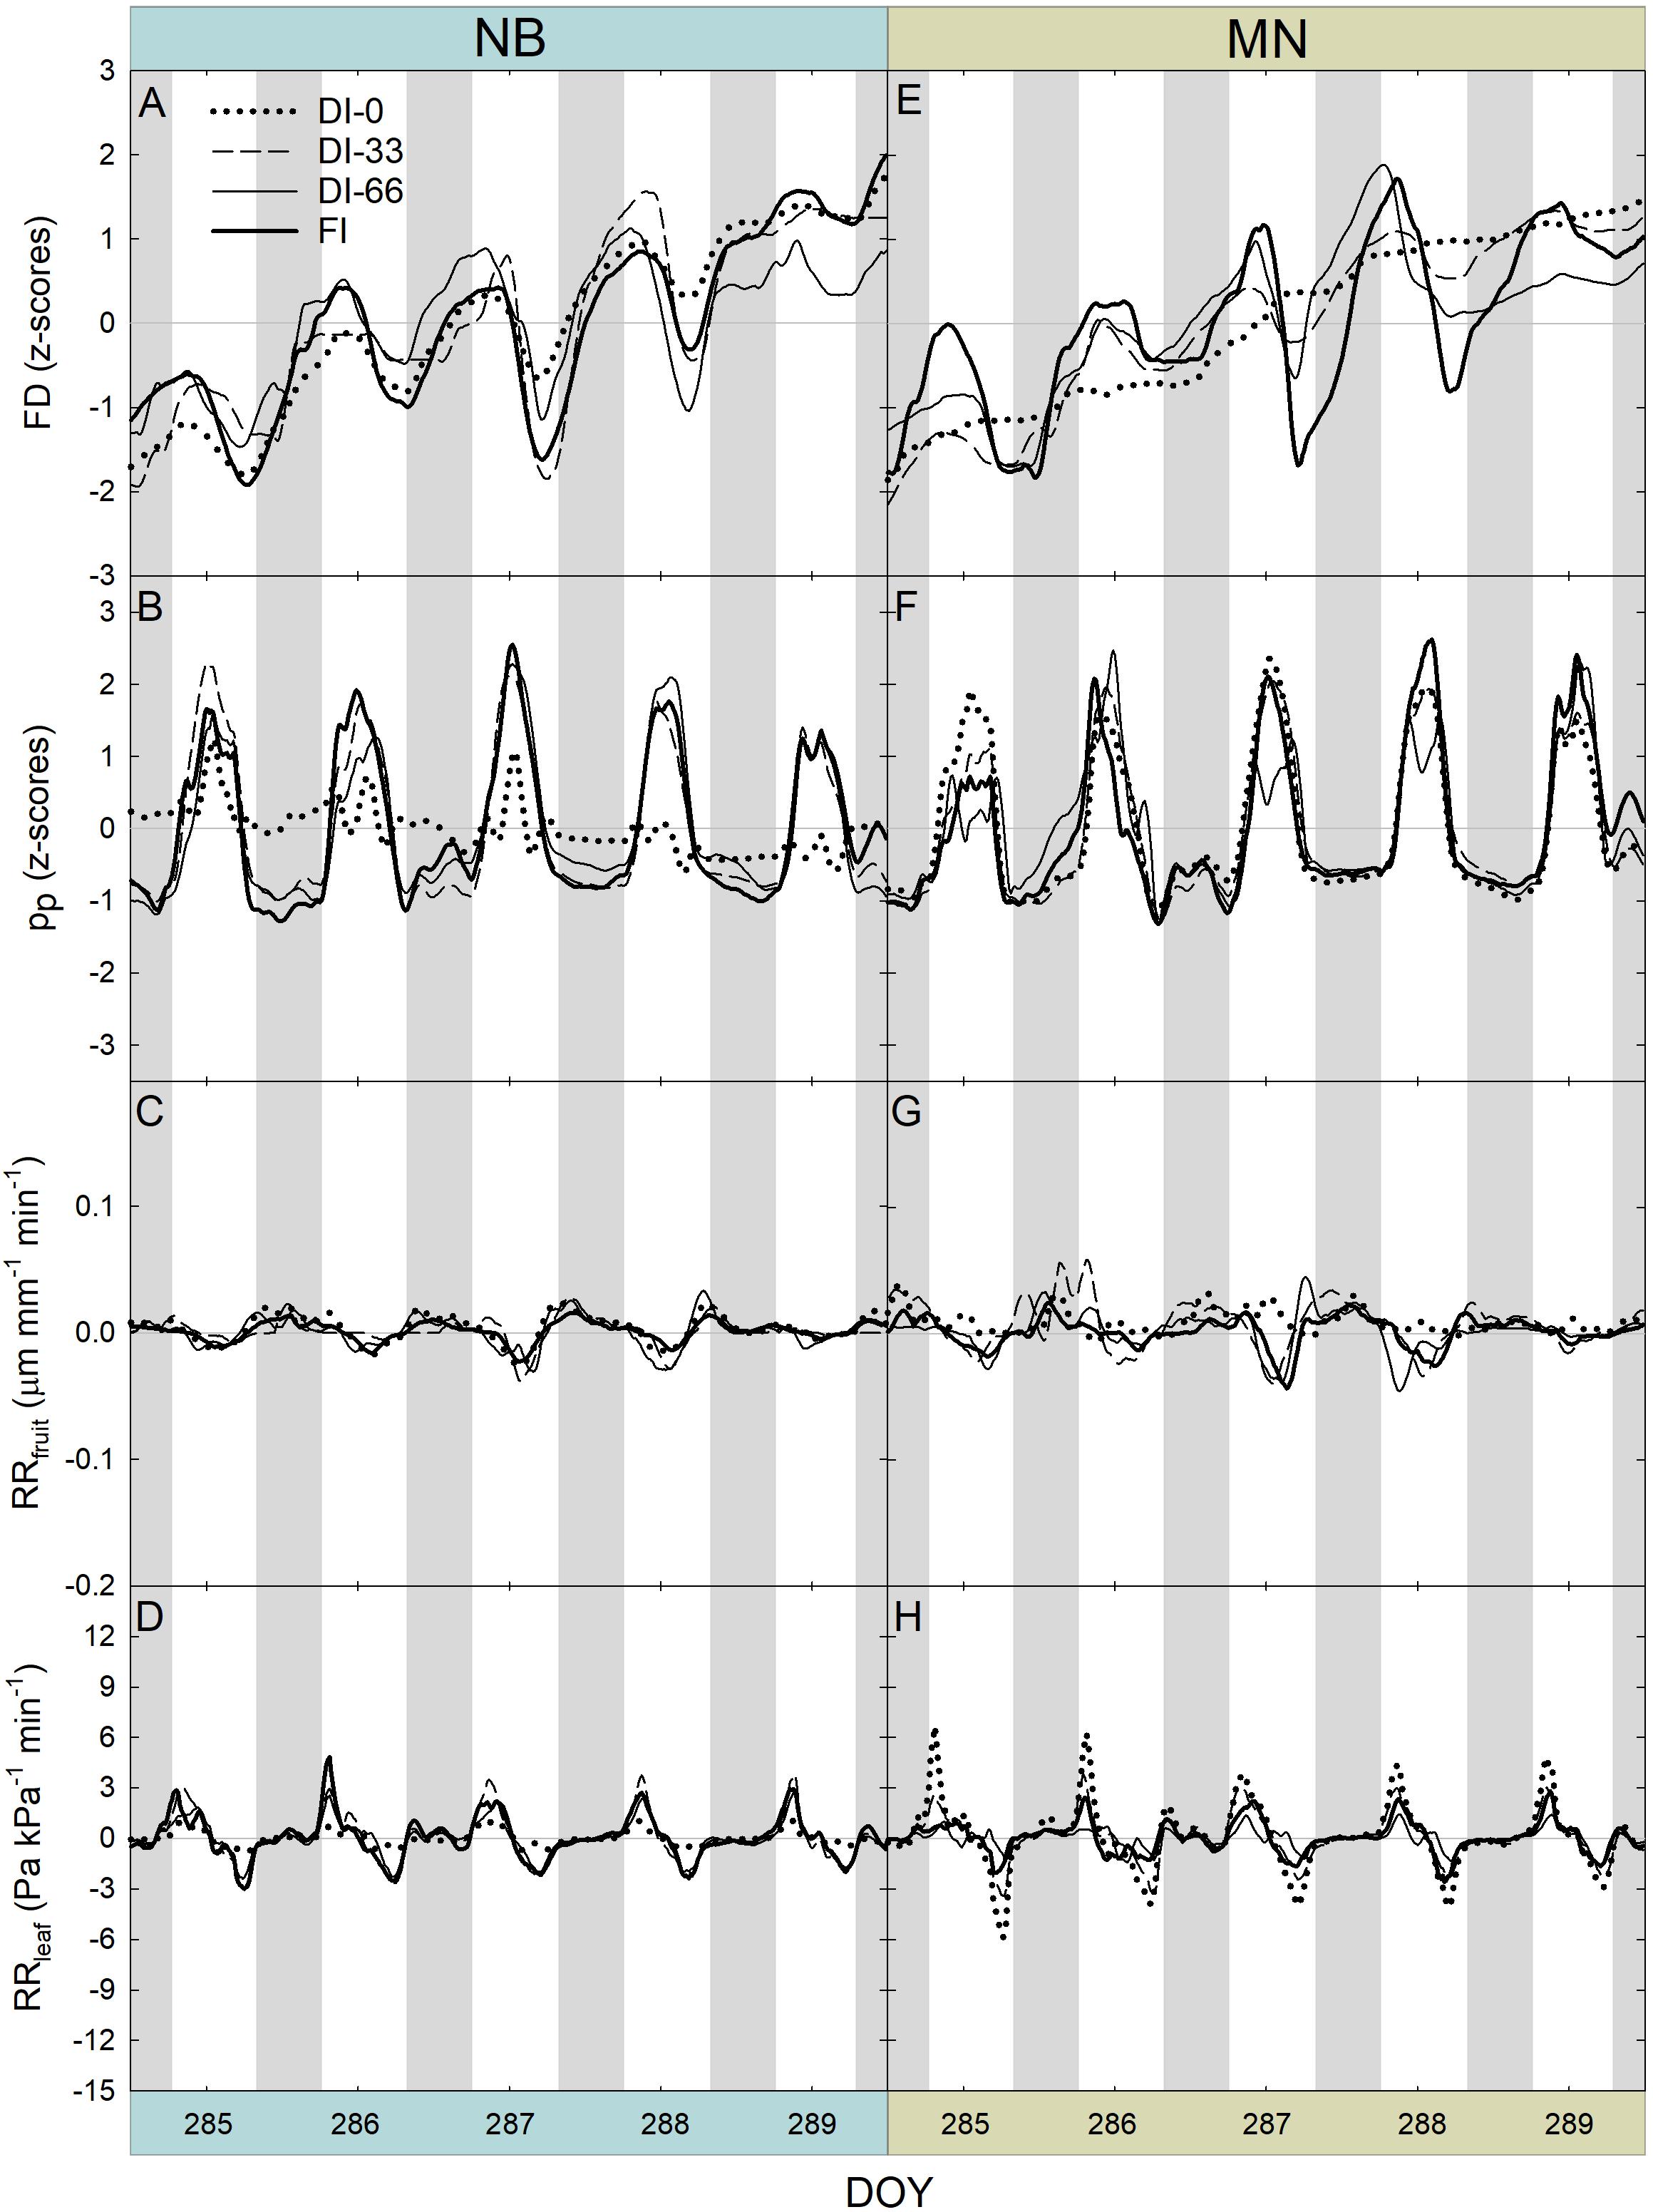
Figure 9. Fruit diameter (FD), leaf patch clamp pressure (pp), relative rate of fruit diameter change (RRfruit) and relative rate of leaf pressure change (RRleaf) recorded at 15-minute intervals for 5 days during stage III of fruit growth in ‘Nocellara del Belice’ (NB) (A–D) and ‘Olivo di Mandanici’ (MN) olive trees (E–H) under full irrigation (FI), 66% of FI (DI-66), 33% of FI (DI-33) and no irrigation (DI-0). Gray and white areas show nocturnal and diurnal hours, respectively.
Considering the interesting findings from RRfruit and RRleaf dynamics, these two indices were further related to each other regressing their diel data at 15-minute intervals in a day at stage II (DOY = 223) and stage III (DOY = 287). Scatter plots in Figure 10 show anti-clockwise hysteretic relationships between RRfruit and RRleaf, both for NB (Figures 10A,B) and MN (Figures 10C,D). Hysteresis are common when relating outputs from different sensors of plant water status mounted on different organs (Tognetti et al., 1996; Fernández, 2017), as there is generally a lag in tissue water de- and re-hydration, and in our case, also a likely different pattern of the RRleaf to RRfruit relationship between day and night. An overall decrease of the hysteretic loop area occurred from stage II (DOY 223) to stage III (DOY 287) in both cultivars (i.e., for NB Figures 10A,B, and for MN Figures 10C,D). This is probably driven by the different fruit growth pattern at stages II and III which induced a reduction of the RRfruit diel range (Figures 9C,G). In both DOY 223 and 287, the hysteretic loops in NB progressively flattened along the RRfruit axis with increasing water deficit (Figures 10A,B) due to the change in the ratio between RRfruit and RRleaf. In other words, on one hand, at increasing water deficit and in a diel interval, it seems that NB leaves significantly reduce water exchanges, as the values of RRleaf stay around 0 Pa kPa–1 min–1. On the other hand, increasing water deficit caused MN loops to flatten along the RRleaf axis (Figures 10C,D), with MN leaves keeping high water exchanges at low Ψstem, while fruit water exchanges were significantly reduced, as RRfruit did not change much from 0 μm mm–1 min–1. This opposite trend suggests a completely different mechanism of leaf and fruit water exchanges in response to increasing water deficit in the two cultivars, which might be driven by different osmotic adjustments, cell-wall elasticity and tissue water content.
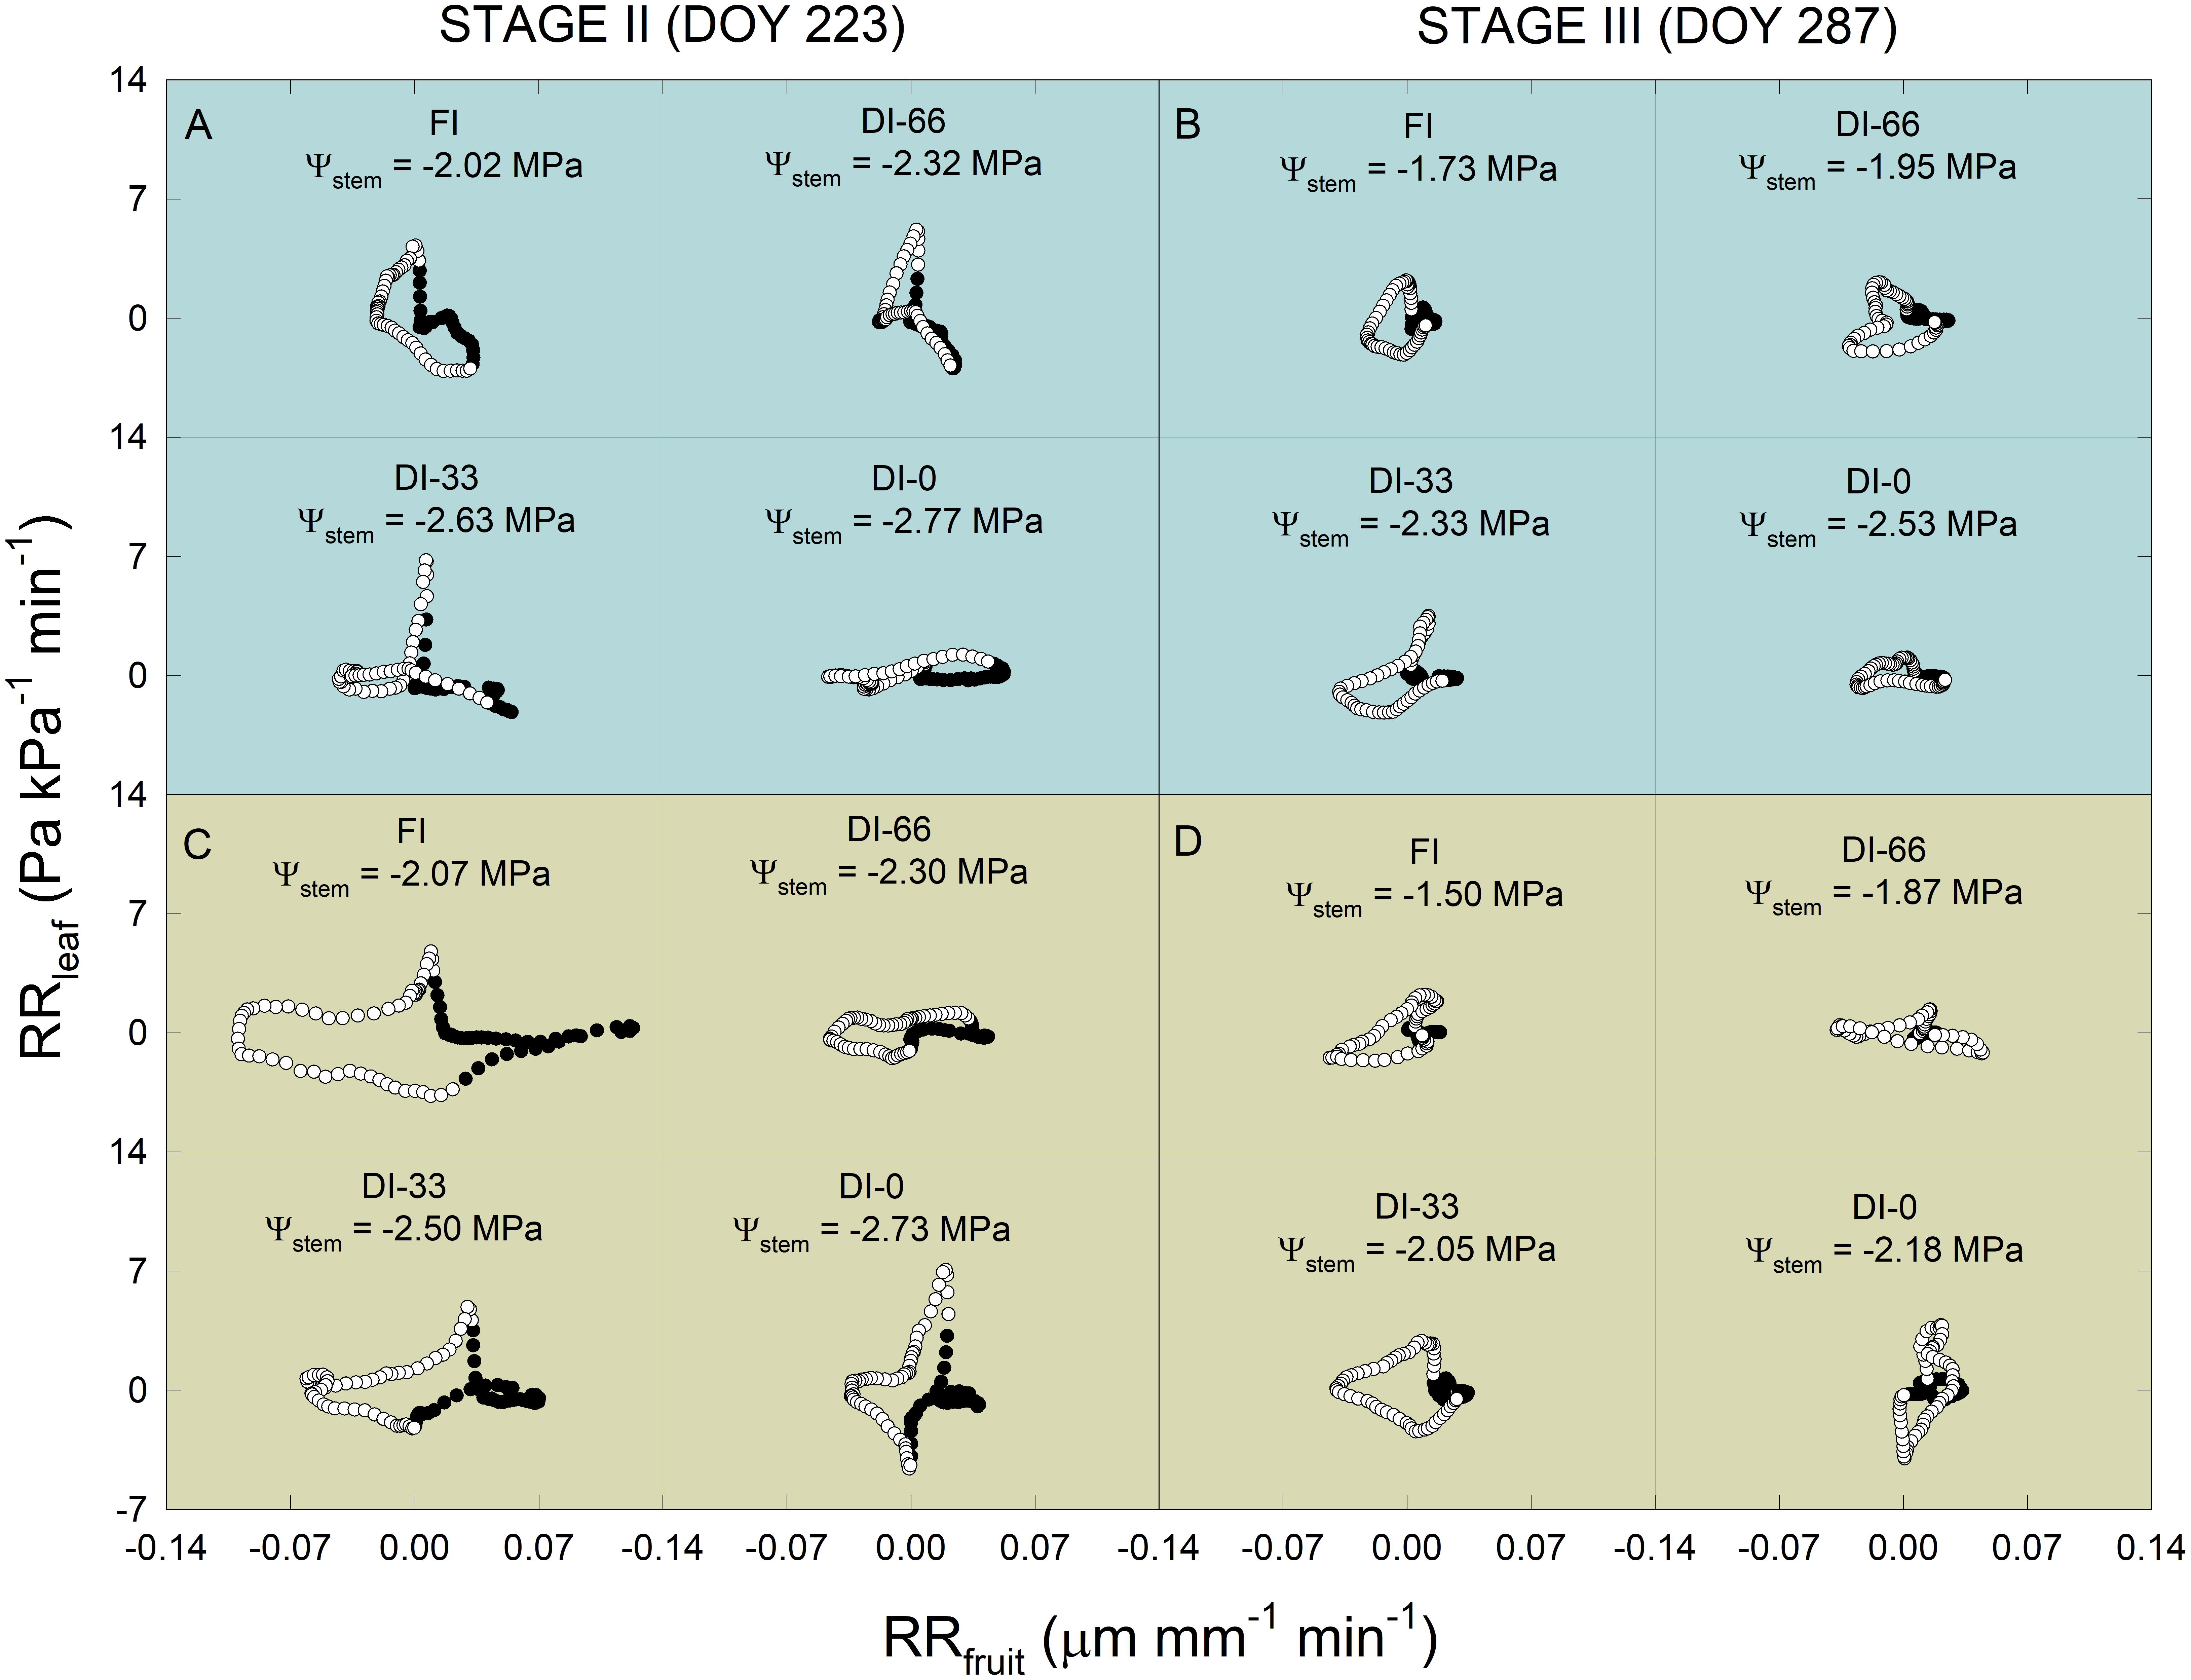
Figure 10. Scatter plots of relative rate of leaf pressure change (RRleaf) vs. relative rate of fruit diameter change (RRfruit) in ‘Nocellara del Belice’ (A,B) and ‘Olivo di Mandanici’ olive trees (C,D) under full irrigation (FI), 66% of FI (DI-66), 33% of FI (DI-33) and no irrigation (DI-0), at 223 (stage II) and 287 (stage III) days of the year (DOY). Midday stem water potential (Ψstem) reported for each cultivar × DOY × irrigation level combination. White and black circles represent diurnal and nocturnal data in a diel interval, respectively.
The statistical diel, nocturnal and diurnal parameters of RRfruit (i.e., MIN, MAX, SUM, RANGE, and RSD) were associated to the corresponding RRleaf parameters to assess fruit and leaf responses to water deficit. Subsequently, data were analyzed by MANOVA to determine whether the combined response of parameters was affected by cultivars, irrigation levels, and cultivar × irrigation interaction. The cultivar did not influence significantly diel, diurnal and nocturnal RRfruit/RRleaf when statistical parameters were considered together (Table 2). Diel and diurnal RRfruit/RRleaf parameters changed significantly in response to irrigation levels, but the cultivar × irrigation interaction had the strongest effect (Table 2), indicating that RRfruit/RRleaf responses to deficit irrigation differ between the two genotypes under study. Specifically, the highest F was found in the MANOVA that tested diurnal RRfruit/RRleaf responses to cultivar × irrigation. These results suggest that, under increasing water deficit, the differences in genotype-specific fruit and leaf sink power to water are predominant in day hours.
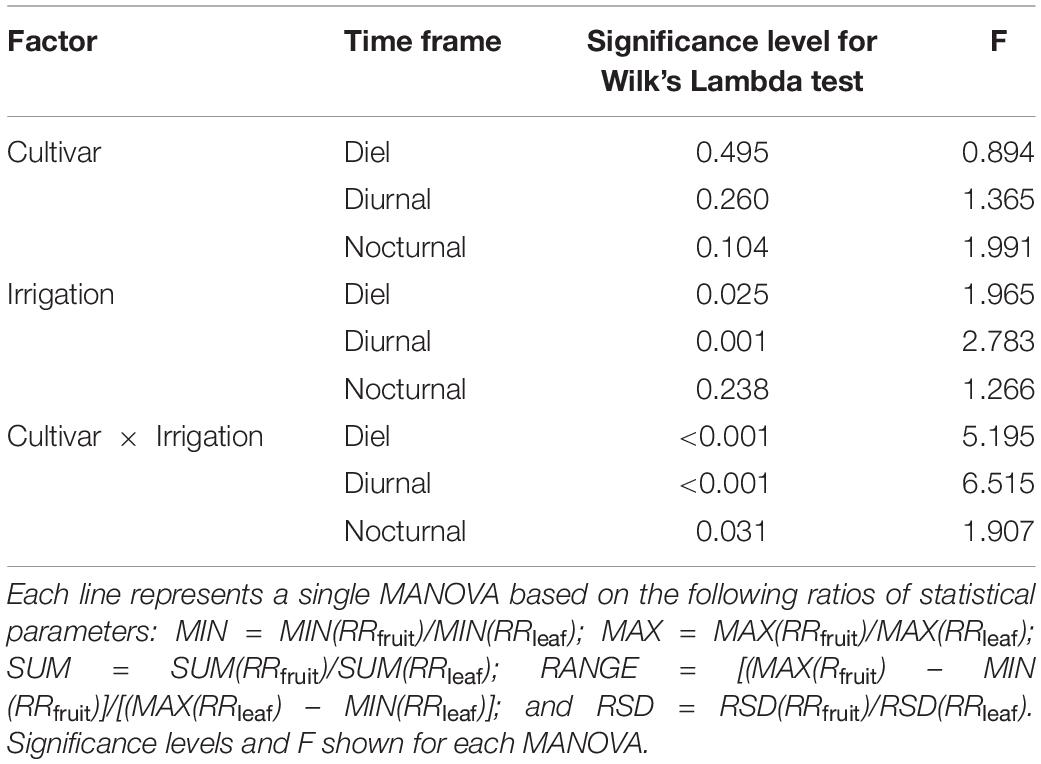
Table 2. Multivariate analyses of variance (MANOVAs) testing the effects of cultivar, irrigation and the cultivar × irrigation interaction on the ratios of statistical parameters extrapolated from the relative rate of fruit diameter change (RRfruit) and the relative rate of leaf pressure change (RRleaf) at diel, diurnal and nocturnal intervals.
Ratios between RRfruit and RRleaf diel, diurnal and nocturnal parameters were often linearly related to midday Ψstem (Figure 11). Interestingly, linear regression models highlighted opposite trends in the two cultivars for many of the several associations tested. In NB, RANGEdiel [diel RANGE(RRfruit)/diel RANGE(RRleaf)] was higher at lower midday Ψstem, suggesting more marked water exchanges (e.g., in and out) in fruit rather than leaves at pronounced water deficit (Figure 11A). An opposite trend was observed in MN, in which decreasing midday Ψstem lead to higher leaf water exchanges (Figure 11B). This inverted trend agrees with RRfruit and RRleaf fluctuations shown in Figures 8C,D,G,H. In NB, during the day MINdiur [diurnal MIN(RRfruit)/diurnal MIN(RRleaf)] increased along increasing water deficit (Figure 11C). This indicates that as water deficit increases, the highest diurnal speed of fruit water loss becomes higher compared to the highest speed of leaf turgor gain. Even in this case, an opposite trend is found in MN, with the diurnal rate of fruit water loss being higher than leaf rehydration rate at low midday Ψstem (Figure 11D). In NB, SUMnoct [nocturnal SUM(RRfruit)/nocturnal SUM(RRleaf)] decreased with increasing water deficit, with leaf rehydration being favored over fruit water gain (Figure 11E). Oppositely, in MN the SUMnoct ratio was inversely related to midday Ψstem (Figure 11F), suggesting a stronger nocturnal sink power for water of fruit compared to leaves under more severe water deficit.
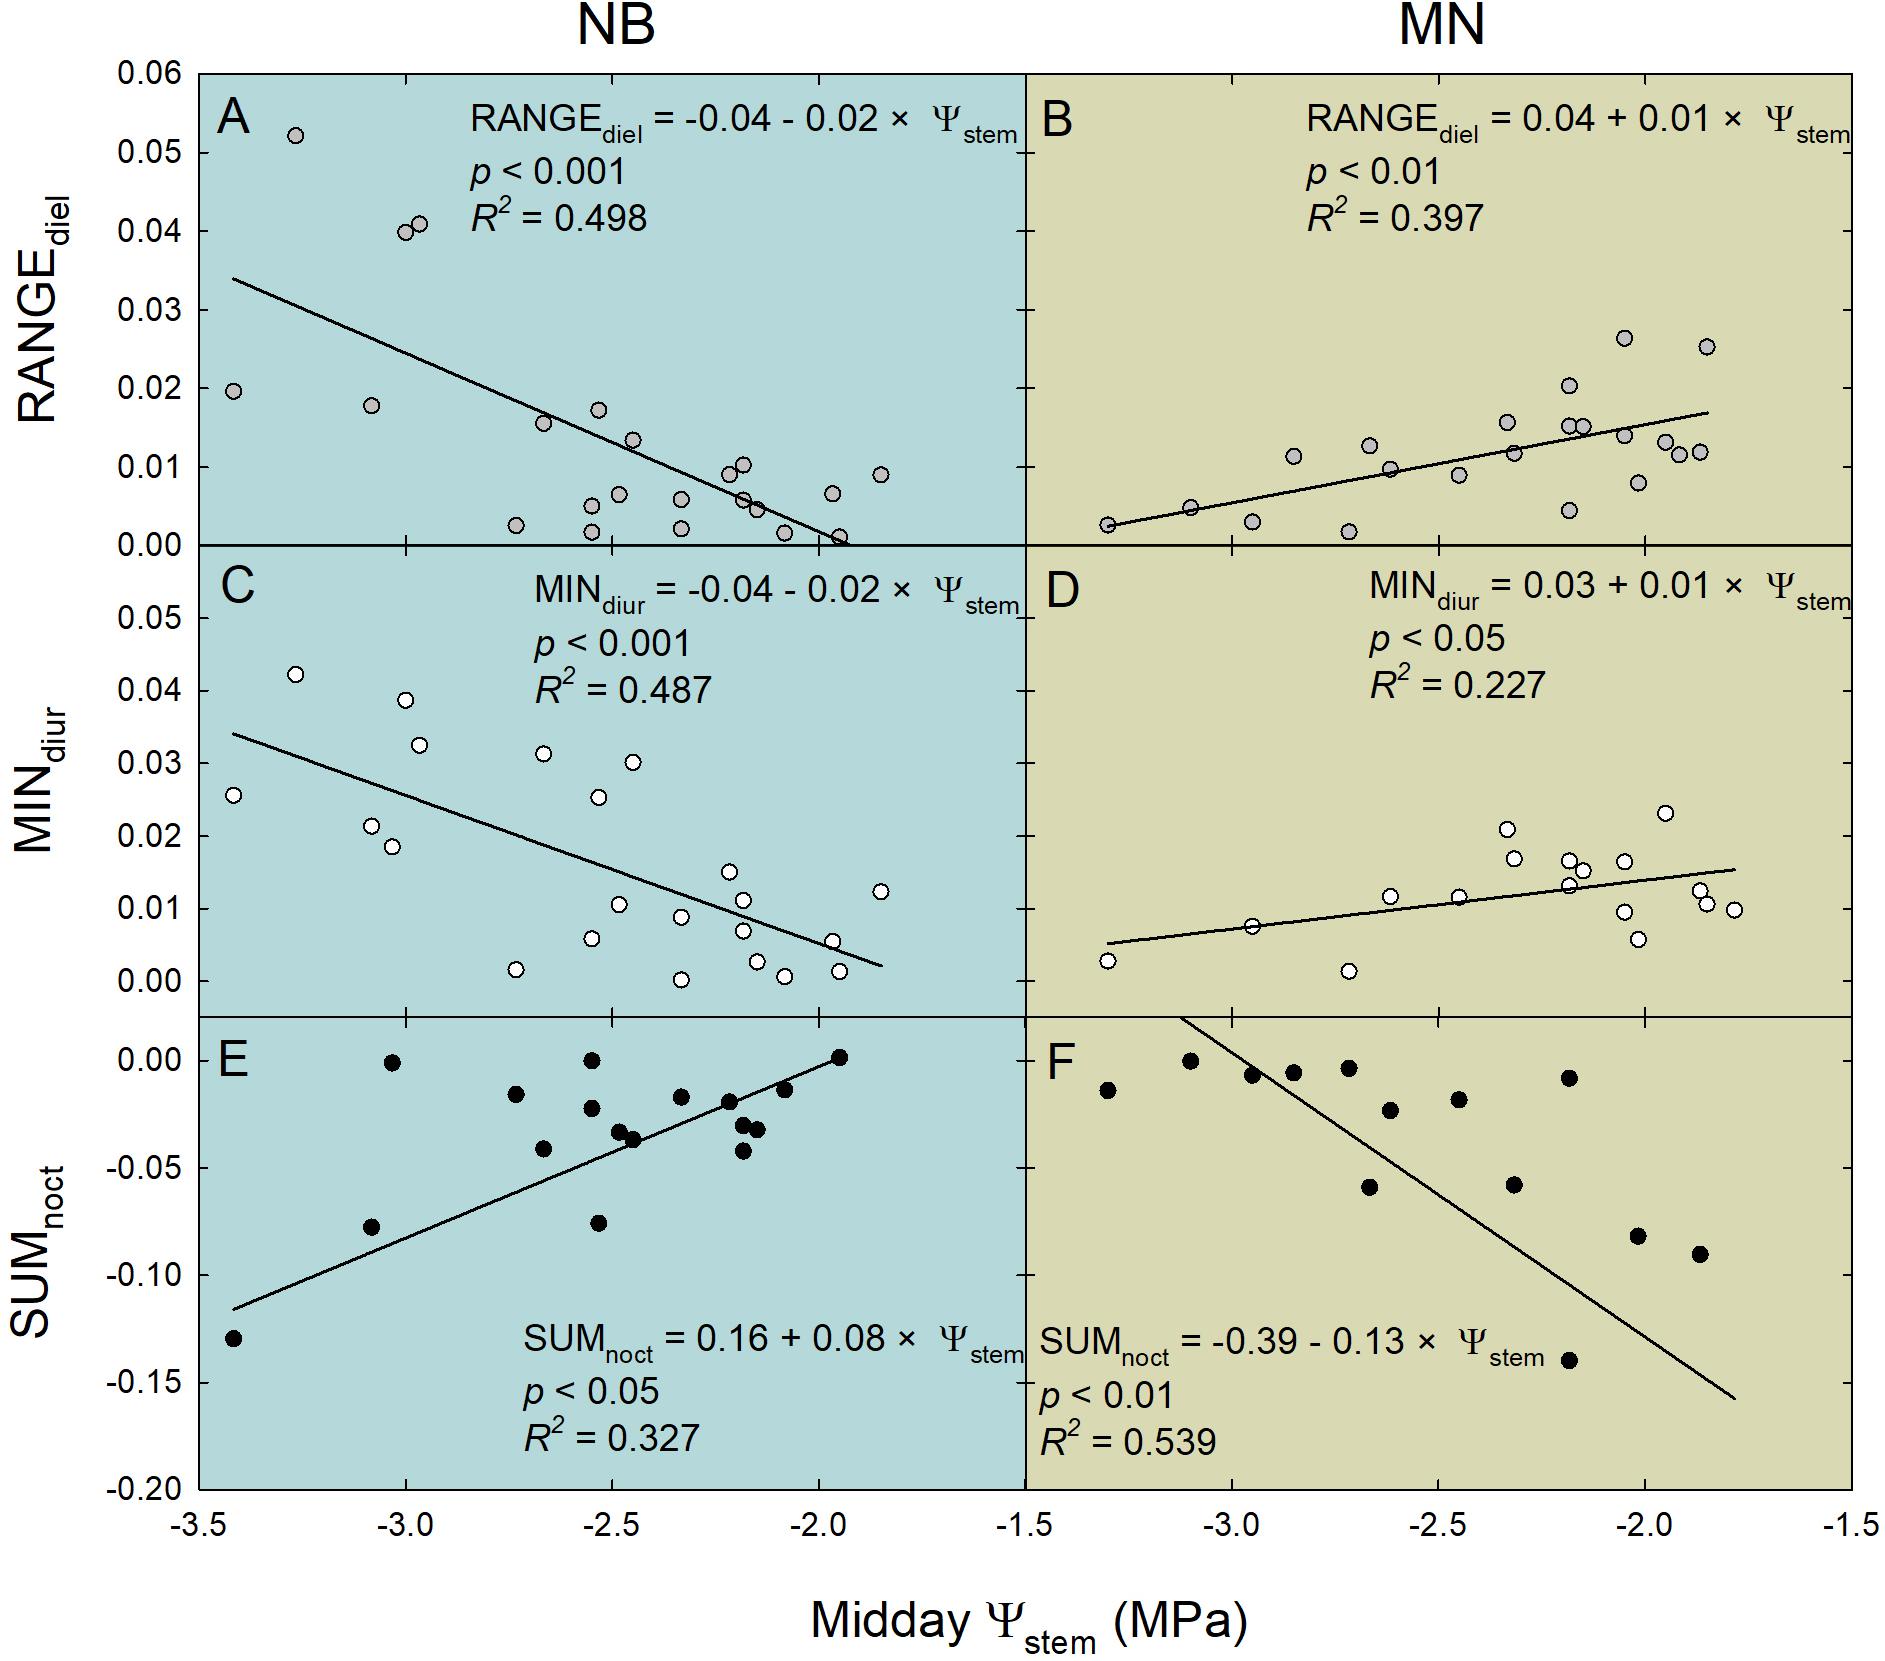
Figure 11. Linear relationships of ratios between the statistical parameters of the relative rate of fruit diameter change (RRfruit) and the relative rate of leaf pressure change (RRleaf) vs. midday stem water potential (Ψstem). RANGEdiel = diel [RANGE(RRfruit)/RANGE(RRleaf)] (A,B); MINdiur = diurnal [MIN(RRfruit)/MIN(RRleaf)] (C,D); SUMnoct = nocturnal [SUM(RRfruit)/SUM(RRleaf)] (E,F). Gray, white and black circles represent diel, diurnal and nocturnal data, respectively, for “Nocellara del Belice” (NB) and “Olivo di Mandanici” (MN) olive trees.
All the insights obtained so far suggest that fruit to leaf relationships in terms of RRfruit and RRleaf dynamics at different times of the day can be strictly related to midday Ψstem, thus, to plant water status.
The backward stepwise multiple regression analysis for NB indicated that most of the statistical parameters significantly contributed to the model in Eq. 3 (P < 0.05), and only MINdiur, RSDdiur [diurnal RSD(RRfruit)/diurnal RSD(RRleaf)] and MINnoct [nocturnal MIN(RRfruit)/nocturnal MIN(RRleaf)] were discarded. RSDnoct [nocturnal RSD(RRfruit)/nocturnal RSD(RRleaf)] provided the greatest contribution to the model (P < 0.001, F = 29.400). In the multiple regression model obtained for MN (Eq. 4), only four parameters were significant (P < 0.05): RANGEdiur [diurnal RANGE(RRfruit)/diurnal RANGE(RRleaf)], RSDdiur, MINdiur and RSDnoct. Also in this case, RSDnoct represented the parameter exhibiting the most relevant effect to the prediction of midday Ψstem (P < 0.001, F = 24.569).
where, r = diurnal [MAX (RRfruit)/MAX (RRleaf)]; s = diurnal [RANGE (RRfruit)/RANGE (RRleaf)]; t = diurnal [SUM (RRfruit)/SUM (RRleaf)]; u = nocturnal [MAX(RRfruit)/MAX (RRleaf)]; v = nocturnal [RANGE (RRfruit)/RANGE (RRleaf)]; w = nocturnal [SUM (RRfruit)/SUM (RRleaf)]; x = nocturnal [RSD (RRfruit)/RSD (RRleaf)]; y = diurnal [RSD (RRfruit)/RSD (RRleaf)]; z = diurnal [MIN (RRfruit)/MIN (RRleaf)].
A similar highly significant relationship of RSDnoct and midday Ψstem was also observed in nectarine (Scalisi et al., 2019c), and in both cases (i.e., olive and nectarine), the relationship of RSDnoct to Ψstem was negative (RSDnoct linear components in Eqs. 3, 4), suggesting that the variability of RRfruit at lower Ψstem is higher than the one of RRleaf. In other words, being the night the fraction of the 24 h at which both fruit and leaf tissues import water, when trees are severely stressed, fruit water import are relatively higher than leaf’s when compared to the same relationship in no water-deficit conditions. However, the two olive cultivars under study show different patterns of fruit and leaf water-exchange regulation at other times of the day under increasing water deficit gradients. NB seems to favor fruit water exchanges over leaf’s when water deficit increases (Figure 11A), as indicated by the wide fluctuations of fruit water in- and out-flows in trees under DI-0 conditions (Figure 8C). At the same time, DI-0 leaves reduce their transpiration and water in-flow leading to minimum turgor gain (Figure 8D). On the contrary, MN leaf water exchanges become predominant compared to fruit under water deficit conditions, whereas fluctuations of fruit water in- and out-flows are wider than leaf’s in FI trees (Figures 8G,H, 11B). This differentiation in the response to drought is likely to be due to both fruit and leaf characteristics. Indeed, the water potential in NB leaves is likely to go negative, as suggested by daily gs (Figure 5) and Ψstem (Figures 6A,B) trends. This leads to a higher loss of leaf cell turgor in NB, despite similar midday Ψstem to MN (Figure 7), as confirmed by the inversion of the pp curve at 223 DOY (Figures 8C,D). In turn, the low turgor leads to a decrease of RRleaf diel fluctuations. The most pronounced loss of turgor in NB leaves might also be driven by a lower leaf cell-wall elasticity in this cultivar than in MN, a trait that Bacelar et al. (2009) associated to less drought-tolerant genotypes. Concomitantly, NB fruit increase their RRfruit fluctuations in DI-0 conditions, perhaps driven by high cell-wall elasticity, acting as the main pump of water, fruit-to-leaf vascular flows. The generally significantly higher midday Ψstem exhibited by MN can also be associated to a relatively higher water potential in the leaves compared to NB, as also in this case stomatal regulation did not differ among irrigation levels. The hypothesized higher leaf osmotic adjustments and cell-wall elasticity in MN under drought may also be confirmed by the low tendency to an inversion of the pp curve (Figure 8F). In addition, the positive relationship between RANGEdiel and midday Ψstem in MN (Figure 8B) is determined by the lower fruit water exchanges at DI-0 levels (Figure 8G), which may be driven by lower fruit cell-wall elasticity in MN compared to NB.
The different mechanisms in the two cultivars were observed in an -ON year, and it would be interesting to further study tree responses in -OFF years, as Dell’Amico et al. (2012) and Girón et al. (2015) observed that in “Manzanillo” trees crop load influenced the ability of fruit and leaves to act as sinks for water. Changes in osmotic adjustments (Dichio et al., 1997, 2009; Lo Bianco and Scalisi, 2017) and cell-wall elasticity (Xiloyannis et al., 1993; Bacelar et al., 2009) along water deficit gradients have been reported for leaves. However, to the best of our knowledge, no consideration has been previously given to concomitant changes of similar drought tolerance mechanisms in fruit. Divergent physiological responses of fruit and leaf to drought might also be affected by different productive performance, fruit number and tree vigor. At harvest, MN showed significantly higher yield (Y = 7.30 ± 0.60 kg/tree), trunk cross-sectional area (TCSA = 51.3 ± 1.97 cm2), yield efficiency (YE = 0.14 ± 0.01 kg cm–2) and crop load (CL = 4562 ± 615 n. of fruit) compared to NB (Y = 3.78 ± 0.66 kg/tree, TCSA = 41.37 ± 1.49 cm2, YE = 0.09 ± 0.01 kg cm–2 and CL = 510 ± 100 n. of fruit). The greatly higher number of fruits in MN may represent a conspicuous water reservoir for the tree and be involved in a buffer effect on plant response to drought. NB compensates its low fruit number with an average fruit water content six-fold higher than MN (data not shown), for a total tree water storage in fruit tissues almost equivalent to MN trees. A divergent evolution of the two genotypes may have favored the development of diversified protective mechanisms that control fruit and leaf water exchanges under drought.
Conclusion
The results of this work suggest that overall a lower amount of water can be used for irrigation in MN, as this cultivar tends to lose leaf cell turgor at lower Ψstem than NB and therefore can be considered a drought-tolerant genotype. The behavior of NB is instead more compatible with drought-avoidance, as leaf stomatal conductance was moderate compared to MN, and in accordance with Scalisi et al. (2019a) who reported an increased root/leaf biomass ratio in NB under drought. Our findings reveal different strategies of fruit and leaf water exchanges in droughted trees, suggesting that olive genotypes can favor the water status of one organ over the other in conditions of water scarcity. The use of genotype-dependent models is therefore essential to determine how leaf and fruit water exchanges can be related to plant water status. These models can provide the basis for an automated modulation of irrigation in response to pre-defined thresholds of water deficit. The two models described in Eqs. 3, 4 can be used for a precise day-by-day assessment of midday Ψstem in the two cultivars under study, and in -ON years. Future studies should integrate responses from stage I in the multiple regression models.
Overall, this work confirms the advantages of combining fruit and leaf water dynamics for the prediction of plant water status in olive, whose suitability was just confirmed in a nectarine study (Scalisi et al., 2019c). Nevertheless, technologies that sense fruit and leaves water dynamics are still independent and need to be fit in a unique system for real-time monitoring. The use of this combined approach in other fruit species of horticultural interest is highly recommended, despite the complexity of a correct management of a large network of sensors.
Data availability statement
The raw data supporting the conclusions of this article will be made available by the authors, without undue reservation, to any qualified researcher.
Author Contributions
All authors contributed to conception and design of the study. FM, TC, and RL made available the equipment used in the experiment. AS carried out the field measurements and wrote the first draft of the manuscript. AS and RL performed the statistical analysis. GM, FM, TC, and RL contributed to the data interpretation. All authors contributed to manuscript revision, read and approved the submitted version.
Funding
The experiment was supported by a Ph.D. project funded with a scholarship issued by the Italian Ministry of Education and the University of Palermo.
Conflict of Interest
The authors declare that the research was conducted in the absence of any commercial or financial relationships that could be construed as a potential conflict of interest.
Acknowledgments
We gratefully acknowledge the technical support and field assistance provided by Federico Costa, Silvia Fretto, Laura Macaluso, Filipa Simões Grilo, Placido Volo, and the scientific support of Luca Corelli Grappadelli and Bartolomeo Dichio. This research was partly supported by a Ph.D. project funded with a scholarship issued by the Italian Ministry of Education and the University of Palermo.
References
Allen, R. G., Pereira, L. S., Raes, D., and Smith, M. (1998). Crop Evapotranspiration-Guidelines for Computing Crop Water Requirements-FAO Irrigation and Drainage Paper 56. Rome: FAO.
Bacelar, E. A., Correia, C. M., Moutinho-Pereira, J. M., Gonçalves, B. C., Lopes, J. I., and Torres-Pereira, J. M. (2004). Sclerophylly and leaf anatomical traits of five field-grown olive cultivars growing under drought conditions. Tree physiol. 24, 233–239. doi: 10.1093/treephys/24.2.233
Bacelar, E. A., Moutinho-Pereira, J. M., Gonçalves, B. C., Lopes, J. I., and Correia, C. M. (2009). Physiological responses of different olive genotypes to drought conditions. Acta Physiol. Plant 31, 611–621. doi: 10.1007/s11738-009-0272-9
Bacelar, E. A., Santos, D. L., Moutinho-Pereira, J. M., Gonçalves, B. C., Ferreira, H. F., and Correia, C. M. (2006). Immediate responses and adaptative strategies of three olive cultivars under contrasting water availability regimes: changes on structure and chemical composition of foliage and oxidative damage. Plant Sci. 170, 596–605. doi: 10.1016/j.plantsci.2005.10.014
Ben-Gal, A., Kool, D., Agam, N., van Halsema, G. E., Yermiyahu, U., Yafe, A., et al. (2010). Whole-tree water balance and indicators for short-term drought stress in non-bearing ‘Barnea’ olives. Agric. Water Manag. 98, 124–133. doi: 10.1016/j.agwat.2010.08.008
Connor, D. J. (2005). Adaptation of olive (Olea europaea L.) to water-limited environments. Aust. J. Agric. Res. 56, 1181–1189. doi: 10.1071/AR05169
Cuevas, M. V., Torres-Ruiz, J. M., Álvarez, R., Jiménez, M. D., Cuerva, J., and Fernández, J. E. (2010). Assessment of trunk diameter variation derived indices as water stress indicators in mature olive trees. Agric. Water Manag. 97, 1293–1302. doi: 10.1016/j.agwat.2010.03.011
Dell’Amico, J., Moriana, A., Corell, M., Girón, I. F., Morales, D., Torrecillas, A., et al. (2012). Low water stress conditions in table olive trees (Olea europaea L.) during pit hardening produced a different response of fruit and leaf water relations. Agric. Water Manag. 114, 11–17. doi: 10.1016/j.agwat.2012.06.004
Dichio, B., Margiotta, G., Xiloyannis, C., Bufo, S. A., Sofo, A., and Cataldi, T. R. (2009). Changes in water status and osmolyte contents in leaves and roots of olive plants (Olea europaea L.) subjected to water deficit. Trees 23, 247–256. doi: 10.1007/s00468-008-0272-1
Dichio, B., Nuzzo, V., Xiloyannis, C., Celano, G., and Angelopoulos, K. (1997). Drought stress-induced variation of pressure-volume relationships in Olea europaea L. Cv. “Coratina”. Acta Hortic. 449, 401–410. doi: 10.17660/ActaHortic.1997.449.56
Dichio, B., Xiloyannis, C., Angelopoulos, K., Nuzzo, V., Bufo, S. A., and Celano, G. (2003). Drought-induced variations of water relations parameters in Olea europaea. Plant Soil 257, 381–389. doi: 10.1023/a:1027392831483
Ehrenberger, W., Rüger, S., Rodríguez−Domínguez, C. M., Díaz−Espejo, A., Fernández, J. E., Moreno, J., et al. (2012). Leaf patch clamp pressure probe measurements on olive leaves in a nearly turgorless state. Plant Biol. 14, 666–674. doi: 10.1111/j.1438-8677.2011.00545.x
Ennajeh, M., Vadel, A. M., Cochard, H., and Khemira, H. (2010). Comparative impacts of water stress on the leaf anatomy of a drought-resistant and a drought-sensitive olive cultivar. J. Hortic. Sci. Biotechnol. 85, 289–294. doi: 10.1080/14620316.2010.11512670
Fernandes, R. D. M., Cuevas, M. V., Diaz-Espejo, A., and Hernandez-Santana, V. (2018). Effects of water stress on fruit growth and water relations between fruits and leaves in a hedgerow olive orchard. Agric. Water Manag. 210, 32–40. doi: 10.1016/j.agwat.2018.07.028
Fernándes, R. D. M., Cuevas, M. V., Hernandez-Santana, V., Rodriguez-Dominguez, C. M., Padilla-Díaz, C. M., and Fernández, J. E. (2017). Classification models for automatic identification of daily states from leaf turgor related measurements in olive. Comput. Electron. Agric. 142, 181–189. doi: 10.1016/j.compag.2017.09.005
Fernández, J. E. (2014). Plant-based sensing to monitor water stress: Applicability to commercial orchards. Agric. Water Manag. 142, 99–109. doi: 10.1016/j.agwat.2014.04.017
Fernández, J. E. (2017). Plant-based methods for irrigation scheduling of woody crops. Horticulturae 3:35. doi: 10.3390/horticulturae3020035
Fernández, J. E., Díaz-Espejo, A., Infante, J. M., Durán, P., Palomo, M. J., Chamorro, V., et al. (2006). Water relations and gas exchange in olive trees under regulated deficit irrigation and partial rootzone drying. Plant Soil 284, 273–291. doi: 10.1007/s11104-006-0045-9
Fernández, J. E., Rodriguez-Dominguez, C. M., Perez-Martin, A., Zimmermann, U., Rüger, S., Martín-Palomo, M. J., et al. (2011a). Online-monitoring of tree water stress in a hedgerow olive orchard using the leaf patch clamp pressure probe. Agric. Water Manag. 100, 25–35. doi: 10.1016/j.agwat.2011.08.015
Fernández, J. E., Torres-Ruiz, J. M., Díaz-Espejo, A., Montero, A., Álvarez, R., Jiménez, M. D., et al. (2011b). Use of maximum trunk diameter measurements to detect water stress in mature ‘Arbequina’ olive trees under deficit irrigation. Agric. Water Manag. 98, 1813–1821. doi: 10.1016/j.agwat.2011.06.011
Girón, I. F., Corell, M., Galindo, A., Torrecillas, E., Morales, D., Dell’Amico, J., et al. (2015). Changes in the physiological response between leaves and fruits during a moderate water stress in table olive trees. Agric. Water Manag. 148, 280–286. doi: 10.1016/j.agwat.2014.10.024
Gucci, R., Grimelli, A., Costagli, G., Tognetti, R., Minnocci, A., and Vitagliano, C. (2000). Stomatal characteristics of two olive cultivars “Frantoio” and “Leccino”. Acta Hortic. 586, 541–544. doi: 10.17660/ActaHortic.2002.586.113
Karamanos, A. J. (1984). “Ways of detecting adaptive responses of cultivated plants to drought. An agronomic approach,” in Being Alive On Land. Tasks For Vegetation Science, Vol. 13, eds N. S. Margaris, M. Arianoustou-Faraggitaki, and W. C. Oechel, (Dordrecht: Springer), 91–101. doi: 10.1007/978-94-009-6578-2_12
Lo Bianco, R., and Scalisi, A. (2017). Water relations and carbohydrate partitioning of four greenhouse-grown olive genotypes under long-term drought. Trees 31, 717–727. doi: 10.1007/s00468-016-1502-6
Marino, G., Caruso, T., Ferguson, L., and Marra, F. P. (2018). Gas exchanges and stem water potential define stress thresholds for efficient irrigation management in olive (Olea europea L.). Water 10, 342. doi: 10.3390/w10030342
Marino, G., Macaluso, L., Grilo, F., Marra, F. P., and Caruso, T. (2019). Toward the valorization of olive (Olea europaea var. europaea L.) biodiversity: horticultural performance of seven Sicilian cultivars in a hedgerow planting system. Sci. Hortic. 256:108583. doi: 10.1016/j.scienta.2019.108583
Marino, G., Macaluso, L., Marra, F. P., Ferguson, L., Marchese, A., Campisi, G., et al. (2017). Horticultural performance of 23 Sicilian olive genotypes in hedgerow systems: vegetative growth, productive potential and oil quality. Sci. Hortic. 217, 217–225. doi: 10.1016/j.scienta.2017.01.046
Marino, G., Pernice, F., Marra, F. P., and Caruso, T. (2016). Validation of an online system for the continuous monitoring of tree water status for sustainable irrigation managements in olive (Olea europaea L.). Agric. Water Manag. 177, 298–307. doi: 10.1016/j.agwat.2016.08.010
Morandi, B., Manfrini, L., Zibordi, M., Noferini, M., Fiori, G., and Corelli Grappadelli, L. (2007). A low-cost device for accurate and continuous measurements of fruit diameter. HortScience 42, 1380–1382. doi: 10.21273/hortsci.42.6.1380
Moreno, F., Conejero, W., Martín-Palomo, M. J., Girón, I. F., and Torrecillas, A. (2006). Maximum daily trunk shrinkage reference values for irrigation scheduling in olive trees. Agric. Water Manag. 84, 290–294. doi: 10.1016/j.agwat.2006.03.005
Moriana, A., and Fereres, E. (2002). Plant indicators for scheduling irrigation of young olive trees. Irrig. Sci. 21, 83–90. doi: 10.1007/s00271-001-0053-8
Moriana, A., Pérez-López, D., Prieto, M. H., Ramírez-Santa-Pau, M., and Pérez-Rodriguez, J. M. (2012). Midday stem water potential as a useful tool for estimating irrigation requirements in olive trees. Agric. Water Manag. 112, 43–54. doi: 10.1016/j.agwat.2012.06.003
Padilla-Díaz, C. M., Rodriguez-Dominguez, C. M., Hernandez-Santana, V., Perez-Martin, A., and Fernández, J. E. (2016). Scheduling regulated deficit irrigation in a hedgerow olive orchard from leaf turgor pressure related measurements. Agric. Water Manag. 164, 28–37. doi: 10.1016/j.agwat.2015.08.002
Parent, B., Hachez, C., Redondo, E., Simonneau, T., Chaumont, F., and Tardieu, F. (2009). Drought and abscisic acid effects on aquaporin content translate into changes in hydraulic conductivity and leaf growth rate: a trans-scale approach. Plant Physiol. 149, 2000–2012. doi: 10.1104/pp.108.130682
Patakas, A., and Noitsakis, B. (1997). Cell wall elasticity as a mechanism to maintain favorable water relations during leaf ontogeny in grapevines. Am. J. Enol. Viticult. 48, 352–356.
Rodriguez-Dominguez, C. M., Ehrenberger, W., Sann, C., Rüger, S., Sukhorukov, V., Martín-Palomo, M. J., et al. (2012). Concomitant measurements of stem sap flow and leaf turgor pressure in olive trees using the leaf patch clamp pressure probe. Agric. Water Manag. 114, 50–58. doi: 10.1016/j.agwat.2012.07.007
Rodriguez-Dominguez, C. M., Hernandez-Santana, V., Buckley, T. N., Fernández, J. E., and Diaz-Espejo, A. (2019). Sensitivity of olive leaf turgor to air vapour pressure deficit correlates with diurnal maximum stomatal conductance. Agric. Forest Meteorol. 272, 156–165. doi: 10.1016/j.agrformet.2019.04.006
Savitzky, A., and Golay, M. J. (1964). Smoothing and differentiation of data by simplified least squares procedures. Anal. Chem. 36, 1627–1639. doi: 10.1021/ac60214a047
Scalisi, A., Bresilla, K., and Simões Grilo, F. (2017). Continuous determination of fruit tree water-status by plant-based sensors. Italus Hortus 24, 39–50. doi: 10.26353/j.itahort/2017.2.3950
Scalisi, A., Marra, F. P., Caruso, T., Illuminati, C., Costa, F., and Lo Bianco, R. (2019a). Transpiration rates and hydraulic conductance of two olive genotypes with different sensitivity to drought. Acta Hortic. 1253, 421–428. doi: 10.17660/ActaHortic.2019.1253.55
Scalisi, A., O’Connell, M. G., Lo Bianco, R., and Stefanelli, D. (2019b). Continuous detection of new plant water status indicators in stage I of nectarine fruit growth. Acta Hortic. 1253, 9–16. doi: 10.17660/ActaHortic.2019.1253.2
Scalisi, A., O’Connell, M. G., Stefanelli, D., and Lo Bianco, R. (2019c). Fruit and leaf sensing for continuous detection of nectarine water status. Front. Plant Sci. 10:805. doi: 10.3389/fpls.2019.00805
Tognetti, R., Raschi, A., Béres, C., Fenyvesi, A., and Ridder, H. W. (1996). Comparison of sap flow, cavitation and water status of Quercus petraea and Quercus cerris trees with special reference to computer tomography. Plant Cell Environ. 19, 928–938. doi: 10.1111/j.1365-3040.1996.tb00457.x
Turner, N. C. (1988). Measurement of plant water status by the pressure chamber technique. Irrig. Sci. 9, 289–308. doi: 10.1007/bf00296704
Xiloyannis, C., Dichio, B., and Nuzzo, V. (1993). “Meccanismi di risposta dell’olivo alla carenza idrica,” Atti del convegno Tecniche, Norme e Qualitá in Olivicoltura. Potenza, Italy: 123–136.
Keywords: drought, fruit diameter, sustainable irrigation, turgor pressure, water deficit, water potential
Citation: Scalisi A, Marino G, Marra FP, Caruso T and Lo Bianco R (2020) A Cultivar-Sensitive Approach for the Continuous Monitoring of Olive (Olea europaea L.) Tree Water Status by Fruit and Leaf Sensing. Front. Plant Sci. 11:340. doi: 10.3389/fpls.2020.00340
Received: 06 December 2019; Accepted: 06 March 2020;
Published: 24 March 2020.
Edited by:
Juan Pedro Ferrio, Fundacion Agencia Aragonesa para la Investigacion y el Desarrollo, SpainReviewed by:
Antonio Diaz Espejo, Institute of Natural Resources and Agrobiology of Seville (CSIC), SpainSalvatore Camposeo, University of Bari Aldo Moro, Italy
Copyright © 2020 Scalisi, Marino, Marra, Caruso and Lo Bianco. This is an open-access article distributed under the terms of the Creative Commons Attribution License (CC BY). The use, distribution or reproduction in other forums is permitted, provided the original author(s) and the copyright owner(s) are credited and that the original publication in this journal is cited, in accordance with accepted academic practice. No use, distribution or reproduction is permitted which does not comply with these terms.
*Correspondence: Alessio Scalisi, YWxlc3Npby5zY2FsaXNpQGFncmljdWx0dXJlLnZpYy5nb3YuYXU=; YWxlc3Npby5zY2FsaXNpQHVuaXBhLml0