 Spencer P. Hunt1
 David E. Jarvis1Dallas J. Larsen1
 Sergei L. Mosyakin2
 Bozena A. Kolano3Eric W. Jackson4Sara L. Martin5
 Eric N. Jellen1*
 Peter J. Maughan1
- 1Department of Plant and Wildlife Sciences, Brigham Young University, Provo, UT, United States
- 2M.G. Kholodny Institute of Botany, National Academy of Sciences of Ukraine, Kyiv, Ukraine
- 3Institute of Biology, Biotechnology and Environmental Protection, Faculty of Natural Sciences, University of Silesia in Katowice, Katowice, Poland
- 425:2 Solutions, Rockford, MN, United States
- 5Agriculture and Agri-Food Canada, Ottawa Research and Development Centre, Ottawa, ON, Canada
Atriplex hortensis (2n = 2x = 18, 1C genome size ∼1.1 gigabases), also known as garden orach and mountain-spinach, is a highly nutritious, broadleaf annual of the Amaranthaceae-Chenopodiaceae alliance (Chenopodiaceae sensu stricto, subfam. Chenopodioideae) that has spread in cultivation from its native primary domestication area in Eurasia to other temperate and subtropical regions worldwide. Atriplex L. is a highly complex but, as understood now, a monophyletic group of mainly halophytic and/or xerophytic plants, of which A. hortensis has been a vegetable of minor importance in some areas of Eurasia (from Central Asia to the Mediterranean) at least since antiquity. Nonetheless, it is a crop with tremendous nutritional potential due primarily to its exceptional leaf and seed protein quantities (approaching 30%) and quality (high levels of lysine). Although there is some literature describing the taxonomy and production of A. hortensis, there is a general lack of genetic and genomic data that would otherwise help elucidate the genetic variation, phylogenetic positioning, and future potential of the species. Here, we report the assembly of the first high-quality, chromosome-scale reference genome for A. hortensis cv. “Golden.” Long-read data from Oxford Nanopore’s MinION DNA sequencer was assembled with the program Canu and polished with Illumina short reads. Contigs were scaffolded to chromosome scale using chromatin-proximity maps (Hi-C) yielding a final assembly containing 1,325 scaffolds with a N50 of 98.9 Mb – with 94.7% of the assembly represented in the nine largest, chromosome-scale scaffolds. Sixty-six percent of the genome was classified as highly repetitive DNA, with the most common repetitive elements being Gypsy-(32%) and Copia-like (11%) long-terminal repeats. The annotation was completed using MAKER which identified 37,083 gene models and 2,555 tRNA genes. Completeness of the genome, assessed using the Benchmarking Universal Single Copy Orthologs (BUSCO) metric, identified 97.5% of the conserved orthologs as complete, with only 2.2% being duplicated, reflecting the diploid nature of A. hortensis. A resequencing panel of 21 wild, unimproved and cultivated A. hortensis accessions revealed three distinct populations with little variation within subpopulations. These resources provide vital information to better understand A. hortensis and facilitate future study.
Introduction
Atriplex hortensis L. (2n = 9x = 18), also known as garden orach or mountain-spinach, is a highly nutritious, leafy annual plant. It is a moderately xero-halophytic species that is resistant to salinity, a wide range of temperatures, and drought. Originating in Eurasia, A. hortensis has been a minor vegetable food source in multiple areas of the Trans-Himalayan region and has since become naturalized throughout the Americas. It exhibits incredible variation in pigmentation as a result of its variable content of betalains, as well as substantial differences in height and seed production (Tanaka et al., 2008; Simcox and Stonescu, 2014).
Atriplex hortensis has been recognized for its medicinal properties which were shown to improve digestion, increase circulation and boost the immune system (Rinchen et al., 2017). Additionally, A. hortensis has been used in land rehabilitation projects because of its ability to establish well, grow rapidly, reduce soil erosion and compete with native plants (McArthur et al., 1983; Simon et al., 1994; Wright et al., 2002). As a result, A. hortensis is important for both domestic and wild browsing animals where other forage crops are lacking. Despite its affinity for low to moderate saline areas where it has little competition from non-halophytes, A. hortensis can also grow where total soluble salts are low, making it well suited to a multitude of different environments (Welsh and Crompton, 1995).
As the world continues to search for new ways to feed its ever-growing population, new food sources have gained popularity that have helped provide diversity to diets while capitalizing on less desirable, underutilized or even fallow landscapes for agriculture. Given its xero-halophytic characteristics, A. hortensis is an intriguing candidate for contributing to world food security, especially in areas rich in saline soils. In comparison to other leafy vegetable crops, A. hortensis seeds and leaves are both edible and have protein contents of 26% (dry weight) in seeds, which is comparable to some legumes (Wright et al., 2002), and 35% (dry weight) in leaves, which is higher than spinach (Spinacea oleracea L.), a close relative of A. hortensis also belonging to the same subfamily Chenopodioideae, but to a different tribe (Anserineae; see Fuentes-Bazan et al., 2012). However, the seeds contain antinutritional saponins that must be removed by washing and/or seed abrasion. In this respect A. hortensis resembles its distant relative quinoa (Chenopodium quinoa Willd.); the name recently formally proposed for nomenclatural conservation (Mosyakin and Walter, 2018), which also contains saponins. Interestingly, sweet varieties of quinoa have been identified that have a nonsense mutation in the regulator of the saponin biosynthetic pathways (Jarvis et al., 2017) – suggesting similar pathways could be targeted to remove antinutritional saponins in A. hortensis. The seeds of A. hortensis have higher fat, ash, fiber and lysine contents than most cereal grains (Wright et al., 2002). Its high protein content, which includes an essential amino acid profile that meets the WHO and UN-FAO recommended adult levels, also makes A. hortensis very attractive as a novel protein source.
Atriplex hortensis belongs to the family Chenopodiaceae in the strict sense, which is now often included in the extended family Amaranthaceae sensu lato; this group (Chenopodiaceae+Amaranthaceae) is phylogenetically nested in the core clade of the order Caryophyllales, which in turn, belongs to core eudicots, the largest and most diverse clade of angiosperms (for an overview of high-level phylogeny of the group, see Hernández-Ledesma et al., 2015; APG IV, 2016, and references therein).
The merger of the traditionally recognized families Chenopodiaceae and Amaranthaceae sensu stricto into one family under the priority name Amaranthaceae sensu lato proposed already in the first version of the APG system (APG (Angiosperm Phylogeny Group), 1998) remained unchanged in all other APG modifications (see, APG IV, 2016, and references therein). It was widely followed by many researchers and users of botanical nomenclature, but usually not by the experts in taxonomy of Chenopodiaceae (s. str.), who mainly continued to accept the two families. Not discussing here the reasons of and arguments for the two concepts of familial and subfamilial delimitation in the Amaranthaceae/Chenopodiaceae alliance (which will be discussed in a separate article, now in progress), we, however, note that the merger of the two families resulted in some confusion and miscommunication in recent literature regarding the usage of family names, and especially names of infrafamilial suprageneric entities (such as subfamilies and tribes). For example, some authors use the subfamily name Amaranthoideae in its traditional sense for just one group in Amaranthaceae s. str., while others may use it to cover all formerly recognized groups in Amaranthaceae s. str. (including Amaranthoideae, Gomphrenoideae, etc.). To avoid any uncertainty, we conventionally use in the present article the following nomenclature (both formal and informal names): (1) the group uniting Chenopodiaceae and Amaranthaceae s. str. (forming together the extended Amaranthaceae sensu APG) is referred to under an informal designation “Amaranthaceae/Chenopodiaceae aliance;” (2) the family-rank names Amaranthaceae and Chenopodiaceae refer to the groups corresponding to the two traditionally recognized families; and (3) the sufbamily-rank name Chenopodioideae (in paralel with other recognized subfamilies, such as Betoideae, Salsoloideae, etc.) corresponds to just one group of Chenopodiaceae s. str., but not to the group covering the whole family Chenopodiaceae in its traditional circumscription; similarly, Amaranthoideae refers to the subfamily-rank subdivision of Amaranthaceae s. str., comparable to Gomphrenoideae.
Recent molecular phylogenetic and taxonomic studies have led to considerable improvements in taxonomy and in our understanding of phylogenetic relationships in the order Caryophyllales in general and Atriplex and its closer relatives in particular (Kadereit et al., 2010; Zacharias and Baldwin, 2010; Brignone et al., 2019; Morales-Briones et al., 2020). However, few molecular studies have been focused specifically on A. hortensis in recent years.
As it is viewed now, Atriplex is nested in the larger clade corresponding to the tribe Atripliceae (including Chenopodieae, which is the correct name for the group if placed in Chenopodiaceae, not Amaranthaceae s.l.) as outlined by Fuentes-Bazan et al. (2012), and/or to a smaller clade corresponding to the tribe Atripliceae in a narrower sense, as outlined by Kadereit et al. (2010). The Atripliceae in the narrow sense is sister to another clade (informally called Chenopodieae I; see Kadereit et al., 2010) containing Chenopodium s. str. (including Australian Rhagodia R. Br. and Einadia Raf.; see Fuentes-Bazan et al., 2012; Mosyakin and Iamonico, 2017) in its much restricted sense, excluding taxa formerly placed in Chenopodium sensu lato but now recognized in phylogenetically more distant genera Blitum L. (which is close to Spinacia L.), Chenopodiastrum S. Fuentes, Uotila & Borsch, Dysphania R. Br., Lipandra Moq., Oxybasis Kar. & Kir., and Teloxys Moq. (see Fuentes-Bazan et al., 2012; Hernández-Ledesma et al., 2015).
The clade of Atripliceae (sensu Kadereit et al., 2010) contains two main subclades (informally named as the Archiatriplex-clade and Atriplex-clade) with several smaller lineages, some of which are currently recognized as separate genera. As circumscribed now, the phylogenetically coherent and monophyletic Atriplex includes several groups that were earlier described and recognized as separate genera, such as Obione Gaertn. and some Australian and North American groups. Despite morphological distinctiveness of some of those groups, they are phylogenetically deeply rooted in Atrilpex and thus their recognition as separate genera is not recommended. In contrast, several genera are recognized in the Archiatriplex-clade, namely Archiatriplex G.L.Chu, Exomis Fenzl ex Moq., Extriplex E.H. Zacharias, Grayia Hook. & Arn., Holmbergia Hicken, Manochlamys Aellen, Microgynoecium Hook. f., Proatriplex (W.A.Weber) Stutz & G.L. Chu, and Stutzia E.H. Zacharias (Kadereit et al., 2010; Brignone et al., 2019). They represent relicts of earlier diversification events in the group. Also, some additional early-branching (“basal”) lineages of the Atriplex-clade can also probably be recognized as separate genera. For example, in addition to the currently recognized genera Halimione Aellen and Atriplex s. str. (Kadereit et al., 2010), such groups as Cremnophyton Brullo & Pavone from Malta containing C. lafrancoi Brullo & Pavone (=Atriplex lafrancoi (Brullo & Pavone) G. Kadereit & Sukhorukov; see Kadereit et al., 2010) and the mainly Central Asian Sukhorukovia Vasjukov (2015) with S. cana (C.A. Mey.) Vasjukov (Atriplex cana C.A. Mey. = Cremnophyton canum (C.A. Mey.) G.L. Chu) may be probably assigned the generic rank after further research.
Since A. hortensis is the nomenclatural type of the genus, it naturally belongs to Atriplex subgen. Atriplex sect. Atriplex (Art. 22.1 of the International Code for Nomenclature of algae, fungi and plants: Turland et al., 2018). This section houses at least two other species, A. sagittata Borkh. (earlier often known under the synonymous name A. nitens Schkuhr) and A. aucheri Moq., which seem to be most closely related to A. hortensis (Sukhorukov, 2006). The clade of A. hortensis and its two close relatives belongs to the grade of early-branching clades of Atriplex s. str. containing taxa with C3 photosynthesis (Brignone et al., 2019).
The geographic and taxonomic origins of domesticated A. hortensis remain elusive because at present the species is known mostly (or exclusively?) in cultivated and escaped (and locally naturalized) populations. It probably originated somewhere within the geographic ranges of its closest relatives, in Central Asia or adjacent regions, or it could be native in the Mediterranean region and/or Asia Minor (Sukhorukov, 2014).
Although recent studies have tested the limits of salt-tolerance of A. hortensis (Vickerman et al., 2002; Sai Kachout et al., 2011), there has been little to no research conducted to develop genetic tools necessary for accelerating A. hortensis breeding. One phenotypic characteristic in need of improvement for seed production is the panicle, which consists of two types of flowers usually mixed on the same plant. One type produces 3–5 mm diameter seed that are encased within large, papery bracteoles that are not retained well under windy conditions at maturity. The other flower type produces 1–2 mm black fruits/seeds that have no bracteoles but are instead subtended by easily removed tepals.
To better understand the underlying genetic basis of the xero-halophytic, nutritive and unique pigmentation characteristics of A. hortensis, and to more accurately assess phylogenetic relationships within its family and genus, we sequenced the A. hortensis genome. We show that ultra-long reads produced by the portable, real-time Oxford Nanopore Technology (Oxford, United Kingdom) MinION sequencing system (Lu et al., 2016) with short-read polishing and chromatin-contact mapping is an effective approach to generate a high-quality genome assembly in a moderately large and complex genome of a diploid plant species. We annotated the genome with a deeply sequenced transcriptome from various A. hortensis plant tissues, and we demonstrate the quality of the chromosome-level genome assembly and annotation using Benchmarking Universal Single-Copy Orthologs (BUSCO) (Simão et al., 2015) to assess the completeness of the assembled genome. Genomic comparison to other Caryophyllales within the Amaranthaceae-Chenopodiaceae family identified highly syntenic and orthologous chromosomal relationships. Together, these resources provide an initial, important foundation for accelerated genetic improvement to neodomesticate this potentially valuable crop.
Materials and Methods
Plant Material
Atriplex hortensis cv. “Golden” was obtained from Wild Garden Seed (Philomath, Oregon) and used for whole-genome sequencing and assembly. Sterilized seed were grown hydroponically in a growth chamber at BYU. An 11-h photoperiod was maintained using broad-spectrum light sources. Growing temperatures ranged from 18°C (night) to 20°C (day). Hydroponic growth solution, changed weekly, was made from MaxiBloom® Hydroponics Plant Food (General Hydroponics, Sevastopol, CA, United States) at a concentration of 1.7 g/L.
The resequencing panel consisted of 21 A. hortensis accessions: 15 from the United States Department of Agriculture collection (USDA, ARS, NALPGRU;1); five each from two separate commercial seed vendors (Baker Creek Heirloom Seed Company, Mansfield, Missouri and Wild Garden Seed, Philomath, Oregon); and one accession collected in the wild in Utah (BYU 1317 from Park City, Utah). Plants used in the resequencing panel were originally collected from across Europe (France, Poland, countries of the former Soviet Union, former Serbia/Montenegro and Norway) and North America (United States, and Canada). A complete list of all plant materials including passport information is provided in Table 1.
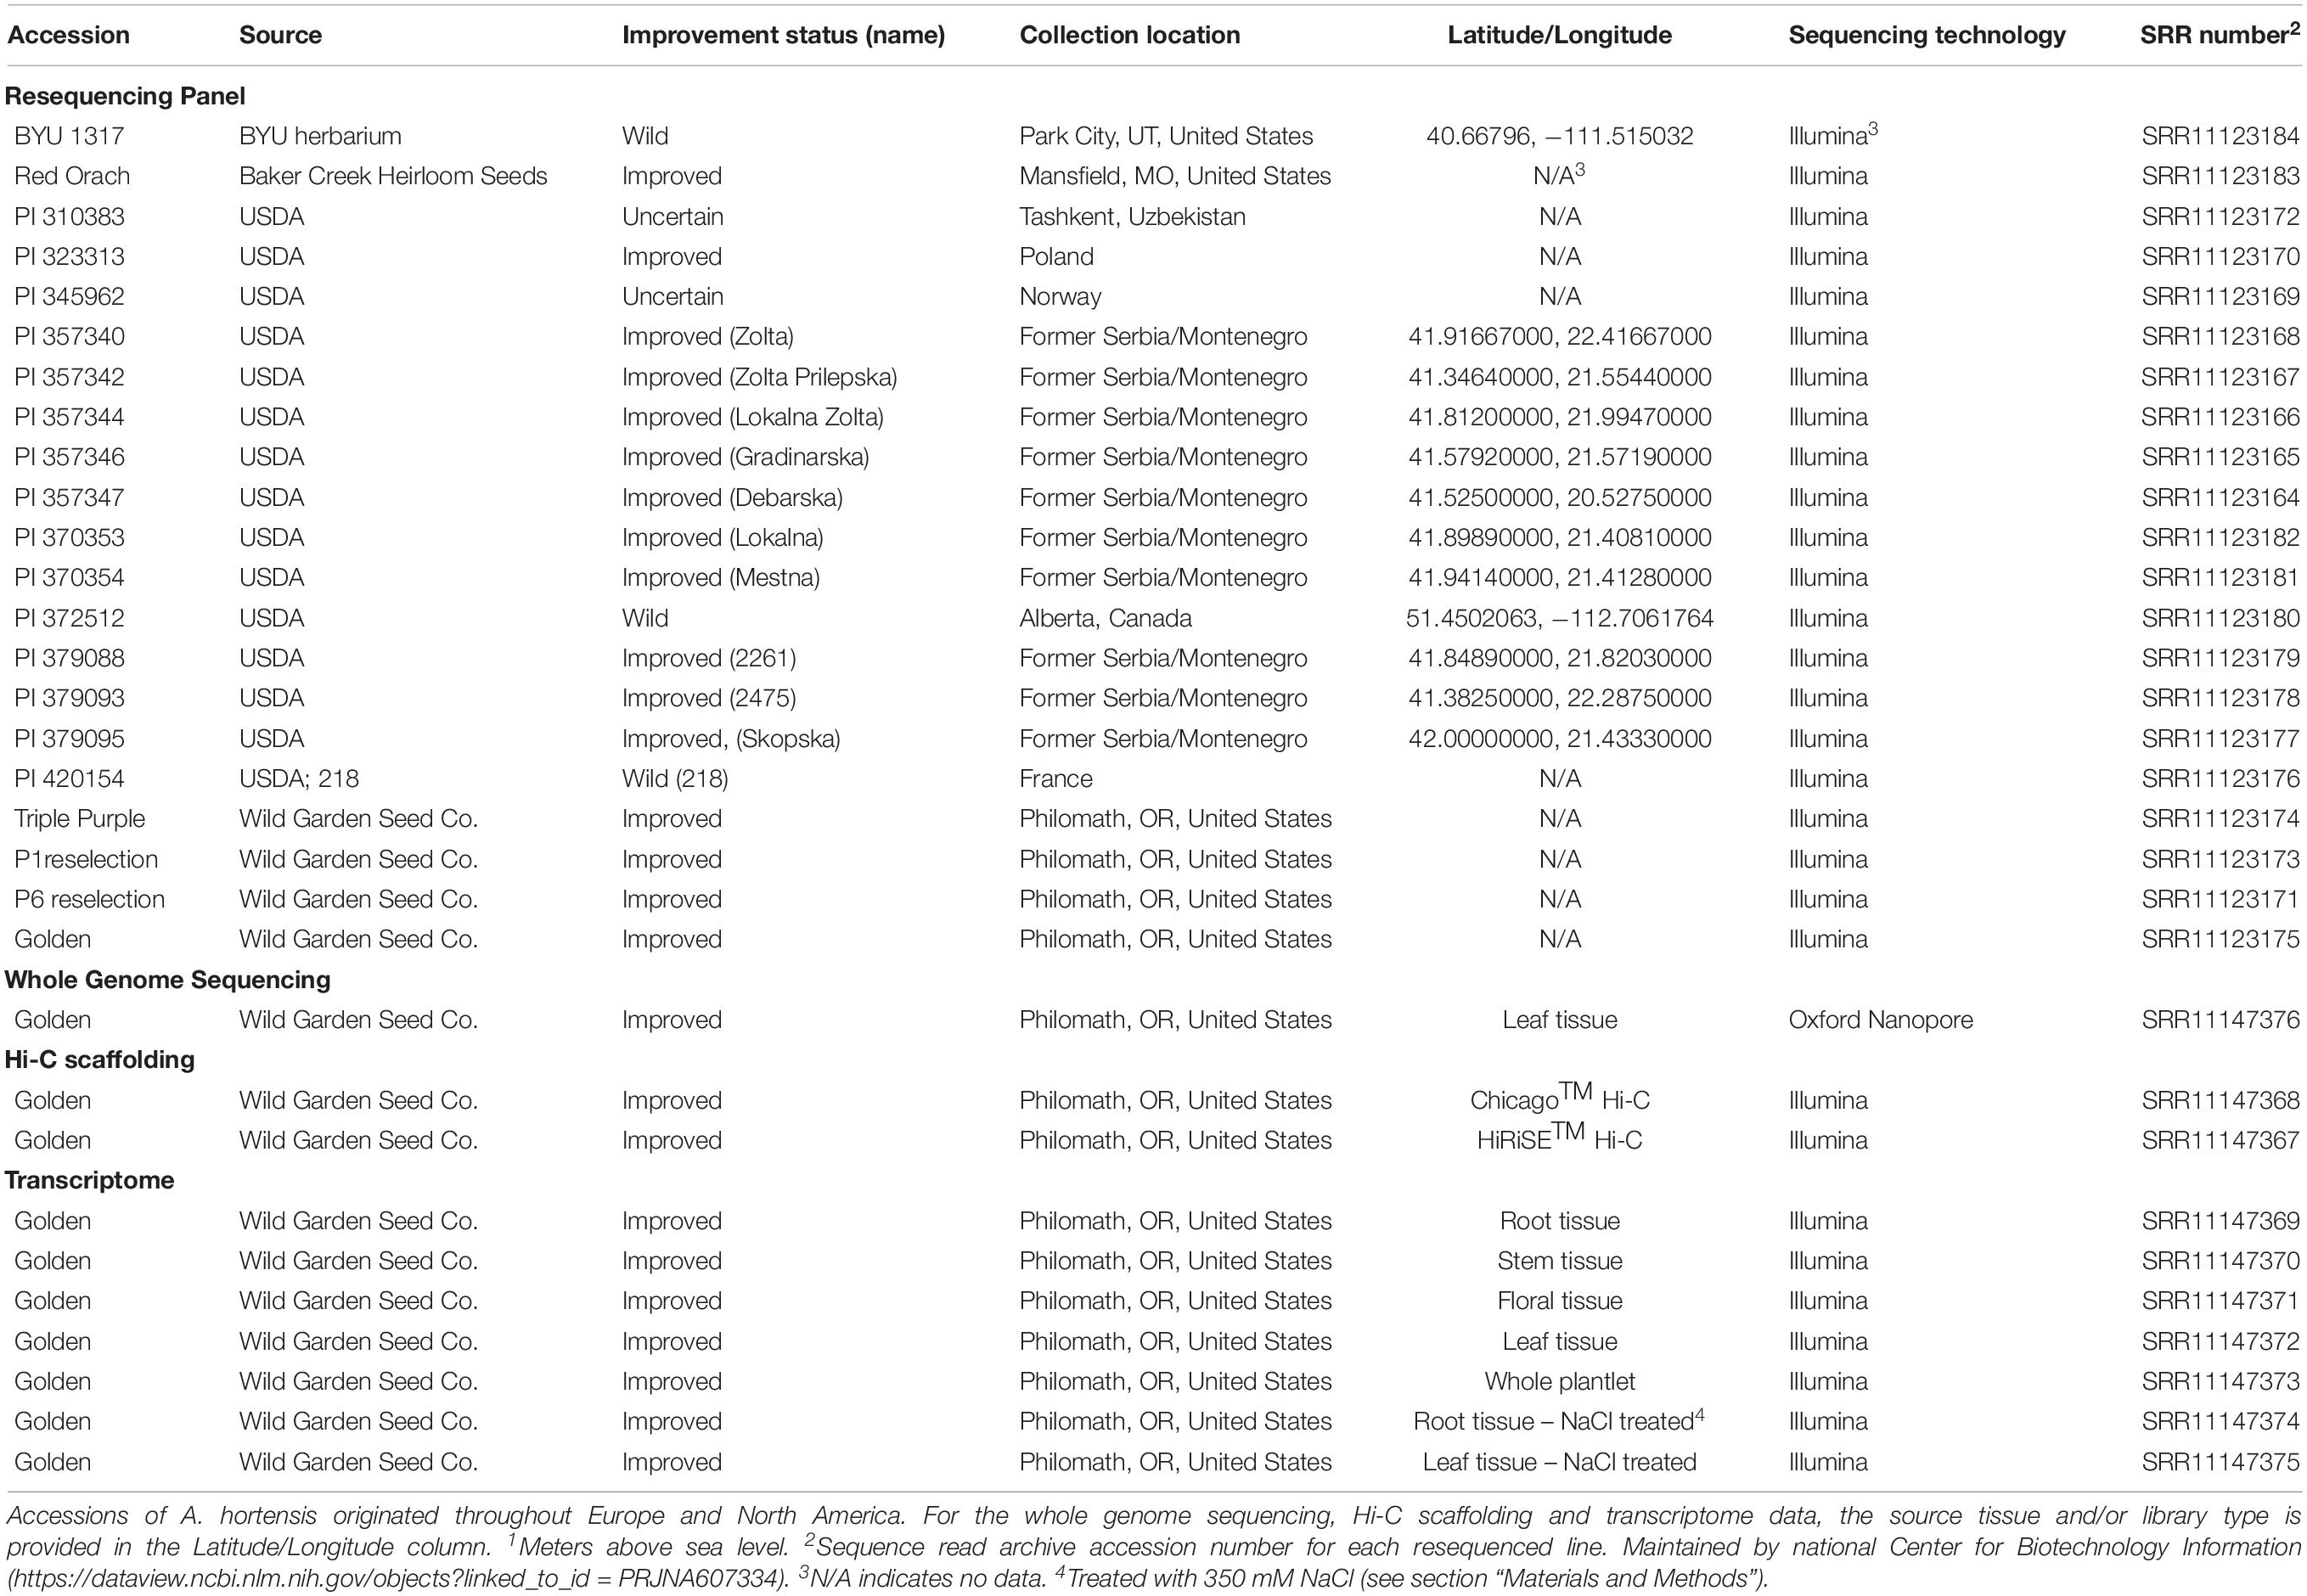
Table 1. Identification and passport information for plant materials used for the genome sequencing and the resequencing panel.
DNA Extraction, Library Preparation, and Oxford Nanopore Sequencing
The Golden variety of A. hortensis was grown hydroponically in a growth chamber at BYU as previously described. Plants were dark-treated for 72 h at which point young leaf tissue was harvested and extracted for high molecular weight (HMW) genomic DNA using the Qiagen (Germantown, MD) Genomic-tip protocol. The DNA concentration was checked using the dsDNA High Sensitivity DNA Assay on the Qubit® 2.0 Fluorimeter (Invitrogen, Merelbeke, Belgium).
Samples for DNA sequencing were prepared with and without fragmentation using Covaris g-TUBEs (Woburn, MA) and the ZYMO DNA Clean & Concentrator-5 column (Irvine, CA, United States). Samples were fragmented using both the ZYMO DNA kit and Covaris g-TUBEs following manufacturer’s instructions. Samples prepared with the Covaris g-TUBEs were fragmented at several centrifugation speeds, including 3,800, 4,000, and 4,200 RPM. In total, nine libraries from the original DNA stock were prepared for sequencing using the 1D Genomic DNA by Ligation MinION library preparation kit. Libraries were sequenced on R9 flow cells on a MinION for 48 h using MinKNOW 2.0 software with the following settings: DNA, PCR-free, no multiplexing, SQK-LSK109 kit (Oxford Nanopore Technologies, Ltd., Oxford, United Kingdom). No alterations were made to voltage or time. Albacore v2.3.1, part of the MinKNOW package, was used for base calling.
Read Cleaning, Draft Genome Assembly, and Polishing
MinIONQC (Lanfear et al., 2019) was used with default settings to summarize sequence data. NanoFilt (De Coster et al., 2018) was then used to trim and filter reads using the following options: −q = 8, headcrop = 25, −l = 2000. Porechop v.0.2.3 (Wick et al., 2017) was used to trim adaptors from sequence data with the default options. Draft genomes were assembled using multiple assemblers, specifically Canu v.1.7.1 (Koren et al., 2017), MaSuRCA v.3.2.8 (Zimin et al., 2013), Flye v.2.3.6 (Kolmogorov et al., 2019) and wtdbg2 (Ruan and Li, 2020). Illumina reads were used to polish the Canu assembly using Nanopolish (Loman et al., 2015), and Pilon v.1.22 (Walker et al., 2014). The completeness of each of the draft genome assemblies was assessed using BUSCO v4 (Simão et al., 2015) using the flowering plant (embryophyte_odb10) orthologous gene data set. Specific commands and flags for each assembly program used are provided in Supplementary File 1.
Hi-C Scaffolding
Atriplex hortensis plants (cv. Golden) were dark-treated for 72 h prior to flash-freezing young leaf tissue in liquid nitrogen. Tissue samples were then shipped to Dovetail Genomics (Scotts Valley, CA, United States) for Chicago® and Hi-C proximity ligation sequencing. Dovetail Chicago® libraries are similar to Hi-C libraries but differ in that they rely on library preparation from in vitro rather than in vivo reconstituted chromatin that has been cross-linked and subsequently sheared (Moll et al., 2017). Chromosome-scale scaffolds were generated using Dovetail Genomics’ HiRiSETM assembler.
Illumina Sequencing and Transcriptome Assembly
The “Golden” variety of A. hortensis was grown hydroponically as previously described. Plants were either grown in a control hydroponic solution or in hydroponic solution supplemented with NaCl. For the salt treatment, NaCl was added daily at 50 mM increments to the hydroponic solution of 21-day old plants until a concentration of 350 mM NaCl was reached (7 days). Tissue for RNA extraction was harvested 24 h after 350 mM NaCl concentration was reached. Root, stem and leaf tissue was harvested from both control and treated plants. One-week old whole plantlet and inflorescence (tissue and immature seed) tissues from untreated plants were also collected.
In total, seven libraries were prepared with 180-bp inserts. Sequencing was conducted using the Illumina HiSeq platform at the Beijing Genomics Institute (Shenzhen, China). Reads were trimmed and quality controlled using the program Trimmomatic-0.35 (Bolger et al., 2014). RNA-seq data were aligned to the Hi-C assembly using HiSat v2.2.1 with the max intron length set to 50,000 bp (Kim et al., 2015). Data was then assembled into potential transcripts using StringTie (Pertea et al., 2015) with default parameters.
Repeat Analysis and Annotation
Atriplex hortensis-specific repeats were identified using RepeatModeler v.1.0.11 (Smit and Hubley, 2008–2015). RepeatMasker v.4.0.7 (Smit et al., 2013–2015) was used to classify A. hortensis-specific repeats using the RepBase database version 20160829. The MAKER2 v2.31.10 pipeline (Holt and Yandell, 2011) was used to annotate the A. hortensis genome with ab initio gene predictions using AUGUSTUS (Stanke et al., 2004) species-specific gene models for A. hortensis. Additional evidence sources for the annotations included expressed sequence tags (EST) and protein homology from the transcriptomes of C. quinoa (Jarvis et al., 2017) and C. pallidicaule Aellen (Mangelson et al., 2019) as well as the A. hortensis transcriptome produced from the RNA-seq data previously described. The uniprot_sprot database (downloaded 11/13/2018) was used for Basic Local Alignment Search Tool (BLASTp)-based annotation of the gene models.
Resequencing
Genomic DNA from each of the 21 A. hortensis accessions was extracted using the mini-salts protocol reported by Todd and Vodkin (1996). The DNA concentrations and quality were checked using the dsDNA BR Assay from Qubit® 2.0 Fluorimeter. Libraries were sent to Novogene (San Diego, CA, United States) for whole-genome Illumina HiSeq X Ten sequencing (2 × 150-bp paired-end). Reads were trimmed with Trimmomatic using default parameters (Bolger et al., 2014). Reads from each accession were then aligned to the final A. hortensis reference genome using Bowtie2 using the very-sensitive-local flag (Langmead and Salzberg, 2012) to produce BAM files that were further marked for PCR duplicates using the MarkDuplicates subroutine in the Picard package.2 Single nucleotide polymorphism (SNP) genotype likelihoods and covariances were then determined from the 21 accessions using ANGSD using a p-value of 10E-06 for a site being variable (Korneliussen et al., 2014) to produce a genotype likelihood (beagle) file. Multivariate analysis of the covariance data was accomplished using PAST4 (Hammer et al., 2001), while population structure and admixture were then inferred using PCAngsd (Meisner and Albrechtsen, 2018) at K = 3 based on the DeltaK method described by Evanno et al. (2005). Bootstrapped (n = 1000) UPGMA phylogenies based on Euclidean similarity indices were produced using PAST4 (Hammer et al., 2001).
Cytogenetics and Genome Size Estimation
Atriplex hortensis cv. Golden seeds were germinated on petri dishes for 36 h. Root meristems were collected and immersed in ice water for 24 h. Root meristems were then treated for another 24 h in a 3:1 mixture of ethanol (95%) – glacial acetic acid. Root tips were prepared under a dissecting microscope where they were placed on slides, treated with iron-acetocarmine, warmed on an alcohol burner, and squashed. Chromosomes were examined using a Zeiss Axioplan 2 phase-contrast microscope and images were captured on an Axiocam (Carl Zeiss, Jena, Germany) CCD camera. Fluorescent in situ hybridization (FISH) rDNA images of mitotic chromosome preparations of A. hortensis cv. “Triple Purple” were taken using yellow-green fluorescing digoxygenin to highlight the NOR-35S region and red fluorescing rhodamine to highlight the 5S region using the protocol described by Maughan et al. (2006). Chromosome spreads and DNA probes for FISH were prepared using the protocol described in Kolano et al. (2012).
Genome-size estimation was conducted using a Beckman Coulter (Miami, FL, United States) Gallios flow cytometer by Agriculture and Agri-Food Canada (AAFC) as described by Yan et al. (2016). Samples were analyzed in triplicate (technical replicates) conducted over three different days. Characteristics of the florescence peaks including mean, nuclei numbers, and coefficients of variation were determined using the R package flowPloidy (Smith et al., 2018). The 2C DNA value of each sample was calculated as: (mean of sample G1peak/mean of standard G1 peak) × 2C DNA content (pg) of the radish (Raphanus raphanistrum subsp. sativus, estimated 515 Mb) standard.
Results
Library Fragmentation
Since Oxford Nanopore Technologies (ONT) sequencing is still relatively new, we tested the relationship between fragmentation strategies, read length and total sequence output to discover the optimal sample preparation method. To achieve sufficient coverage, we developed nine different libraries that were each sequenced independently on different flow cells. In total, the nine libraries yielded 65.4 Gb of data from 5,525,447 reads with a read length N50 of 22,087 bp, a mean read length of 13,487 bp and a mean quality score of nine (Table 2). Individual DNA libraries prepared with fragmentation (Covaris g-TUBEs and ZYMO DNA concentrator-5 column kit) or without fragmentation produced dramatically varied results in terms of read lengths and total sequence yield. Not unexpectedly, the library prepared without fragmentation produced the longest read lengths (N50 = 40,434 bp) but also exhibited the lowest overall sequence yield (1.26 Gb). Fragmentation using the Covaris g-TUBEs at different centrifugation speeds (3,800, 4,000, and 4,200 RPM) produced variable results, but with general trends, specifically: (1) Covaris g-TUBE fragmented libraries always outproduced the non-fragmented library (average yield = 8.67 Gb), but the N50 of the read lengths of these libraries was always smaller (average N50 = 17,166 bp), and (2) lower centrifugation speeds produced longer read lengths (3,800 RPM = 17,979 bp vs 4,200 RPM = 15,939 bp), but with lower yield (3,800 RPM = 8.5 Gb vs 4,200 RPM = 10.9 Gb; Table 2). The two fragmentation libraries produced using the ZYMO DNA kit yielded intermediately to the non-fragmented libraries and the Covaris fragmented libraries, with an average of 3.93 Gb of sequence with a read length N50 of 28,495 bp, suggesting that the ZYMO DNA kit only minimally fragmented the DNA.
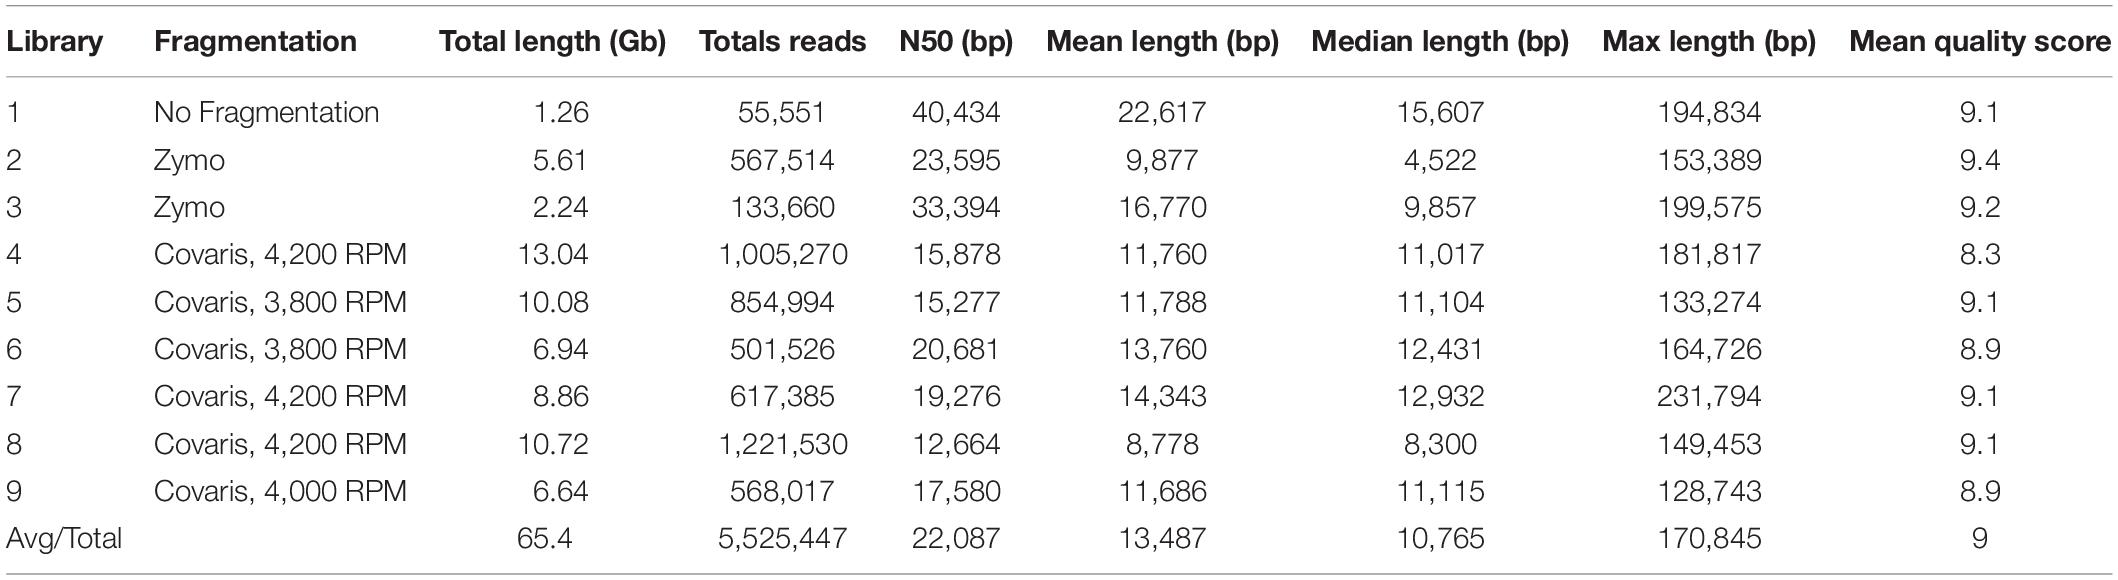
Table 2. Oxford Nanopore library preparation and sequencing statistics. Non-fragmentation and fragmentation techniques were used in sample preparation.
Genome Assembly
Flow cytometry indicated that the A. hortensis genome is approximately 1.172 Gb (Table 3), while karyotyping of cell nuclei showed that A. hortensis carries nine pairs of chromosomes (2n = 2x = 18). In the A. hortensis karyotype, chromosomes were metacentric to slightly submetacentric (Figure 1), and similar in length.
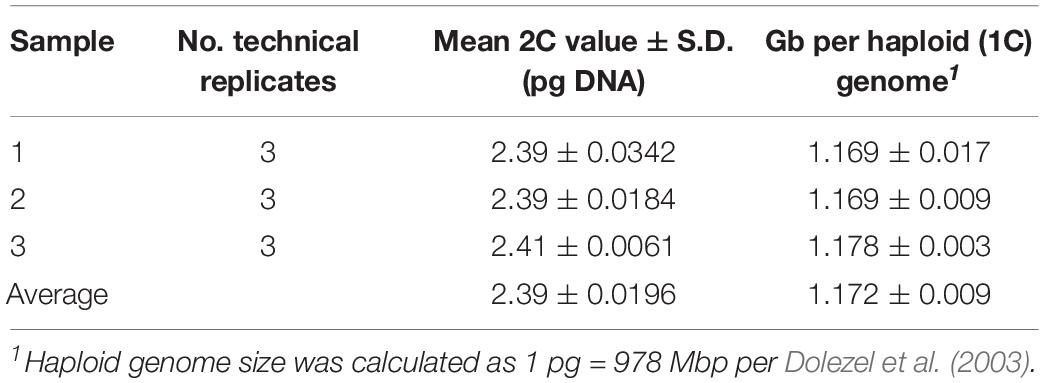
Table 3. Flow cytometry results of A. hortensis (cv. “Golden”) leaf tissue. A C-value of 2.4 picograms yielded a genome size estimate of 1.17 Gb.
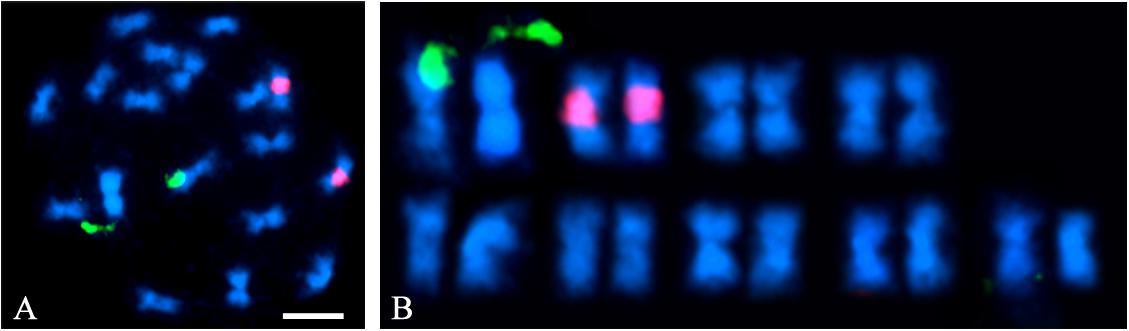
Figure 1. A. hortensis chromosome pairs. Nine metacentric chromosome pairs are visible. (A) Fluorescent in situ hybridization (FISH) using NOR-35S (green) and 5S (red) labeled rDNA probes on mitotic chromosome preparations of A. hortensis cv. “Triple Purple.” (B) Chromosomes from panel (A) arranged as a karyotype. Note the metacentric to submetacentric centromere positions on all nine chromosome pairs.
Multiple assemblers were tested to determine which would most optimally assemble the A. hortensis genome. These assemblers included Canu (Koren et al.), MaSuRCA (Zimin et al., 2013), Flye (Kolmogorov et al., 2019) and wtdbg2 (Ruan and Li, 2020). All assemblers were run with default parameters. The wtdbg2 assembler produced the largest number of contigs and the Flye assembler produced the smallest N50 (Table 4). Both the wtdbg2 and the Flye assemblers produced smaller (total genome size) assemblies relative to the MaSuRCA and Canu assemblers. Both the MaSuRCA and Canu assemblers produced >1 Mb contig N50s, with the Canu assembler producing the least collapsed assembly (relative to the predicted genome size of 1.2 Gb).
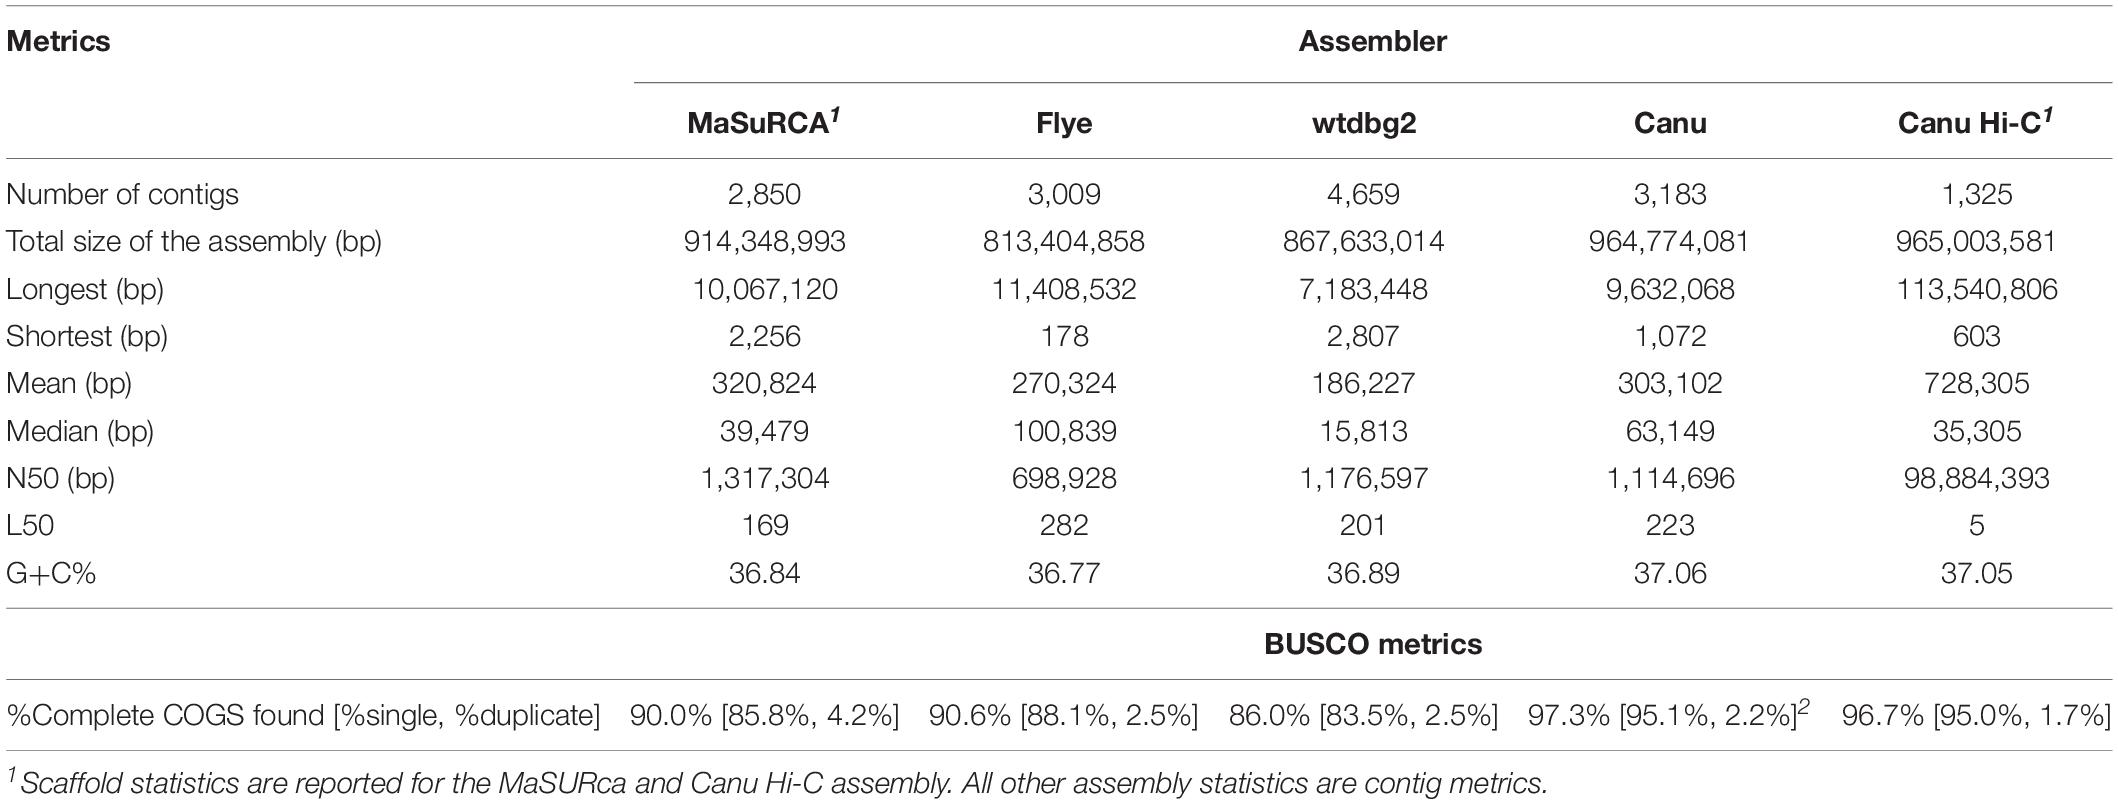
Table 4. Assembly and Benchmarking Universal Single Copy Orthologs (BUSCO) statistics for the MaSuRCA, Flye, wtdbg2, Canu and Hi-C scaffolded Canu assemblies.
The MaSuRCA assembler uses a hybrid approach for assembly that initially utilizes high-quality short-reads to produce super-reads that are then scaffolded and gap-filled with the long reads to produce high-quality scaffolds that do not require error correction (Zimin et al., 2013). The Flye, Canu and wtdbg2 assemblers are based solely on the error-prone long reads and are thus considered unpolished assemblies and require polishing to correct the inherently high sequencing error rate associated with the ONT technology. We polished the Flye, Canu and wtdbg2 draft assemblies with Nanopolish, which uses the original ONT reads for consensus correction along with two rounds of Pilon, which in turn uses the high-quality Illumina short reads for correction to produce a high-quality, polished set of draft assemblies for comparison (Table 4). We evaluated the final assemblies using Benchmarking Universal Single Copy Orthologs (BUSCO) (Simão et al., 2015) which quantifies gene content completeness based on a large core set of highly conserved orthologous genes (COGs). After polishing, BUSCO was used to identify complete COGs within the various assemblies, which ranged from a low of 86.0% in the Flye assembly, to a high of 97.3% in the Canu assembly. The necessity of the polishing steps was reflected in the increasing BUSCO scores after successive rounds of polishing. For example, the BUSCO scores for complete COGs identified for the original, Nanopolished, Nanopolished+Pilon and Nanopolished+Pilon+Pilon Canu assemblies were 50.5, 73.8, 90.1, and 97.3%, respectively.
Both the MaSuRCA and Canu assemblers produced superior assemblies based on the total size of the contigs, contig N50, and BUSCO scores; however, the polished Canu assembly was ultimately chosen as the draft genome for Hi-C scaffolding due to concerns of repeat collapse within the MaSuRCA assembly as reflected in the smaller total size of the contigs. The polished Canu assembly resulted in 3,183 contigs, spanning 965 Mb, a contig N50 of 1.114 Mb, an L50 of 223, and a BUSCO score of 97.3% (Table 4).
Chromosome-Scale Scaffolding
To further improve the Canu assembly, contigs were scaffolded using chromatin-contact maps using Dovetail Chicago® and Hi-C libraries. Chicago® library contact maps are based on in vitro reconstituted DNA and are ideal for detecting and correcting miss-joins in de novo assemblies as well as short-range scaffolding (Putnam et al., 2016). A total of 163 million read pairs (70X coverage) were generated from the Chicago® library and were used to detect misalignments and scaffold the Canu assembly using the HiRiSETM scaffolder. In total, 429 breaks and 1,421 joins were made, resulting in a net decrease in the total number of scaffolds to 2,191 and a slight decrease in N50 (817 kb) for the assembly. Whenever a join was made between contigs, an “N” gap, consisting of 100 Ns, was created. The total percent of the genome in gaps was less than 0.1%.
The Chicago® -based assembly was then further scaffolded using an in vivo Hi-C library created from native chromatin to produce ultra-long-range (10–10,000 kb) mate-pairs. A total of 200 million mate-pair reads, representing a physical coverage of 62×, were generated and scaffolded using the HiRiSETM scaffolder. In total, 868 joins and no breaks were made, producing a final assembly containing 1,325 scaffolds, spanning a total sequence length of 965 Mb with an N50 and L50 of 98.9 Mb and 5 scaffolds, respectively. Nine chromosome-scale scaffolds were assembled containing 94.7% of the total sequence length. The chromosome-scale scaffolds ranged in size from 93.6 to 113.5 Mb and were numbered sequentially based on scaffold length (e.g., Ah1–Ah9). Scaffold joins produced by the Hi-C mate-pairs introduced new “N” gaps in the assembly, thereby increasing the number of gaps in the assembly to 2,295. The final number of “N” nucleotides in the final Hi-C assembly was 229,050 (<0.1%; Table 2).
A BUSCO analysis of the final Hi-C assembly identified 1,331 (96.8%) complete COGs from the Embryophyta database (n = 1375), of which only 1.7% (23) were duplicated – reflecting the diploid nature of the Atriplex genome and suggesting that only minor paralogous duplications have occurred. Another nine (0.7%) fragmented COGs were identified. Only 35 COGs were missing, which is indicative of a highly complete assembly.
Repeat Features
The RepeatModeler and RepeatMasker pipelines were used to annotate and mask the repeat fraction of the Hi-C assembly. Approximately 66% (639.6 Mb) of the genome was annotated as repetitive, which is slightly higher than the repetitive fraction classified for other members of the Amaranthaceae/Chenopodiaceae alliance with reference genomes [48% in Amaranthus hypochondriacus L. (Lightfoot et al., 2017), 64% in Spinacia oleracea (Li et al., 2019), 63% in Beta vulgaris L. (Flavell et al., 1974), 64.5% in C. quinoa (Jarvis et al., 2017)]. The most common repeat elements identified were long-terminal repeat retrotransposons (LTR-RT). The LTR-RTs are the most abundant genomic component in flowering plants (Du et al., 2010; Galindo-Gonzalez et al., 2017) and their frequency is strongly correlated with increased genome size (Michael, 2014). Of the various LTR-RTs present in the A. hortensis genome, Gypsy-like (31.90%) and Copia-like (11.13%) elements represent greater than 40% of the genome and are in a 3:1 (Gypsy:copia) ratio, similar to the 2.9:1 ratio reported for 50 sequenced plant genomes (Ou and Jiang, 2018). An additional 5.14% (49.5 Mb) of the genome was classified as low-complexity (satellites, simple repeats, and rRNAs), while 14.86% (143 Mb) of the genome was characterized as unclassified repetitive elements (Table 5) – presumably representing Atriplex-specific repeat elements that will undoubtedly be important for understanding the evolution of the A. hortensis genome.
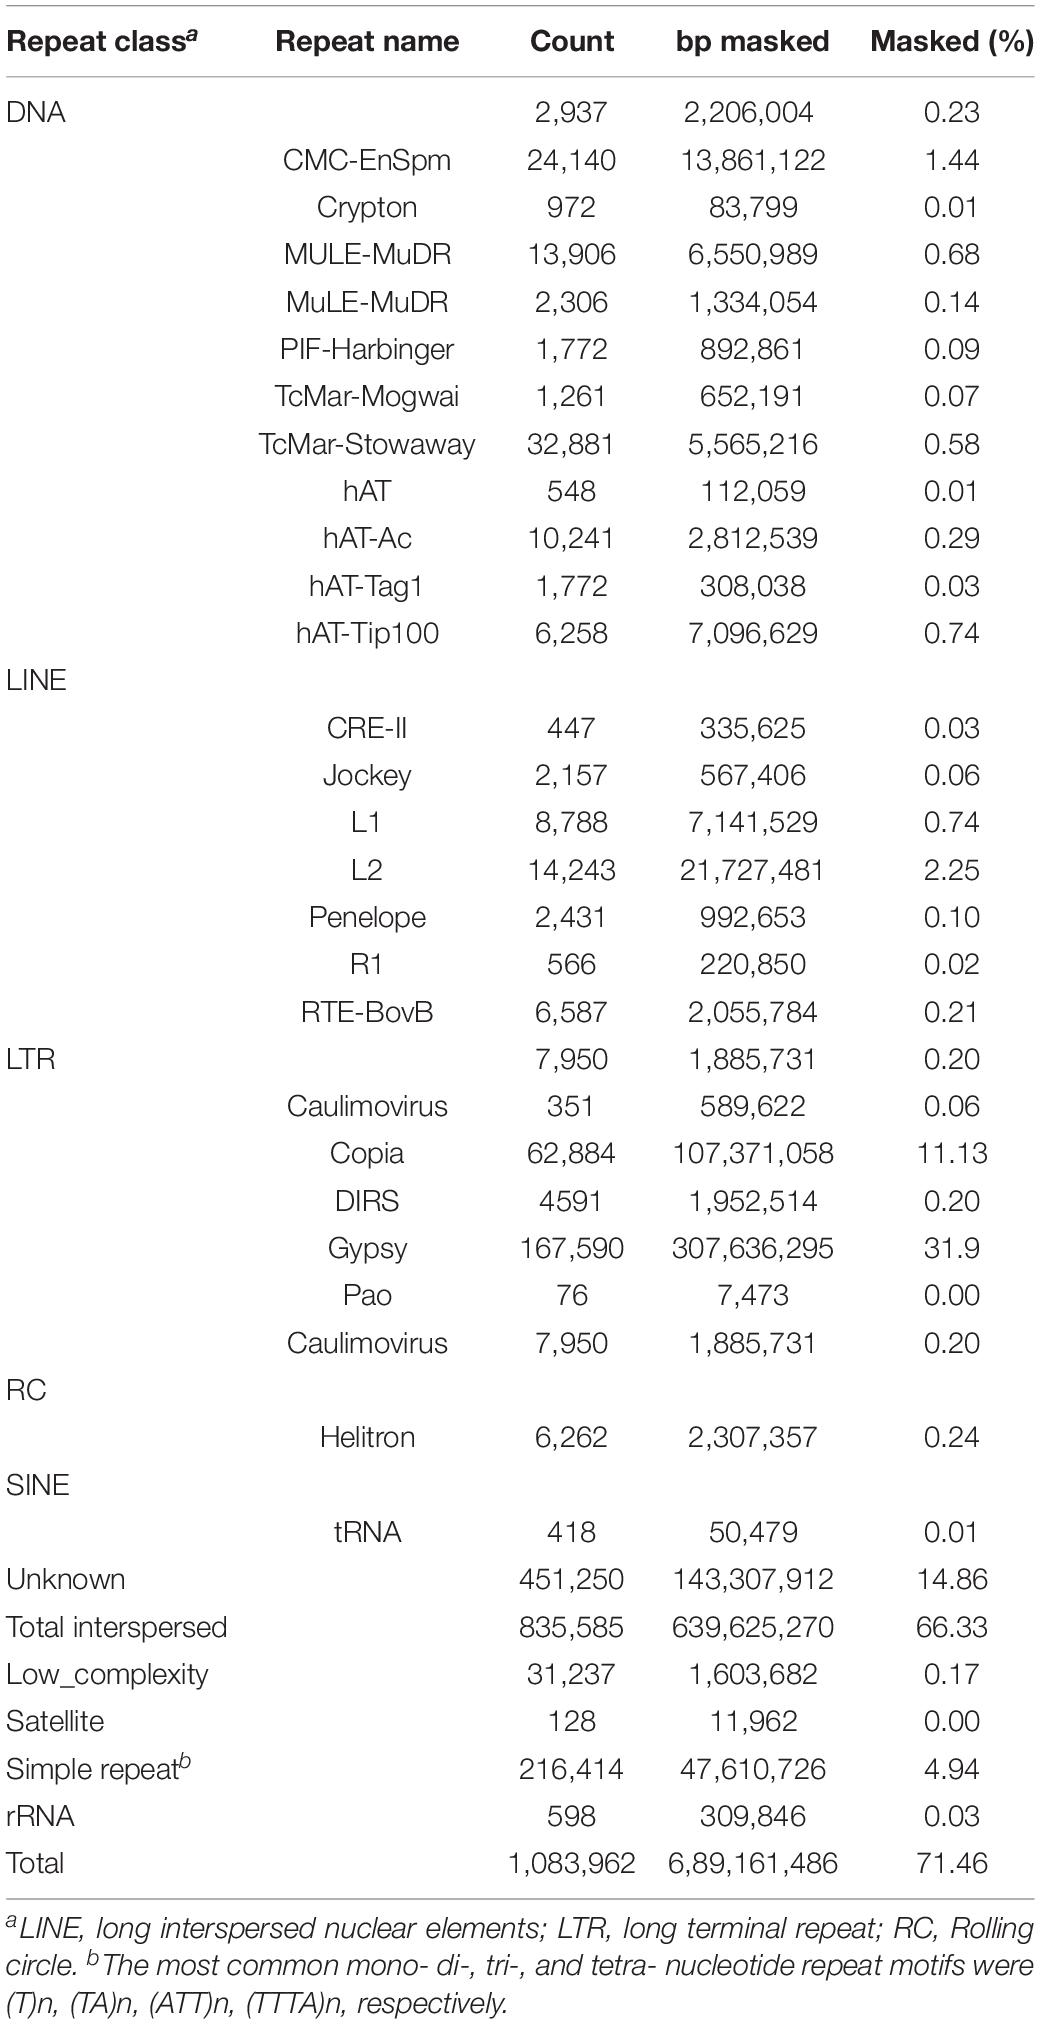
Table 5. Repetitive element classification for final assembly (Canu Hi-C) as reported by RepeatMasker.
A BLAST search (Altschul et al., 1990) of the complete rRNA gene sequence found in C. quinoa (DQ187960.1) was conducted to identify the 35S rRNA gene (NOR) location in the A. hortensis genome using the C. quinoa sequence as query. The 35S rRNA locus was located on chromosome Ah6. Another BLAST search was conducted to identify matches for the 5S rRNA gene locus in A. hortensis, again using the homologous 5S rDNA repeat sequence in C. quinoa (DQ187967.1) as the query. The 5S rDNA sequences mapped primarily to chromosome Ah4 and to several other smaller unscaffolded contigs that did not assemble into specific chromosomes. The appearance of these smaller scaffolds in the BLAST search results was not surprising as 5S rDNA repeats are highly repetitive and of low-complexity, and thus extremely difficult to assemble and scaffold accurately. A FISH analysis of mitotic chromosome preparations for A. hortensis cv. Triple Purple revealed a physical location of a single NOR-35S (green) locus and of a single 5S (red) rRNA gene tandem repeat-array locus (Figure 1). The identification of the cytological and genomic position of the 5S rRNA and 35S rRNA gene loci gives unique identities to two of the nine chromosome pairs in the A. hortensis kayotype (specifically Ah4 and Ah6).
The sequence for telomeric repeats in plants is highly conserved and has been identified as TTTAGGG (Richards and Ausubel, 1988). A BLAST search of this sequence motif against the nine A. hortensis chromosomes identified tandemly repeated telomeric sequences on at least one end of each of the nine chromosome assemblies with a total of 13 telomere-like repetitive regions identified (Figure 2). Four of the nine chromosomes had telomere-to-telomere assemblies (telomeres identified on both ends of the chromosome assembly).
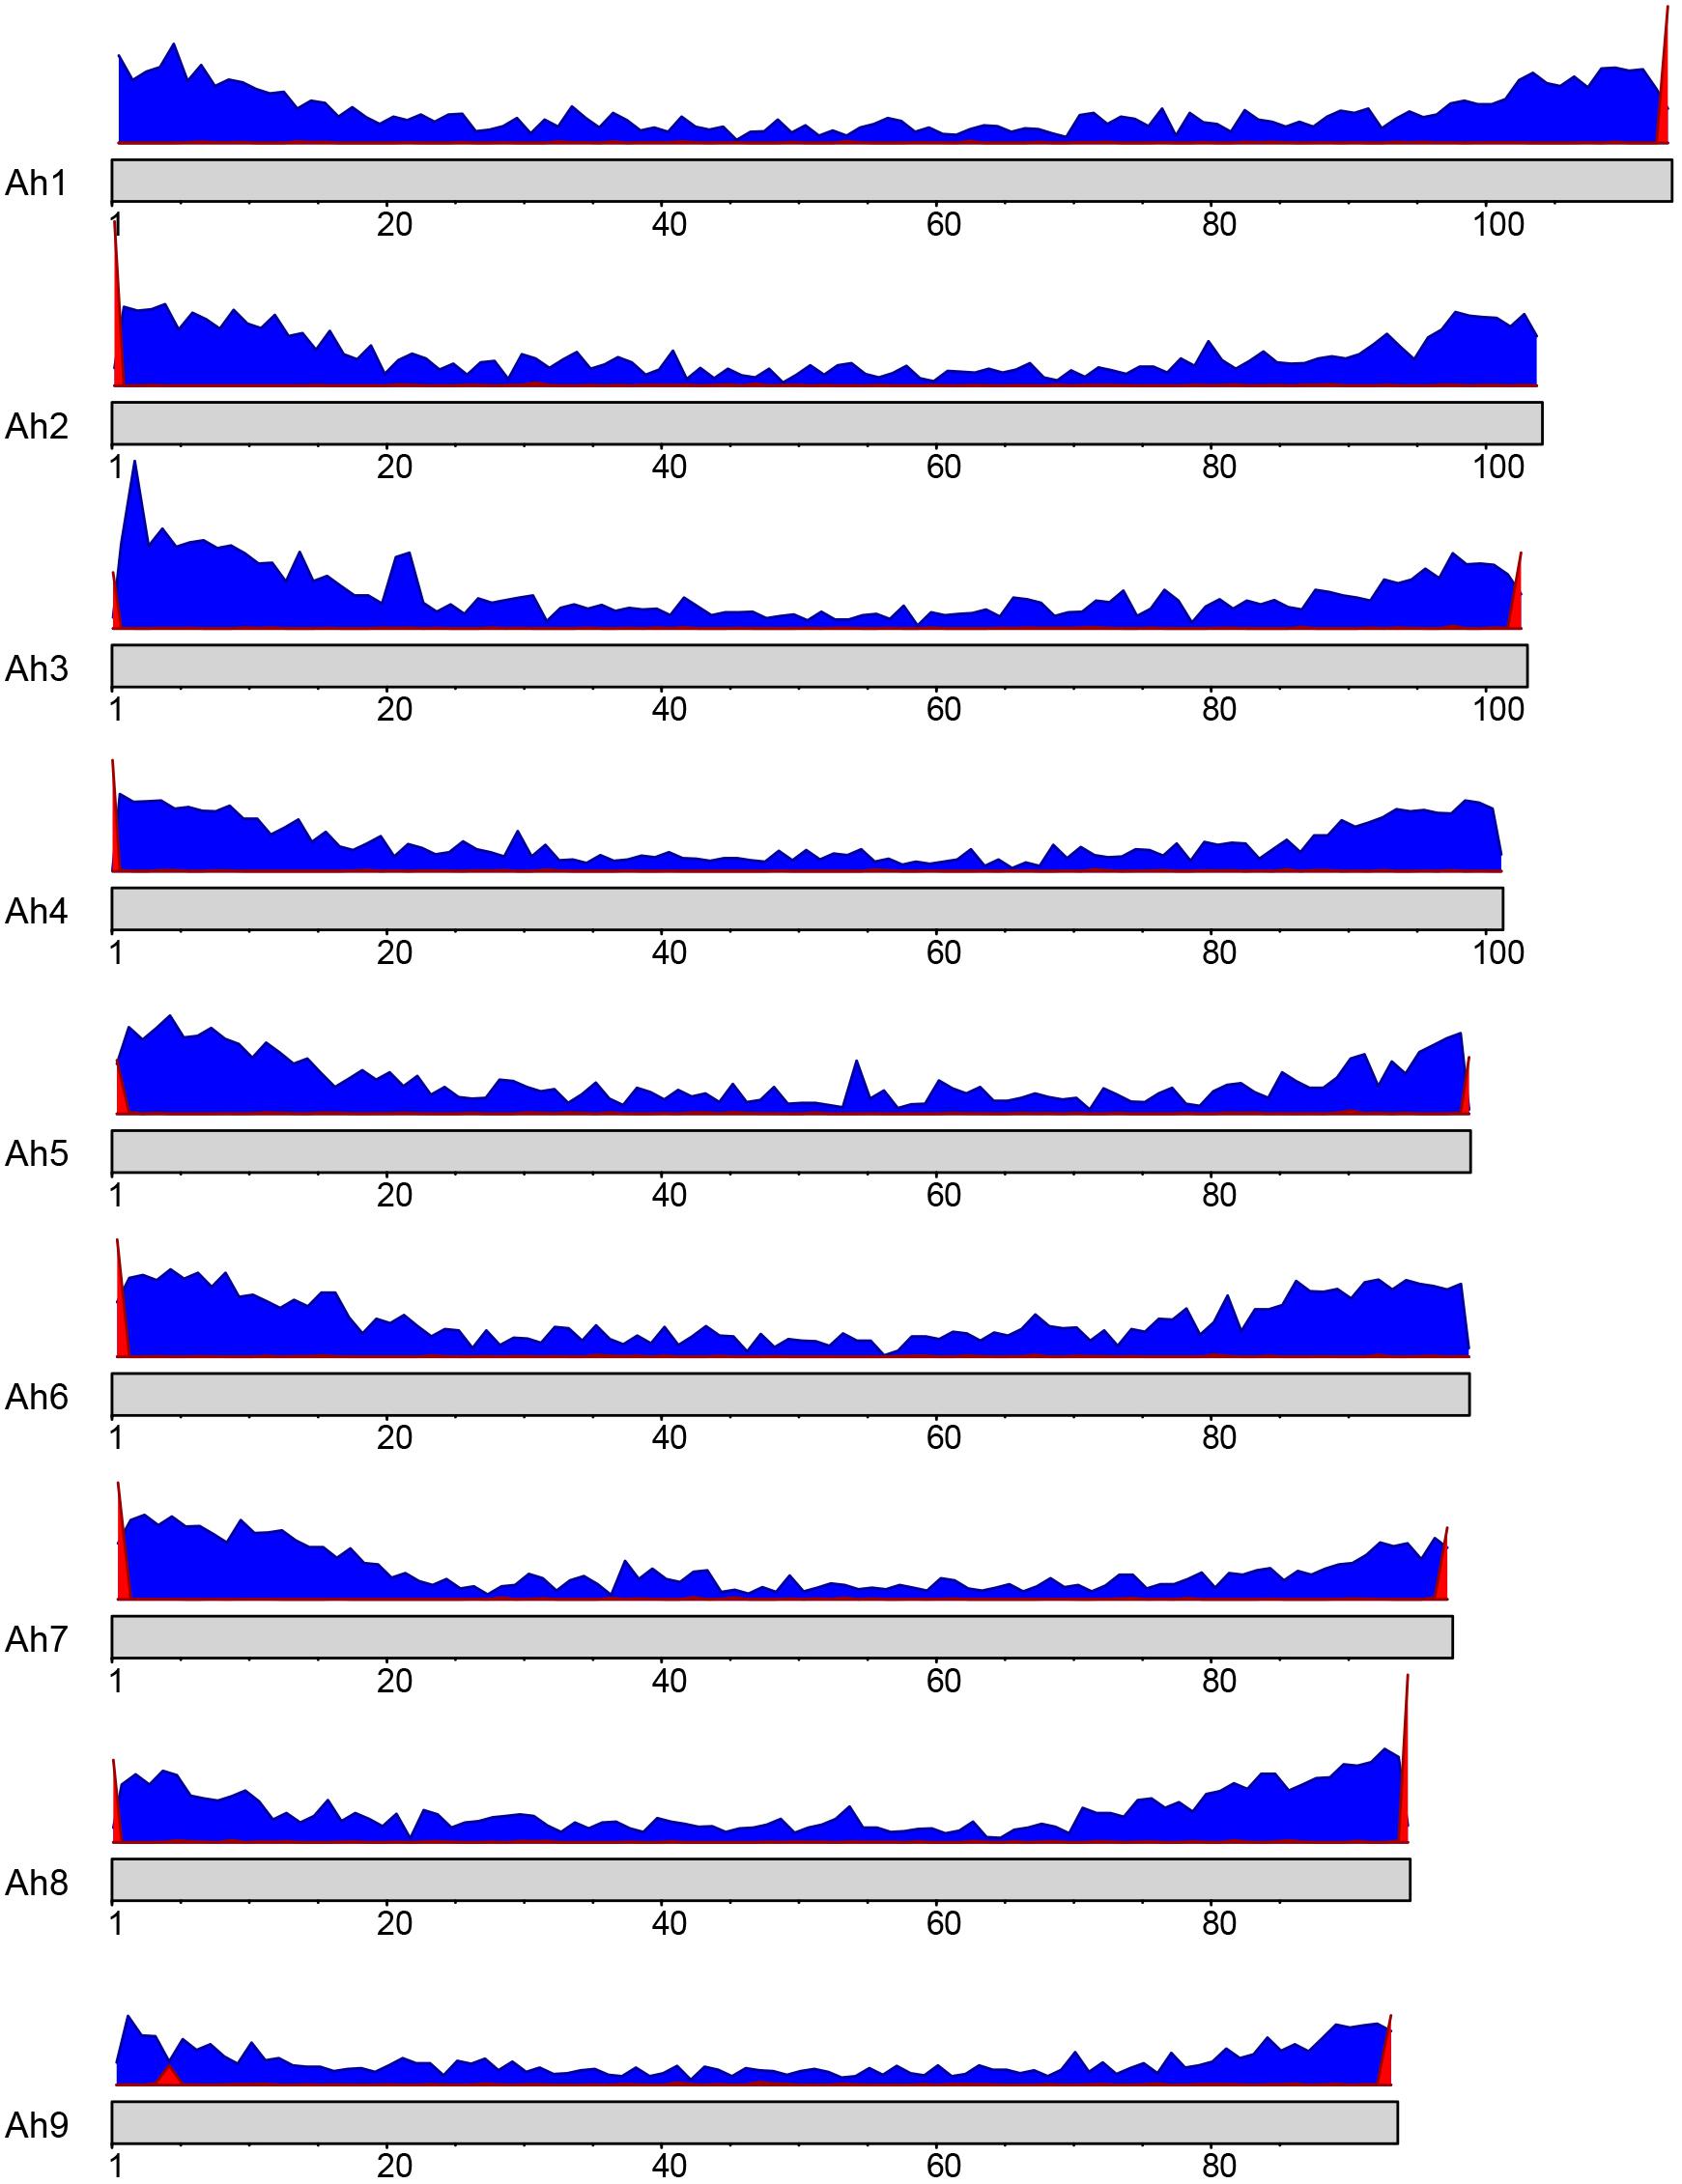
Figure 2. Gene density (blue) and telomere positioning (red) on the A. hortensis chromosomes. A conserved telomere repeat sequence in plants (TTTAGGG; Richards and Ausubel, 1988) was used to locate telomere positions using BLAST searches. The x-axis represents the position on the chromosome, while the y-axis represents the frequency of genes or telomeric repeats in each bin.
Genome Annotations
A de novo A. hortensis transcriptome, derived from 30–40 million RNA-seq reads each from stem, leaf, floral and whole plantlet tissues, consisted of 272,255 isoforms with an N50 of 3,325 bp and a mean length of 1,956 bp. The A. hortensis transcriptome, along with the EST and peptide models from C. quinoa and C. pallidicuale and the uniprot-sprot database, were provided as primary evidence for annotation in the MAKER pipeline. The RNA-seq data mapped with high efficiency to the final genome assembly, with an overall alignment rate of 92% and with 81.5% of the pair reads aligning concordantly exactly one time, with only 4.26% aligning more than once concordantly – suggestive of a high-quality genome assembly and reflective of the diploid nature of the A. hortensis genome. The MAKER pipeline identified a total of 39,540 gene models and 2,555 tRNA genes. The average length of genes identified by MAKER was 1,750 bp. The completeness of the annotation was assessed by BUSCO which identified 1,278 (92.9%) complete COGs from the transcript annotation (Complete: 92.9% [Single Copy: 90.4%, Duplicated: 2.5%], Fragmented: 4.7%, Missing: 2.4%). To assess the quality of the annotations, we used the mean Annotation Edit Distance (AED) which is calculated by combining annotation values corresponding to specificity and sensitivity. AED values of 0.5 and below are considered good annotations, and values of 0.30 and below are considered high quality annotations (Holt and Yandell, 2011). Over 90% of the genome models have an AED value <0.5, with the majority (51.7%) of the models having AED values below 0.325 (Figure 3). An analysis of the completeness of the gene models was further assessed by comparing the matched length of the transcripts with orthologous C. quinoa transcripts. Orthologs were determined using BLAST analysis (e-value < 1e-20) with the max target set to 1. Of the 18,657 orthologs identified with C. quinoa, ∼80% (14,764) covered at least 70% of the C. quinoa orthologs. The AED score coupled with the BUSCO assessment and ortholog analysis are suggestive of a high-quality genome assembly and annotation. In addition, the observed chromosomal distribution of the annotated genes, with higher gene density near the ends of chromosomes and lower gene density in the centromeric regions (Figure 2), is suggestive of a high-quality genome assembly and annotation. An examination of the self-synteny map (not shown but accessible via CoGe) revealed no obvious blocks of paralogous genes.
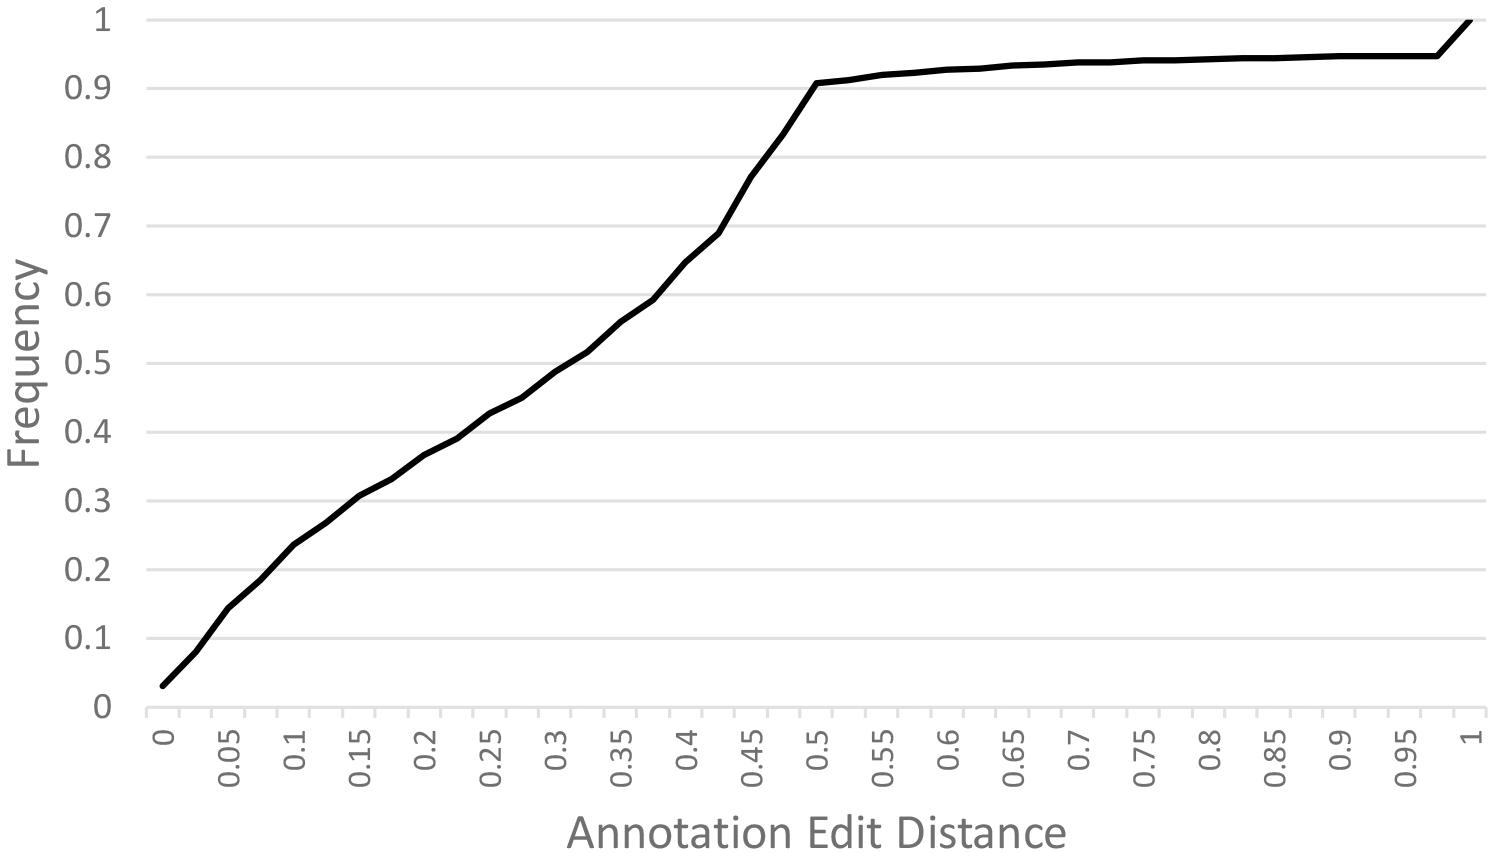
Figure 3. Annotation Edit Distance (AED) calculated for MAKER predicted gene models. Annotation Edit Distance (AED) is used to measure the quality of a genome annotation. This is calculated by combining annotation values corresponding to specificity and sensitivity. AED values of 0.50 and below are good annotations and values of 0.30 and below are high-quality annotations (Holt and Yandell, 2011).
Genomic Comparison and Features
Several species within the Amaranthaceae/Chenopodiaceae alliance have chromosome-scale genome assemblies, including the ancient allotetraploids C. quinoa (Jarvis et al., 2017) (2n = 4x = 18) and Amaranthus hypochondriacus (Lightfoot et al., 2017) (2n = 4x = 16), and the diploid Beta vulgaris (Funk et al., 2018) (2n = 2x = 9). Previous phylogenic research using chloroplast DNA (rbcL gene, atpB-rbcL spacer) and nuclear rDNA internal transcribed spacer (ITS), clearly demonstrated that Atriplex is more closely related to Chenopodium and Beta, which are both found in the same family Chenopodiaceae s. str. but in different subfamilies, Chenopodioideae (Chenopodium and Atriplex) and Betoideae (Beta), while Amaranthus is more distantly related to these chenopods and is found within the family Amaranthaceae s. str., subfamily Amaranthoideae (Kadereit et al., 2003, 2010; Fuentes-Bazan et al., 2012; Morales-Briones et al., 2020). Syntenic relationships between A. hortensis and these other genomes were explored using DAGChainer (Haas et al., 2004), which identifies syntenic blocks of collinear homologous gene pairs between genomes.
A synteny analysis of A. hortensis and B. vulgaris identified 226 shared syntenic blocks between the genomes, with 11,697 colinear gene pairs (averaging 52 gene pairs/block) spanning 469 and 616 Mb of the B. vulgaris and A. hortensis genomes, respectively. Moreover, syntenic block sizes between the species were also correlated (R2 = 0.36), further reflecting a shared ancestry of two species. One-to-one orthologous relationships between A. hortensis and B. vulgaris chromosomes (Figure 4 and Table 6) were clearly ascertained for six of the nine A. hortensis chromosomes: Ah1 = Bv5 (100% shared syntenic block sequence), Ah2 = Bv4 (99%); Ah4 = Bv8 (100%); Ah5 = Bv3 (100%); Ah7 = Bv7 (100%); Ah8 = Bv2 (100%). The remaining three A. hortensis chromosomes shared substantial levels of synteny with multiple B. vulgaris chromosomes, suggestive of intergenomic rearrangements (i.e., reciprocal translocations), with Ah3 = Bv6 (51%), Bv9 (49%); Ah6 = Bv6 (52%), Bv1 (48%); and Ah9 = Bv9 (54%), Bv1 (44%). We note that we cannot exclude that these rearrangements are possible misassembles – although our Hi-C data strongly supports the current placements.
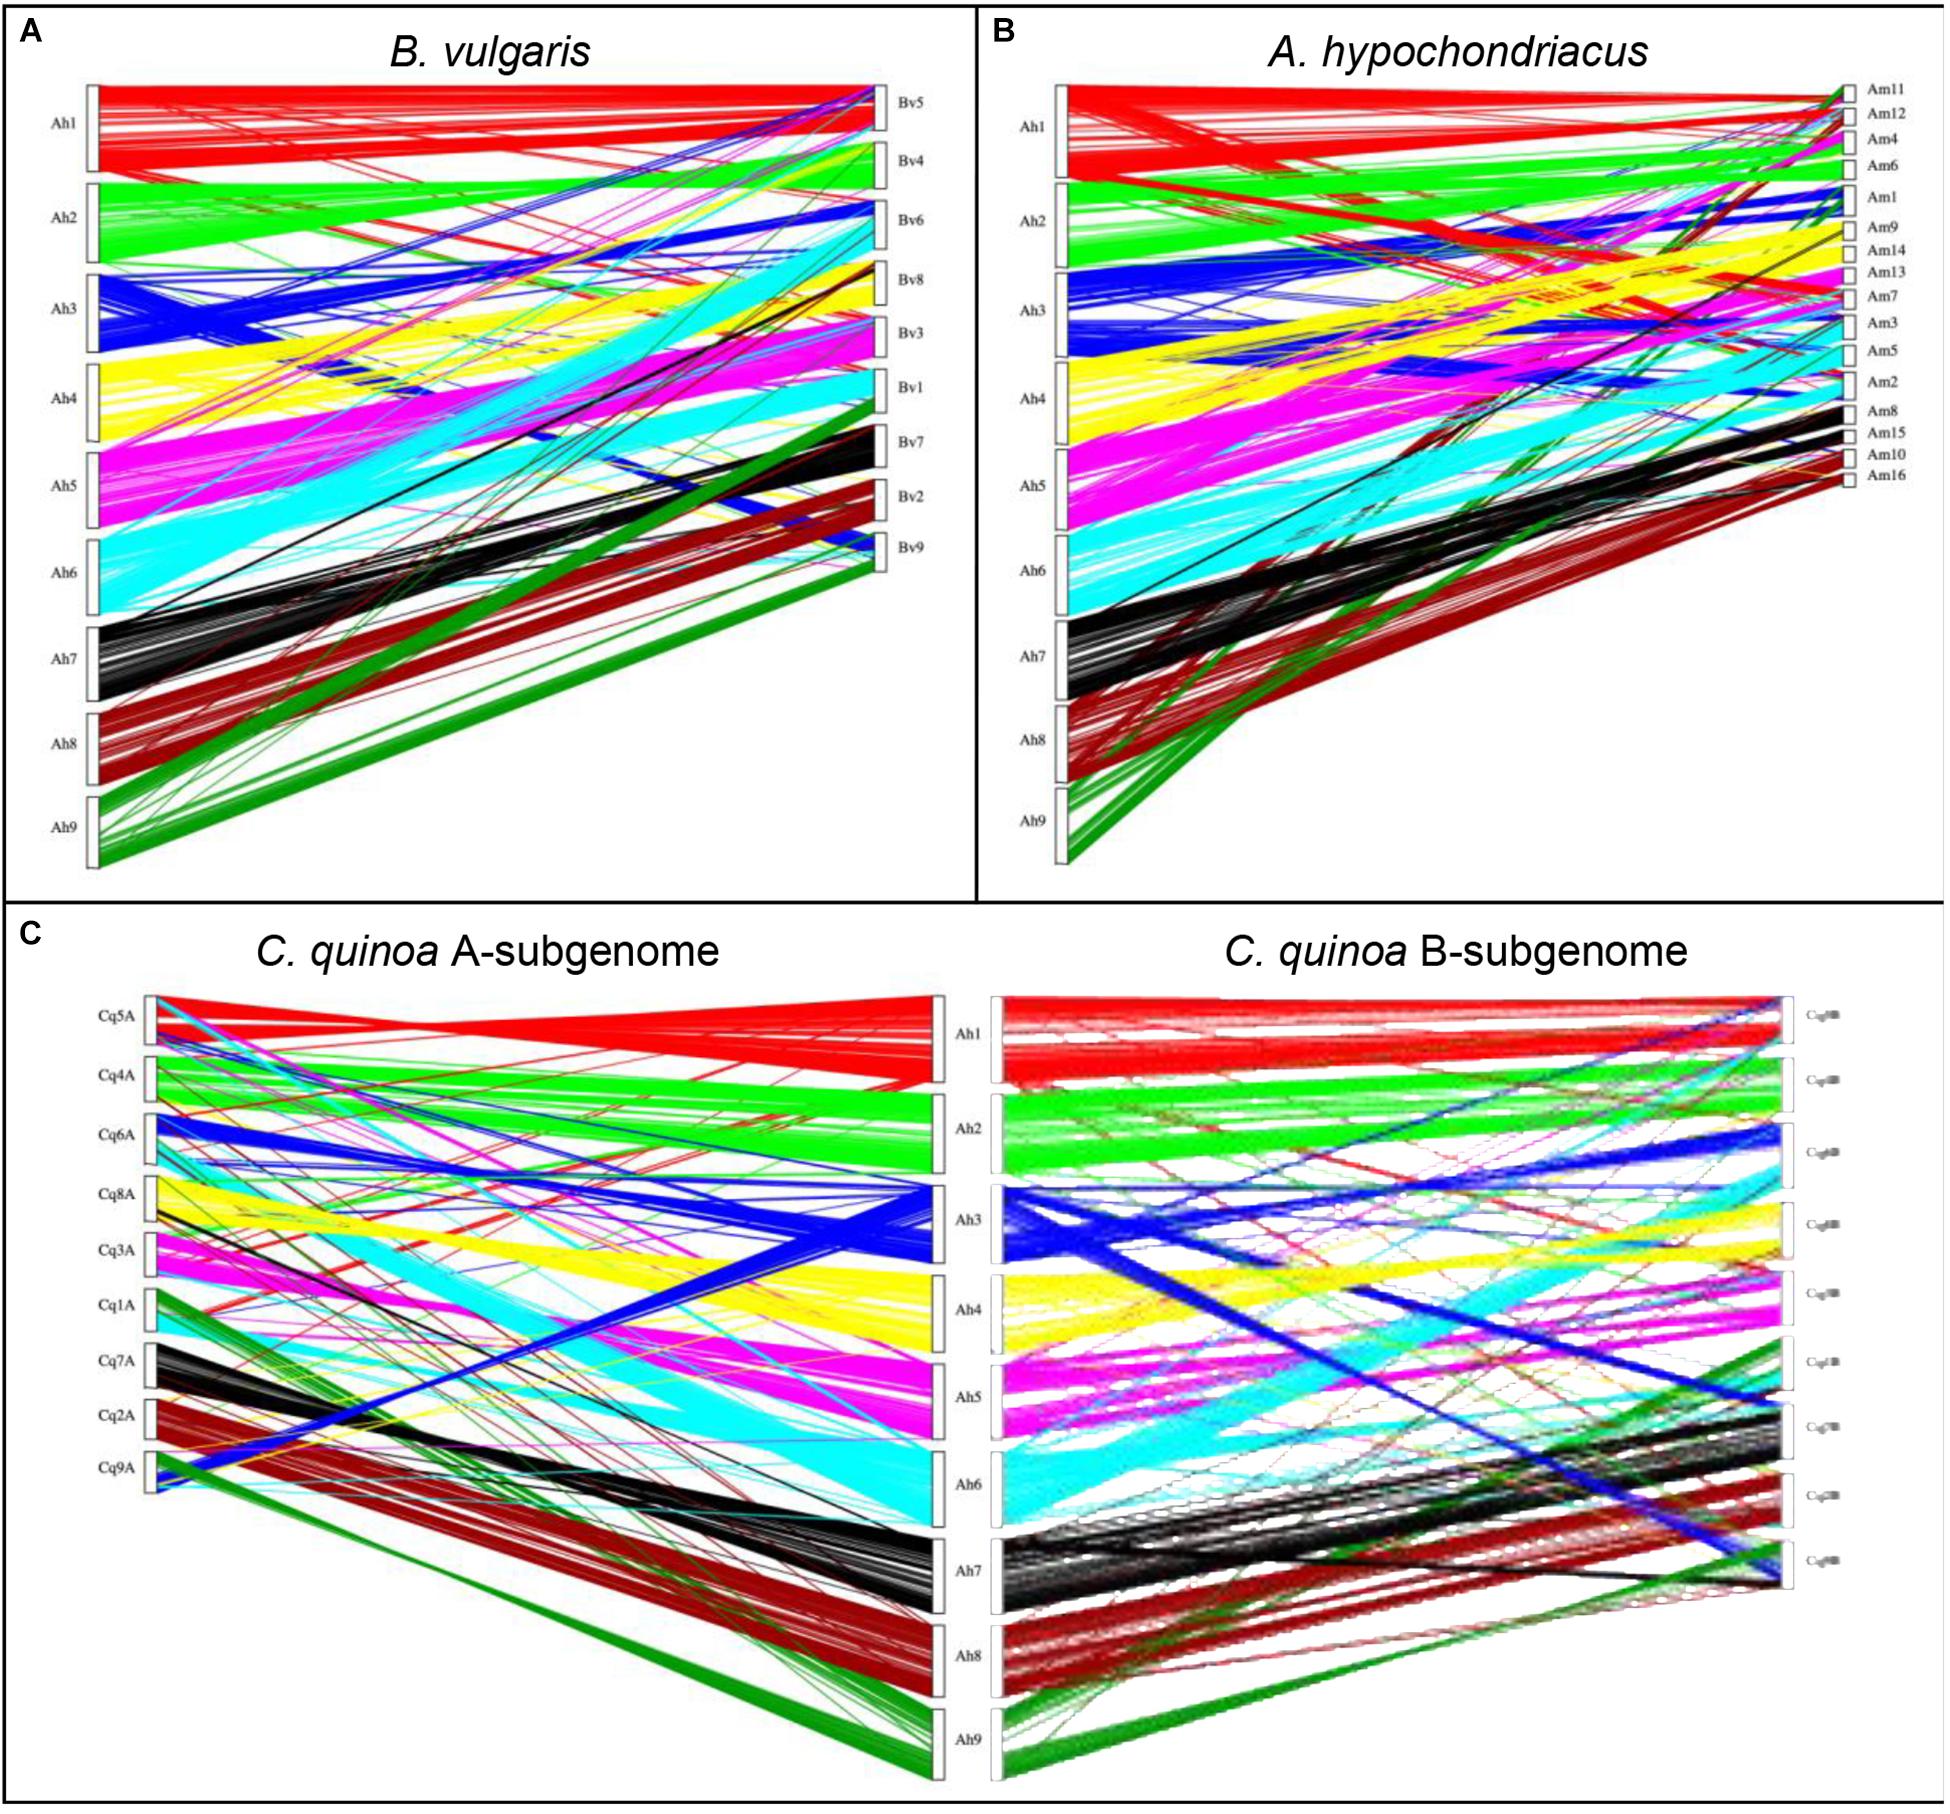
Figure 4. Genomic comparison of A. hortensis with B. vulgaris, A. hypochondriacus, and C. quinoa. The dual synteny plots show syntenic regions between A. hortensis and B. vulgaris (A), A. hypochondriacus (B) and C. quinoa (C) coding sequences. The dual synteny plot of the C. quinoa genome is divided into A- and B-subgenomes with A. hortensis in the center.
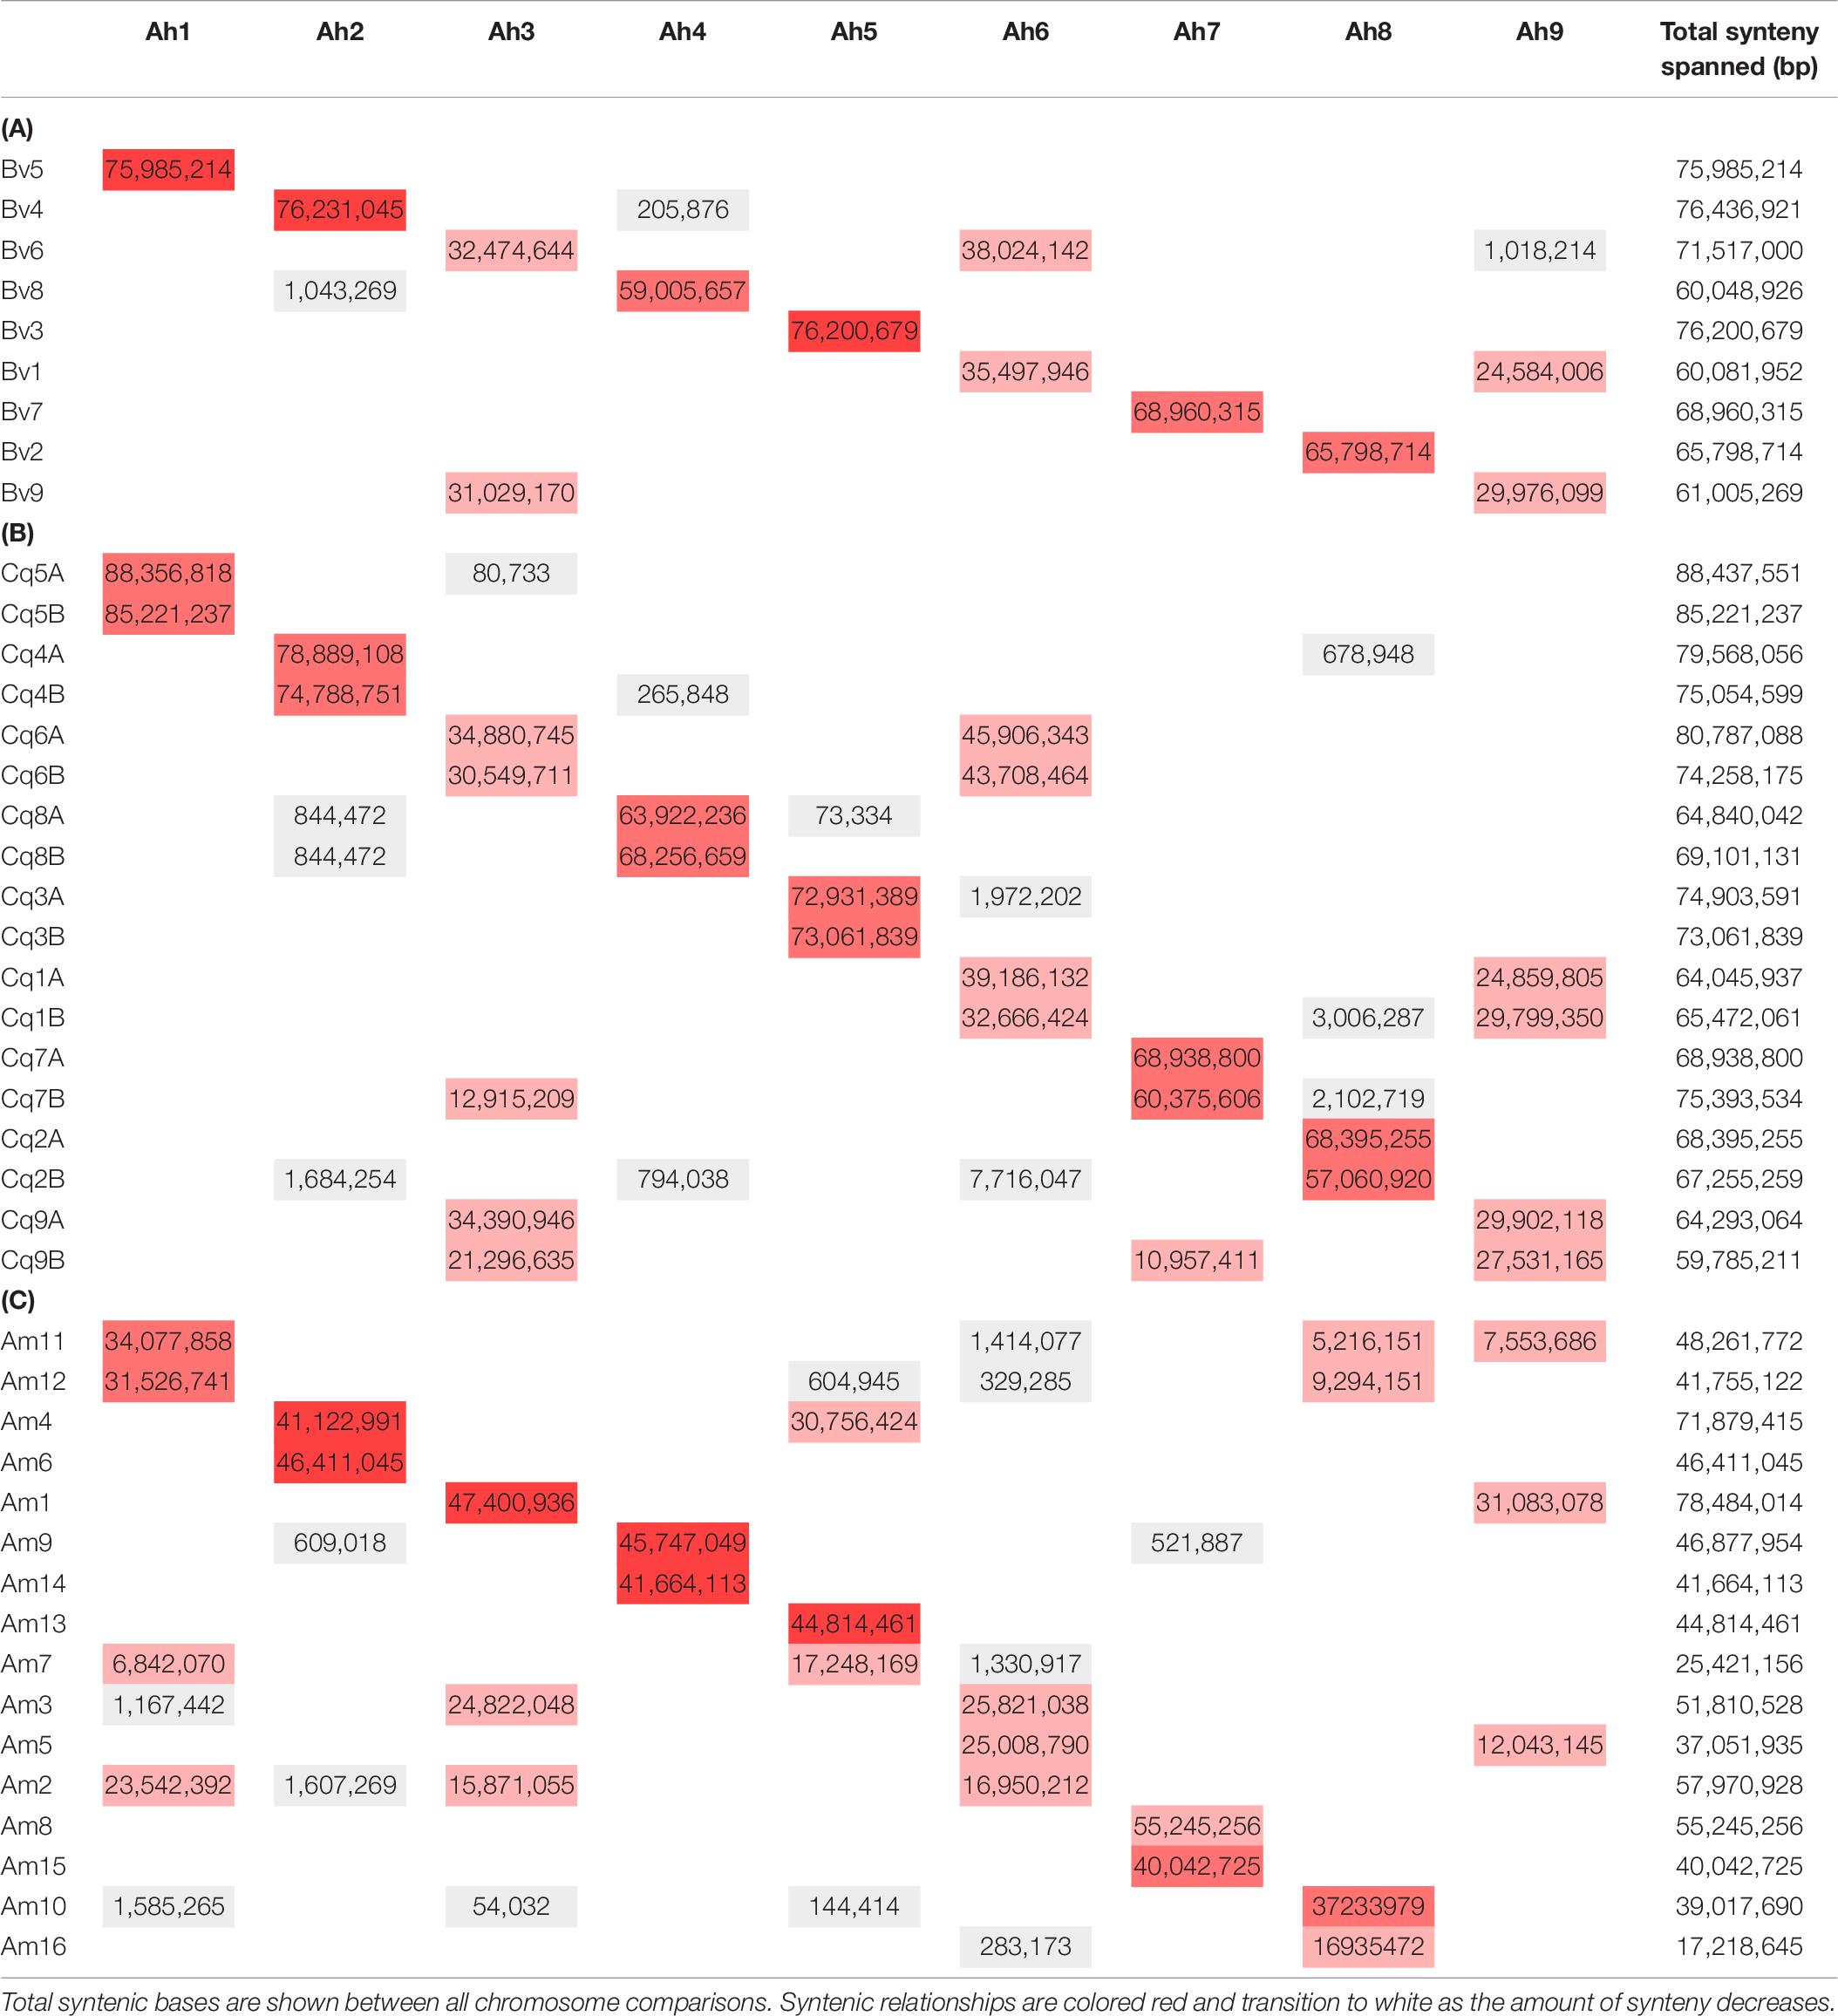
Table 6. Orthologous genes were identified between A. hortensis and beet (A), C. quinoa (B) and Am. hypochondriacus (C) to detect orthologous chromosome relationships.
Atriplex hortensis and B. vulgaris are both diploid and share a haploid chromosome number (n = 9), whereas C. quinoa is an allotetraploid member (showing amphidiploid inheritance) of the subfamily Chenopodioideae, having experienced an ancient allopolyploidization event (Storchova et al., 2015). Our analysis of synteny between C. quinoa and A. hortensis identified a combined total of 24,710 syntenic gene pairs, spanning 1.1 Gb and 1.3 Gb of the C. quinoa and A. hortensis genome, respectively, using a tetraploid-to-diploid (2:1) analysis. The synteny observed among the A. hortensis and C. quinoa chromosomes suggests several orthologous relationships with known homeologous C. quinoa chromosome pairs, including Ah1 = Cq5A (51% shared syntenic block sequence), Cq5B (49%); Ah2 = Cq4A (50%), Cq4B (48%); Ah4 = Cq8A (48%), Cq8B (51%); Ah5 = Cq3A (50%), Cq3B (50%); Ah7 = Cq7A (49%), Cq7B (43%); Ah8 = Cq2A (52%), Cq2B (43%). As with B. vulgaris, A. hortensis chromosomes Ah3, Ah6 and Ah9 have large rearrangements showing synteny to Cq1A&B, Cq6A&B and Cq9A&B.
Atriplex hortensis, B. vulgaris and C. quinoa share a base chromosome number of x = 9, whereas the base number in Amaranthus is x = 8, due to a chromosome loss (Am5) and a chromosome fusion (Am1; Lightfoot et al., 2017). The amaranths belong to the family Amaranthaceae s. str. Subfamily Amaranthoideae and were thus expected to be the most divergent of the three genomes compared. Indeed, while our genome comparison of A. hortensis with A. hypochondriacus clearly showed synteny (Figure 4 and Table 6), the size of the 410 syntenic blocks (12,306 syntenic gene pairs) observed was the smallest of the three genomes (Bv: 2.1 Mb/block; Cq: 2.7 Mb/block; Am: 0.84 Mb/block), accompanied by the lowest block size correlation between the species (Bv: R2 = 0.36; Cq: R2 = 0.42; Am: R2 = 0.04). These decreases are reflective of the more distant evolutionary relationship between Atriplex and Amaranthus within the family. We confirm the chromosome fusion event in Amaranthus as seen by the synteny plot of Ah3, where Ah3 aligns twice with Am1 (Figure 5; red arrow). Although many additional rearrangements are present which obscure one-to-one orthologous chromosome relationships with the known homeologous amaranth chromosomes (Lightfoot et al., 2017), several can be confirmed: Ah2 = Am4 (46%), Am6 (52%); Ah4 = Am9 (52%), Am14 (48%); Ah7 = Am8 (58%), Am15 (42%; Table 6).
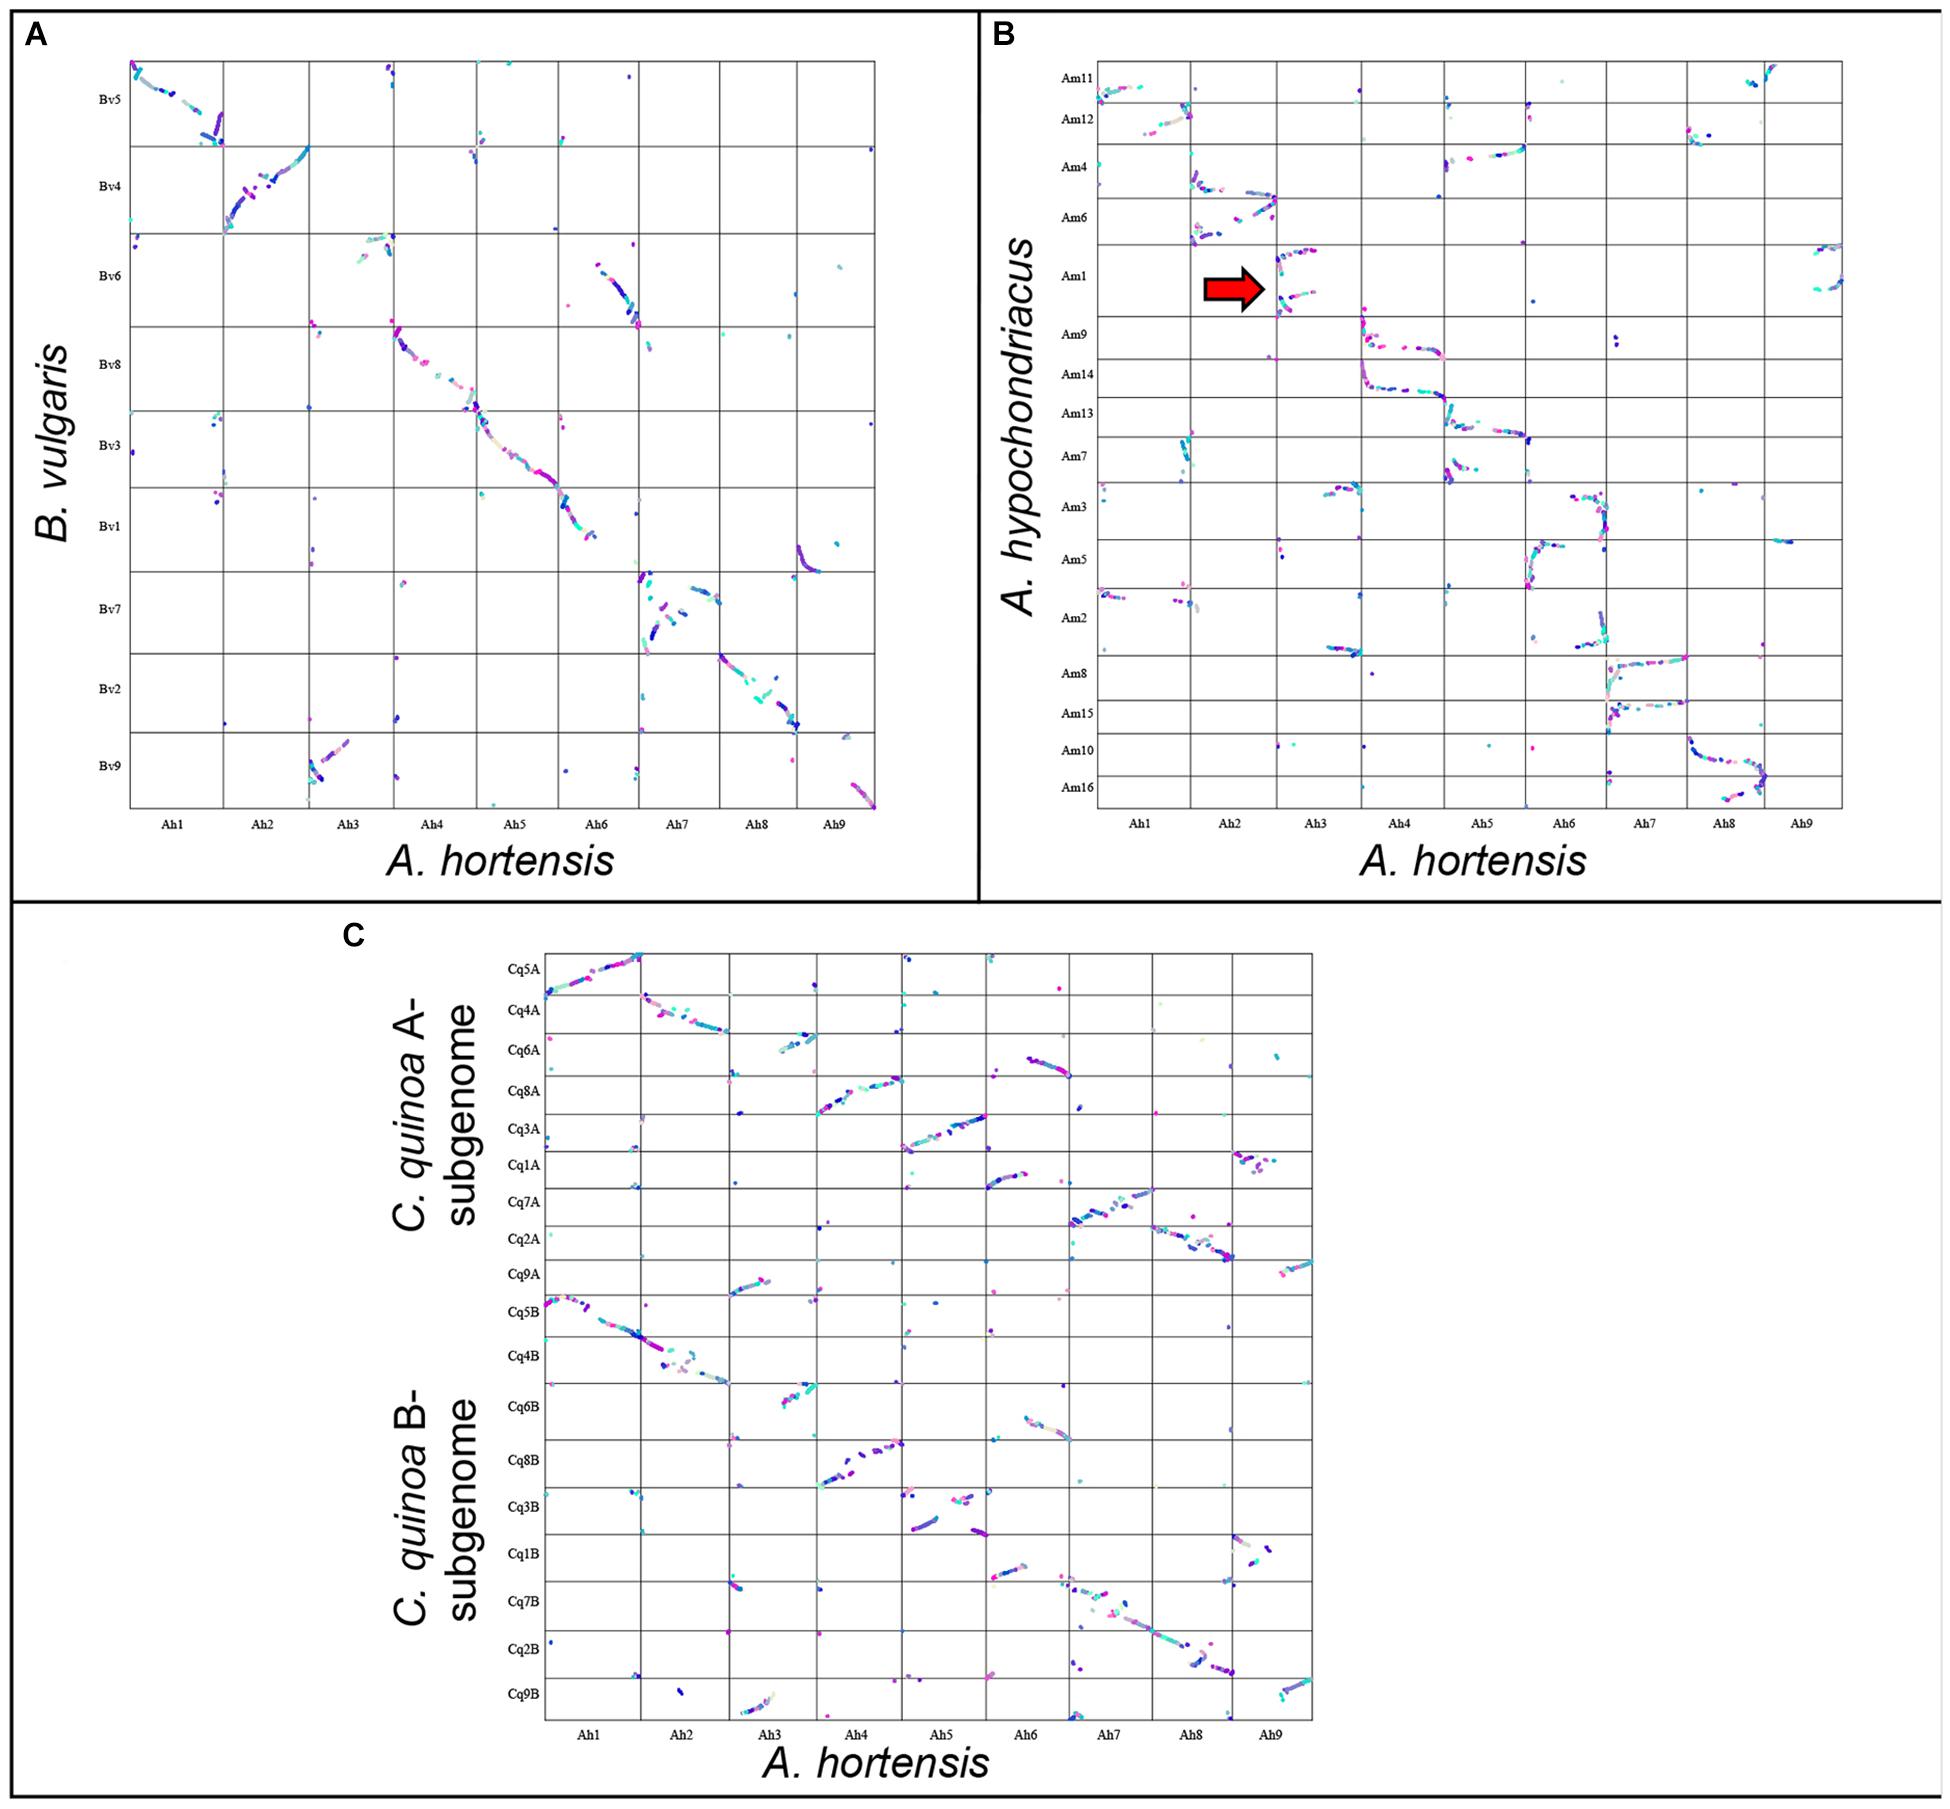
Figure 5. Genomic comparison of A. hortensis with B. vulgaris, Am. hypochondriacus and C. quinoa. Synteny dotplot showing syntenic coding sequences between A. hortensis and B. vulgaris (A), Am. hypochondriacus (B) and C. quinoa (C) coding sequences. Increasing color intensity is associated with increasing homology.
To elucidate the timing of the evolutionary events that separate Atriplex from C. quinoa, B. vulgaris and A. hypochondriacus, we calculated the rate of synonymous substitutions per synonymous site (Ks) in duplicate gene-pairs between the species (Figure 6) using the CodeML (Yang, 2007) tool on the CoGe platform (genomevolution.org/coge). As expected, C. quinoa is most closely related to A. hortensis, with a clear peak present at Ks = 0.25, followed by B. vulgaris (Ks peak = 0.55), while A. hypochondriacus, as expected, is more distantly related, with a Ks peak = 0.7. The timing of the divergence events (time to last common ancestor) can be established using the Ks peak values and synonymous mutation rates, such as the core eukaryotic rate (8.1E–09) proposed by Lynch and Conery (2000) or with lineage specific rates, calibrated to the fossil record. Kadereit et al. (2003) used three paleobotanical fossils to establish a much lower synonymous substitution rate for Chenopodioideae (2.8–4.1E-09), which showed rate constancy among the lineages studied, suggesting that the Amaranthaceae-Chenopodiaceae have a lower nucleotide substitution rate than other angiosperms, including the Arabidopsis rate (1.5E-08). The CodeML workflow in CoGe identifies syntenic gene pairs between species, extracts coding sequences, and aligns protein sequences using the Needleman–Wunsch alignment algorithm, which is then back-translated to a codon alignment that is then used for Ks estimation. Using the lower substitution rates calculated by Kadereit et al. (2003), we date the last shared common ancestor between A. hortensis and C. quinoa, B. vulgaris, and A. hypochondriacus to approximately 30.4 – 44.6 MYA, 67.1 – 98.2 MYA, and 85.3 –125 MYA, respectively.
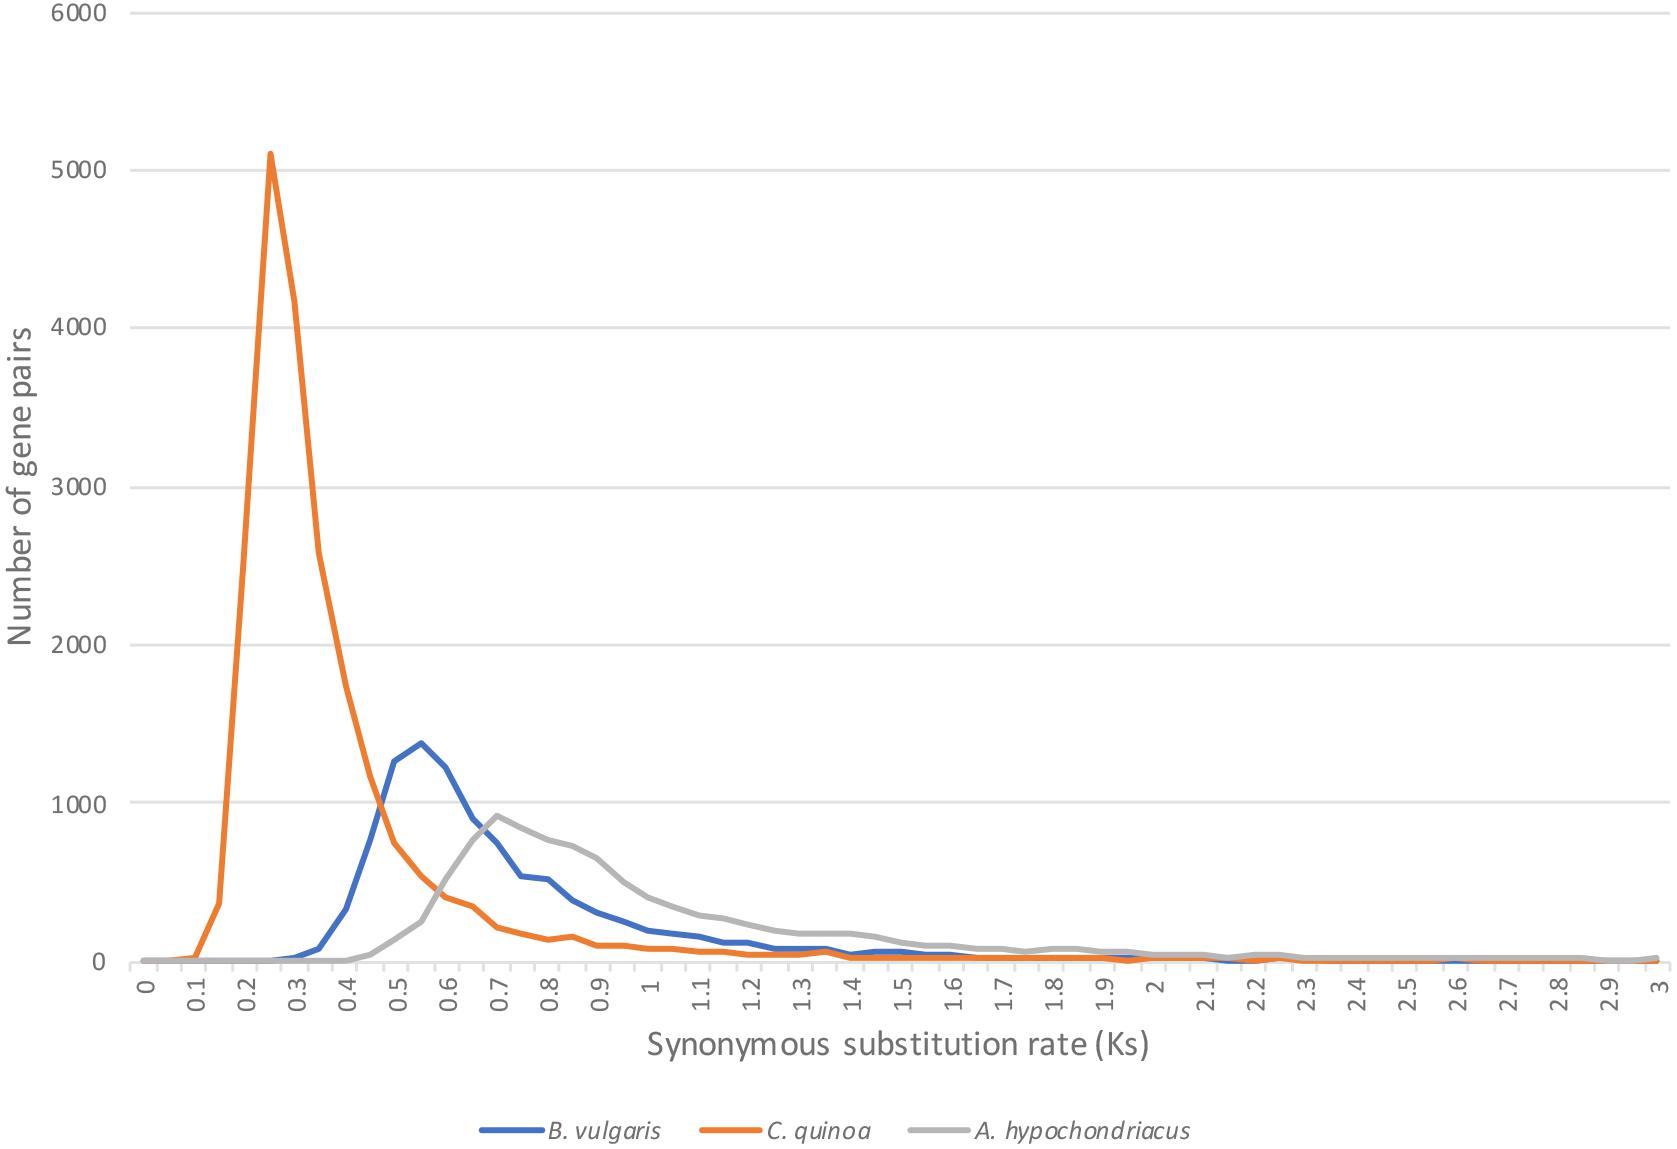
Figure 6. The age of the evolutionary split between A. hortensis and B. vulgaris, C. quinoa, and A. hypochondriacus was estimated using the rate of synonymous substitutions per synonymous site (Ks) calculated from othologous gene pairs. C. quinoa is most closely related to A. hortensis, with a clear peak present at Ks = 0.25, followed by B. vulgaris (Ks peak = 0.55), while A. hypochondriacus is more distantly related, with a Ks peak = 0.7.
Resequencing
A diversity panel consisting of 21 diverse accessions of A. hortensis (Table 1) was re-sequenced using Illumina paired-end sequencing, resulting in an average of 13X coverage (13.2 Gb) per accession. Following alignment and genotype likelihood calling with ANGSD (Korneliussen et al., 2014), a total 17,711,684 SNPs were filtered from the 846,491,542 sites analyzed using a 5% minimum minor allele frequency. A principal components analysis of the covariance data using PC1 and PC2 explained a total of 99.92% of the total variation and clearly identified three clusters of Atriplex accessions, which also agreed with our DeltaK analysis of the number of groups in the data set (K = 3; Figure 7B). Analysis of the 1000-bootstrap, consensus tree identified three distinct clades, with two accessions including the commercial cultivar Triple Purple and a wild accession collected in Alberta, Canada forming the first clade. The second clade consisted of four cultivated accessions of Serbia/Montenegro origin with a single wild accession at their root originating from France. The last and largest clade consisted of two subgroups with the first subgroup consisting of five cultivated lines from Serbia/Montenegro and a second subgroup consisting of four commercially available cultivars (obtained from Wild Garden Seed and Baker Creek Heirloom Seeds) and four accessions from disparate localities across Europe (Poland, Uzbekistan, Norway and Serbia) that were rooted by a wild accession collected in Utah, United States (Figure 7A). The structure plots (Figure 7B) indicate little to no admixture among the subpopulations, suggesting three distinct subpopulations with little to no interbreeding.
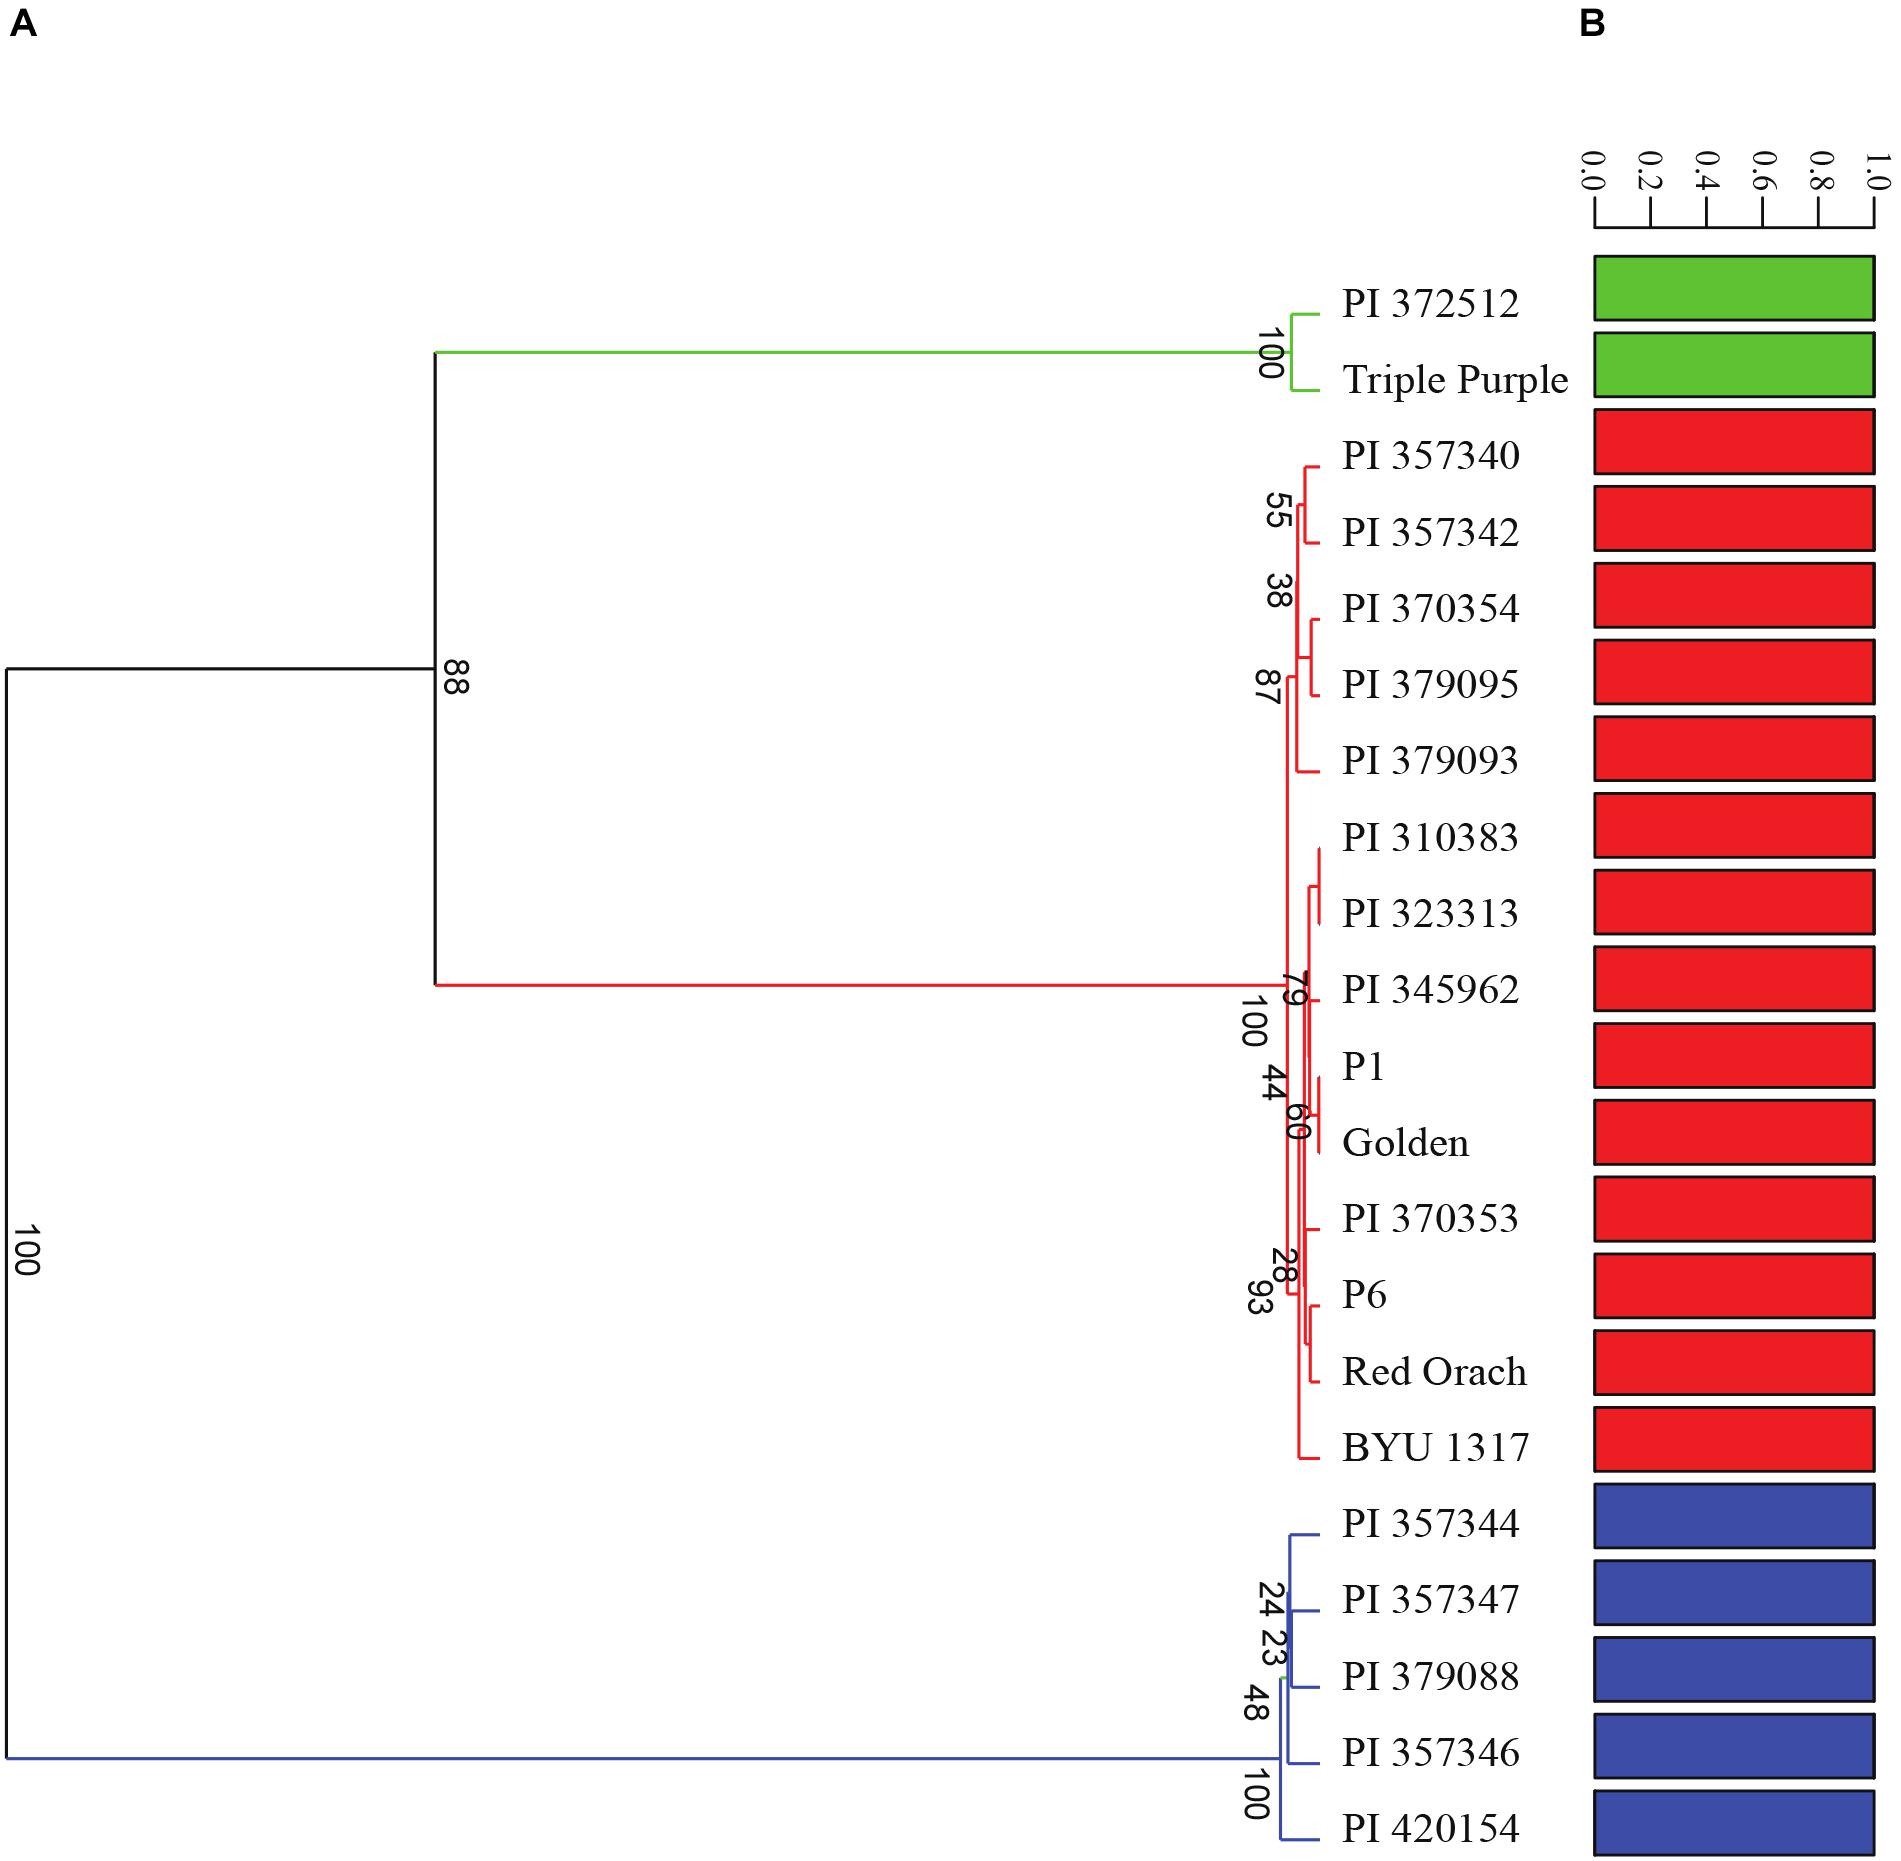
Figure 7. Analysis of the diversity panel using (A) 100-bootstrap UPGMA tree based on a Euclidean distance similarity index and (B) admixture analysis using genotype posterior probabilities for 17,711,684 SNPs. Accession numbers correspond with those found in Table 1.
Discussion
Multiple different libraries were prepared for ONT sequencing, including with and without fragmentation, to ascertain the influence of fragmentation on sequencing yield and read length – both important components of successful genome assembly. Fragmentation consistently improved throughput and yield, with the Covaris g-TUBEs producing the most effective and least variable fragmentation (i.e., based on sequencing yield and read length variation). The effect of centrifugation speed (3,800, 4,000, and 4,200 rpm) was also an important, albeit less controllable, factor. In general, higher centrifugation speeds produced higher yields, but concomitantly with decreased read lengths. Indeed, flow cell nanopores remained active for longer periods with fragmented libraries as compared to those without fragmentation. Kubota et al. (2019) demonstrated a similar correlation between DNA length and nanopore inactivity, with inactivity increasing exponentially in relation to increasing DNA molecule size. Nivala et al. (2013) suggested that one possible reason for this could be that longer molecules correlate with an increased presence of secondary and/or tertiary structures in the DNA molecules. Nanopores are restricted to the width of one DNA molecule at a time; thus, if secondary and/or tertiary structures are present in the DNA molecules, they increase the probability of clogging the nanopores, rendering them inactive. The combination of Covaris g-TUBE libraries prepared with differing centrifugation speeds resulted in a dataset with enough yield to provide ample coverage to compensate for the high error rate of ONT sequencing while still yielding long reads needed to span repetitive or otherwise problematic genomic regions (Table 2).
Canu (Koren et al., 2017), MaSuRCA (Zimin et al., 2013), Flye (Kolmogorov et al., 2019) and wtdbg2 (Ruan and Li, 2020) assemblers were used to assemble the ONT sequence data to ascertain which assembly program would perform best with the A. hortensis ONT sequence data. There were substantial differences in the overall time to finish an assembly, with wtdbg2 being the fastest of the assemblers tested. However, the MaSuRCA and Canu assemblies produced superior assemblies in terms of total contig size, N50, L50 and BUSCO statistics (Figure 2), with the polished Canu assembly ultimately being chosen as the draft genome for Hi-C scaffolding due to concerns of repeat collapse within the MaSuRCA assembly as reflected in its smaller total size of contigs assembled – a concern noted by Kolmogorov et al. (2019) who demonstrated the difficulty of assembling telomeric and centromeric chromosome regions with the MaSuRCA assembler. Three rounds of polishing were conducted utilizing Nanopolish followed by two rounds of Illumina read-based Pilon correction. Nanopolish uses an index to detect misassemblies based on sequencing-generated signal levels generated from the original nanopore sequence data that correspond to likelihood ratios, while Pilon uses read alignments of high-quality Illumina reads to consensus-correct the draft genome (Walker et al., 2014; Loman et al., 2015). RACON (Vaser et al., 2017), another popular long-read consensus polisher that can use ONT and Illumina sequence for consensus correction, was also tested as a substitute for both Nanopolish and Pilon but showed no significant enhancement to the final BUSCO statistics (data not shown). We note that over-polishing an assembly can also be problematic, as seen by a decrease in BUSCO scores, and should therefore be avoided. In our assembly, a third round of polishing did not improve BUSCO scores.
Unsurprisingly, the B subgenome of C. quinoa, which is approximately 25% larger than the assembled A subgenome, shared more and longer syntenic blocks (209 vs 189; 2.9 vs 2.4 Mb average) with A. hortensis. The higher synteny with the B subgenome of C. quinoa may also reflect a closer ancestry of A. hortensis with the B subgenome – whose closest extant known Chenopodium species (C. suecicum Murr or C. ficifolium Sm.) are of Old-World origin, similar to that of A. hortensis. We note that the A-subgenome of C. quinoa is suspected to be of New World origin with its closest known extant species being C. watsonii A. Nelson, which is native to the southwestern United States (Jellen et al., 2019). It should, however, be noted that at least one diploid with the A-genome, C. bryoniifolium Bunge, is native to eastern Siberia (Walsh et al., 2015; Mandák et al., 2018a). Moreover, a new allohexaploid species containing the A-subgenome from C. bryoniifolium has been recently described from the Far East of Russia as C. luteorubrum Mandák & Lomonosova (Mandák et al., 2018b). Thus, an East Asian origin of the A-genome lineage in Chenopodium, with its subsequent trans-Beringian migration and explosive diversification in the Americas, cannot be excluded at the present state of our knowledge; however, that scenario is less parsimonious than the New World origin of the A-genome lineage.
The genome of A. hortensis is highly repetitive with approximately 66.3% of the sequence containing interspersed repetitive sequence. By comparison, the genome of quinoa is 64.5% repetitive (Jarvis et al., 2017). Genomes that contain substantial repeat fractions can be difficult to assemble correctly. To overcome this challenge, Hi-C chromosome-contact maps were used for genome scaffolding which dramatically increased the continuity of the assembly, producing nine chromosome-sized scaffolds presumably representing each of the haploid chromosomes in A. hortensis (n = 9). Additionally, the Hi-C chromatin contact maps leverage the spatial orientation of the chromatin to identify and correct misassemblies in the overlap-layout-consensus assembly produced by Canu that potentially would have gone unnoticed. The nine chromosome pairs in A. hortensis are metacentric to slightly submetacentric (Figure 1). Due to the difficulty in assembling highly conserved and repetitive sequence regions within telomeres, the identification of 13 of the possible 18 telomeric ends is indicative of a highly complete, chromosome-scale genome assembly (Figure 2). The unexpected location of telomeric sequences in the subtelomeric region of one of the arms of chromosome Ah5 could reflect a potential assembly error – although careful inspection of the chromatin maps for this region do not show any indications of misassembly. Similar paracentric inversions have been seen in other species which result in telomere-specific tandem repeats being present in abnormal locations in plant chromosomes (Tek and Jiang, 2004). Nonetheless, additional research, potentially including optical mapping (e.g., BioNano genomics) and/or high-density linkage map development (neither of which have been developed for A. hortensis) should be targeted to this region to verify the orientation of this segment of the chromosome. Such investigations will also help verify the assemblies of chromosomes Ah3, Ah6, and Ah9, which show syntenic relationships with multiple B. vulgaris and C. quinoa chromosomes arms, thus obscuring their orthologous relationships. Such research would undoubtedly provide additional insight into the chromosomal evolution that characterizes the family Chenopodiaceae s. str. and the whole Amaranthaceae/Chenopodiaceae alliance – such as the homoelog loss and chromosomal fusion reported in Amaranthus hypochondriacus (Lightfoot et al., 2017).
It is not surprising that the North American-derived materials grouped with European accessions, as it is commonly understood that the center of origin of A. hortensis is the Trans-Himalayan (central Asia and Siberia) and Southeast European regions and that it was likely introduced during the third century B.C. into the Mediterranean littoral and from there to the Americas in Colonial times (Ruas et al., 2001). The species has become locally naturalized along riverbanks, roadsides, and ditches in parts of the Great Basin of North America (personal observations). There is also evidence of its use as a food in Switzerland as early as the Neolithic Age (Andrews, 1948), suggesting widespread, albeit ancient use of the species. Unfortunately, the United States National Plant Germplasm System curates only 45 A. hortensis accessions, of which very few are publicly available. The identification of three highly distinct clades, showing only limited admixture in our results, emphasizes the need for additional collections of wild and cultivated germplasm from throughout its native range, particularly in its presumed center of origin. Indeed, of the 45 curated accessions at the USDA, nearly two-thirds (28) are derived from a single European region corresponding to the Balkan Peninsula in Southeast Europe (Serbia-Macedonia). Subsequent phylogenetic analysis using materials from much broader geographic collections should improve our understanding of extant genetic variation and speciation processes within A. hortensis.
Data Availability Statement
The raw sequences are deposited in the National Center for Biotechnology Information (NCBI) Sequence Read Archive database under the BioProject ID PRJNA607334 with the following sequence read archive (SRR) accession numbers: SRR11147376 (Nanopore data), SRR11147367 – SRR11147368 (Hi-C), SRR11147369 – SRR11147375 (transcriptome) and SRR11123164 – SRR11123184 (resequencing panel; Table 1). Bulk data downloads, including annotations and BLAST analysis, and JBrowse viewing of the final Hi-C assembly are available at CoGe (https://genomevolution.org/coge/;Genomeid56906). The scaffold names in CoGe corresponding to specific pseudo chromosome assemblies are as follows: Scaffold_552_HRSCAF_710 = Ah1; Scaffold_579_HRSCAF_742 = Ah2; Scaffold_1312_HRSCAF _2063 = Ah3; Scaffold_481_HRSCAF_623 = Ah4; Scaffold_390 _HRSCAF_510 = Ah5; Scaffold_1281_HRSCAF_1836 = Ah6; Scaffold_1313_HRSCAF_2064 = Ah7; Scaffold_1311_HRSCAF _2062 = Ah8; Scaffold_291_HRSCAF_384 = Ah9. In addition, the variant call file (VCF) for the diversity panel is available as a download from CoGe (ID# 15277).
Author Contributions
PM, ENJ, and EWJ conceived and designed the study. SH and DL performed the sequencing experiments and managed the plant material. SM performed the flow cytometry experiments, and provided plant material, taxonomic information, and phylogenetic analysis. EWJ provided the assembly bioinformatics and expertise. BK preformed the fluorescent in situ hybridization experiments. PM, SH, and ENJ wrote the manuscript. All authors read and approved the final manuscript.
Funding
This work was supported by funding from General Mills, Inc., and internal funds of Brigham Young University.
Conflict of Interest
The authors declare that this study received funding from General Mills, Inc. The funder had provided financial assistance based on an initial interest in investigating development of new specialty crops. The authors declare that the funder was not involved in the study design, collection, analysis, interpretation of data, the writing of this article or the decision to submit it for publication. EJ was initially employed by General Mills and subsequently left to form 25:2 Solutions.
The remaining authors declare that the research was conducted in the absence of any commercial or financial relationships that could be construed as a potential conflict of interest.
Acknowledgments
We gratefully acknowledge the assistance of the USDA, ARS, NALPGRU at Parlier, California, and Frank Morton at Wild Garden Seed Co., for seed contributions and to General Mills, Inc., for financial assistance in carrying out this project. We are also indebted to Isaac Clouse and other undergraduate students who helped take care of plants and performed DNA extractions. We are also grateful to Dr. Daniel J. Fairbanks (Utah Valley University, Orem, Utah, United States) for sharing his extensive insight of the Atriplex genus.
Supplementary Material
The Supplementary Material for this article can be found online at: https://www.frontiersin.org/articles/10.3389/fpls.2020.00624/full#supplementary-material
Abbreviations
BLAST, basic local alignment search tool; Mbp, megabases; MYA, million years ago; ONT, Oxford nanopore technology; SNP, single nucleotide polymorphisms.
Footnotes
References
Altschul, S. F., Gish, W., Miller, W., Myers, E. W., and Lipman, D. J. (1990). Basic local alignment search tool. J. Mol. Biol. 215, 403–410.
Andrews, A. C. (1948). Orach as the spinach of the classical period. Isis 39, 169–172. doi: 10.1086/348950
APG IV (2016). An update of the Angiosperm Phylogeny Group classification for the orders and families of flowering plants: APG IV. Bot. J. Linnean Soc. 181, 1–20. doi: 10.1016/j.jep.2015.05.035
APG (Angiosperm Phylogeny Group) (1998). An ordinal classification for the families of flowering plants. Ann. Missouri Bot. Garden 85, 531–553.
Bolger, A. M., Lohse, M., and Usadel, B. (2014). Trimmomatic: a flexible trimmer for Illumina sequence data. Bioinformatics 30, 2114–2120. doi: 10.1093/bioinformatics/btu170
Brignone, N. F., Pozner, R. E., and Denham, S. S. (2019). Origin and evolution of Atriplex (Amaranthaceae s.l.) in the Americas: unexpected insights from South American species. Taxon 68, 1021–1036.
De Coster, W., D’Hert, S., Schultz, D. T., Cruts, M., and Van Broeckhoven, C. (2018). NanoPack: visualizing and processing long-read sequencing data. Bioinformatics 34, 2666–2669. doi: 10.1093/bioinformatics/bty149
Dolezel, J., Bartos, J., Voglmayr, H., and Greilhuber, J. (2003). Nuclear DNA content and genome size of trout and human. Cytometry A 51, 127–128. doi: 10.1002/cyto.a.10013
Du, J., Tian, Z., Hans, C. S., Laten, H. M., Cannon, S. B., Jackson, S. A., et al. (2010). Evolutionary conservation, diversity and specificity of LTR-retrotransposons in flowering plants: insights from genome-wide analysis and multi-specific comparison. Plant J. 63, 584–598. doi: 10.1111/j.1365-313X.2010.04263.x
Evanno, G., Regnaut, S., and Goudet, J. (2005). Detecting the number of clusters of individuals using the software STRUCTURE: a simulation study. Mol. Ecol. 14, 2611–2620. doi: 10.1111/j.1365-294X.2005.02553.x
Flavell, R. B., Bennett, M. D., Smith, J. B., and Smith, D. B. (1974). Genome size and the proportion of repeated nucleotide sequence DNA in plants. Biochem. Genet. 12, 257–269. doi: 10.1007/bf00485947
Fuentes-Bazan, S., Uotila, P., and Borsch, T. (2012). A novel phylogeny-based generic classification for Chenopodium sensu lato, and a tribal rearrangement of Chenopodioideae (Chenopodiaceae). Willdenowia 42, 5–24.
Funk, A., Galewski, P., and McGrath, J. M. (2018). Nucleotide-binding resistance gene signatures in sugar beet, insights from a new reference genome. Plant J. 95, 659–671. doi: 10.1111/tpj.13977
Galindo-Gonzalez, L., Mhiri, C., Deyholos, M. K., and Grandbastien, M. A. (2017). LTR-retrotransposons in plants: engines of evolution. Gene 626, 14–25. doi: 10.1016/j.gene.2017.04.051
Haas, B. J., Delcher, A. L., Wortman, J. R., and Salzberg, S. L. (2004). DAGchainer: a tool for mining segmental genome duplications and synteny. Bioinformatics 20, 3643–3646. doi: 10.1093/bioinformatics/bth397
Hammer, Ø, Harper, D. A. T., and Ryan, P. D. (2001). PAST: paleontological statistics software package for education and data analysis. Palaeontol. Electronica 4, 1–9.
Hernández-Ledesma, P., Berendsohn, W. G., Borsch, T., Mering, S. V., Akhani, H., Arias, S., et al. (2015). A taxonomic backbone for the global synthesis of species diversity in the angiosperm order Caryophyllales. Willdenowia 45, 281–383.
Holt, C., and Yandell, M. (2011). MAKER2: an annotation pipeline and genome-database management tool for second-generation genome projects. BMC Bioinformatics 12:491. doi: 10.1186/1471-2105-12-491
Jarvis, D. E., Ho, Y. S., Lightfoot, D. J., Schmockel, S. M., Li, B., Borm, T. J. A., et al. (2017). The genome of Chenopodium quinoa. Nature 542, 307–312. doi: 10.1038/nature21370
Jellen, E. N., Jarvis, D. E., Hunt, S. P., Mangelsen, H. H., and Maughan, P. J. (2019). New seed collections of North American pitseed goosefoot (Chenopodium berlandieri) and efforts to identify its diploid ancestors through whole-genome sequencing. Cienc. Investig. Agrar. 46, 187–196.
Kadereit, G., Borsch, T., Weising, K., and Freitag, H. (2003). Phylogeny of Amaranthaceae and Chenopodiaceae and the evolution of C4 photosynthesis. Int. J. Plant Sci. 164, 959–986.
Kadereit, G., Mavrodiev, E. V., Zacharias, E. H., and Sukhorukov, A. P. (2010). Molecular phylogeny of Atripliceae (Chenopodioideae, Chenopodiaceae): implications for systematics, biogeography, flower and fruit evolution, and the origin of C4 photosynthesis. Am. J. Bot. 97, 1664–1687. doi: 10.3732/ajb.1000169
Kim, D., Landmead, B., and Salzberg, S. L. (2015). HISAT: a fast spliced aligner with low memory requirements. Nat. Methods 12, 357–360. doi: 10.1038/nmeth.3317
Kolano, B., Tomczak, H., Molewska, R., Jellen, E. N., and Maluszynska, J. (2012). Distribution of 5S and 35S rRNA gene sites in 34 Chenopodium species (Amaranthaceae). Bot. J. Linnean Soc. 170, 220–231.
Kolmogorov, M., Yuan, J., Lin, Y., and Pevzner, P. A. (2019). Assembly of long error-prone reads using repeat graphs. Nat. Biotechnol. 37, 540–546. doi: 10.1038/s41587-019-0072-8
Koren, S., Walenz, B. P., Berlin, K., Miller, J. R., Bergman, N. H., and Phillippy, A. M. (2017). Canu: scalable and accurate long-read assembly via adaptive k-mer weighting and repeat separation. Genome Res. 27, 722–736. doi: 10.1101/gr.215087.116
Korneliussen, T. S., Albrechtsen, A., and Nielsen, R. (2014). ANGSD: analysis of next generation sequencing data. BMC Bioinformatics 15:356. doi: 10.1186/s12859-014-0356-4
Kubota, T., Lloyd, K., Sakashita, N., Minato, S., Ishida, K., and Mitsui, T. (2019). Clog and release, and reverse motions of DNA in a nanopore. Polymers (Basel) 11:84. doi: 10.3390/polym11010084
Lanfear, R., Schalamun, M., Kainer, D., Wang, W., and Schwessinger, B. (2019). MinIONQC: fast and simple quality control for MinION sequencing data. Bioinformatics 35, 523–525. doi: 10.1093/bioinformatics/bty654
Langmead, B., and Salzberg, S. L. (2012). Fast gapped-read alignment with Bowtie 2. Nat. Methods 9, 357–359. doi: 10.1038/nmeth.1923
Li, S. F., Guo, Y. J., Li, J. R., Zhang, D. X., Wang, B. X., Li, N., et al. (2019). The landscape of transposable elements and satellite DNAs in the genome of a dioecious plant spinach (Spinacia oleracea L.). Mobile DNA 10:3. doi: 10.1186/s13100-019-0147-6
Lightfoot, D. J., Jarvis, D. E., Ramaraj, T., Lee, R., Jellen, E. N., and Maughan, P. J. (2017). Single-molecule sequencing and Hi-C-based proximity-guided assembly of amaranth (Amaranthus hypochondriacus) chromosomes provide insights into genome evolution. BMC Biol. 15:74. doi: 10.1186/s12915-017-0412-4
Loman, N. J., Quick, J., and Simpson, J. T. (2015). A complete bacterial genome assembled de novo using only Nanopore sequencing data. Nat. Methods 12, 733–735. doi: 10.1038/nmeth.3444
Lu, H., Giordano, F., and Ning, Z. (2016). Oxford Nanopore MinION sequencing and genome assembly. Genomics Proteomics Bioinformatics 14, 265–279. doi: 10.1016/j.gpb.2016.05.004
Lynch, M., and Conery, J. S. (2000). The evolutionary fate and consequences of duplicate genes. Science 290, 1151–1155. doi: 10.1126/science.290.5494.1151
Mandák, B., Krak, K., Vít, P., Lomonosova, M. N., Belyayev, A., Habibi, F., et al. (2018a). Hybridization and polyploidization within the Chenopodium album aggregate analysed by means of cytological and molecular markers. Mol. Phylogenetics Evol. 129, 189–201. doi: 10.1016/j.ympev.2018.08.016
Mandák, B., Lomonosova, M. N., and Mosyakin, S. L. (2018b). Chenopodium luteorubrum (Chenopodiaceae/Amaranthaceae sensu APG): a remarkable new species from the Russian Far East. Phytotaxa 382, 102–112.
Mangelson, H., Jarvis, D. E., Mollinedo, P., Rollano-Penaloza, O. M., Palma-Encinas, V. D., Gomez-Pando, L. R., et al. (2019). The genome of Chenopodium pallidicaule: an emerging Andean super grain. Appl. Plant Sci. 7:e11300. doi: 10.1002/aps3.11300
Maughan, P. J., Kolano, B. A., Maluszynska, J., Coles, N. D., Bonifacio, A., Rojas, J., et al. (2006). Molecular and cytological characterization of ribosomal RNA genes in Chenopodium quinoa and Chenopodium berlandieri. Genome 49, 825–839. doi: 10.1139/g06-033
McArthur, E. D., Stevens, R., and Blauer, A. C. (1983). Growth performance comparisons among 18 accessions of fourwing saltbush [Atriplex canescens] at two sites in central Utah. J. Range Mgmt. 36:78.
Meisner, J., and Albrechtsen, A. (2018). Inferring population structure and admixture proportions in low-depth NGS data. Genetics 210, 719–731. doi: 10.1534/genetics.118.301336
Michael, T. P. (2014). Plant genome size variation: bloating and purging DNA. Brief Funct. Genomics 13, 308–317. doi: 10.1093/bfgp/elu005
Moll, K. M., Zhou, P., Ramaraj, T., Fajardo, D., Devitt, N. P., Sadowsky, M. J., et al. (2017). Strategies for optimizing BioNano and Dovetail explored through a second reference quality assembly for the legume model, Medicago truncatula. BMC Genomics 18:578. doi: 10.1186/s12864-017-3971-4
Morales-Briones, D. F., Kadereit, G., Tefarikis, D. T., Moore, M. J., Smith, S. A., Brockington, S. F., et al. (2020). Disentangling sources of gene tree discordance in phylotranscriptomic datasets: a case study from Amaranthaceae s.l. bioRxiv [Preprint]. doi: 10.1101/794370
Mosyakin, S. L., and Iamonico, D. (2017). Nomenclatural changes in Chenopodium (incl. Rhagodia) (Chenopodiaceae), with considerations on relationships of some Australian taxa and their possible Eurasian relatives. Nuytsia 28, 255–271.
Mosyakin, S. L., and Walter, J. (2018). (2660) Proposal to conserve the name Chenopodium quinoa (Chenopodiaceae/Amaranthaceae sensu APG) against C. purpurascens and C. punctulatum. Taxon 67, 1222–1223.
Nivala, J., Marks, D. B., and Akeson, M. (2013). Unfoldase-mediated protein translocation through an α-hemolysin nanopore. Nat. Biotechnol. 31, 247–250. doi: 10.1038/nbt.2503
Ou, S. J., and Jiang, N. (2018). LTR_retriever: a highly accurate and sensitive program for identification of long terminal repeat retrotransposons. Plant Physiol. 176, 1410–1422. doi: 10.1104/pp.17.01310
Pertea, M., Pertea, G. M., Antonescu, C. M., Chang, T. C., Mendell, J. T., and Salzberg, S. L. (2015). StringTie enables improved reconstruction of a transcriptome from RNA-seq reads. Nat. Biotechnol. 33, 290–295. doi: 10.1038/nbt.3122
Putnam, N. H., O’Connell, B. L., Stites, J. C., Rice, B. J., Blanchette, M., Calef, R., et al. (2016). Chromosome-scale shotgun assembly using an in vitro method for long-range linkage. Genome Res. 26, 342–350. doi: 10.1101/gr.193474.115
Richards, E. J., and Ausubel, F. M. (1988). Isolation of a higher eukaryotic telomere from Arabidopsis thaliana. Cell 53, 127–136. doi: 10.1016/0092-8674(88)90494-1
Rinchen, T., Narendra, S., Samar Bahadur, M., Soni, V., Phour, M., and Kumar, B. (2017). Morphological characterization of indigenous vegetable (‘Atriplex hortensis’ L.) from trans-Himalayan region of Ladakh (Jammu and Kashmir), India. Australian J. Crop Sci. 11, 258–263.
Ruan, J., and Li, H. (2020). Fast and accurate long-read assembly with wtdbg2. Nat. Methods 17, 155–158. doi: 10.1038/s41592-019-0669-3
Ruas, C. F., Ruas, P. M., Stutz, H. C., and Fairbanks, D. J. (2001). Cytogenetic studies in the genus Atriplex (Chenopodiaceae). Caryologia 54, 129–145.
Sai Kachout, S., Ben Mansoura, A., Jaffel Hamza, K., Leclerc, J. C., Rejeb, M. N., and Ouerghi, Z. (2011). Leaf–water relations and ion concentrations of the halophyte Atriplex hortensis in response to salinity and water stress. Acta Physiol. Plant. 33, 335–342.
Simão, F. A., Waterhouse, R. M., Ioannidis, P., Kriventseva, E. V., and Zdobnov, E. M. (2015). BUSCO: assessing genome assembly and annotation completeness with single-copy orthologs. Bioinformatics 31, 3210–3212. doi: 10.1093/bioinformatics/btv351
Simcox, J., and Stonescu, I. (2014). Ten promising crops for Western and Northern Europe. Analysis and Recommendations. Utrecht: Kiemkracht, 56.
Simon, R. D., Abeliovich, A., and Belkin, S. (1994). A novel terrestrial halophilic environment: the phylloplane of Atriplex halimus, a salt-excreting plant. FEMS Microbiol. Ecol. 14, 99–109.
Smit, A. F. A., and Hubley, R. (2008–2015). RepeatModeler Open-1.0. Available online at: http://www.repeatmasker.org (accessed January 22, 2020).
Smit, A. F. A., Hubley, R., and Green, P. (2013–2015). RepeatMasker Open-4.0. Available online at: http://www.repeatmasker.org (accessed January 22, 2020).
Smith, T. W., Kron, P., and Martin, S. L. (2018). flowPloidy: An R package for genome size and ploidy assessment of flow cytometry data. Applications in plant sciences, 6(7), e01164. doi: 10.1002/aps3.1164
Stanke, M., Steinkamp, R., Waack, S., and Morgenstern, B. (2004). AUGUSTUS: a web server for gene finding in eukaryotes. Nucleic Acids Res. 32, W309–W312. doi: 10.1093/nar/gkh379
Storchova, H., Drabesova, J., Chab, D., Kolar, J., and Jellen, E. N. (2015). The introns in FLOWERING LOCUS T-LIKE (FTL) genes are useful markers for tracking paternity in tetraploid Chenopodium quinoa Willd. Genet. Resour. Crop Evol. 62, 913–925.
Sukhorukov, A. P. (2006). Zur systematik und chorologie der in russland und benachbarten staaten (in den Grenzen der ehemaligen UdSSR) vorkommenden Atriplex-Arten (Chenopodiaceae). Ann. Naturhist. Mus. Wien Ser. B 108, 307–420.
Sukhorukov, A. P. (2014). The Carpology of the Family Chenopodiaceae in Relations to Problems of Phylogeny, Systematics and Diagnostics of its Representatives. Tula: Grif i K, 400.
Tanaka, Y., Sasaki, N., and Ohmiya, A. (2008). Biosynthesis of plant pigments: anthocyanins, betalains and carotenoids. Plant J. 54, 733–749. doi: 10.1111/j.1365-313X.2008.03447.x
Tek, A., and Jiang, J. (2004). The centromeric regions of potato chromosomes contain megabase-sized tandem arrays of telomere-similar sequence. Chromosoma 113, 77–83. doi: 10.1007/s00412-004-0297-1
Todd, J. J., and Vodkin, L. O. (1996). Duplications that suppress and deletions that restore expression from a chalcone synthase multigene family. Plant Cell 8, 687–699. doi: 10.1105/tpc.8.4.687
Turland, N. J., Wiersema, J. H., Barrie, F. R., Greuter, W., Hawksworth, D. L., Herendeen, P. S., et al. (2018). International Code of Nomenclature for Algae, Fungi, and Plants (Shenzhen Code) Adopted by the Nineteenth International Botanical Congress, Shenzhen, China, July 2017. [Regnum Vegetabile, vol. 159]. Glashütten: Koeltz Botanical Books, 254.
Vaser, R., Soviæ, I., Nagarajan, N., and Šikiæ, M. (2017). Fast and accurate de novo genome assembly from long uncorrected reads. Genome Res. 27, 737–746. doi: 10.1101/gr.214270.116
Vickerman, D. B., Shannon, M. C., Bañuelos, G. S., Grieve, C. M., and Trumble, J. T. (2002). Evaluation of Atriplex lines for selenium accumulation, salt tolerance and suitability for a key agricultural insect pest. Environ. Pollut. 120, 463–473. doi: 10.1016/s0269-7491(02)00116-1
Walker, B. J., Abeel, T., Shea, T., Priest, M., Abouelliel, A., Sakthikumar, S., et al. (2014). Pilon: an integrated tool for comprehensive microbial variant detection and genome assembly improvement. PLoS One 9:e112963. doi: 10.1371/journal.pone.0112963
Walsh, B. M., Adhikary, D., Maughan, P. J., Emshwiller, E., and Jellen, E. N. (2015). Chenopodium polyploidy inferences from Salt Overly Sensitive 1 (SOS1) data. Am. J. Bot. 102, 533–543. doi: 10.3732/ajb.1400344
Welsh, S. L., and Crompton, C. (1995). Names and types in perennial Atriplex Linnaeus (Chenopodiaceae) in North America selectively exclusive of Mexico. Great Basin Nat. 55, 322–334.
Wick, R. R., Judd, L. M., Gorrie, C. L., and Holt, K. E. (2017). Completing bacterial genome assemblies with multiplex MinION sequencing. Microb. Genom. 3:3000132. doi: 10.1099/mgen.0.000132
Wright, K. H., Pike, O. A., Fairbanks, D. J., and Huber, C. S. (2002). Composition of Atriplex hortensis, sweet and bitter Chenopodium quinoa seeds. J. Food Sci. 67, 1383–1385.
Yan, H., Martin, S. L., Bekele, W. A., Latta, R. G., Diederichsen, A., Peng, Y., et al. (2016). Genome size variation in the genus Avena. Genome 59, 209–220. doi: 10.1139/gen-2015-0132
Yang, Z. H. (2007). PAML 4: phylogenetic analysis by maximum likelihood. Mol. Biol. Evol. 24, 1586–1591. doi: 10.1093/molbev/msm088
Zacharias, E. H., and Baldwin, B. G. (2010). A molecular phylogeny of North American Atripliceae (Chenopodiaceae), with implications for floral and photosynthetic pathway evolution. Syst. Bot. 35, 839–857.
Keywords: Amaranthaceae, Atriplex hortensis, Hi-C, orach, orphan crop, proximity-guided assembly
Citation: Hunt SP, Jarvis DE, Larsen DJ, Mosyakin SL, Kolano BA, Jackson EW, Martin SL, Jellen EN and Maughan PJ (2020) A Chromosome-Scale Assembly of the Garden Orach (Atriplex hortensis L.) Genome Using Oxford Nanopore Sequencing. Front. Plant Sci. 11:624. doi: 10.3389/fpls.2020.00624
Received: 28 February 2020; Accepted: 22 April 2020;
Published: 25 May 2020.
Edited by:
Eric Von Wettberg, University of Vermont, United StatesReviewed by:
Namshin Kim, Korea Research Institute of Bioscience and Biotechnology (KRIBB), South KoreaShanshan Chen, Zhengzhou University, China
Copyright © 2020 Hunt, Jarvis, Larsen, Mosyakin, Kolano, Jackson, Martin, Jellen and Maughan. This is an open-access article distributed under the terms of the Creative Commons Attribution License (CC BY). The use, distribution or reproduction in other forums is permitted, provided the original author(s) and the copyright owner(s) are credited and that the original publication in this journal is cited, in accordance with accepted academic practice. No use, distribution or reproduction is permitted which does not comply with these terms.
*Correspondence: Eric N. Jellen, amVsbGVuQGJ5dS5lZHU=