 Göran I. Ågren
 Martin Weih
- 1Department of Ecology, Swedish University of Agricultural Sciences, Uppsala, Sweden
- 2Department of Crop Production Ecology, Swedish University of Agricultural Sciences, Uppsala, Sweden
A Corrigendum on
Multi-Dimensional Plant Element Stoichiometry—Looking Beyond Carbon, Nitrogen, and Phosphorus
by Ågren GI and Weih M. (2020). Front. Plant Sci. 11:23. doi: 10.3389/fpls.2020.00023
In the original article, the numerical values of the scaling exponents in the text, tables, and figures were incorrectly stated. This was due to a misinterpretation of the algorithm for calculating the scaling exponent. We provide here revised tables and figures (Figures 3, 4, 5, Tables 1, 4, 5) and changes in the text, where the value of the scaling exponent is important.
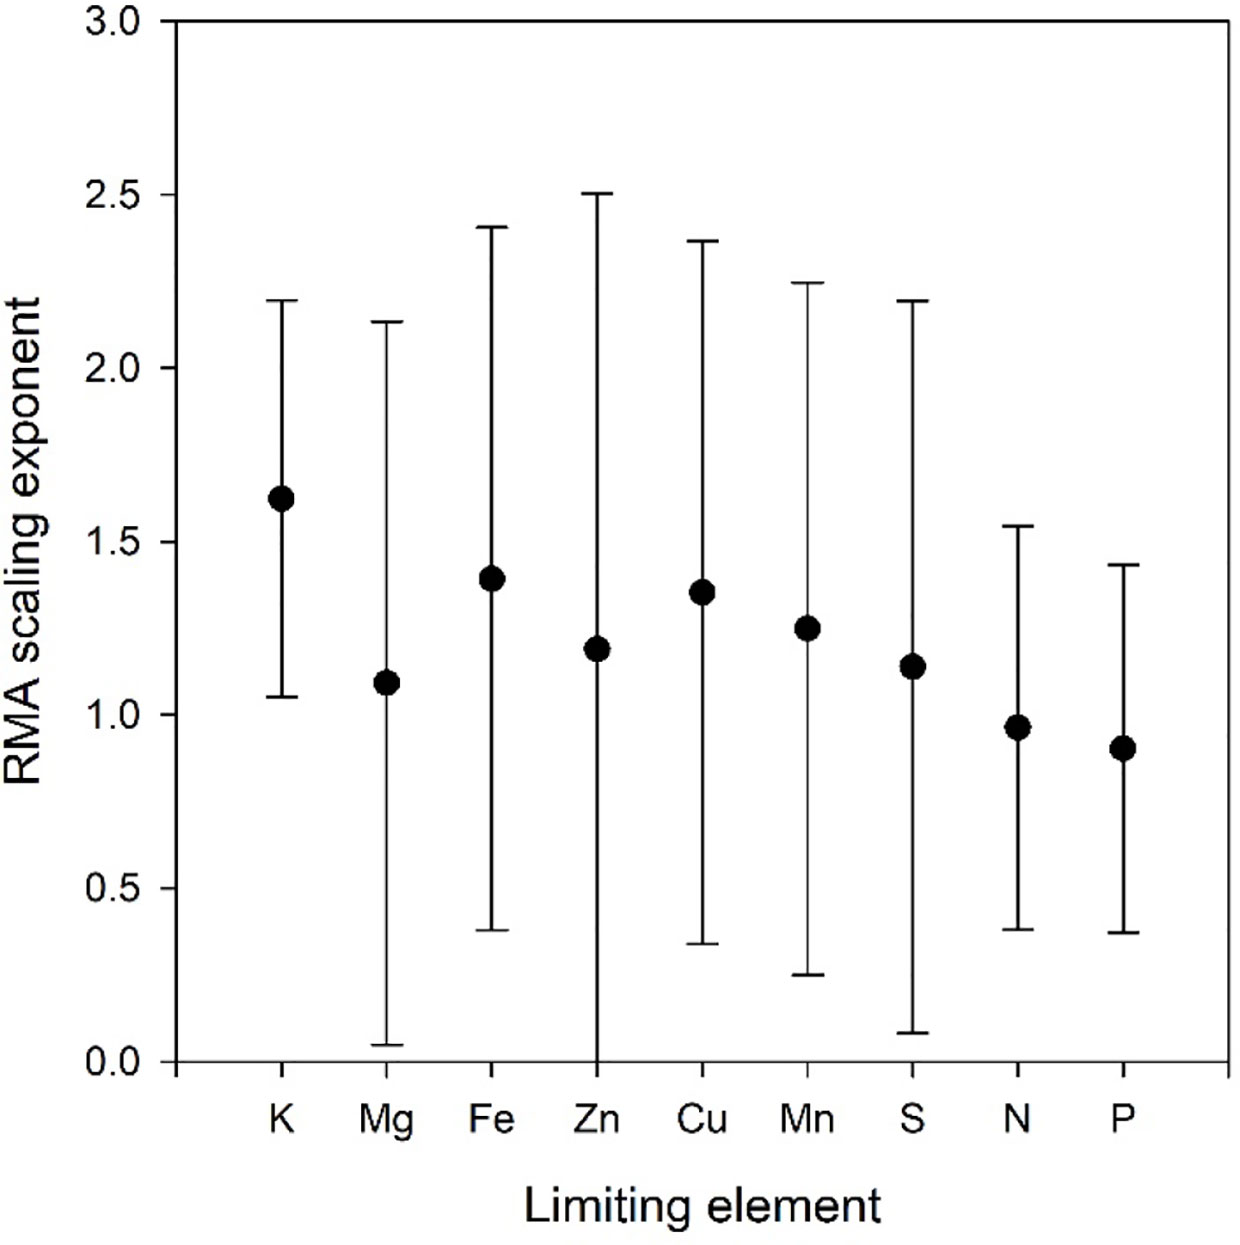
Figure 3 Scaling exponents with 95% confidence intervals as a function of limiting element in the Birch data set. All refers to the scaling exponent when data for all limiting elements are combined.
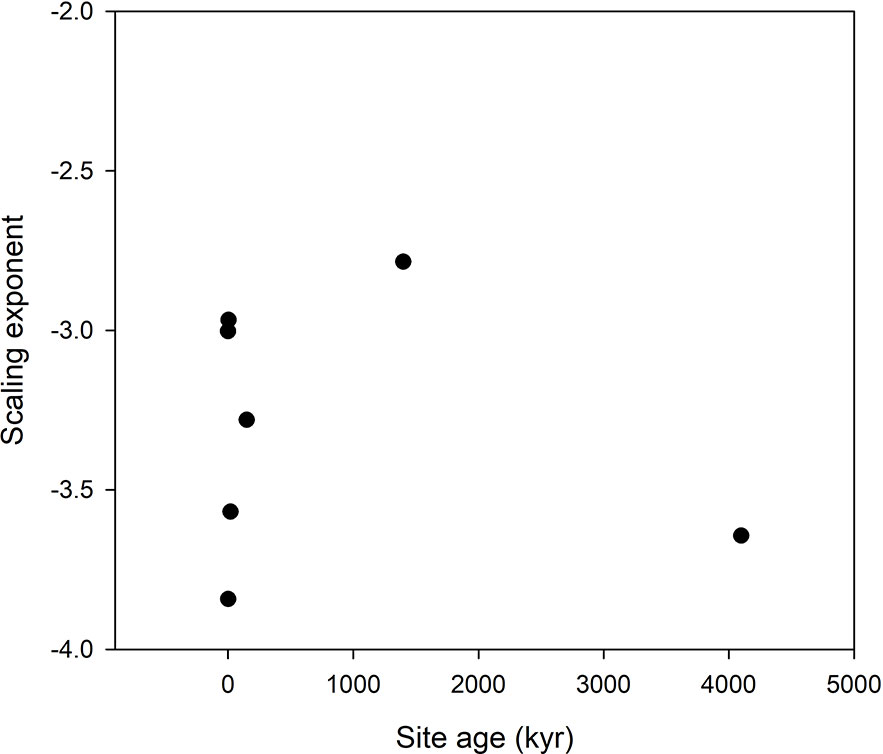
Figure 4 Scaling exponents as function of site age in the Hawaii data set. The lowest age is the value for the scaling taken over all ages.
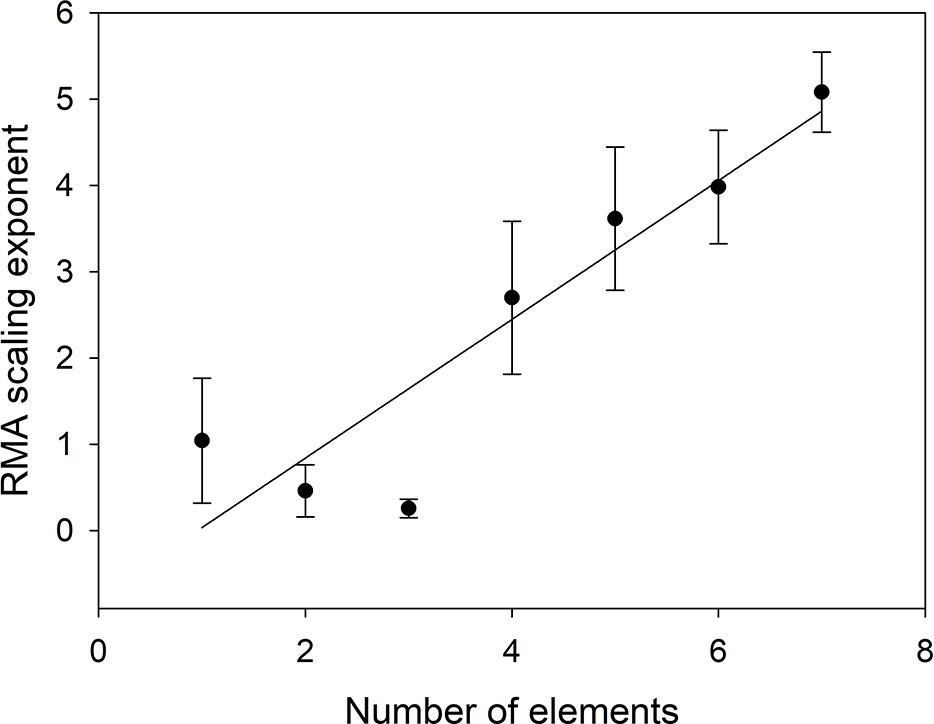
Figure 5 Scaling exponent as a function of the number of elements included in VOth. The scaling exponent for n = 1 is the average of the scaling exponents in Table 4.
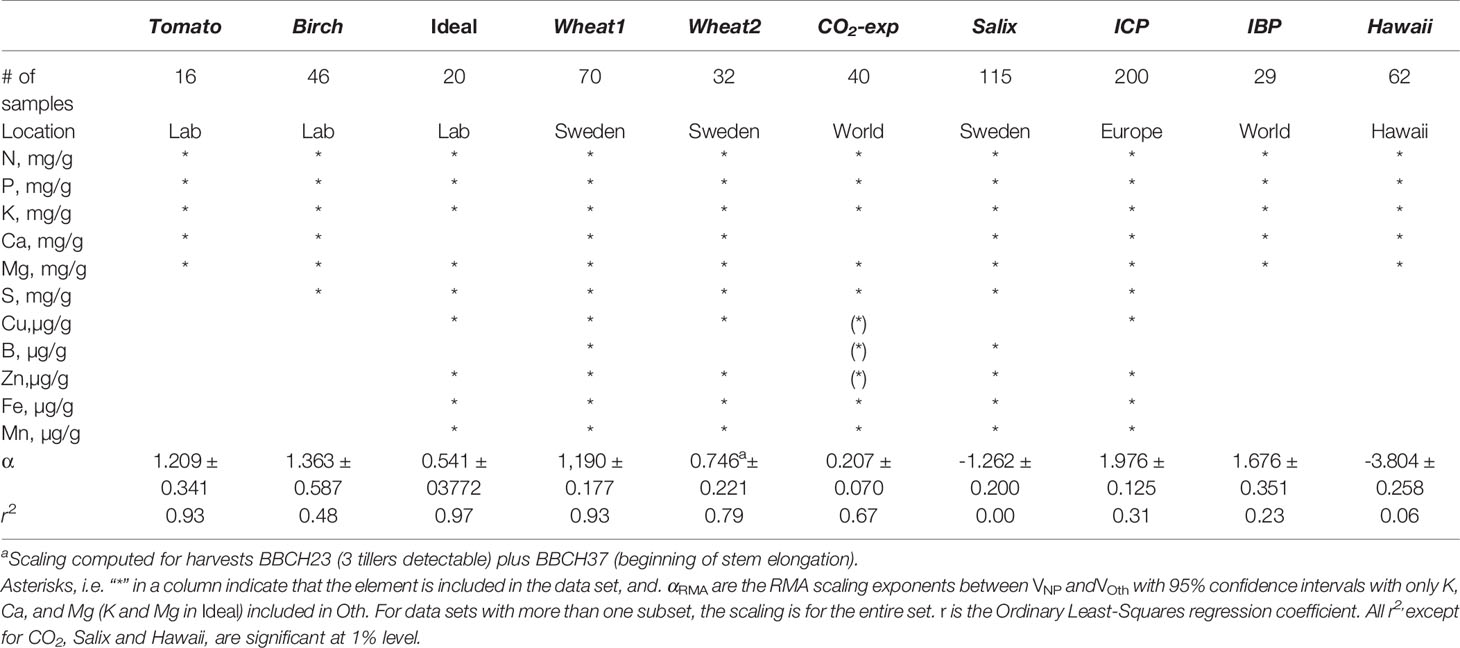
Table 1 Summary of data sets used.
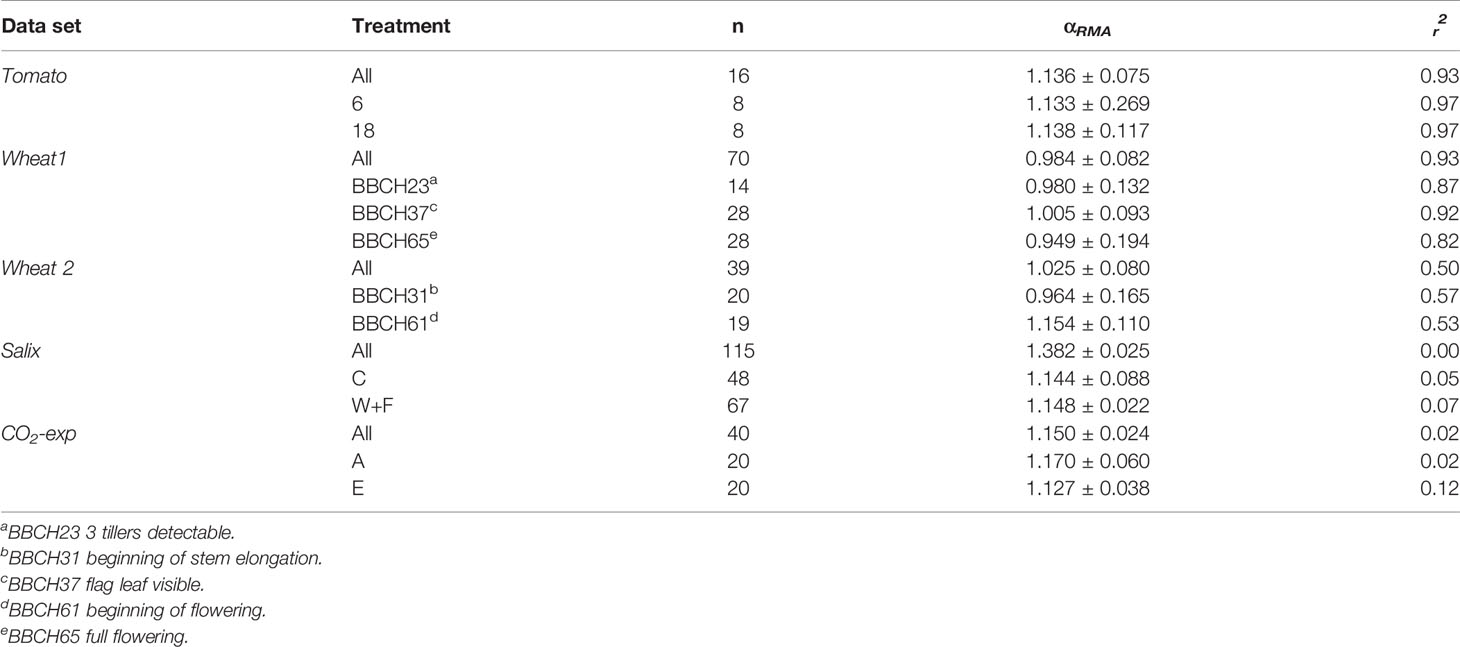
Table 4 RMA scaling exponents (αRMA) with 95% confidence intervals for regressions between ln(VNP) and ln(VOth) for data sets that can be split into subsets. For Wheat2 All refers to BBCH23 plus BBCH37. All r2, except for CO2 and Salix, are significant at 1% level.
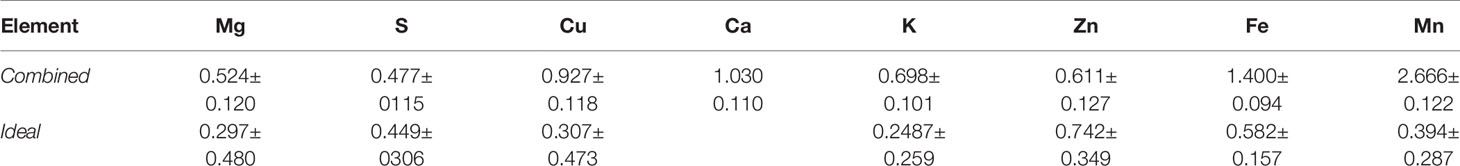
Table 5 RMA scaling exponents (αRMA) with 95% confidence intervals for regressions between ln(VNP) and one single elements calculated from the combined Wheat1 , Wheat2, plus ICP data and the Ideal data sets respectively. Note that Ca is missing in the Ideal data set.
In Abstract the text should read
We show that the scaling exponent is rather insensitive to environmental conditions or species and ranges from -3.804 to 1.976 (average 0.384) in nine out of ten data sets. For single elements, Mg has the smallest scaling exponent (0.524) and Mn the largest (2.666). In two of the ten data sets the scaling exponent is negative but positive in the other eight sets.
In Materials and Methods, sub-section Theory
“…the range cn,max – cn,opt of the response niche…” should read
“…the range cn,min – cn,opt of the response niche…”
In Results
“We note that taken over all data sets the scaling between N and P is P ∝ N1.04±0.02” should read
“…the scaling between N and P is P ∝ N0.21±0.05”
The last sentence of Results should be replaced by
Figure 5 shows that the scaling exponent increases linearly with number of elements (n) (α = -0.7687+0.8044n, r2 = 0.8449).
In Discussion (last sentence of first paragraph) the text should be replaced by
We no longer observe a trend with site age in the Hawaii data set. We have no explanation for the negative scaling exponent in this data set. On the other hand, the negative scaling exponent in the Salix data set is a result of dilution of some micronutrients caused by increased growth by heavy NP fertilization.
The authors apologize for this error and state that this does not change the scientific conclusions of the article in any way. The original article has been updated.
Keywords: ecological stoichiometry, elementome, ionome, homeostasis, mineral nutrients, plant growth, scaling, stoichiometric niche volume
Citation: Ågren GI and Weih M (2020) Corrigendum: Multi-Dimensional Plant Element Stoichiometry—Looking Beyond Carbon, Nitrogen, and Phosphorus. Front. Plant Sci. 11:915. doi: 10.3389/fpls.2020.00915
Received: 06 May 2020; Accepted: 04 June 2020;
Published: 03 July 2020.
Edited and reviewed by: Sebastian Leuzinger, Auckland University of Technology, New Zealand
Copyright © 2020 Ågren and Weih. This is an open-access article distributed under the terms of the Creative Commons Attribution License (CC BY). The use, distribution or reproduction in other forums is permitted, provided the original author(s) and the copyright owner(s) are credited and that the original publication in this journal is cited, in accordance with accepted academic practice. No use, distribution or reproduction is permitted which does not comply with these terms.
*Correspondence: Göran I. Ågren, Z29yYW4uYWdyZW5Ac2x1LnNl