Abstract
Plant stress detection is considered one of the most critical areas for the improvement of crop yield in the compelling worldwide scenario, dictated by both the climate change and the geopolitical consequences of the Covid-19 epidemics. A complicated interconnection of biotic and abiotic stressors affect plant growth, including water, salt, temperature, light exposure, nutrients availability, agrochemicals, air and soil pollutants, pests and diseases. In facing this extended panorama, the technology choice is manifold. On the one hand, quantitative methods, such as metabolomics, provide very sensitive indicators of most of the stressors, with the drawback of a disruptive approach, which prevents follow up and dynamical studies. On the other hand qualitative methods, such as fluorescence, thermography and VIS/NIR reflectance, provide a non-disruptive view of the action of the stressors in plants, even across large fields, with the drawback of a poor accuracy. When looking at the spatial scale, the effect of stress may imply modifications from DNA level (nanometers) up to cell (micrometers), full plant (millimeters to meters), and entire field (kilometers). While quantitative techniques are sensitive to the smallest scales, only qualitative approaches can be used for the larger ones. Emerging technologies from nuclear and medical physics, such as computed tomography, magnetic resonance imaging and positron emission tomography, are expected to bridge the gap of quantitative non-disruptive morphologic and functional measurements at larger scale. In this review we analyze the landscape of the different technologies nowadays available, showing the benefits of each approach in plant stress detection, with a particular focus on the gaps, which will be filled in the nearby future by the emerging nuclear physics approaches to agriculture.
1. Introduction
The world population is expected to increase up to 10.9 billion by 2050. Consequently food supply needs to be increased from 50 to 75% depending upon the region (Prosekov and Ivanova, 2018). Such scenario is even more complicated due to the global climate change and to the recent COVID-19 geopolitical problems that have been affecting the food production and importation in many parts of the world.
Global climate change has resulted in heat waves due to rising temperature, increased atmospheric CO2 level, frequent spells of drought and higher precipitations. In addition to climate change, the natural resource depletion as well as the anthropogenic activities have created serious challenges to agriculture sustainability causing lower agricultural yields, threat to the food security and food and feed safety (Miraglia et al., 2009; Pisante et al., 2012).
The already critical food security situation has been exacerbated by the restrictions of movement and trade due to the recent Covid-19 crisis. A series of social problems are also heavily affecting agriculture. On the one hand the limited availability of seasonal workers disrupted the harvesting cycles, on the other hand increasing food price is limiting food accessibility. The World Bank estimates that protectionism accounted for about 40% of the increase in the global price of wheat and 25% of the rise in maize prices.
When subjected to both biotic and abiotic stressful conditions plants respond through physiological and metabolic changes mediated by pulses of gene expression, suggesting the existence of a complex signaling network that allows plant recognizing adverse environmental conditions as well as changes in growth conditions (Kollist et al., 2019).
Therefore, it became extremely urgent to define novel technologies and methods to ensure better growth and yields of all crops. An early warning system of plant stress (i.e., before symptoms are visible in the plant) would be, indeed, the tool that helps growers on greenhouse management to increase efficiency the use of resources. Moreover such approach could constitute the base for breeding programs to select genotypes for biotic and abiotic stress adaptation and high yield in both stress and non-stress environments.
As represented in Figure 1, the effect of stressors manifests itself in a series of signs at a wide length scale, ranging from the entire cropping system down to the cellular level. Therefore a series of detection techniques has been developed to measure physiological responses to situation of stress.
Figure 1
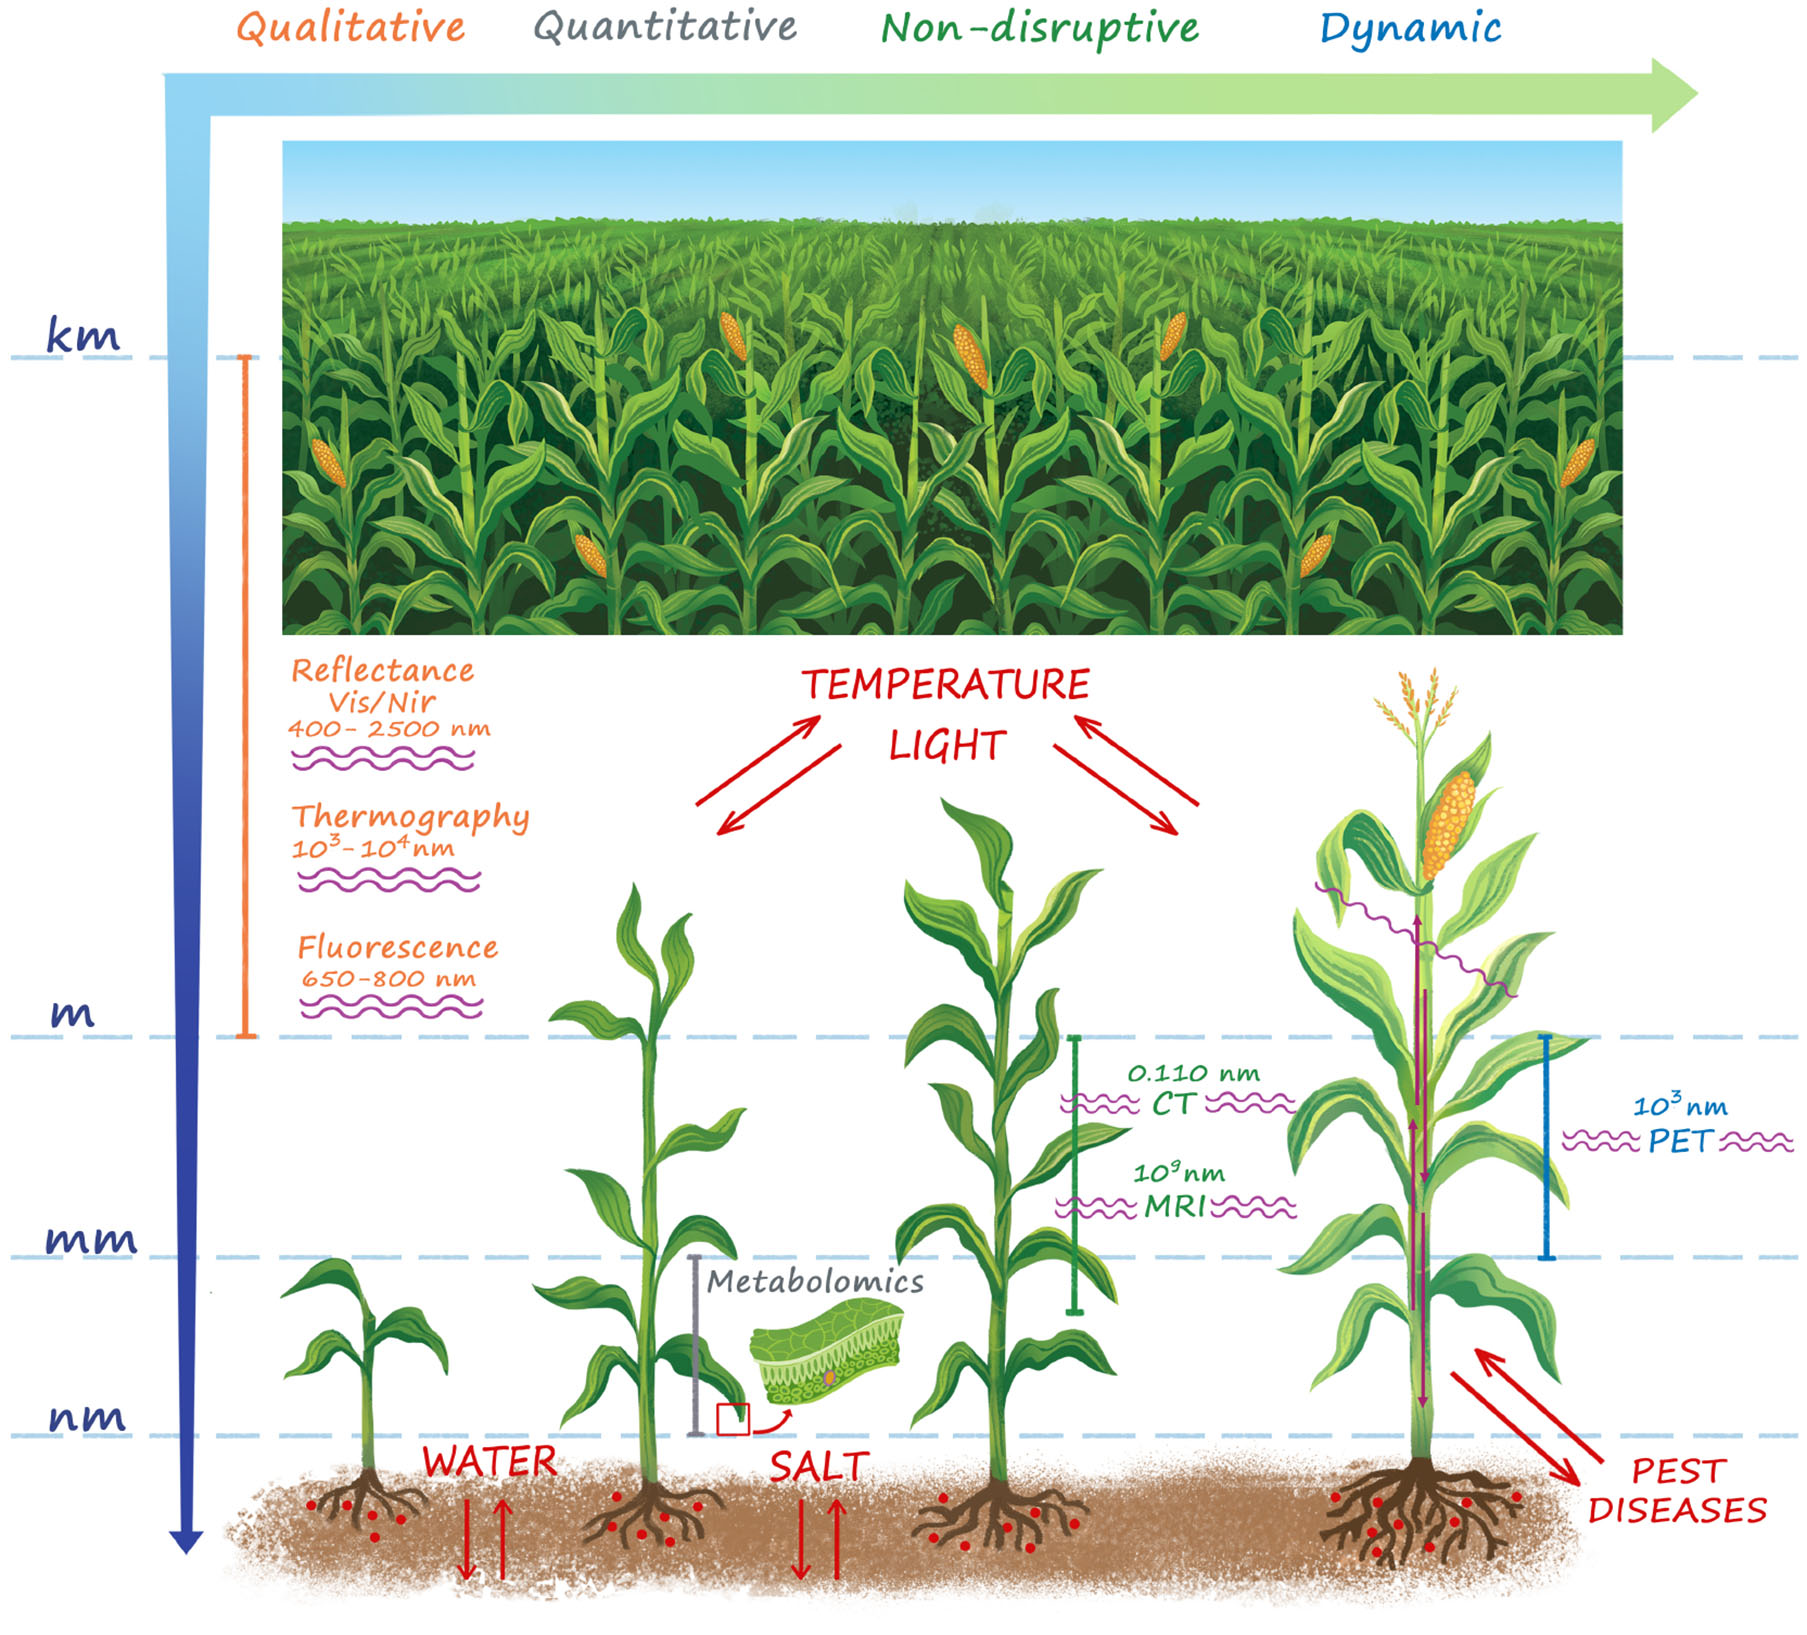
A summary of the main techniques for plant stress detection. The stressors and the wavelength used for stress detection in each technique are also shown. Stress manifests itself over a wide length scale ranging from the microscopic cellular to the macroscopic plant and field level. Whole field sensing (VIS/NIR reflectance, Thermography, Fluorescence) is naturally attractive in the agricultural practice, but provides only a qualitative information. At plant level morphological imaging techniques (CT, MRI) provide quantitative high resolution detection of structural damages induced by the stress, but cannot provide any information on the functional basis of the physiological mechanisms of reactions to both biotic and abiotic stressors at cellular level. For this purpose, metabolomics is an essential tool to enhance the results obtained with morphologic imaging techniques, but it is sample disruptive and is not able to provide timely indications to support early interventions both in open-field and controlled conditions. PET is by far the only quantitative functional imaging technique, which provides a time-dynamic non-disruptive information of the modifications of functional mechanisms and transport flows in the vascular system in response to biotic and abiotic stress.
The remote sensing approach is preferred for large area investigations, as it allows to detect the chemical or physical properties of crops from whatever distance, through the record, measure and interpretation of imagery and digital representations of energy patterns. With these methods the whole fields can be investigated during the whole crop seasons, allowing an accurate, early and reliable detection of crop stress, thanks also to highly innovative and sophisticated methods of data analysis.
However, remote sensing methods are qualitative and do not allow precision measurements. Quantitative techniques at cellular level principally relay on two different acquisition strategies [nuclear magnetic resonance (NMR) and mass spectrometry (MS)] to the Volatile organic compound-based techniques. Such laboratory methods, although often result very accurate, are sampling destructive and allow monitoring only a very limited number of plants or sections of plants. Consequently, such approach is not suitable to control, estimate and manage within-field spatial variability as well as ready detection of the changes of physiological crop responses over time.
Therefore the current frontier of stress evaluation in plant science is the establishment of novel quantitative and non-disruptive imaging techniques, both for precision morphological studies (computed tomography, magnetic resonance) and dynamic functional imaging (positron emission tomography).
In this review we present an overview of the several methods and approaches to detect the most affecting biotic and abiotic stress in agricultural crops at the different plant scales, ranging from qualitative remote sensing techniques (section 2), to sample disruptive quantitative techniques (section 3), to frontier quantitative and non-disruptive functional imaging technologies (section 4).
2. Remote Sensing Qualitative Methods for Stress Assessment
The term remote sensing can be defined as a set of techniques that allow detecting the chemical or physical properties of physical objects, from whatever distance, through the record, measure and interpretation of imagery and digital representations of energy patterns derived from non-contact sensor systems. It represents a rapid, non-destructive, method to detect both biotic and abiotic stressful conditions, utilized in precision agriculture and plant phenotyping for resistance breeding purposes.
The processes involved are mainly based on the interaction between electromagnetic radiation and plants. Since any stressful condition can induce numerous and complex physiological and biochemical responses in plants (i.e., altered stomatal conductance, pigments concentration, and biochemistry), healthy crop status could be derived from alterations observed in plant-electromagnetic radiation relationship, provided on specific spectral domains. Over the past decades, agricultural sciences relied principally on reflectance (in the visible, VIS, 0.4–0.7 μm, near-infrared, NIR, 0.7–1.3 μm and short wave-infrared, SWIR, 1.3–2.5 μm regions), thermal (in the thermal infrared, TIR 7.0–20.0 μm region) and fluorescence (at 0.68 and 0.74 μm wavelengths) sensors. These sensors, although each one with proper characteristics, can be used for applications on scales ranging from microscopic observation (i.e., laboratory spectroscopy or hyperspectral microscopy) to ground (proximal sensing, i.e., detector within 2 m from the observed object), airborne, and satellite remote sensing. Consequently, each sensor is characterized, beyond its resolution in discriminating the signal variations, by the spatial resolution, as a function of the distance between the sensor itself and the subject of the analysis. Sensors can also be classified based on their application in (i) non-imaging [i.e., VIS and infrared (IR) spectroscopy, fluorescence spectroscopy], and (i) imaging (i.e., VIS, multispectral and hyperspectral imaging, thermal imaging, fluorescence imaging, x-ray imaging) approaches. In general, non-imaging sensors could be more effectively applied on lab-scales or leaf-scales measurements, since they provide data without spatial information.
The high resolution of the currently available sensors helps in individuating the possible correlations between subtle processes at the tissue level and plant electromagnetic patterns, following stress exposure (Thomas et al., 2017, 2018). At canopy or landscape levels, the spatial resolution represents a critical factor to gather information on plant responses to stress. As an example, for the characterization of a specific disease at the field scale, proximal hyperspectral imaging is more able than hyperspectral remote sensing, thanks to higher spatial resolution (Kuska and Mahlein, 2018). Despite the potential of remote sensing for stress detection, some general considerations and weaknesses deserve to be highlighted.
Firstly, based on the reached technological advances and on the intrinsic characteristics of the applied technology, each sensing technique is characterized by its own effectiveness in stress detection and identification (see also Figure 1), that depends on (i) the kind of stressful conditions and (ii) its magnitude. Consequently, the desirable early identification of stressful conditions (i.e., before symptoms appearance) is not obvious at all. For example, in the case of water stress, the temperature-based indices (see section 2.3) provide an appropriate pre-visual detection of plant responses, while some vegetation indices derived from reflectance in the VIS/NIR domain (see section 2.2) are effective only at late plant responses (Gerhards et al., 2019).
Secondly, within the same sensing vegetation technique and stressful condition, spectral responses to stress exposure are related to plant genotype (i.e., principally due to genotype-sensitivity). This aspect may need an in-depth study of specific stress-genotype combinations, also involving the understanding of the physiological and biochemical processes, which cause changes in the spectral feature, to derive indicators or parameters for specific demands.
Thirdly, data acquisition processes should consider the environmental condition during measurements as well as plant canopy and leaf structural architecture. Improvements need to be achieved in terms of (i) data pre-processing, (ii) inclusion of calibration systems integrated on automated systems, and (iii) use of multiple sensors platforms also equipped with 3-D shape sensors (Mishra et al., 2020).
Fourthly, some plant responses, potentially detectable for stress diagnosis, may be shared among different stresses (i.e., drought, salinity, temperatures, mineral toxicity, or pathogen infection) making difficult the identification of specific stressors, especially in open-field conditions, where a multi-stress scenario can occur. It derives that, while a single sensing technique could be characterized by high specificity in the identification of individual stress signals in experimental conditions, the possible multiple causes in agricultural applications can be identified only through a holistic and integrated approach (Jones and Schofield, 2008).
All the above considerations offer a new starting point for the advancement in vegetation sensing for stress detection through the implementation of the currently available techniques, also with the introduction and strengthening of innovative imaging techniques applicable to the agricultural sector (see section 4). The review goes through a more detailed overview of remote sensing technologies applied to plant stress detection in agriculture. Considering the complexity and breadth of the covered topics, further information can be obtained by consulting the available scientific literature, to which reference is made (Gorbe and Calatayud, 2012; Murchie and Lawson, 2013; Mishra et al., 2017; Khan et al., 2018; Gerhards et al., 2019).
2.1. Fluorescence Spectroscopy
Fluorescent molecules absorb energy from a given wavelength, modify its electronic shell, and, after a short time, descend back to its natural status while emitting some of the absorbed energy in the form of an electromagnetic wave. Wavelengths of absorption and emission are specific for each compound: chlorophyll a fluorescence (ChlF) has a natural emission between 650 and 800 nm, with two maxima in the red (680 nm) and far-red (735 nm) wavelengths. Changes in the fluorescence spectra shape as well as in the ratio between the two maxima emission peaks (i.e., F685/F735) are responsive of changes in Chl content of leaves (Buschmann, 2007; Pandey et al., 2015). So, ChlF and ChlF parameters are widely applied to rapid assess any mutation of Photosystem II, following the plant exposure to both biotic and abiotic stressful conditions (Belasque et al., 2008; Pandey et al., 2015). With respect to the latter, the fluorescence in the blue-green range (400–600 nm, with two maxima in the blue—440nm and green—530 nm) is related to fungal leaf infections as it is emitted by substances (e.g., stilbenes) produced by the leaf following a fungal attack, and so providing a useful early detection tool (Casa et al., 2016). Active systems, based on laser-induced fluorescence (LIF), was applied, for example, on citrus plants to detect the citrus canker disease (caused by Xanthomonas axonopodis pv. citri) (Belasque et al., 2008) or, more recently, the Huanglongbing (caused by Candidatus Liberibacter spp.) or citrus greening (Ranulfi et al., 2016).
LIF was also successfully applied to study the effects of dimethoate on physiological and growth responses of pigeon pea plants and to measure out its application (Pandey et al., 2015). A fluorescent index was also proposed to estimate leaf nitrogen concentration in rice (Yang et al., 2019). In particular, differently to reflectance measurements (see sections 2.2 and 2.5), the signal is not affected by soil properties; so, ChlF sensors can be applied to estimate Chl content (linked to nitrogen availability) even in the early crop stages (after plant emergence or transplant) or in sparse soil coverage conditions (Casa et al., 2016).
2.2. Vis/NIR Spectroscopy
Leaf and/or canopy reflectance has been widely researched across several biotic and abiotic stressful conditions with both active and passive sensors; the former are equipped with light-emitting components while the latter depend on sunlight as a source of light. The main applications in plant health detection are based on the spectral wavelengths ranging from 400 to 2,500 nm, since reflectance in the VIS, NIR and SWIR is primarily influenced by photosynthetic pigments, cell structure and water content, respectively. These traits can in fact undergo important changes in plants growing under unfavorable conditions (Mishra et al., 2017).
Briefly, the electromagnetic radiation that runs into the leaf surface can be reflected, scattered, absorbed and transmitted at wavelengths which depend on the biochemical and physical characteristics of the leaf. In the VIS and IR regions the reflection patterns are somehow influenced by (i) the C-O, O-H, C-H and N-H covalent bonds of macromolecules (i.e., sugars, proteins, lignin, and cellulose), (ii) the amount of natural pigments containing tetrapyrroles rings, like chlorophylls (as important absorbing molecules, in the blue and in the red bands), as well as (iii) the anatomical and biochemical leaf traits (i.e., surface texture or thickness of cuticle, trichome density and architecture, shape and thickness of the palisade and spongy mesophyll).
The typical spectral assignments of a green leaves in the optical spectral ranges VIS-NIR-SWIR of the electromagnetic spectrum is reported in Figure 2. In the VIS region, there are two main absorption bands in blue (470 nm) and in red (670 nm), associated with Chla and Chlb, and a reflectance peak in the yellow-green band (550 nm). The NIR region is characterized by higher reflectance values (the typical spectrum plateau), while in the SWIR region the leaf reflectance pattern is highly dependent on the light absorbed by leaf water (near 1,450 and 1,900 nm) and on leaf dry matter (Ge et al., 2019; Gholizadeh and Kopacková, 2019).
Figure 2
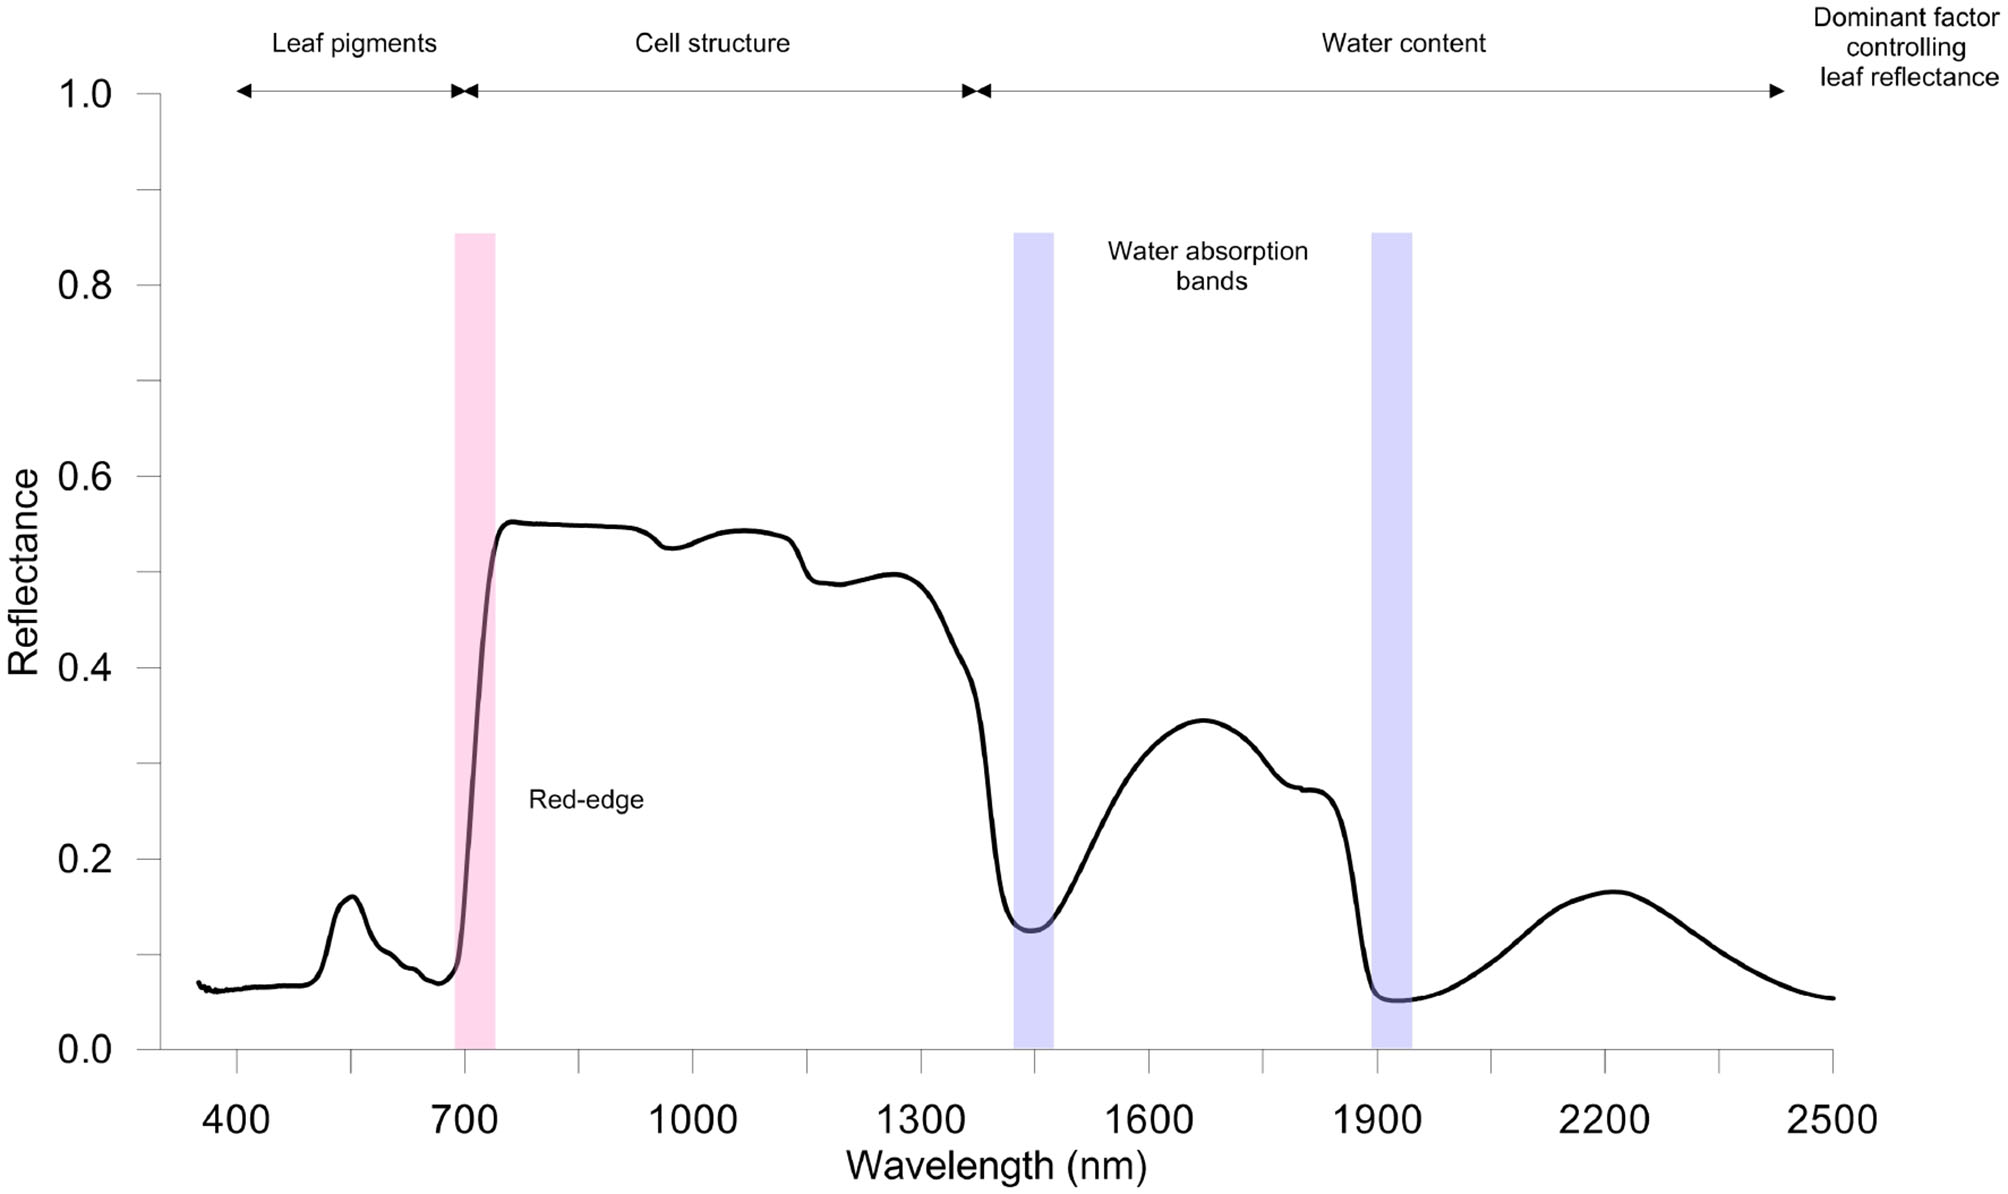
A typical healthy vegetation spectrum (350–2,500 nm); spectral reflectance signature refers to spinach leaves (author's personal and unpublished data). Measurements were taken using full-range hyperspectral ASD FieldSpec 4 Hi-Res (Analytical Spectral Devices Inc., Boulder, CO, USA) spectroradiometer equipped with a contact probe. Red-edge and water bands' absorption sections are highlighted in red and blue, respectively.
Interestingly, the position (wavelength) of the rapid increase in leaf reflectance from VIS to NIR, called red-edge (RE), is significantly affected by Chl content in leaves (Liu et al., 2019b). Thus, stressful conditions that influence the concentration of leaf pigments can be effectively identified. To this purpose, the analysis of the spectral derivative is successfully performed to highlight changes in RE (i.e., position and amplitude). For instance, a blue-shift of the RE in rice infested by rice leaf folder has been found (Huang et al., 2019).
In general, reflectance spectroscopy is used for the sensing of a wide range of stressful conditions. Some of the more recent literature on this topic concerns the assessment of the nitrogen status in crops (Stellacci et al., 2016), the macro- and micro-nutrient deficiencies (Galieni et al., 2015; Visioli et al., 2016; Rustioni, 2017; Rustioni et al., 2018), the impact of air and soil pollution (Cotrozzi et al., 2018; Gholizadeh and Kopacková, 2019), the plant disease detection (Ortiz et al., 2019; Zhang et al., 2019a), the salinity effects on crop growth and yield (El-Hendawy S. et al., 2019; El-Hendawy et al., 2019a; Boshkovski et al., 2020), the drought-induced changes in plants (Stagnari et al., 2014; Maimaitiyiming et al., 2017; Sylvain and Cecile, 2018; El-Hendawy et al., 2019b), the specific secondary metabolites accumulation in plant tissue (Couture et al., 2016) as well as the plant phenotyping (Garriga et al., 2017; Ge et al., 2019).
Nowadays, reflectance spectroscopy principally relies on technologies based on hyperspectral sensors, which consist of acquiring images in several narrow (<10 nm) and contiguous spectral bands, and allow to collect a large amount of data (Feng et al., 2018; El-Hendawy S. et al., 2019). Over years, the reflectance values measured at specific wavelengths of the VIS -NIR-SWIR domains have been combined to obtain different spectral reflectance indices (SRIs), applied in the assessment of morphological, physiological and biochemical parameters related to stress (El-Hendawy S. et al., 2019). One of the most commonly used SRI is represented by the Normalized Difference Vegetation Index (NDVI), which was observed to significantly correlate with the final yield of many crop species (El-Hendawy et al., 2019b). It is very difficult to provide a complete overview of all developed SRIs. In Table 1 are summarized some of the SRIs commonly used to estimate a range of plant characteristics indicative of various stressors exposures. Some SRIs have been formulated and validated under specific genotype-stressor combinations, see plant-disease during infection (i.e., grapevine-Flavescence Dorée, AL-Saddik et al., 2017). Although their reliability, a significant amount of information come from very narrow spectrum regions (Hansen and Schjoerring, 2003); moreover, the predictive performances of SRIs can be significantly influenced by genetic, environmental, and crop management factors (Kawamura et al., 2018). Reflectance spectrum can be also used entirely as a “fingerprint” of the plant. Due to the large datasets, different techniques, that involves multivariate statistical approaches, including the stepwise multiple linear regression analysis (SMLR) and the partial least squares regression (PLSR), were exploited (Garriga et al., 2017). SMLR is useful in defining the relationships between spectral reflectance and crop characteristics although its predictive ability can be compromised when the number of predictors (X) is higher than the number of observations (Y) (overfitting), and when several predictors are strongly correlated to each other (multicollinearity) (El-Hendawy et al., 2019b). PLSR was found to effectively relate the plant responses to spectral signatures, as in the estimation and prediction of several crop traits in viral infection causing leafroll disease in Vitis vinifera (Naidu et al., 2009), to predict photosynthetic activity among six genotypes (three transgenic and three wild type lines) of Nicotiana tabacum (Meacham-Hensold et al., 2019), and to detect the impact of tropospheric ozone on Salvia officinalis (Marchica et al., 2019).
Table 1
| Index | Formula | Estimated parameter | Reference |
|---|---|---|---|
| Photochemical Reflectance Index (PRI) | (R531 - R570)/(R531+R570) | Physiology Photosynthesis |
Peñuelas et al., 1995a |
| Normalized Difference Vegetation Index (NDVI) | (R800 - R670)/(R800 + R670) | Physiology Photosynthesis | Rouse et al., 1974 |
| Normalised Difference Red Edge (NDRE) | (R790 - R720)/(R790 + R720) | N status | Barnes et al., 2000 |
| Nitrogen Stress Index 1 (NSI-1) * | (R415/R710) | N content | Read et al., 2002 |
| Nitrogen Stress Index 2 (NSI-2) * | (R517/R413) | N content | Zhao et al., 2005 |
| Simple Ratio Index 1 (SR-1) * | (R750/R710) | Chl | Zarco-Tejada et al., 2001 |
| Simple Ratio Index 2 (SR-2) * | (R750/R550) | Chl | Gitelson and Merzlyak, 1996 |
| Simple Ratio Index 3 (SR-3) * | (R750/R700) | Chl | Gitelson and Merzlyak, 1996 |
| Green NDVI (GNDVI) | (R780 - R550)/(R780 + R550) | Chla | Gitelson et al., 1996 |
| Transformed Chlorophyll Absorption and Reflectance Index (TCARI) | 3 × ((R700 - R670) - 0.2 × (R700 - R550)) × (R700/R670) | Chl | Daughtry et al., 2000 |
| Structure Insensitive Pigment Index (SIPI) | (R800-R445)/(R800-R680) | Car/Chla | Peñuelas et al., 1995b |
| Modified Chlorophyll Absorption in Reflectance Index (MCARI) | [(R700 - R670) - 0.2 * (R700 - R550)]* (R700/R670) | Green leaf area index Chl |
Daughtry et al., 2000 |
| Soil Adjusted Vegetation Index (SAVI) | 1.5 × (R800 - R670)/(R800 + R670 + 0.5) | Green biomass | Huete, 1988 |
| Plant Senescence Reflectance Index (PSRI) | (R678 - R500)/R750 | Car/Chl Senescence |
Merzlyak et al., 1999 |
| Anthocyanin Reflectance Index (ARI) | (1/R550) - (1/R700) | Pigments | Zarco-Tejada et al., 2005 |
| Salinity and Water Stress Indices 2 (SWSI 2) | (R803 - R681) / | Water content Chlorophyll |
Hamzeh et al., 2012 |
| Salinity and Water Stress Indices 3 (SWSI 3) | (R803 - R681) / | Water content Chlorophyll |
Hamzeh et al., 2012 |
| Water Index (WI) | R900/R970 | Leaf water potential | Zarco-Tejada et al., 2003 |
| Simple Ratio Water Index (SRWI) | R860/R1240 | Leaf water potential | Zarco-Tejada et al., 2003 |
| Normalized Difference Water Index (NDWI) |
(R860 - R1240)/ (R860+ R1240) | Leaf water potential | Gao, 1996 |
| Leaf Water Index (LWI)* | (R1300/R1450) | Leaf water thickness | Seelig et al., 2008 |
| Normalized Water Indices (NWI-1) | R970 - R900/R970 + R900 | Canopy water status | Babar et al., 2006 |
| Normalized Water Indices (NWI-2) | R970 - R850/R970 + R850 | Canopy water status | Babar et al., 2006 |
| Normalized Water Indices (NWI-3) | R970 – R920/R970 + R920 | Canopy water status | Prasad et al., 2007 |
| Normalized Water Indices (NWI-4) | R970 – R880/R970 + R880 | Canopy water status | Prasad et al., 2007 |
| Normalized Photochemical Reflectance Index (PRInorm) | PRI / [RDVI × (R700/R670)] | Chlorophyll fluorescence Stomatal conductance |
Berni et al., 2009a,b |
| Copper Stress Vegetation Index (CSVI) | R550/R850 × R700/R850 | Copper content | Zhang et al., 2017 |
| New Vegetation Heavy Metal Pollution Index (VHMPI) | DCR505 - DCR640/ DCR690 -DCR730 | Copper content | Zhang C. et al., 2019 |
| Heavy Metal Cd Stress-Sensitive Spectral Index (HCSI) | (R780-R712)/R678 × (R678/R550) | Cadmium content | Wu et al., 2019 |
| Heavy Metal Stress Sensitive Index (HMSSI) | CI(Red−edge)/PSRI | Cadmium, lead and mercury contents | Zhang et al., 2018 |
Summary of some of the most commonly vegetation spectrum reflectance indices (SRIs) and the related estimated morphological or physiological traits. Traits can relate to more than one stressful condition, so the same index can detect different kinds of stress, both biotic and abiotic. Abbreviations: N, nitrogen; Chl, chlorophyll; Car, carotenoids.
No original index abbreviation found.
Other studies reported the use of the principal component analysis (PCA), spectral band intercorrelations and stepwise discriminant analysis (Ray et al., 2010). Anyway, the accuracy of the estimating proposed models depends also on the preprocessing methods which include multiplicative scattering correction, standard normal variate, normalization, PCA and others (Liu et al., 2019b).
2.3. Thermal Imaging
Thermal imaging (thermography) is one of the most used imaging techniques in agronomic and environmental sciences as well as in the agri-food industry (Costa et al., 2013). It can be successfully applied in the detection of stressful conditions thanks to the significant relationships between foliar surface temperature (Tleaf) and leaf gas exchange (CO2 and H2O fluxes regulated by stomatal closure or aperture) or stomatal conductance (gs) (Gutirrez et al., 2018). The physical laws that regulate the emission of bodies in the TIR region, as well as the atmospheric and environmental variables that condition the Tleaf-gs relationship, are well-known and well-treated topics (Jones and Schofield, 2008; Costa et al., 2013; Vialet-Chabrand and Lawson, 2019) and are beyond the scope of this review.
As an imaging technique, thermography possess the advantage to acquire geolocated data at canopy scale, overcoming the classic handheld infrared thermometers, applied at leaf or single plant scales (Crusiol et al., 2020), providing results on a whole plant basis (Poirier-Pocovi et al., 2020). TIR cameras are widely used as portable devices for both Unmanned Aerial Vehicles (UAVs) (Sagan et al., 2019) or for agricultural vehicle proximal to the ground, as an on-the-go system, or even involving machine learning (Gutirrez et al., 2018), characterized by low-cost data acquisition, easy implementation, processing and immediate response as well as higher spatial-, spectral- and temporal resolutions.
Over years, thermography has been applied in the early detection and monitoring of pests and diseases (Al-doski et al., 2016; Ahmed et al., 2019; Vidal and Pitarma, 2019; Lydia et al., 2020), even before symptoms appearance (Chaerle et al., 2009; Awad et al., 2015), despite its low applicability on a large scale. Other works have shown a relationship between higher temperature and nutrient deficiency (Costa et al., 2013).
However, its main applications is addressed toward the sensing for crop water-stress detection, for agricultural and phenotyping purposes: i.e., the setting-up of the irrigation schedules (Gutirrez et al., 2018), the identification of any anomalies in irrigation systems (Matese et al., 2018), as a part of Cloud of Things (CoT)-based automated irrigation network (Roopaei et al., 2017), as a powerful tool in plant breeding activities (Shakoor et al., 2017; Sagan et al., 2019; Siddiqui et al., 2019) and in ecological studies (Still et al., 2019). Many studies relied on thermography in both herbaceous (Mangus et al., 2016; Martynenko et al., 2016; Quebrajo et al., 2018) and arboreous (Egea et al., 2017; Espinoza et al., 2017; Santesteban et al., 2017; García-Tejero et al., 2018; Blaya-Ros et al., 2020; Gutiérrez-Gordillo et al., 2020) cropping systems. Consequently, a large variety of crop water-stress indices (CWSIs) have been developed both isolating the effect of the crop water status and normalizing the aggregated data at the canopy level (Poirier-Pocovi et al., 2020). Some combination of well-watered and dry reference crop temperatures, starting from the CWSI proposed by Idso et al. (1981) till to the most recent ones developed by Poirier-Pocovi et al. (2020), have been applied to derive the above-mentioned indices.
However, despite technology advances of detectors as well as of data processing, further efforts should be addressed toward (i) the optimization of data collection (Costa et al., 2013), (ii) the indication of a generally accepted calculations of CWSI, to determine crop-specific thresholds for irrigation scheduling, and (iii) the advancement of hyperspectral TIR remote sensing (Gerhards et al., 2019).
2.4. Fluorescence Imaging
The development of new technologies has allowed building up an image starting from the simultaneous gathering of a high number of punctual fluorescence spectroscopy signals, which are encoded with a color-value relation. Thanks to cameras it is possible to repeat the measure over time very rapidly, obtaining a comprehensive visualization of the spatial-temporal gradients of the crop. Generally, the system is composed of a UV light source for the excitation of the fluorescent molecules and a charge-coupled device (CCD) camera (Sankaran et al., 2010). In the multicolor fluorescence imaging approach, it is possible to generate a fluorescent response from four different wavelength bands: red, far-red, blue and green (690, 740, 440, and 520 nm, respectively) using a single UV light source of excitation (ranging from 340 to 360 nm).
Active ChlF sensors has been successfully applied in the detection of the early stages of infection by fungi, viruses or bacteria: see for example, zucchini plants affected by soft-rot (caused by Dickeya dadantii) and powdery mildew (caused by Podosphaera fusca) (Pérez-Bueno et al., 2016; Pineda et al., 2017). Fluorescence imaging represents also an useful tool for the investigation of stressful conditions attributable to nutrient deficiencies (Wang et al., 2018c), extreme temperatures (Dong et al., 2019; Lu and Lu, 2020), pollution (Moustakas et al., 2019), use of agrochemicals (Weber et al., 2017; Li et al., 2018) as well as drought and/or salinity (Yao et al., 2018; Sun et al., 2019). Beside active fluorescence techniques, sun induced ChlF through passive sensors deserves to be mentioned due to its various application in plant stress studies (Bandopadhyay et al., 2020).
2.5. Multi- and Hyperspectral Imaging
Spectral sensors are classified based on the resolution of the measure (i.e., the wavebands density in the measure): both multi- and hyperspectral can load data from a broader and continuous VIS/NIR band, typically from 400 to 1,000 nm, with the most advanced systems that reach the 350–2,500 nm band (Stellacci et al., 2016; Maes and Steppe, 2019). Multispectral sensors reach a spectral resolution of about 50 nm while hyperspectral sensors provide a resolution ranging between 1 and 10 nm (Mahlein, 2016; Stellacci et al., 2016). Despite this, to date multi-spectral sensors are mainly advantageous in agricultural applications due to greater availability and lower costs.
The working principle of spectral imaging sensors vary from the filter-based ones, where only the light of a specific waveband can pass through, to the push broom and whisk broom scanners that gather the full spectrum on one pixel than move to another, to the most recent snapshot sensors that, using the same mosaic principle of the common RGB (red-green-blue) camera, allows a quicker image recording, very useful in extremely variable and adverse sampling conditions (Thomas et al., 2017).
With the image-based VIS/NIR approach, thanks to the combination of spectral information with the spatial and temporal dimensions, it is possible to estimate the occurrence of stressful conditions even at landscape scale (Zhang et al., 2019a). Spaceborne, airborne and ground-based, help to monitor in real-time the water status, biomass and yield, nutrient status, disease, and pests (Xue and Su, 2017; Maes and Steppe, 2019; Zhang et al., 2019a; Caballero et al., 2020), thanks also to combined elaboration of ground-based hyperspectral collected data with hand-carried radiometers and spectroradiometers and UAVs imaging data (Zheng et al., 2018). In Table 2, an overview of the recent literature about the application of hyperspectral imaging for stress detection has been reported.
Table 2
| Plant stress | Species | Techniques | Accuracy | Reference |
|---|---|---|---|---|
| Chilling | blueberry | PLS-DA | >75% | Gao et al., 2019 |
| Salinity | wheat | Novel approach | – | Moghimi et al., 2018 |
| Drought | grapevine | PLS-DA PLS-SVM |
>97% | Zovko et al., 2019 |
| Drought | grapevine | RF (Deep learning) | 80-83% | Loggenberg et al., 2018 |
| Drought | rice | PLSR-MLR | – | Krishna et al., 2019 |
| Drought | tomato | Derived SRIs | – | Elvanidi et al., 2018 |
| Drought-Meloidogyne incognita (Nematoda) | tomato | PLS-DA PLS-SVM |
90-100% | Susič et al., 2018 |
| Insect herbivory | maize | SLDA Discriminant classification model |
79.0% | do Prado Ribeiro et al., 2018 |
| Powdery Mildew | grapevine | PLS-DA | Pérez-Roncal et al., 2020 | |
| Stripe rust | wheat | PCA BPNN |
~80% | Yao et al., 2019 |
| Fusarium head blight | wheat | Derived SRIs | – | Mahlein et al., 2019 |
| Septoria tritici | wheat | PLS-DA | 93% | Yu et al., 2018 |
| Powdery mildew | barley | SiVM Non-linear SVM |
~95% | Thomas et al., 2018 |
| Magnaporthe oryzae | barley | LDA CARS |
>98% | Zhou et al., 2019 |
| Charcoal rot | soybean | SVM | 97% | Nagasubramanian et al., 2018 |
| Sclerotinia stem rot | oilseed rape | PLS-DA SVM |
>90% | Kong et al., 2018 |
| Alternaria solani | potato | PLS-DA SVM |
92% | Van De Vijver et al., 2020 |
| Citrus canker | tangerine | RBS KNN |
94-100% | Abdulridha et al., 2019 |
| tomato spotted wilt | sweet pepper | OR-AC-GAN (Deep learning) | 96% | Wang et al., 2019d |
| N content | tea | PLS-DA LS-SVM PLSR |
>90% | Wang et al., 2020 |
| N content | apple | PLSR MLR |
77-78% | Ye et al., 2020 |
| shikimic acid concentration | transgenic maize | PLSR | 82% | Feng et al., 2018 |
| Cadmium content (model) | tomato | WT-LSSVR (Deep learning) | – | Jun et al., 2019 |
| Lead concentration (model) | lettuce | WT-SAE (Deep learning) | – | Zhou et al., 2020 |
| Dicamba | soybean | RF (Deep learning) | – | Zhang et al., 2019b |
Published claims of stress identification from hyperspectral imaging since 2018, along with the chosen multivariate data processing technique and accuracy reached. “Plant stress” refers to both (i) the classification or modeling of stressful conditions and (ii) the plant phenotyping.
BPNN, back propagation neural network; CARS, competitive adaptive reweighted sampling; FNN fully-connected neural network; KNN, K nearest neighbor; LDA, linear discriminant analysis; LS-SVM, least squares-support vector machines; MLR, multiple linear regression; OR-AC-GAN outlier removal auxiliary classifier generative adversarial nets; PCA, principal component analysis; PLS-DA partial least squares-discriminant analysis; PLS-SVM, partial least squares-support vector machine; PLSR, partial least-squares regression model; RBF, radial basis function; RF random forest; SiVM, simplex volume maximization; SLDA, stepwise linear discriminant analysis; SRIs, spectrum reflectance indices; SVM, support vector machine; WT-LSSVR wavelet transform and least-square support vector machine regression; WT-SAE wave-let transform and stacked auto-encoders.
It is worth to highlight that the robustness of the estimation models built from spectral imaging datasets is greatly affected by the technical characteristics of the sensors, by environmental factors such as temperature, humidity and wind, by the camera settings (i.e., compression, stabilization, aperture, shutter speed), and even by data preprocessing and processing techniques (Barbedo, 2019; Liu et al., 2019a).
3. Disruptive Quantitative Precision Methods for Stress Assessment
3.1. Molecular Methods
In the last decades, several molecular techniques have been developed for the detection of plant stress. The most commonly used are polymerase chain reaction (PCR and real-time PCR) and enzyme-linked immunosorbent assay (ELISA); other techniques, mainly applied for disease detection, include immunoflourescence imaging (Gautam et al., 2020), flow cytometry (Chitarra and Bulk, 2003), fluorescence in situ hybridization (FISH; Farber et al., 2019), and DNA microarrays.
PCR screens complementary DNAs (cDNAs/cDNA) and characterizes tissue-, organ- or development-specific cDNAs. It allows identifying differentially induced or expressed genes and represents a reliable and widely used method to reveal genes and molecular mechanism which response to abiotic stress in different plant species. It has been reported (Liu and Baird, 2003) that the genes corresponding to 13 out of 17 cDNAs clones isolated from sunflower were confirmed to be expressed differentially in response to osmotic stress by quantitative reverse-transcription PCR (RT-PCR). Suitable reference genes have also been reported in cultivated rice (Pabuayon et al., 2016), rapeseed (Machado et al., 2015), potato (Tang et al., 2017) and ornamental plant species (Carex rigescens; Zhang K. et al., 2019). Real-time PCR platforms have also been used for rapid diagnosis of plant diseases (Campos et al., 2019; Liu et al., 2019a).
ELISA-based biotic stress detection consists in the production of a specific antibody for a protein (antigen), associated with a plant disease, and is used for the detection of the biotic stress-causing microorganism inside an extracted probe from the plant tissue. The sensitivity of ELISA varies depending on the organism species (relatively low for bacteria, higher for fungi), sample freshness and titre (Martinelli et al., 2015). The main disadvantages of molecular-based approaches rely on time-consuming and labor-intensive domains. These shortcomings clash with the need of a rapid screening and detection and monitoring of stress and can be overcome through the use of detection techniques able to estimate the presence of any limiting conditions on a plant-response basis (sections 2 and 4).
3.2. Metabolomics
Metabolomics, defined as comprehensive and quantitative analysis of all small molecules in a biological system (Fiehn, 2001), is widely shared in studies regarding plant physiology and biochemistry as it allows the comprehension of the regulation of metabolic networks (Obata and Fernie, 2012). Plants rely on specific survival strategies to react to stress. Frequently their response leads to the synthesis of primary and secondary metabolites (Stagnari et al., 2016), which are involved, for example, in the regulation of osmotic pressure within cells, cell signaling, membrane formation and scaffolding, whole-plant resource allocation, prevention from cell oxidation, deterrence from herbivores as well as prevention from infection and growth of pathogenic microorganisms (Dawid and Hille, 2018). Consequently, an adjustment of the metabolic pathways, aimed at achieving a new state of homeostasis (referred as acclimation) occur (Suzuki and Mittler, 2006).
The research conducted in the metabolomics field relays principally on two different acquisition strategies: nuclear magnetic resonance (NMR) and mass spectrometry (MS)—gas chromatography/liquid chromatography-mass spectrometry (GC/LC-MS) (Piasecka et al., 2019). NMR allows to elucidate the structure of metabolites and the biomolecular composition of plant extracts (Fernie et al., 2004). GC is the most developed analytical platform for plant metabolite profiling and represents one of the first high-throughput approaches applied (Roessner et al., 2001). When coupled to MS, it allows profiling non-targeted metabolites, both thermally stable non-polar ones and derivatized polar one. This technique has lower efficiency for molecular compounds with molecular weight larger than 1 kDa.
Time-of-flight (TOF)-MS has become the method of choice thanks to its fast scan times. The crucial advantages of this technology are his stable protocols for machine setup and maintenance, and the chromatogram evaluation and interpretation. LC-based methods have the advantage, over GC-MS, to detect thermolabile, polar metabolites, and high-molecular weight compounds without any derivatization. Moreover, higher resolution and sensitivity have been achieved with the development of ultraperformance liquid chromatography (UPLC) (Rogachev and Aharoni, 2012). Nowadays, the progresses in analytical instrumentation and the application of bioinformatic procedures have improved the measurements of a higher number of plant metabolites as well as the correlation of metabolome data with those from other omics levels (i.e., transcriptome and/or genome). This allows the assessment of metabolic changes and the elucidation of the involved metabolic pathways (Parihar et al., 2019), although the analytical sensitivity and resolution needed for the simultaneous separation and detection of the metabolites found in plants, are still far to be achieved.
Several metabolomic studies have revealed that many metabolic pathways are regulated under stress (i.e., drought, salinity, heat and chilling, nutrient deficiency, light, heavy metals, ozone - alone or in combination). Since many of these studies have been previously reviewed (Obata and Fernie, 2012; Arbona et al., 2013; Li et al., 2019), we will consider only the most recent literature on this topic. Photosynthesis regulation and osmolytes accumulation have been widely reported under water stress conditions. Proline, tryptophan, L-arginine, L-histidine, L-isoleucine increased in the tolerant line after water stress induction while choline, phenylalanine, guanine, aspartic acid, and alpha-ketoglutaric decreased in the case of chickpea; however, the effect of variety (and sensitivity to drought) could have affected the accumulation of some of them after a long-term exposition to stressful conditions (Khan et al., 2019). Proline and arginine accumulations were also observed in drought-tolerant sesame genotype, besides an increase of abscisic acid, lysine, aromatic and branched chain amino acids, 4-aminobutanoic acid, saccharopine, 2-aminoadipate, and allantoin). Metabolomics—also in combination with other-omics—can explain the drought-tolerance mechanism in drought-tolerant wild and/or ancestral genotypes, providing useful information for breeding purposes, as wild soybean (Glycine soja) (Wang et al., 2019a) and Brachypodium distachyon (Lenk et al., 2019), among others, as well as the salt-tolerant mechanisms of the halophyte for food or pharmaceutical purposes (Chen et al., 2019).
The effect of extreme temperatures (beyond the maximum and minimum cardinal temperatures) on plants metabolomics responses is rather relevant (Guy et al., 2008). Cold stress—which is one of the most damaging abiotic stresses—can alter significantly transcriptome and plant metabolism due to the direct inhibition of metabolic enzymes and to the reprogrammed gene expression (Chinnusamy et al., 2007). As consequence, the observed growth reduction reduces the capacity for energy utilization, with a consequent inhibition of photosynthesis and production of reactive oxygen species (ROS) (Arbona et al., 2013). Phenolics accumulation significantly increases in the cell wall as well as amino acids, hormones and simple carbohydrate levels, while starch content decreases (Moura et al., 2010; Rastogi et al., 2019). In wheat, the abundance of several simple carbohydrates, i.e., raffinose, trehalose, maltotetraose, mannose, and fructose follows cold acclimation (Zhao et al., 2019), with a preeminent role played by proline-synthesis pathway, ABA and jasmonic acid (JA) signal transduction pathways. In the freezing tolerant potato genotypes the accumulation of putrescine via the expression of the arginine decarboxylase gene, represents an important response to cold stress (Kou et al., 2018).
The metabolic regulation under heat shock has similarities with that regarding low temperature case (Guy et al., 2008). In recent years, metabolism reprogramming under heat stress has been extensively studied in several agricultural crops, i.e., wheat (Thomason et al., 2018; Wang et al., 2018a,c) and soybeans (Das et al., 2017), among others. Tomato microspore of pollen after 2 h of heat stress increased significantly the total abundance of flavonoids (Paupiére, 2017); pepper plants coped with heat stress inducing the accumulation of osmotic adjusting materials such as total soluble sugars, proline and total protein as well as flavonoids (isorhamnetin-3-O-neohesperidoside, daidzein, 7-O-methyleriodicty-ol, tulipanin) (Wang et al., 2019b). Heat-stress was often studied in combination with other environmental stressful conditions, such as elevated CO2, reproducing the climate change scenario, as for maize (Qu et al., 2018a) and soybeans, among others.
Heavy metal toxicity hampers the metabolic pathways, reduces the photosynthesis, respiration or transpiration (Feng et al., 2020) and contributes to generate ROS or non-free radical species (i.e., singlet oxygen and hydrogen peroxide) and cytotoxic compounds such as methylglyoxal causing oxidative stress (Parihar et al., 2019). Plants normally react to heavy metals toxicity by significantly increasing proline and histidine levels (Khalid et al., 2019) as well as alanine, β-alanine, serine, putrescine, sucrose, γ-amino butyric acid, raffinose, and trehalose contents (Sun et al., 2010).
Regarding biotic stress, several metabolites have been identified as metabolic biomarkers in plant species (Li et al., 2019; Castro-Moretti et al., 2020)—also including the volatile organic compounds (VOCs) (i.e., isoprene, methanol, phytohormone ethylene, and some monoterpenes, terpene, methyl jasmonate, methyl salicylate) (Ninkovic et al., 2019). In tomato bacterially infected plants, the level of amino acids, organic acids, rutin, and phenylpropanoids increased, while viroid infection seems to alter only glucose and malic acid biosynthesis (López-Gresa et al., 2010). In rice, 16 fatty acids (unsaturated linoleic acid) together with two amino acids (glutamine and phenylalanine) were identified as resistance markers (Agarrwal et al., 2014). Metabolomic analysis of barley, rice and purple false brome grass, revealed a significant accumulation in the non-polymerized lignin precursors during infection by Magnaporthe oryzae (Parker et al., 2009). In addition, among secondary metabolites, phytoalexins and phytoanticipins are biosynthesized in response or advance to pathogen perception (Schlaeppi et al., 2010).
Among the various “omics” technologies (genomics, transcriptomics, proteomics, metabolomics, and phenomics), metabolomic can be considered one of the most suitable approach for the identification of phenotypic, genetic, and biochemical changes involved in plant plasticity responses to environmental stress conditions (Pandian et al., 2020). However, it has a strong point of weakness due to the influence of developmental stage and growth factors in the metabolic responses among tissues and cells, which could compromise the detection of secondary metabolites of complicated structure, potentially involved in stress responses (Gokce et al., 2020). As a matter of facts, the complete comprehension of the complexity of plant' stress response and tolerance, can be achieved integrating data from the “omics” sciences into systems biology approaches (Gokce et al., 2020). The obtained reliable metabolite quantitative locus (mQTL) data from metabolomic, can be effectively combined with phenotypic data, obtained using high-throughput technologies, so also integrates the G × E (Genotype × Environment) interaction, and providing insights of metabolic adaptation to the environment, crucial in targeted breeding programs. However, it is essential to specify that physiological, biochemical and molecular mechanisms involved in stress tolerance can be complementary but not equal among tissues and organs so that the novel breeding strategies can be based on targeting specific tissues or organs (Vives-Peris et al., 2020). Various high-throughput phenotyping technologies, employed in the phenomics of plant above-ground organs, have been developed over the last years (see section 2). On the other hand, high-throughput phenotyping of below-ground organs is still little explored and could advantage from non-destructive 3D technologies, including the tomographic and dynamic phenotyping technologies described in the next sections (Qu et al., 2016; Yoshino et al., 2019).
4. Positron Emission Tomography: An Emerging Non-disruptive Quantitative Functional Imaging Technique for Stress Diagnosis
4.1. Morphological Plant Imaging Techniques
The frontier of plant stress diagnosis is represented by non-disruptive and non-invasive methods, the most of which have been originally developed for quantitative precision medical imaging. Here it is needed to make a distinction between morphological and functional imaging.
Morphological imaging consists of visualizing in a non-invasive way the internal structures of the plant with a resolution of few hundreds micrometers. X-rays (i.e., electromagnetic radiation in the wavelength range 0.01–10 nm) have the distinct advantage to penetrate through several objects and are particularly suited to this purpose. The x-ray studies in the food and agricultural sectors generally apply low-energetic x-rays (up to 10 keV energy level, 10–0.10 nm wavelength). Moreover, x-ray computed tomography (CT) represents a powerful strategy for the internal quality evaluation (Kotwaliwale et al., 2014). CT provides in fact non-disruptively a 3-dimensional measurement of the attenuation coefficient of the tissues of the plants. We show an example of the 3-dimensional view and the transverse and longitudinal profiles of μ(x, y, z) in the leaf of Epipremnum Aureum in Figures 3A–C, respectively. We report the distribution of the value of μ(x, y, z) expressed in Hounsfield units (HU) across the entire leaf in Figure 3D. It is possible to distinguish two regions. In the first one μ(x, y, z) is in the range between −550 and 0 HU. By visualizing only the region of the leaf with μ(x, y, z) in this range (Figure 3E), we identify the vascular system. The second one has μ(x, y, z) in the range between −550 and −800 HU and corresponds to the mesophyll (Figure 3F). They have been applied, for example, to identify fungal infections in wheat (Narvankar et al., 2009) and pest injuries by cowpea weevil in soybean (Chelladurai et al., 2014). Under both laboratory and field conditions, x-ray fluorescence can be used to determine the elemental spatial distribution in plant organs, also in response to environmental stress (Mathanker et al., 2013; Fittschen et al., 2017).
Figure 3
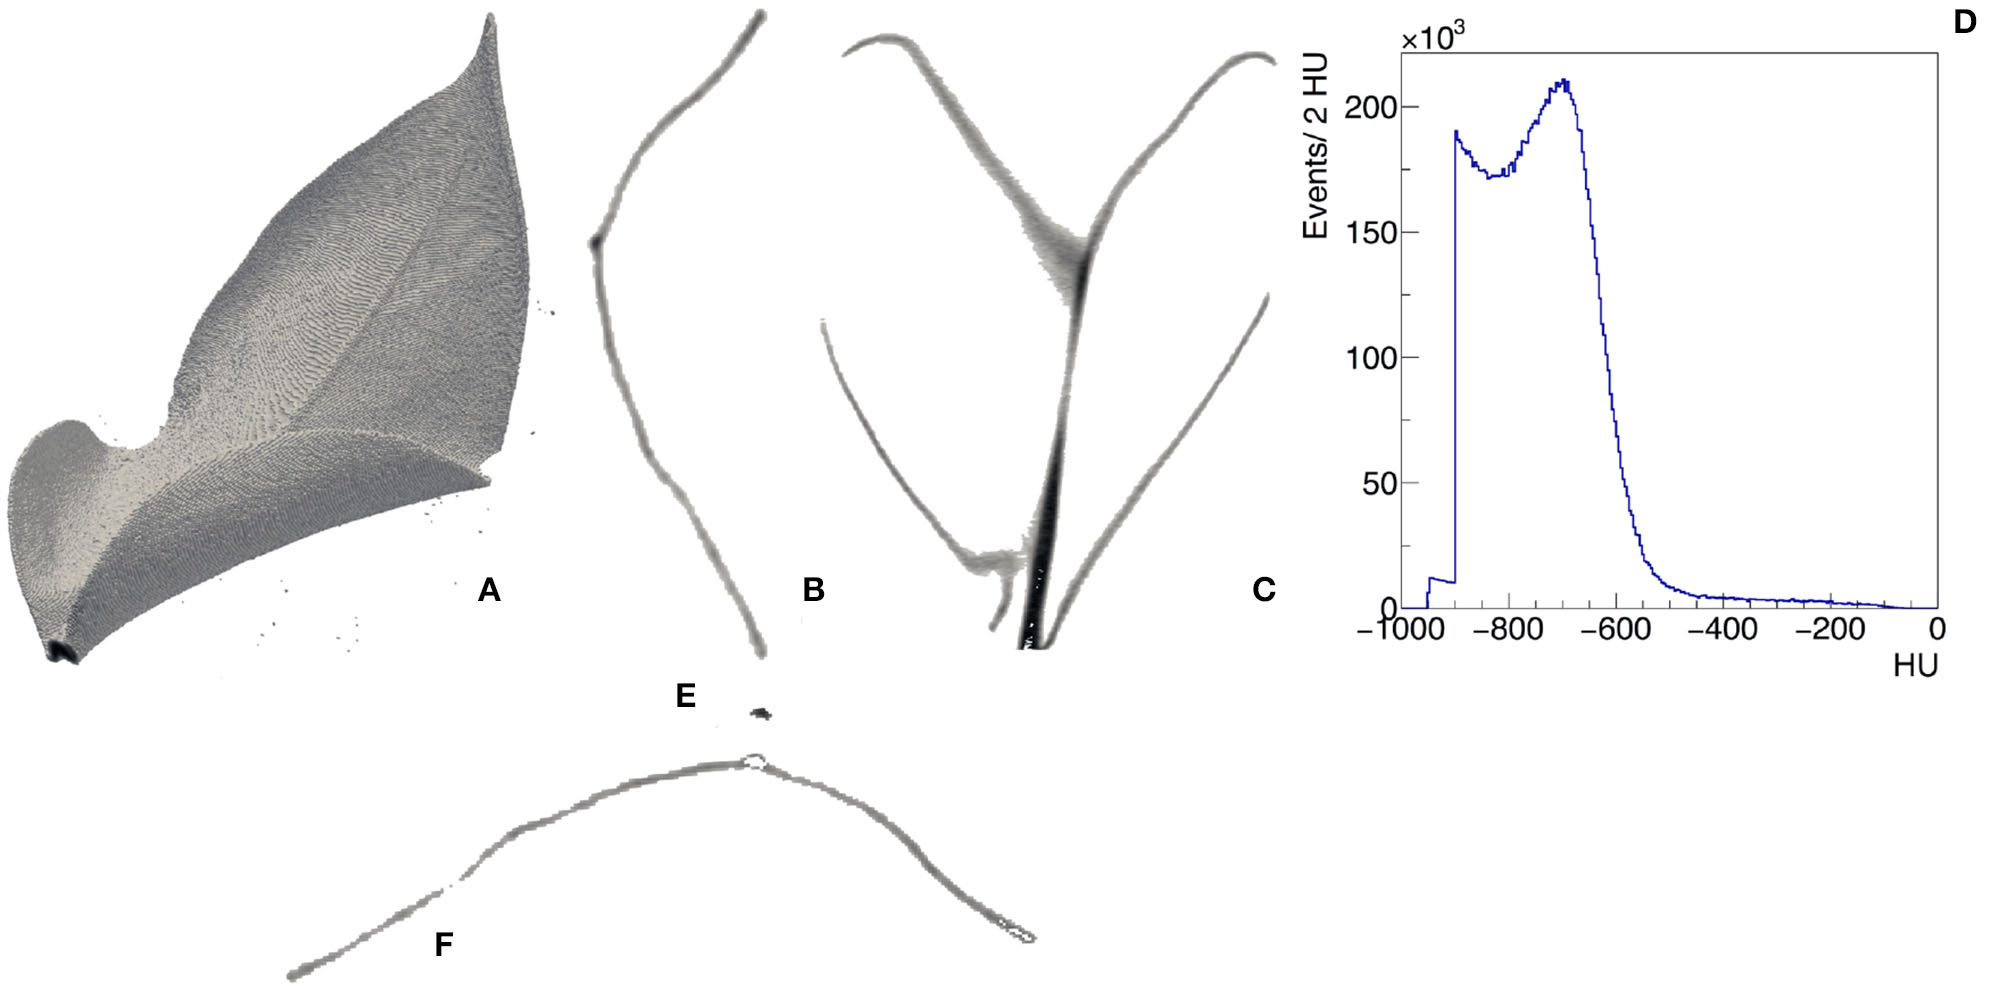
Example of CT of a leaf of Epipremnum Aureum. 3D view (A), transverse (B), and longitudinal (C) slices with visible midrib and veins, distribution of the CT values in the leaf expressed in Hounsfield units (D). Two regions can be identified from the analysis of the CT values: −550 <HU< −50 identifies the vascular system (E) and −800 <HU< −550 identifies the mesophyll (F).
Similarly, magnetic resonance imaging (MRI) is an application of NMR, firstly developed for medical purposes. Since MRI necessitates of large electro-magnets (commonly between 0.2 and 7.0 T), it cannot operate directly in the field. The magnetic interaction between the nuclei and the magnetic field results in a resonant absorption of certain frequencies, characterizing elements with a non-zero magnetic momentum nucleus (1 H, 13 C, 14 N, 15 N, and 31 P) and their bounds. The signals intercepted by the detectors are elaborated by computing systems into a tridimensional image. In addition to food quality control (Chen et al., 2013; Ebrahimnejad et al., 2018), MRI was applied in plant stress detection (water and biotic stress) (Goodman et al., 1992; Sorin et al., 2018). Recently MRI has been used to identify a reduction in xylem flux related to dehydration sensitivity in potatoes (Aliche et al., 2020).
Although high-resolution structural imaging plays an essential role in the investigation of plants, the need of additional information is essential to properly characterize plant stress. Therefore lower resolution imaging techniques have been developed with the aim of a multimodal approach. THz imaging systems and ultrasound imaging are emerging examples of such approach. THz imaging refers to a band of electromagnetic waves ranging from 0.1 to 10 THz (3,000–30 μm), between the microwave and infrared regions, where the vibration and rotation frequencies of the most polar and many organic molecules occur (Martinelli et al., 2015; Qu et al., 2018b; Nie et al., 2019). In the last years sources and detectors for THz region have been developed leading to the definition of specific THz spectroscopy (such as THz time-domain spectroscopy, THz-TDS) and imaging techniques (Qu et al., 2018b; Wang et al., 2018c). Nowadays, these techniques are principally used to detect the leaf water content (Nie et al., 2017; Song et al., 2018; Zahid et al., 2019; Li et al., 2020). Other applications include agrochemicals detection in plant tissues and/or plant derived foods (Lee et al., 2016; Qin et al., 2018; Nie et al., 2019), seed inspection and soil analysis (Wang et al., 2018b) as well as the determination of spatial distribution feature of the leaf constituent contents (Wang et al., 2019c). Ultrasound imaging—which implies mechanical waves at frequencies above 20 kHz, has also been applied to plant imaging (Chen et al., 2013). It is based on the principle that ultrasound velocity is related to the material property or changes in material characteristics; it finds wide application for food-quality and safety assessment (Chen et al., 2013). Non-contact resonant ultrasound spectroscopy (NC-RUS) allows determining surface mass, thickness and elastic modulus of the leaves very rapidly, in-vivo and contactless (Álvarez Arenas et al., 2016; Fariñas et al., 2019). It has been also proposed the use of air-coupled and wide-band ultrasound pulses (150–900 kHz) to continuously monitoring leaf properties modifications in response to environmental stimuli (Fariñas et al., 2014).
4.2. Plant Positron Emission Tomography
The paradigm of morphological imaging techniques is that they are able to detect non-invasively the microscopic structural damages induced by plants stress, but sample disruptive molecular methods (see section 3.1) and metabolomics (see section 3.2) are needed in order to establish a functional relationship between alterations of the molecular processes at cellular level and of plant structures at system level.
Plant Positron Emission Tomography (Plant PET) is filling this gap in plant science, by providing a non-disruptive technique for the 3-dimensional quantitative and dynamic functional imaging of plants under biotic and abiotic stress. As mentioned in section 3.2, a large number of metabolites of interest have been identified for the quantitative evaluation of plant stress. Chemical compounds exist, which have the property to bind specifically to metabolites. In PET one of the atoms of the compounds is substituted with a β+-decaying radio-nuclide, without modifying its chemical property. The emitted positrons annihilate with the electrons in the plant tissues, providing a clear external signal made of two almost collinear 511 keV gamma-rays. The collinearity angle has a variation of 0.0015 degrees, due to kinetic energy of the annihilating positron.
D-Glucose (C6H12O6) is the main constituent of plant biomass and can be considered here as a prototypical example of plant metabolite. It is produced through the photosyntesis reaction Ephot + 6CO2 + 12H2O → C6H12O6 + 6O2 + 6H2O, initiated with the energy of optical photons Ephot. Here both H2O and CO2 can be used as ligands to this process. The former may lead to a radioactive tracer [O15] − H2O, where the stable 16O nucleus is substituted with the radionucleus 15O, undergoing the decay within a half-life of 2.04 min, where e+ is a positron and an anti-neutrino of electron type. The latter may lead to a radioactive tracer [C11] − CO2, where the stable 12C nucleus is substituted with the radionucleus 11C, undergoing the decay within a half life of 20.34 min. However, while [O15] − H2O can be associated also to transport and is not specifically binding only to glucose (Ohya et al., 2008), the involvement of [C11] − CO2 in the photosynthetic reaction brings to the production of [11C] − C6H12O6, which is univocally therefore tracked within the plant. [C11] − CO2 can be therefore considered a specific tracer for glucose (Minchin and Thorpe, 2003).
D-Fluorodeoxyglucose (2-[18F]FDG) is an alternative, and still poorly understood, tracer for the study of glucose metabolism in plants (Kumei et al., 1997). With respect to 11C and 15O, 18F undergoes the decay within a much longer half life of 109.8 min and is therefore suited to the measurement of the dynamics of metabolic processes during a longer observation time window. As D-Glucose, 2-[18F]FDG is taken up by plant cells and phosphorylated by exhokinase to FDG-6-PO4. Unlike glucose-6PO4, FDG-6-PO4 is not further metabolized in the glycolytic pathway and accumulates. The concentration of FDG-6-PO4 is therefore proportional to the glucose metabolism in the plant cell. Besides FDG-6-PO4, F-gluconic acid, F-maltose, and UDP-FDG have also been observed as metabolic products of 2-[18F]FDG (Fatangare et al., 2015). While [C11]−CO2 is absorbed by the plant in gaseous form, following a conventional assimilation pathway, 2-[18F]FDG is provided in liquid form and more kinetic modeling is needed for the discrimination between water transport and glucose accumulation.
Functional imaging of plants poses very demanding challenges to PET technologies (Converse et al., 2013). The vascular system of plants is in fact composed of two nested micro-tubular sub-millimetric structures for water flow and nutrients transportation, namely the xylem and the phloem. A quantitative measurement of the impairments in the dynamics of the flows within the vascular system induced by stress needs therefore a sub-millimetric spatial resolution. Moreover, plants need to be imaged vertically, along their entire size at the same time. The growth of the plant should be followed from sprouting to germination to the final evolutional stages. Therefore a vertical system, longitudinally elongated, compact and shape adaptable is needed.
The intrinsic physical limit of PET is represented by the range of positrons before annihilation and the acollinearity of the produced 511 keV γ-rays. Positrons emitted by 11C and 18F have, respectively, an average range (FWHM) of 0.92 and 0.54 mm. The acollinearity results in an additional intrinsic blurring of the spatial resolution of 0.0044 × R, where R is the radius of the PET system. For instance, the intrinsic spatial resolution of a PET system with a 15 cm long radius ranges between 0.85 and 1.1 mm. The parallax problem affecting compact and longitudinally elongated PET systems needed for plants represents a limitation to achieve such spatial resolution.
Plant PET signals are very weak. Emitted positrons in fact are energetic enough to escape before annihilating in the thin and soft plant tissues. An example of the physical process is shown in Figure 4A, where two β+ decays of the 18F radio-nucleus in a leaf of Epipremnum Aureum are visible. The emitted positrons, represented as the blue tracks, do not annihilate with the electrons in the thin and soft material composing the leaf but are energetic enough to escape. The 3-dimensional view of the annihilation probability is shown in Figure 4B. It depends on the thickness and composition of the leaf, reaching approximately 20% in the mesophyll and 65% in the vascular system. It follows that positron escape probability the ranges approximately between 80% in the mesophyll and 35% in the vascular system. An additional effect leading to mis-interpretation of plant PET data is the self-contamination due to the interaction of escaping positrons with plant tissues far away from the emission point. The 3-dimensional view of the contamination probability is shown in Figure 4C. We note that it has a clear dependence on the geometry of the leaf. In fact, while it is uniform and approximately equal to 20% in the upper flat part of the leaf, it approaches 70% in the lower part of the leaf. The two lower ends of the leaf are in fact folded and enhance the capture of escaping positrons. Plant PET systems require therefore an excellent sensitivity to cope to the weak plant signal.
Figure 4
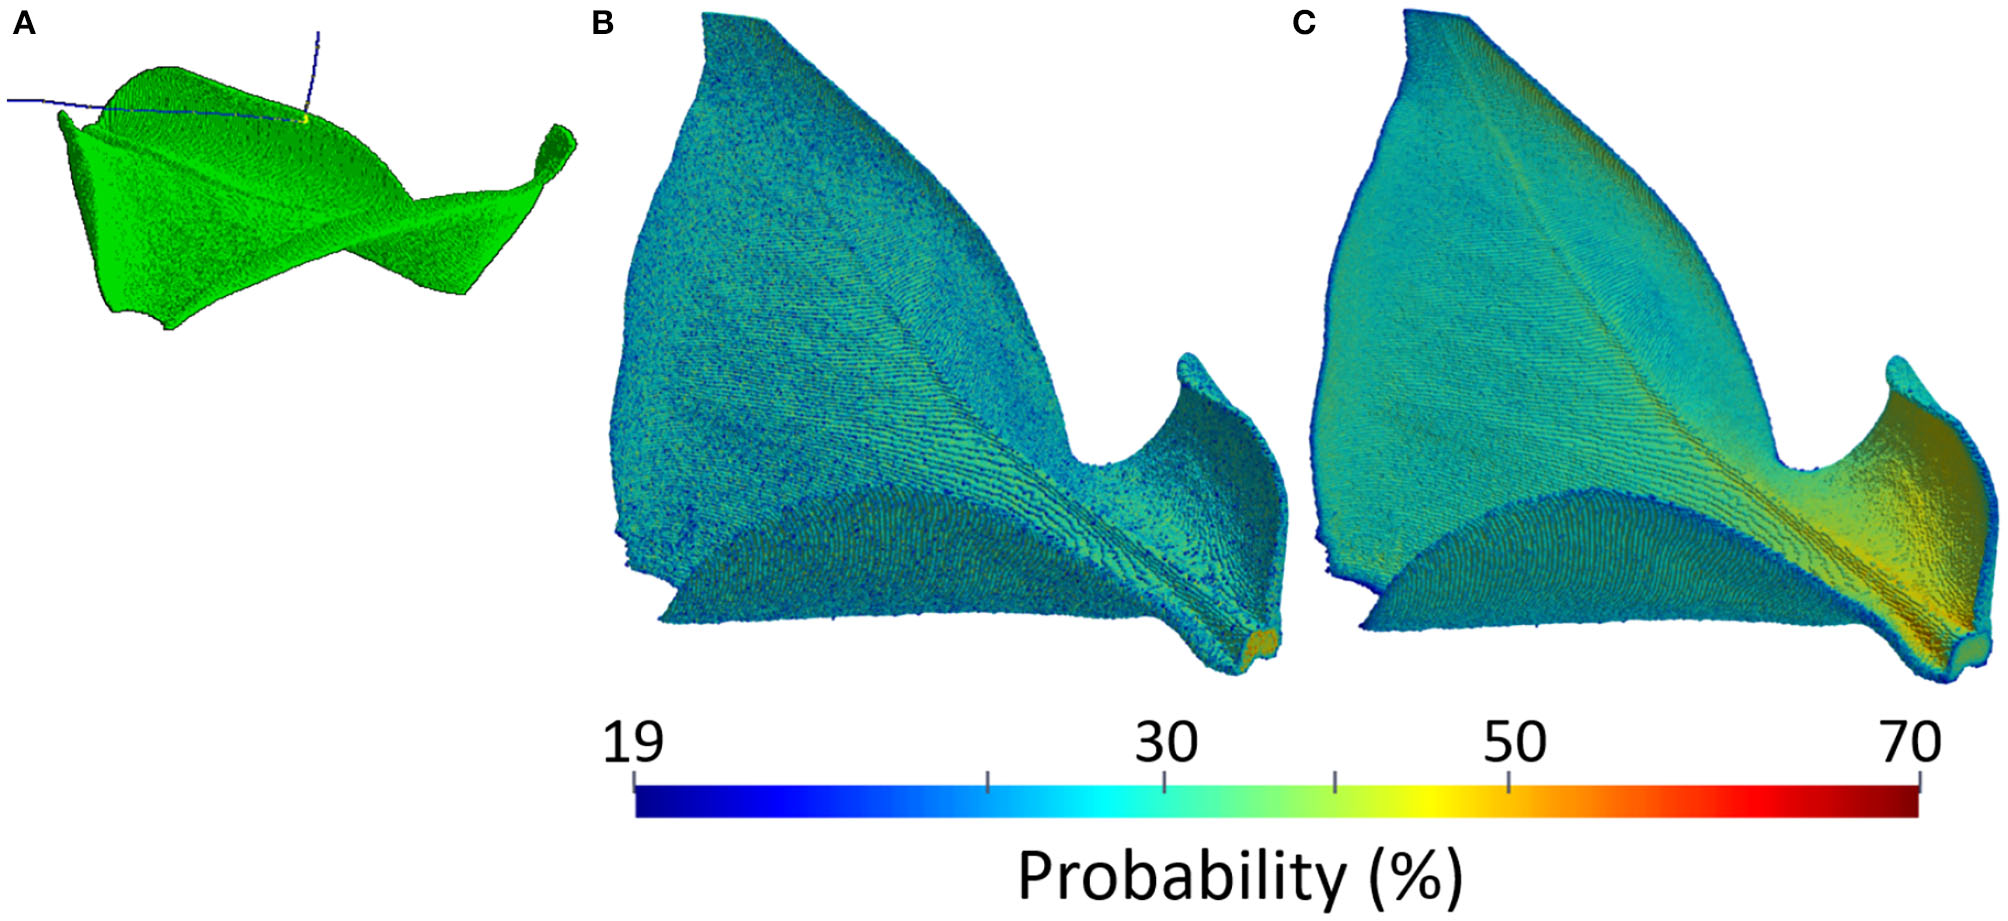
Example of a physical model of a leaf of Epipremnum Aureum: simulation of a positron escape in GEANT4 (A), positron annihilation probability (B), and positron contamination probability (C).
While the design of dedicated plant PET systems optimized for the demanding requirements of quantitative dynamic functional plant imaging is still in a preliminary stage (Keutgen et al., 2005; Alexoff et al., 2011; Wang et al., 2014), first results and proof of principles are obtained with existing micro PET/CT systems originally developed for small animal imaging (Hubeau and Steppe, 2015).
PET is considered a key-technology for the quantitative measurement of the transport and assignment of metabolites in plants under stress condition (Kiser et al., 2008). A prototypical example of a transport dynamic study is shown in Figure 5, where the three dimensional view of the corrected 2-[18F]FDG tracer activity in the leaf of Epipremnum aureum 10 min (a), 70 min (b), 130 min (c), and 190 min (d) after beginning of the PET scan is shown (Liang et al., 2020). The time dependence of the average tracer activity uncorrected and corrected for positron escape in two ROIs expresses the interplay between water transport and tracer decay. At first the two quantities increase, reaching a maximal value approximately 60 and 30 min after the start of the scan in the midrib and in the lateral vein, respectively. At this time the water flow in the two ROIs reaches a steady state and the tracer decay with an half-life of approximately 110 min dominates. As the midrib is responsible of the main water support to the entire leaf, it reaches the steady state flow regime shortly later than the smaller lateral vein. The ratio of the average Tmeas(wi) and Ttrue(wi) in the two ROIs is approximately 5 and 2.5, respectively. This implies that, without considering the effect of positron annihilation and escape, the difference of water flow in the two region of the plants would be over-estimated of approximately a factor 2.
Figure 5
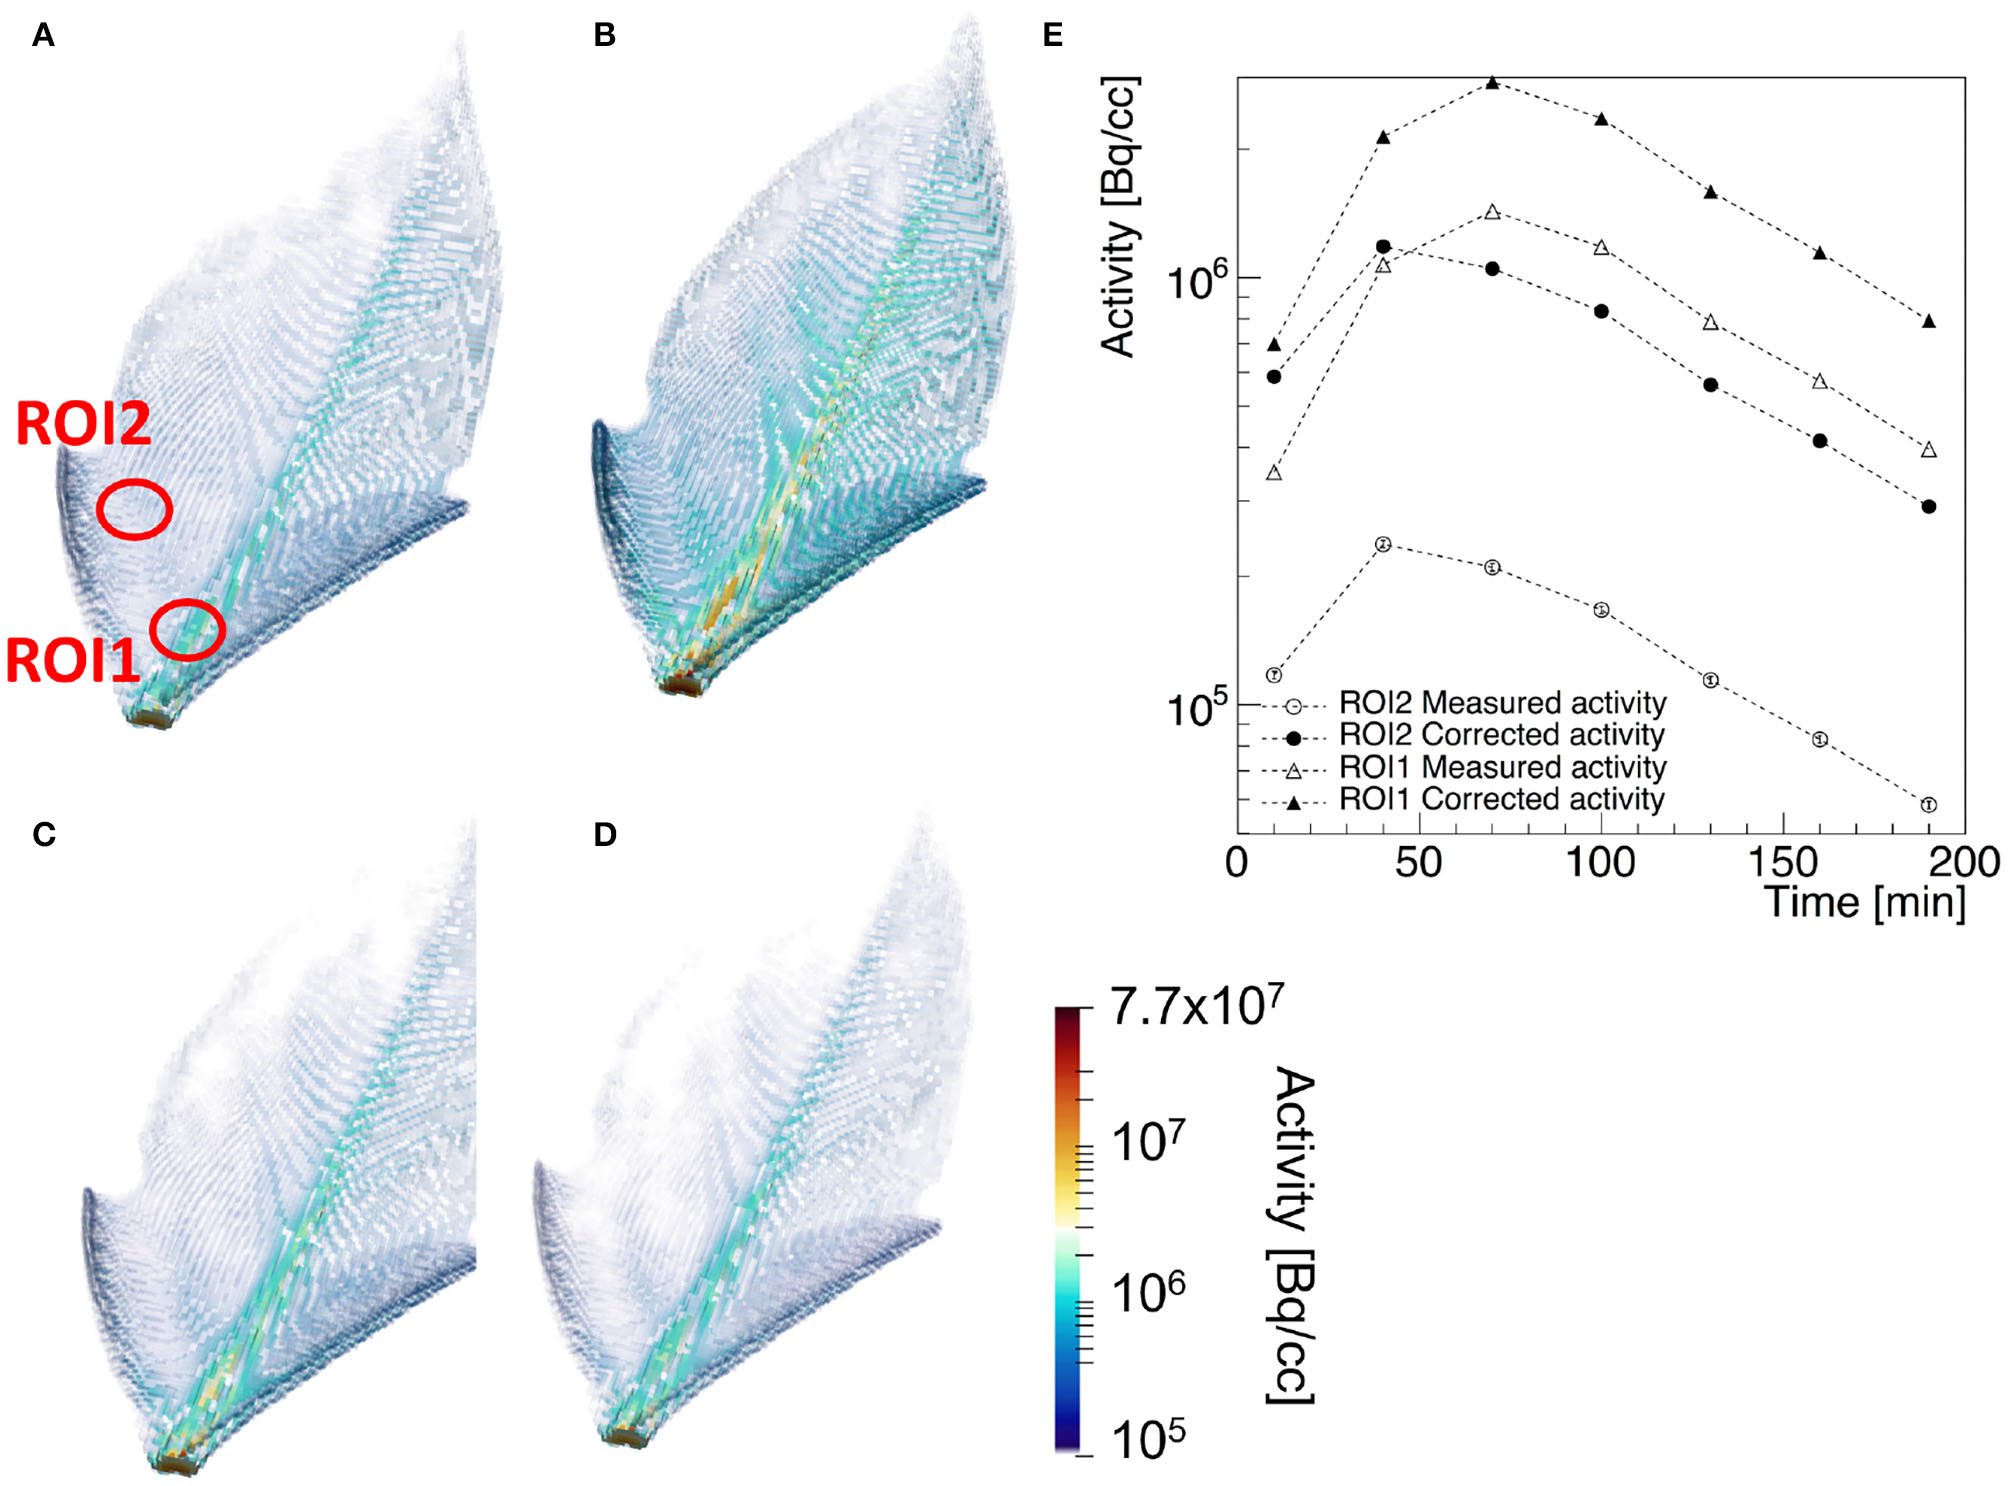
Example of a [18]F-FDG PET of a leaf of Epipremnum Aureum: 3-dimensional view of the corrected tracer concentration 10 min (A), 70 min (B), 130 min (C), and 190 min (D) after the beginning of the scan. The average standard uptake value of the measured (empty markers) and corrected tracer distribution (filled markers) in the two ROIs identified in (A) are shown in (E) as a function of the acquisition time.
Water transport in plants is in fact very sensitive to biotic and abiotic stress factors (Schmidt et al., 2020). Modifications of water uptake have been observed in tomato, rice (Mori et al., 2000), and Vigna unguiculate (Furukawa et al., 2001), among others. The nitrogen channel is also sensitive to plant stress, being this element a key nutrient for plants. By using root-applied [13N]-NO3 tracer, it is possible to visualize the modification in uptake and translocation of NO3 in stressed plants (Ohtake et al., 2001; Li et al., 2014).
[C11]−CO2 and [O15] − H2O have been used to visualize the photoassimilate translocation in intact eggplant fruit (Kikuchi et al., 2008) and the variation of water flow in tomato and rice under different illumination conditions (Mori et al., 2000; Nakanishi et al., 2002), respectively. Kinetic modeling of the measured flow in plants is needed in order to extract quantitative parameters (Matsuhashi et al., 2010). The quantitative assessment of the effects of stress on the photosynthetic rate plays also an important role in prevention and cure. Prototypical studies using [C11] − CO2 have been performed to verify the relationship between drought and photosynthesis in the African african tropical tree species Maesopsis Eminii Engl. (Hubeau and Steppe, 2015; Epila et al., 2018). [18F]-FDG has been used to associate water movement to the leaf in acid soil-tolerant rice varieties (Kang et al., 2009) and to study plant signal and response to defense from biotic stress (Ferrieri et al., 2012). However, the ability of PET to provide a quantitative dynamic measurement of the metabolic pathways and transport processes in plants opens a new perspective in plant science, with a large number of unsolved research questions ranging from the development of a proper plant PET system, to novel specific plant tracers, to more advanced modeling of plant PET data for the establishment of a truly quantitative functional imaging technique for plants. Due to its demanding performances, plant PET represents nowadays one of the frontiers of PET technology and plant science research (Hubeau and Steppe, 2015).
5. Conclusions and Future Perspectives
Imaging technologies became an essential tool for the assessment and monitoring of stress, supporting agronomist, breeders and physiologists both for in-field and for laboratory experiments. Stress manifests itself over a wide length scale ranging from the microscopic cellular to the macroscopic plant and field level. An imaging technology able to cover quantitatively the entire scale does not exist.
Whole field sensing is naturally attractive in the agricultural practice. The rapidity in detection is a characteristic of qualitative remote sensing techniques and technologies, which also have the great advantage of providing indications on scales ranging from microscopic to landscape levels. Moreover, it allows monitoring continuously vegetation thanks to the adoption of robotic platforms. Due to the large versatility, however, the most important limits are related to the correct definition of protocols for measurements, processing and pre-processing of collected data, that should take into account the variability of the environmental conditions that occur during measurements, and that can compromise the goodness and reliability of the obtained results. Managing enormous amount of data is still an open matter as well as the specificity of genotype-stress combinations needs further investigation. Finally, the scarce application maturity of some remote sensing technologies, beyond research purposes, should be emphasized. For example, for hyperspectral imaging there are currently no cameras in the full range of 350–2,500 nm, which would require the simultaneous use of two sensors, even very expensive (see SWIR); similarly, most current fluorescence and thermal systems are characterized by high price and poor applicability.
Quantitative information is obtained at the expenses of portability, restricting the analysis to the plant scale. Morphologic imaging techniques, such as CT or MRI, provide non-disruptive, quantitative and precise information of the plants structure. However they do not provide any information about the functions within plants and therefore can only address structural damages induced by stress, but cannot provide any information on the functional basis of the physiological mechanisms of reactions to both biotic and abiotic stressors at cellular level. For this purpose, metabolomics is an essential tool to enhance the results obtained with morphologic imaging techniques. However, it is time-consuming, requires considerable use of reagents and chemicals, and, above all, it is not able to provide timely indications to support early interventions both in open-field and controlled conditions. Finally, if not associated with other detection techniques, it provides indications on a small scale, from cell to tissue.
PET is by far the only quantitative functional imaging technique, which provides a non-disruptive information of the modifications of functional mechanisms in response to biotic and abiotic stress. The interesting aspect of PET is time-dynamical acquisition for the measurement of transport fluxes within the vascular system. New technologies will allow PET systems to be compact and portable, enabling in-field measurements and, even, PET-on-platform (RPA, remotely piloted aircraft) possibilities. Furthermore, it is expected that the combination of PET scan with tissue/site/cell specific metabolomics and transcriptomics analyses will be a powerful tool for the understanding of the stress responses of plants. We are therefore confident that plant PET will cross-fertilize disciplines, driving new research in agriculture, supported by the development of new specific tracers for plant science, new mathematical models for a more precise quantitative approach, and new high resolution compact portable PET technologies.
Statements
Author contributions
AG, FS, and GP made the material search and wrote the sections 2 and 3. ND'A and QX wrote the section 4. ND'A and MP wrote sections 1 and 5 and responsible of the scientific supervision of the team and of the manuscript. All authors contributed to the article and approved the submitted version.
Funding
This work was supported in part by the Natural Science Foundation of China (NSFC) Grant 61671215, in part by National Key Scientific Instrument and Equipment Development Project of China 2016YFF0101500, in part by the Molise Regional Government European Regional Development Fund (ERDF).
Acknowledgments
The authors thank Prof. Zhaotian Zhang, National Natural Science foundation of China, for the fruitful scientific discussions.
Conflict of interest
The authors declare that the research was conducted in the absence of any commercial or financial relationships that could be construed as a potential conflict of interest.
References
1
Abdulridha J. Batuman O. Ampatzidis Y. (2019). UAV-based remote sensing technique to detect citrus canker disease utilizing hyperspectral imaging and machine learning. Remote Sens.11:1373. 10.3390/rs11111373
2
Agarrwal R. Bentur J. Nair S. (2014). Gas chromatography mass spectrometry based metabolic profiling reveals biomarkers involved in rice-gall midge interactions. J. Integr. Plant Biol. 56, 837–848. 10.1111/jipb.12244
3
Ahmed A. Ibrahim A. Hussein S. (2019). Detection of Palm Tree Pests Using Thermal Imaging: A Review. Cham: Springer International Publishing. 10.1007/978-3-030-02357-7_12
4
Al-doski J. Shattri B. Helmi-Zulhai B. M.-S. (2016). Thermal imaging for pests detecting-a review. Int. J. Agric. For. Plant2, 10–30.
5
Alexoff D. L. Dewey S. L. Vaska P. Krishnamoorthy S. Ferrieri R. Schueller M. et al . (2011). Pet imaging of thin objects: measuring the effects of positron range and partial-volume averaging in the leaf of Nicotiana tabacum. Nuclear Med. Biol. 38, 191–200. 10.1016/j.nucmedbio.2010.08.004
6
Aliche E. B. Prusova-Bourke A. Ruiz-Sanchez M. (2020). Morphological and physiological responses of the potato stem transport tissues to dehydration stress. Planta251:45. 10.1007/s00425-019-03336-7
7
AL-Saddik H. Simon J.-C. Cointault F. (2017). Development of spectral disease indices for ‘Flavescence Dorée’ grapevine disease identification. Sensors17:2772. 10.3390/s17122772
8
Álvarez Arenas T. G. Gil-Pelegrin E. Cuello J. E. Farinas M. D. Sancho-Knapik D. Burbano D. A. C. (2016). Ultrasonic sensing of plant water needs for agriculture. Sensors16:1089. 10.3390/s16071089
9
Arbona V. Manzi M. Ollas C. D. Gomez-Cadenas A. (2013). Metabolomics as a tool to investigate abiotic stress tolerance in plants. Int. J. Mol. Sci14, 4885–4911. 10.3390/ijms14034885
10
Awad Y. M. Abdullah A. A. Bayoumi T. Y. Abd-Elsalam K. Hassanien A. E. (2015). Early detection of powdery mildew disease in wheat (Triticum aestivum L.) using thermal imaging technique, in Intelligent Systems'2014, eds FilevD.JabłkowskiJ.KacprzykJ.KrawczakM.PopchevI.RutkowskiL.SgurevV.et al. (Cham: Springer International Publishing) 755–765. 10.1007/978-3-319-11310-4_66
11
Babar M. A. Reynolds M. P. Ginkel M. Van Klatt A. R. Raun W. R. Stone M. L. (2006). Spectral reflectance indices as a potential indirect selection criteria for wheat yield under irrigation. Crop Sci.46, 578–588. 10.2135/cropsci2005.0059
12
Bandopadhyay S. Rastogi A. Juszczak R. (2020). Review of top-of-canopy sun-induced fluorescence (SIF) studies from ground, UAV, airborne to spaceborne observations. Sensors20:1144. 10.3390/s20041144
13
Barbedo J. G. A. (2019). A review on the use of unmanned aerial vehicles and imaging sensors for monitoring and assessing plant stresses. Drones3:40. 10.3390/drones3020040
14
Barnes E. M. Clarke T. R. Richards S. E. Colaizzi P. D. Haberland J. Kostrzewski M. et al . (2000). Coincident detection of crop water stress, nitrogen status and canopy density using ground-based multispectral data, in Proceedings of the 5th International Conference on Precision Agriculture (Bloomington, MN), 1–15.
15
Belasque J. Gasparoto M. C. G. Marcassa L. G. (2008). Detection of mechanical and disease stresses in citrus plants by fluorescence spectroscopy. Appl. Opt. 47, 1922–1926. 10.1364/AO.47.001922
16
Berni J. A. Zarco-Tejada P. J. Suárez L. Fereres E. (2009a). Thermal and narrowband multispectral remote sensing for vegetation monitoring from an unmanned aerial vehicle. IEEE Trans. Geosci. Remote Sens.47, 722–738. 10.1109/TGRS.2008.2010457
17
Berni J. A. Zarco-Tejada P. J. Suárez L. González-Dugo V. Fereres E. (2009b). Remote sensing of vegetation from UAV platforms using lightweight multispectral and thermal imaging sensors. Int. Arch. Photogramm. Remote Sens. Spat. Inform. Sci.38:6.
18
Blaya-Ros P. J. Blanco V. Domingo R. Soto-Valles F. Torres-Sanchez R. (2020). Feasibility of low-cost thermal imaging for monitoring water stress in young and mature sweet cherry trees. Appl. Sci. 10:5461. 10.3390/app10165461
19
Boshkovski B. Tzerakis C. Doupis G. Zapolska A. Kalaitzidis C. Koubouris G. (2020). Relationships of spectral reflectance with plant tissue mineral elements of common bean. Commun. Soil Sci. Plant Anal. 51, 675–686. 10.1080/00103624.2020.1729789
20
Buschmann C. (2007). Variability and application of the chlorophyll fluorescence emission ratio red/far-red of leaves. Photosynth. Res. 92, 261–271. 10.1007/s11120-007-9187-8
21
Caballero D. Calvini R. Amigo J. M. (2020). Chapter 3.3: Hyperspectral imaging in crop fields: precision agriculture, in Hyperspectral Imaging Data Handling in Science and Technology, ed AmigoJ. M. (Amsterdam: Elsevier), 453–473. 10.1016/B978-0-444-63977-6.00018-3
22
Campos L. P. Graciolo V. Sousa M. M. Martins B. R. Souza S. W. Alberton D. (2019). Polymorphisms rs1800795 of interleukin-6 and rs2228145 of interleukin-6 receptor genes in euro-brazilians with adult-onset type 1 diabetes mellitus. Genet. Mol. Res. 18, 1–10. 10.4238/gmr18260
23
Casa R. Pignatti S. Pascucci S. Castaldi F. V. M. (2016). Il Telerilevamento in Agricoltura di Precisione. Milan: R. Casa.
24
Castro-Moretti F. R. Gentzel I. N. Mackey D. Alonso A. P. (2020). Metabolomics as an emerging tool for the study of plant-pathogen interactions. Metabolites10:52. 10.3390/metabo10020052
25
Chaerle L. Lenk S. Leinonen I. Jones H. G. Van Der Straeten D. Buschmann C. (2009). Multi-sensor plant imaging: towards the development of a stress-catalogue. Biotechnol. J. 4, 1152–1167. 10.1002/biot.200800242
26
Chelladurai V. Karuppiah K. Jayas D. S. Fields P. G. White N. D. G. (2014). Detection of Callosobruchus maculatus (f.) infestation in soybean using soft x-ray and NIR hyperspectral imaging techniques. J. Stored Prod. Res. 57, 43–48. 10.1016/j.jspr.2013.12.005
27
Chen F. Fang P. Peng Y. Zeng W. Zhao X. Ding Y. (2019). Comparative proteomics of salt-tolerant and salt-sensitive maize inbred lines to reveal the molecular mechanism of salt tolerance. Int. J. Mol. Sci. 20:4725. 10.3390/ijms20194725
28
Chen Q. Zhang C. Zhao J. Ouyang Q. (2013). Recent advances in emerging imaging techniques for non-destructive detection of food quality and safety. Trends Anal. Chem. 52, 261–274. 10.1016/j.trac.2013.09.007
29
Chinnusamy V. Zhu J. Zhu J. K. (2007). Cold stress regulation of gene expression in plants. Trends Plant Sci. 12, 444–451. 10.1016/j.tplants.2007.07.002
30
Chitarra L. G. Bulk R. W. V. D. (2003). The application of flow cytometry and fluorescent probe technology for detection and assessment of viability of plant pathogenic bacteria. Eur. J. Plant Pathol. 109, 407–417. 10.1023/A:1024275610233
31
Converse A. K. Ahlers E. O. Bryan T. W. Williams P. H. Barnhart T. E. Engle J. W. et al . (2013). Positron emission tomography (PET) of radiotracer uptake and distribution in living plants: methodological aspects. J. Radioanal. Nuclear Chem. 297, 241–246. 10.1007/s10967-012-2383-9
32
Costa J. M. Grant O. M. Chaves M. M. (2013). Thermography to explore plant-environment interactions. J. Exp. Bot. 64, 3937–3949. 10.1093/jxb/ert029
33
Cotrozzi L. Townsend P. A. Pellegrini E. Nali C. Couture J. J. (2018). Reflectance spectroscopy: a novel approach to better understand and monitor the impact of air pollution on mediterranean plants. Environ. Sci. Pollut. Res. 25, 8249–8267. 10.1007/s11356-017-9568-2
34
Couture J. J. Singh A. Nason K. F. R. Serbin S. P. Lindroth R. L. Townsend P. A. (2016). Spectroscopic determination of ecologically relevant plant secondary metabolites. Methods Ecol. Evol. 7, 1402–1412. 10.1111/2041-210X.12596
35
Crusiol L. G. T. Nanni M. R. Furlanetto R. H. Sibaldelli R. N. R. Cezar E. Mertz-Henning L. M. et al . (2020). UAV-based thermal imaging in the assessment of water status of soybean plants. Int. J. Remote Sens. 41, 3243–3265. 10.1080/01431161.2019.1673914
36
Das A. Rushton P. J. Rohila J. S. (2017). Metabolomic profiling of soybeans (Glycine max L.) reveals the importance of sugar and nitrogen metabolism under drought and heat stress. Plants6:21. 10.3390/plants6020021
37
Daughtry C. S. T. Walthall C. L. Kim M. S. de Colstoun E. B. McMurtrey J. E. (2000). Estimating corn leaf chlorophyll concentration from leaf and canopy reflectance. Remote Sens. Environ.74, 229–239. 10.1016/S0034-4257(00)00113-9
38
Dawid C. Hille K. (2018). Functional metabolomics-a useful tool to characterize stress-induced metabolome alterations opening new avenues towards tailoring food crop quality. Agronomy8:138. 10.3390/agronomy8080138
39
do Prado Ribeiro L. Klock A. L. S. Filho J. A. W. Tramontin M. A. Trapp M. A. Mithöfer A. et al . (2018). Hyperspectral imaging to characterize plant-plant communication in response to insect herbivory. Plant Methods14, 1–11. 10.1186/s13007-018-0322-7
40
Dong Z. Men Y. Li Z. Zou Q. Ji J. (2019). Chlorophyll fluorescence imaging as a tool for analyzing the effects of chilling injury on tomato seedlings. Sci. Hortic. 246, 490–497. 10.1016/j.scienta.2018.11.019
41
Ebrahimnejad H. Ebrahimnejad H. Salajegheh A. Barghi H. (2018). Use of magnetic resonance imaging in food quality control: a review. Biomed. Phys. Eng. 8:127.
42
Egea G. Padilla-Diaz C. M. Martinez-Guanter J. Fernandez J. E. Perez-Ruiz M. (2017). Assessing a crop water stress index derived from aerial thermal imaging and infrared thermometry in super-high density olive orchards. Agric. Water Manage. 187, 210–221. 10.1016/j.agwat.2017.03.030
43
El-Hendawy S. Al-Suhaibani N. Dewir Y. H. Elsayed S. Alotaibi M. Hassan W. (2019). Ability of modified spectral reflectance indices for estimating growth and photosynthetic efficiency of wheat under saline field conditions. Agronomy9:35. 10.3390/agronomy9010035
44
El-Hendawy S. E. Al-Suhaibani N. A. Elsayed E. Hassan W. M. Dewir Y. H. Refay Y. (2019a). Potential of the existing and novel spectral reflectance indices for estimating the leaf water status and grain yield of spring wheat exposed to different irrigation rates. Agric. Water Manage. 217, 356–373. 10.1016/j.agwat.2019.03.006
45
El-Hendawy S. E. Al-Suhaibani N. A. Hassan W. M. Dewir Y. H. Elsayed S. Al-Ashkar I. (2019b). Evaluation of wavelengths and spectral reflectance indices for high-throughput assessment of growth, water relations and ion contents of wheat irrigated with saline water. Agric. Water Manage. 212, 358–377. 10.1016/j.agwat.2018.09.009
46
Elvanidi A. Katsoulas N. Ferentinos K. P. Bartzanas T. Kittas C. (2018). Hyperspectral machine vision as a tool for water stress severity assessment in soilless tomato crop. Biosyst. Eng.165, 25–35. 10.1016/j.biosystemseng.2017.11.002
47
Epila J. Hubeau M. Steppe K. (2018). Drought effects on photosynthesis and implications of photoassimilate distribution in 11c-labeled leaves in the African tropical tree species Maesopsis eminii engl. Forests9:109. 10.3390/f9030109
48
Espinoza C. Z. Khot L. R. Sankaran S. Jacoby P. W. (2017). High resolution multispectral and thermal remote sensing-based water stress assessment in subsurface irrigated grapevines. Remote Sens. 9:961. 10.3390/rs9090961
49
Farber N. J. Madhusoodanan V. K. Gerkowicz S. A. Patel P. Ramasamy R. (2019). Reasons that should prompt a referral to a reproductive urologist: guidelines for the gynecologist and reproductive endocrinologist. Gynecol. Pelvic Med. 2:20. 10.21037/gpm.2019.09.04
50
Fariñas M. D. Jimenez-Carretero D. Sancho-Knapik D. Peguero-Pina J. J. Gil-Pelegrin E. Alvarez Arenas T. G. (2019). Instantaneous and non-destructive relative water content estimation from deep learning applied to resonant ultrasonic spectra of plant leaves. Plant Methods15, 1–10. 10.1186/s13007-019-0511-z
51
Fariñas M. D. Knapik D. S. Pina J. J. P. Pelegrin E. G. Alvarez Arenas T. E. G. (2014). Monitoring plant response to environmental stimuli by ultrasonic sensing of the leaves. Ultrasound Med. Biol. 40, 2183–2194. 10.1016/j.ultrasmedbio.2014.04.004
52
Fatangare A. Paetz C. Saluz H. Svatos A. (2015). 2-deoxy-2-fluoro-d-glucose metabolism in Arabidopsis thaliana. Front. Plant. Sci. 6:935. 10.3389/fpls.2015.00935
53
Feng W. Zhang S. Zhong Q. Wang G. Pan X. Xu X. (2020). Soil washing remediation of heavy metal from contaminated soil with EDTMP and PAA: properties, optimization, and risk assessment. J. Hazard. Mater. 381:120997. 10.1016/j.jhazmat.2019.120997
54
Feng X. Yu C. Chen Y. Peng J. Shen L. Y. T. (2018). Non-destructive determination of shikimic acid concentration in transgenic maize exhibiting glyphosate tolerance using chlorophyll fluorescence and hyperspectral imaging. Front. Plant Sci. 9:468. 10.3389/fpls.2018.00468
55
Fernie A. R. Trethewey R. N. Krotzky A. J. Willmitzer L. (2004). Metabolite profiling: from diagnostics to systems biology. Nat. Rev. Mol. Cell Biol. 5, 763–769. 10.1038/nrm1451
56
Ferrieri A. P. Appel H. Ferrieri R. A. Schultz J. C. (2012). Novel application of 2-[18f]fluoro-2-deoxy-d-glucose to study plant defenses. Nuclear Med. Biol. 39, 1152–1160. 10.1016/j.nucmedbio.2012.06.005
57
Fiehn O. (2001). Combining genomics, metabolome analysis, and biochemical modelling to understand metabolic networks. Comp. Funct. Genomics2, 155–168. 10.1002/cfg.82
58
Fittschen U. E. A. Kunz H. H. Hohner R. Tyssebotn I. M. B. Fittschen A. (2017). A new micro x-ray fluorescence spectrometer for in vivo elemental analysis in plants. XRay Spectrom. 46, 374–381. 10.1002/xrs.2783
59
Furukawa J. Yokota H. Tanoi K. (2001). Vanadium uptake and an effect of vanadium treatment on 18f-labeled water movement in a cowpea plant by positron emitting tracer imaging system (petis). J. Radioanal Nuclear Chem. 249, 495–498. 10.1023/A:1013276224300
60
Galieni A. Mattia C. D. Gregorio M. D. Speca S. Mastrocola D. Pisante M. (2015). Effects of nutrient deficiency and abiotic environmental stresses on yield, phenolic compounds and antiradical activity in lettuce (Lactuca sativa L.). Sci. Hortic. 187, 93–101. 10.1016/j.scienta.2015.02.036
61
Gao B. C. (1996). NDWI-A normalized difference water index for remote sensing of vegetation liquid water from space. Remote Sens. Env.58, 257–266. 10.1016/S0034-4257(96)00067-3
62
Gao Z. Zhao Y. Khot L. R. Hoheisel G.-A. Zhang Q. (2019). Optical sensing for early spring freeze related blueberry bud damage detection: Hyperspectral imaging for salient spectral wavelengths identification. Comput. Electron. Agric.167:105025. 10.1016/j.compag.2019.105025
63
García-Tejero I. Gutiérrez-Gordillo S. Ortega-Arévalo C. Iglesias-Contreras M. Moreno J. Souza-Ferreira L. et al . (2018). Thermal imaging to monitor the crop-water status in almonds by using the non-water stress baselines. Sci. Hortic. 238, 91–97. 10.1016/j.scienta.2018.04.045
64
Garriga M. Romero-Bravo S. Estrada F. Escobar A. Matus I. A. del Pozo A. (2017). Assessing wheat traits by spectral reflectance: do we really need to focus on predicted trait-values or directly identify the elite genotypes group?Front. Plant Sci. 8:280. 10.3389/fpls.2017.00280
65
Gautam R. Parajuli K. Tshokey T. Stenos J. Sherchand J. B. (2020). Diagnostic evaluation of IgM ELISA and IgM Immunofluorescence assay for the diagnosis of Acute Scrub Typhus in central Nepal. BMC Infect. Dis.20, 1–6. 10.1186/s12879-020-4861-y
66
Ge Y. Atefi A. Zhang H. Miao C. Ramamurthy R. K. Sigmon B. (2019). High-throughput analysis of leaf physiological and chemical traits with VIS-NIR-SWIR spectroscopy: a case study with a maize diversity panel. Plant Methods15, 1–12. 10.1186/s13007-019-0450-8
67
Gerhards M. Schlerf M. Mallick K. Udelhoven T. (2019). Challenges and future perspectives of multi-/hyperspectral thermal infrared remote sensing for crop water-stress detection: a review. Remote Sens. 11:1240. 10.3390/rs11101240
68
Gholizadeh A. Kopacková V. (2019). Detecting vegetation stress as a soil contamination proxy-a review of optical proximal and remote sensing techniques. Int. J. Environ. Sci. Technol. 16, 2511–2524. 10.1007/s13762-019-02310-w
69
Gitelson A. A. Kaufman Y. J. Merzlyak M. N. (1996). Use of a green channel in remote sensing of global vegetation from EOS-MODIS. Remote Sens. Environ.58, 289–298. 10.1016/S0034-4257(96)00072-7
70
Gitelson A. A. Merzlyak M. N. (1996). Signature analysis of leaf reflectance spectra: algorithm development for remote sensing of chlorophyll. J. Plant Physiol.148, 494–500. 10.1016/S0176-1617(96)80284-7
71
Gokce Z. N. O. Akbas S. Ayten S. Azimi M. Das R. Guven S. B. et al . (2020). Agronomic Crops, chapter Abiotic Stress Tolerance in Field Crops: Integration of Omics Approaches. Singapore: Springer.
72
Goodman B. A. Williamson B. Chudek J. A. (1992). Nuclear magnetic resonance (NMR) microimaging of raspberry fruit: further studies on the origin of the image. N. Phytol. 122, 529–535. 10.1111/j.1469-8137.1992.tb00082.x
73
Gorbe E. Calatayud A. (2012). Applications of chlorophyll fluorescence imaging technique in horticultural research: a review. Sci. Hortic. 138, 24–35. 10.1016/j.scienta.2012.02.002
74
Gutiérrez S. Diago M. P. Fernández-Novales J. Tardaguila J. (2018). Vineyard water status assessment using on-the-go thermal imaging and machine learning. PLoS ONE13:e0192037. 10.1371/journal.pone.0192037
75
Gutiérrez-Gordillo S. Garcia-Tejero I. F. Duran Zuazo V. H. Garcia Escalera A. Ferrera Gil F. Amores-Aguera J. J. et al . (2020). Assessing the water-stress baselines by thermal imaging for irrigation management in almond plantations under water scarcity conditions. Water12:1298. 10.3390/w12051298
76
Guy C. Kaplan J. Kopka F. K. Selbig J. Hincha D. K. (2008). Metabolomics of temperature stress. Physiol. Plant. 132, 220–235. 10.1111/j.1399-3054.2007.00999.x
77
Hamzeh S. Naseri A. A. AlaviPanah S. K. Mojaradi B. Bartholomeus H. M. Clevers J. G. P. W. et al . (2012). Estimating salinity stress in sugarcane fields with spaceborne hyperspectral: Vegetation indices. Int. J. Appl. Earth Obs. Geoinf.21, 282–290. 10.1016/j.jag.2012.07.002
78
Hansen P. M. Schjoerring J. K. (2003). Reflectance measurement of canopy biomass and nitrogen status in wheat crops using normalized difference vegetation indices and partial least squares regression. Remote Sens. Environ. 86, 542–533. 10.1016/S0034-4257(03)00131-7
79
Huang J. Liao H. Zhu Y. Sun J. andX Liu Q. S. (2019). Hyperspectral detection of rice damaged by rice leaf folder (Cnaphalocrocis medinalis). Comput. Electron. Agric. 82, 100–107. 10.1016/j.compag.2012.01.002
80
Hubeau M. Steppe K. (2015). Plant-pet scans: in vivo mapping of xylem and phloem functioning. Trends Plant Sci. 20, 676–685. 10.1016/j.tplants.2015.07.008
81
Huete A. R. (1988). Soil-adjusted vegetation index (SAVI). Remote Sens. Environ.25, 295–309. 10.1016/0034-4257(88)90106-X
82
Idso S. B. Jackson R. D. Pinter P. J. Reginato R. J. Hatfield J. L. (1981). Normalizing the stress-degree-day parameter for environmental variability. Agric. Meteorol. 24, 45–55. 10.1016/0002-1571(81)90032-7
83
Jones H. Schofield P. (2008). Thermal and other remote sensing of plant stress. Gen. Appl. Plant Physiol. 34, 19–32.
84
Jun S. Xin Z. Xiaohong W. Bing L. Chunxia D. Jifeng S. (2019). Research and analysis of cadmium residue in tomato leaves based on WT-LSSVR and Vis-NIR hyperspectral imaging. Spectrochim. Acta Part A Mol. Biomol. Spectrosc.212, 215–221. 10.1016/j.saa.2018.12.051
85
Kang D.-J. Nakanishi T. M. Kume T. Ishii R. (2009). Determination of the rate of 18f-labeled water movement to the leaf and its association with water relations in acid soil- tolerant rice varieties. J. Crop Sci. Biotech. 12, 261–265. 10.1007/s12892-009-0122-8
86
Kawamura K. Ikeura H. Phongchanmaixay S. Khanthavong P. (2018). Canopy hyperspectral sensing of paddy fields at the booting stage and PLS regression can assess grain yield. Remote Sens. 10:1249. 10.3390/rs10081249
87
Keutgen A. J. Keutgen N. Matsuhashi S. Mizuniwa C. Fujimura T. I. T. Ishioka N.-S. et al . (2005). Input-output analysis of in vivo photoassimilate translocation using positron-emitting tracer imaging system (PETIS) data. Exp. Bot. 56, 1419–1425. 10.1093/jxb/eri143
88
Khalid N. Aqeel M. Noman A. (2019). System Biology of Metal Tolerance in Plants: An Integrated View of Genomics, Transcriptomics, Metabolomics, and Phenomics. Cham: Springer International Publishing. 10.1007/978-3-030-19103-0_6
89
Khan M. J. Khan H. S. Yousaf A. Khurshid K. Abbas A. (2018). Modern trends in hyperspectral image analysis: a review. IEEE Access6, 14118–14129. 10.1109/ACCESS.2018.2812999
90
Khan T. A. Yusuf M. Ahmad A. Bashir Z. Saeed T. Fariduddin Q. (2019). Proteomic and physiological assessment of stress sensitive and tolerant variety of tomato treated with brassinosteroids and hydrogen peroxide under low-temperature stress. Food Chem. 289, 500–511. 10.1016/j.foodchem.2019.03.029
91
Kikuchi K. Ishii S. Fujimaki S. Suzui N. Matsuhashi S. Honda I. et al . (2008). Real-time analysis of photoassimilate translocation in intact eggplant fruit using 11CO2 and a positron-emitting tracer imaging system. J. Japan. Soc. Hort. Sci. 77, 199–205. 10.2503/jjshs1.77.199
92
Kiser M. R. Reid C. D. Crowell A. S. Phillips R. P. Howell C. R. (2008). Exploring the transport of plant metabolites using positron emitting radiotracers. HSFP J. 2, 189–204. 10.2976/1.2921207
93
Kollist H. Zandalinas S. I. Sengupta S. Nuhkat M. Kangasjarvi J. Mittler R. (2019). Rapid responses to abiotic stress: Priming the landscape for the signal transduction network. Trends Plant Sci. 24, 25–37. 10.1016/j.tplants.2018.10.003
94
Kong W. Zhang C. Cao F. Liu F. Luo S. Tang Y. et al . (2018). Detection of sclerotinia stem rot on oilseed rape (Brassica napus L.) leaves using hyperspectral imaging. Sensors18:1764. 10.3390/s18061764
95
Kotwaliwale N. Singh K. Kalne A. Jha S. N. Seth N. Kar A. (2014). X-ray imaging methods for internal quality evaluation of agricultural produce. J. Food Sci. Technol. 51, 1–15. 10.1007/s13197-011-0485-y
96
Kou S. Chen L. Tu W. Scossa F. Wang Y. Liu J. (2018). The arginine decarboxylase gene adc1, associated to the putrescine pathway, plays an important role in potato cold-acclimated freezing tolerance as revealed by transcriptome and metabolome analyses. Plant J. 96, 1283–1298. 10.1111/tpj.14126
97
Krishna G. Sahoo R. N. Singh P. Bajpai V. Patra H. Kumar S. et al . (2019). Comparison of various modelling approaches for water deficit stress monitoring in rice crop through hyperspectral remote sensing. Agric. Water Manag.213, 231–244. 10.1016/j.agwat.2018.08.029
98
Kumei T. Matsuhashi S. Shimazu M. Ito H. Fujimura T. Adachf K. et al . (1997). Uptake and transport of positron-emitting tracer (8f) in plants. Appl. Radiat. Isot. 48, 1035–1043. 10.1016/S0969-8043(97)00117-6
99
Kuska M. T. Mahlein A. K. (2018). Aiming at decision making in plant disease protection and phenotyping by the use of optical sensors. Eur. J. Plant Pathol. 154, 987–992. 10.1007/s10658-018-1464-1
100
Lee D.-K. Kim G. Son J.-H. Seo M. (2016). Highly sensitive terahertz spectroscopy of residual pesticide using nano-antenna, in Terahertz, RF, Millimeter, and Submillimeter-Wave Technology and Applications IX, eds SadwickL. P.YangT. (SPIE), 118–123. 10.1117/12.2212055
101
Lenk I. Fisher L. H. C. Vickers M. Akinyemi A. Didion T. Swain M. (2019). Transcriptional and metabolomic analyses indicate that cell wall properties are associated with drought tolerance in Brachypodium distachyon. Int. J. Mol. Sci. 20:1758. 10.3390/ijms20071758
102
Li B. Zhao X. Zhang Y. Zhang S. Luo B. (2020). Prediction and monitoring of leaf water content in soybean plants using terahertz time-domain spectroscopy. Comput. Electron. Agric. 170:105239. 10.1016/j.compag.2020.105239
103
Li H. Wang P. Weber J. F. Gerhards R. (2018). Early identification of herbicide stress in soybean (Glycine max (L.) merr.) using chlorophyll fluorescence imaging technology. Sensors18:21. 10.3390/s18010021
104
Li L. Zhang Q. Huang D. (2014). A review of imaging techniques for plant phenotyping. Sensors14, 20078–20111. 10.3390/s141120078
105
Li T. Wang Y. Liu J. X. Feng K. Xu Z. S. Xiong A. S. (2019). Advances in genomic, transcriptomic, proteomic, and metabolomic approaches to study biotic stress in fruit crops. Crit. Rev. Biotechnol. 39, 680–692. 10.1080/07388551.2019.1608153
106
Liang X. Li J. Antonecchia E. Ling Y. Li Z. Xiao W. et al . (2020). NEMA-2008 and in-vivo animal and plant imaging performance of the large fov preclinical digital PET/CT system discoverist 180, in IEEE Transactions on Radiation and Plasma Medical Sciences. 10.1109/TRPMS.2020.2983221
107
Liu J. Han J. Chen X. Shi L. Zhang L. (2019a). Nondestructive detection of rape leaf chlorophyll level based on VIS-NIR spectroscopy. Spectrochim. Acta A Mol. Biomol. Spectrosc. 222:117202. 10.1016/j.saa.2019.117202
108
Liu X. Baird W. V. (2003). Differential expression of genes regulated in response to drought or salinity stress in sunflower. Crop Sci. 43, 678–687. 10.2135/cropsci2003.6780
109
Liu Y. Cao Y. Wang T. Dong Q. Li J. Niu C. (2019b). Detection of 12 common food-borne bacterial pathogens by taqman real-time PCR using a single set of reaction conditions. Front. Microbiol. 10:222. 10.3389/fmicb.2019.00222
110
Loggenberg K. Strever A. Greyling B. Poona N. (2018). Modelling water stress in a shiraz vineyard using hyperspectral imaging and machine learning. Remote Sens.10:202. 10.3390/rs10020202
111
López-Gresa M. P. Maltese F. Belles J. M. Conejero V. Kim H. K. Choi Y. H. (2010). Metabolic response of tomato leaves upon different plant-pathogen interactions. Phytochem. Anal. 21, 89–94. 10.1002/pca.1179
112
Lu Y. Lu R. (2020). Enhancing chlorophyll fluorescence imaging under structured illumination with automatic vignetting correction for detection of chilling injury in cucumbers. Comput. Electron. Agric. 168:105145. 10.1016/j.compag.2019.105145
113
Lydia M. S. Aulia I. Jaya I. Hanafiah D. S. Lubis R. H. (2020). Preliminary study for identifying rice plant disease based on thermal images. J. Phys. Conf. Ser. 1566:012016. 10.1088/1742-6596/1566/1/012016
114
Machado R. D. Christoff A. P. Loss-Morais G. Margis-Pinheiro M. Margis R. Korbes A. P. (2015). Comprehensive selection of reference genes for quantitative gene expression analysis during seed development in Brassica napus. Plant Cell Rep. 34, 1139–1149. 10.1007/s00299-015-1773-1
115
Maes W. H. Steppe K. (2019). Perspectives for remote sensing with unmanned aerial vehicles in precision agriculture. Trends Plant Sci. 24, 152–164. 10.1016/j.tplants.2018.11.007
116
Mahlein A.-K. Alisaac E. Al Masri A. Behmann J. Dehne H.-W. Oerke E.-C. (2019). Comparison and combination of thermal, fluorescence, and hyperspectral imaging for monitoring fusarium head blight of wheat on spikelet scale. Sensors19:2281. 10.3390/s19102281
117
Mahlein A. K. (2016). Plant disease detection by imaging sensors-parallels and specific demands for precision agriculture and plant phenotyping. Plant Dis. 100, 241–251. 10.1094/PDIS-03-15-0340-FE
118
Maimaitiyiming M. Ghulam A. Bozzolo A. Wilkins J. L. Kwasniewski M. T. (2017). Early detection of plant physiological responses to different levels of water stress using reflectance spectroscopy. Remote Sens. 9:745. 10.3390/rs9070745
119
Mangus D. L. Sharda A. Zhang N. (2016). Development and evaluation of thermal infrared imaging system for high spatial and temporal resolution crop water stress monitoring of corn within a greenhouse. Comput. Electron. Agric. 121, 149–159. 10.1016/j.compag.2015.12.007
120
Marchica A. Lore S. Cotrozzi L. Lorenzini G. Nali C. Pellegrini E. (2019). Early detection of sage (Salvia officinalis L.) responses to ozone using reflectance spectroscopy. Plants8:346. 10.3390/plants8090346
121
Martinelli F. Scalenghe R. Davino S. Panno S. Scuderi G. Ruisi P. (2015). Advanced methods of plant disease detection. A review. Agron. Sustain. 35, 1–25. 10.1007/s13593-014-0246-1
122
Martynenko A. Shotton K. Astatkie T. Petrash G. Fowler C. Neily W. (2016). Thermal imaging of soybean response to drought stress: the effect of Ascophyllum nodosum seaweed extract. Eur. J. Plant Pathol. 5, 1–14. 10.1186/s40064-016-3019-2
123
Matese A. Baraldi R. Berton A. Cesaraccio C. Gennaro S. F. D. Duce P. (2018). Combination of proximal and remote sensing methods for mapping water stress conditions of grapevine. Acta Hortic. 1197, 69–76. 10.17660/ActaHortic.2018.1197.9
124
Mathanker S. K. Weckler P. R. Bowser T. J. (2013). X-ray applications in food and agriculture: a review. Trans. ASABE56, 1227–1239. 10.13031/trans.56.9785
125
Matsuhashi S. Fujimaki S. Kawachi N. Sakamoto K. Ishioka N. S. Kume T. (2010). Quantitative modeling of photoassimilate flow in an intact plant using the positron emitting tracer imaging system (PETIS). Soil Sci. Plant Func. 51, 417–423. 10.1111/j.1747-0765.2005.tb00047.x
126
Meacham-Hensold K. Montes C. M. Wu J. Guan K. Fu P. Ainsworth E. A. (2019). High-throughput field phenotyping using hyperspectral reflectance and partial least squares regression (PLSR) reveals genetic modifications to photosynthetic capacity. Remote Sens. Environ. 231:111176. 10.1016/j.rse.2019.04.029
127
Merzlyak M. N. Gitelson A. A. Chivkunova O. B. Rakitin V. Y. U. (1999). Non-destructive optical detection of pigment changes during leaf senescence and fruit ripening. Physiol. Plant.106, 135–141. 10.1034/j.1399-3054.1999.106119.x
128
Minchin P. E. H. Thorpe M. R. (2003). Using the short-lived isotope 11c in mechanistic studies of photosynthate transport. Func. Plant Biol. 30, 831–841. 10.1071/FP03008
129
Miraglia M. Marvin H. J. P. Kleter G. A. Battilani P. Coni E. Cubadda F. et al . (2009). Climate change and food safety: an emerging issue with special focus on Europe. Food Chem. Toxicol. 47, 1009–1021. 10.1016/j.fct.2009.02.005
130
Mishra P. Asaari M. S. M. Herrero-Langreo A. Lohumi S. Diezma B. Scheunders P. (2017). Close range hyperspectral imaging of plants: a review. Biosyst. Eng. 164, 49–67. 10.1016/j.biosystemseng.2017.09.009
131
Mishra P. Polder G. Vilfan N. (2020). Close range spectral imaging for disease detection in plants using autonomous platforms: a review on recent studies. Curr. Robot. Reports1, 43–48. 10.1007/s43154-020-00004-7
132
Moghimi A. Yang C. Miller M. E. Kianian S. F. Marchetto P. M. (2018). A novel approach to assess salt stress tolerance in wheat using hyperspectral imaging. Front. Plant Sci.9:1182. 10.3389/fpls.2018.01182
133
Mori S. Kiyomiya S. Nakanishi H. Ishioka N. S. Watanabe S. Osa A. et al . (2000). Visualization of 15o-water flow in tomato and rice in the light and dark using a positron-emitting tracer imaging system (PETIS). Soil Sci. Plant. Nutr. 46, 975–979. 10.1080/00380768.2000.10409163
134
Moura J. C. M. S. Bonine C. A. V. Viana J. D. O. F. Dornelas M. C. Mazzafera P. (2010). Abiotic and biotic stresses and changes in the lignin content and composition in plants. J. Integr. Plant Biol. 52, 360–376. 10.1111/j.1744-7909.2010.00892.x
135
Moustakas M. Baycu G. Gevrek N. Moustaka J. Csatari I. Rognes S. E. (2019). Spatiotemporal heterogeneity of photosystem II function during acclimation to zinc exposure and mineral nutrition changes in the hyperaccumulator Noccaea caerulescens. Environ. Sci. Pollut. Res. 26, 6613–6624. 10.1007/s11356-019-04126-0
136
Murchie E. Lawson T. (2013). Chlorophyll fluorescence analysis: a guide to good practice and understanding some new applications. J. Exp. Bot. 64, 3983–3998. 10.1093/jxb/ert208
137
Nagasubramanian K. Jones S. Sarkar S. Singh A. K. Singh A. Ganapathysubramanian B. (2018). Hyperspectral band selection using genetic algorithm and support vector machines for early identification of charcoal rot disease in soybean stems. Plant Methods14, 1–13. 10.1186/s13007-018-0349-9
138
Naidu R. A. Perry E. M. Pierce F. J. Mekuria T. (2009). The potential of spectral reflectance technique for the detection of grapevine leafroll-associated virus-3 in two red-berried wine grape cultivars. Comput. Electron. Agric. 66, 38–45. 10.1016/j.compag.2008.11.007
139
Nakanishi H. Kiyomiya S. Tsukamoto T. Tsukada H. Uchida H. Mori S. (2002). Water (H2 15O) flow in rice is regulated by the concentration of nutrients as monitored by positron multi-probe system (PMPS). Soil Sci. Plant Nutr. 5, 759–762. 10.1080/00380768.2002.10409267
140
Narvankar D. S. Singh C. B. Jayas D. S. White N. D. G. (2009). Assessment of soft x-ray imaging for detection of fungal infection in wheat. Biosyst. Eng. 103, 49–56. 10.1016/j.biosystemseng.2009.01.016
141
Nie P. Cai C. Qu F. Lin L. Dong T. He Y. (2019). Study of 2,4-d spectral characteristics and its detection in Zizania latifolia using terahertz time-domain spectroscopy. Appl. Sci. 9:2248. 10.3390/app9112248
142
Nie P. Qu F. Lin L. Dong T. He Y. Shao Y. (2017). Detection of water content in rapeseed leaves using terahertz spectroscopy. Sensors17:2830. 10.3390/s17122830
143
Ninkovic V. Rensing M. Dahlin I. Markovic D. (2019). Who is my neighbor? Volatile cues in plant interactions. Plant Signal. Behav. 14:1634993. 10.1080/15592324.2019.1634993
144
Obata T. Fernie A. R. (2012). The use of metabolomics to dissect plant responses to abiotic stresses. Cell. Mol. Life Sci. 69, 3225–3243. 10.1007/s00018-012-1091-5
145
Ohtake N. Sato T. Fujikake H. (2001). Rapid transport to pods and seeds in n-deficient soybean plants. J. Exp. Bot. 52, 277–283. 10.1093/jexbot/52.355.277
146
Ohya T. Tanoi K. Hamada Y. Okabe H. Rai H. Hojo J. et al . (2008). An analysis of long-distance water transport in the soybean stem using . Plant Cell Physiol. 49, 718–729. 10.1093/pcp/pcn047
147
Ortiz J. C. M. Carvajal L. M. H. Fernandez V. B. (2019). Detection of significant wavelengths for identifying and classifying Fusarium oxysporum during the incubation period and water stress in Solanum lycopersicum plants using reflectance spectroscopy. J. Plant Prot. Res. 59, 244–254. 10.24425/jppr.2019.129290
148
Pabuayon I. M. Yamamoto N. Trinidad J. L. Longkumer T. Raorane M. L. Kohli A. (2016). Reference genes for accurate gene expression analyses across different tissues, developmental stages and genotypes in rice for drought tolerance. Rice9:32. 10.1186/s12284-016-0104-7
149
Pandey P. Ramegowda V. Senthil-Kumar M. (2015). Shared and unique responses of plants to multiple individual stresses and stress combinations: physiological and molecular mechanisms. Front. Plant Sci. 6:723. 10.3389/fpls.2015.00723
150
Pandian S. Rakkammal K. Sagina Rency A. Muthuramalingam P. Karutha Pandian S. Ramesh M. (2020). Abiotic stress and applications of omics approaches to develop stress tolerance in agronomic crops, in Agronomic Crops: Volume 3: Stress Responses and Tolerance, ed HasanuzzamanM. (Singapore: Springer), 557–578. 10.1007/978-981-15-0025-1_26
151
Parihar P. Singh S. Singh R. Rajasheker G. Srivastava P. R. R. K. (2019). An Integrated Transcriptomic, Proteomic, and Metabolomic Approach to Unravel the Molecular Mechanisms of Metal Stress Tolerance in Plants. Cham: Springer International Publishing. 10.1007/978-3-030-20732-8_1
152
Parker D. Beckmann M. Zubair H. Enot D. P. Caracuel-Rios Z. Overy D. P. (2009). Metabolomic analysis reveals a common pattern of metabolic re-programming during invasion of three host plant species by Magnaporthe grisea. Plant J. 59, 723–737. 10.1111/j.1365-313X.2009.03912.x
153
Paupiére M. J. (2017). Identification of metabolites involved in heat stress response in different tomato genotypes (Ph.D. thesis). Wageningen University, Wageningen, Netherlands.
154
Peñuelas J. Filella I. Gamon J. A. (1995a). Assessment of photosynthetic radiation-use efficiency with spectral reflectance. New Phytol.131, 291–296. 10.1111/j.1469-8137.1995.tb03064.x
155
Peñuelas J. Frederic B. Filella I. (1995b). Semi-empirical indices to assess carotenoids/chlorophyll-a ratio from leaf spectral reflectance. Photosynthetica31, 221–230.
156
Pérez-Bueno M. L. Pineda M. Cabeza F. M. Barón M. (2016). Multicolor fluorescence imaging as a candidate for disease detection in plant phenotyping. Front. Plant Sci. 7:1790. 10.3389/fpls.2016.01790
157
Pérez-Roncal C. López-Maestresalas A. Lopez-Molina C. Jarén C. Urrestarazu J. Santesteban L. G. et al . (2020). Hyperspectral imaging to assess the presence of powdery mildew (Erysiphe necator) in cv. Carignan Noir Grapevine Bunches. Agron. 10:88. 10.3390/agronomy10010088
158
Piasecka A. Kachlicki P. Stobiecki M. (2019). Analytical methods for detection of plant metabolomes changes in response to biotic and abiotic stresses. Int. J. Mol. Sci. 20:379. 10.3390/ijms20020379
159
Pineda M. Perez-Bueno M. L. Paredes V. Baron M. (2017). Use of multicolour fluorescence imaging for diagnosis of bacterial and fungal infection on zucchini by implementing machine learning. Funct. Plant Biol. 44, 563–572. 10.1071/FP16164
160
Pisante M. Stagnari F. Grant C. A. (2012). Agricultural innovations for sustainable crop production intensification. Ital. J. Agron. 7:40. 10.4081/ija.2012.e40
161
Poirier-Pocovi M. Volder A. Bailey B. N. (2020). Modeling of reference temperatures for calculating crop water stress indices from infrared thermography. Agric. Water Manage. 233:106070. 10.1016/j.agwat.2020.106070
162
Prasad B. Carver B. F. Stone M. L. Babar M. A. Raun W. R. Klatt A. R. (2007). Genetic analysis of indirect selection for winter wheat grain yield using spectral reflectance indices. Crop Sci.47, 1416–1425. 10.2135/cropsci2006.08.0546
163
Prosekov A. Y. Ivanova S. A. (2018). Food security: the challenge of the present. Geoforum91, 73–77. 10.1016/j.geoforum.2018.02.030
164
Qin B. Li Z. Hu F. Hu C. Chen T. Zhang H. (2018). Highly sensitive detection of carbendazim by using terahertz time-domain spectroscopy combined with metamaterial. IEEE Trans. Terahertz Sci. Technol. 8, 149–154. 10.1109/TTHZ.2017.2787458
165
Qu F. Nie P. Lin L. Cai C. He Y. (2018a). Review of theoretical methods and research aspects for detecting leaf water content using terahertz spectroscopy and imaging. Int. J. Agric. Biol. Eng. 11, 27–34. 10.25165/j.ijabe.20181105.3952
166
Qu M. Chen G. Bunce J. A. Zhu X. Sicher R. C. (2018b). Systematic biology analysis on photosynthetic carbon metabolism of maize leaf following sudden heat shock under elevated CO2. Sci. Rep. 8, 1–11. 10.1038/s41598-018-26283-x
167
Qu W. Robert C. Erb M. Hibbard B. Paven M. Glaede T. et al . (2016). Dynamic precision phenotyping reveals mechanism of crop tolerance to root herbivory. Plant Physiol. 172, 776–788. 10.1104/pp.16.00735
168
Quebrajo L. Perez-Ruiz M. Perez-Urrestarazu L. Martinez G. Egea G. (2018). Linking thermal imaging and soil remote sensing to enhance irrigation management of sugar beet. Biosyst. Eng. 165, 77–87. 10.1016/j.biosystemseng.2017.08.013
169
Ranulfi A. C. Cardinali M. C. B. Kubota T. M. K. Freitas-Astua J. Ferreira E. J. Bellete B. S. et al . (2016). Laser-induced fluorescence spectroscopy applied to early diagnosis of citrus Huanglongbing. Biosyst. Eng. 144, 133–144. 10.1016/j.biosystemseng.2016.02.010
170
Rastogi S. Shah S. Kumar R. Vashisth D. Akhtar M. Q. Kumar A. (2019). Ocimum metabolomics in response to abiotic stresses: cold, flood, drought and salinity. PLoS ONE14:e0210903. 10.1371/journal.pone.0210903
171
Ray S. S. Singh J. P. Panigrahy S. (2010). Use of hyperstectral remote sensing data for crop stress detection: ground-based studies. Int. Arch. Photogramm. Remote Sens. Spat. Inf. Sci. 38, 562–570.
172
Read J. J. Tarpley L. McKinion J. M. Reddy K. R. (2002). Narrow-waveband reflectance ratios for remote estimation of nitrogen status in cotton. J. Environ. Qual.31, 1442–1452. 10.2134/jeq2002.1442
173
Roessner U. Luedemann A. Brust B. Fiehn O. Linke T. Willmitzer L. (2001). Metabolic profiling allows comprehensive phenotyping of genetically or environmentally modified plant systems. Plant Cell13, 11–29. 10.1105/tpc.13.1.11
174
Rogachev I. Aharoni A. (2012). UPLC-MS-Based Metabolite Analysis in Tomato. Totowa, NJ: Humana Press. 10.1007/978-1-61779-594-7_9
175
Roopaei M. Rad P. Choo K. R. (2017). Cloud of things in smart agriculture: Intelligent irrigation monitoring by thermal imaging. IEEE Cloud Comput. 4, 10–15. 10.1109/MCC.2017.5
176
Rouse J. W. Haas R. H. Schell J. A. (1974). Monitoring vegetation systems in the Great Plains with ERTS. NASA Spec. Publ.351:309.
177
Rustioni L. (2017). Oxidized polymeric phenolics: could they be considered photoprotectors?J. Agric. Food Chem. 65, 7843–7846. 10.1021/acs.jafc.7b03704
178
Rustioni L. Cola G. VanderWeide J. Murad P. Failla O. Sabbatini O. (2018). Utilization of a freeze-thaw treatment to enhance phenolic ripening and tannin oxidation of grape seeds in red (Vitis vinifera L.) cultivars. Food Chem. 259, 139–146. 10.1016/j.foodchem.2018.03.120
179
Sagan V. Maimaitijiang M. Sidike P. Maimaitiyiming M. Erkbol H. Hartling S. (2019). UAV/satellite multiscale data fusion for crop monitoring and early stress detection. Int. Arch. Photogramm. Remote Sens. Spat. Inf. Sci. 42, 715–722. 10.5194/isprs-archives-XLII-2-W13-715-2019
180
Sankaran S. Mishra A. Ehsani R. Davis C. (2010). A review of advanced techniques for detecting plant diseases. Comput. Electron. Agric. 72, 1–13. 10.1016/j.compag.2010.02.007
181
Santesteban L. Di Gennaro S. Herrero-Langreo A. Miranda C. Royo J. Matese A. (2017). High-resolution uav-based thermal imaging to estimate the instantaneous and seasonal variability of plant water status within a vineyard. Agric. Water Manage. 183, 49–59. 10.1016/j.agwat.2016.08.026
182
Schlaeppi K. Abou-Mansour E. Buchala A. Mauch F. (2010). Disease resistance of Arabidopsis to Phytophthora brassicae is established by the sequential action of indole glucosinolates and camalexin. Plant J. 62, 840–851. 10.1111/j.1365-313X.2010.04197.x
183
Schmidt M. P. Mamet S. D. Ferrieri R. A. Peak D. Siciliano S. D. (2020). From the outside in: an overview of positron imaging of plant and soil processes. Mol. Imaging19, 1–31. 10.1177/1536012120966405
184
Seelig H.-D. Hoehn A. Stodieck L. S. Klaus D. M. Adams W. W. Emery W. J. (2008). Relations of remote sensing leaf water indices to leaf water thickness in cowpea, bean, and sugarbeet plants. Remote Sens. Environ.112, 445–455. 10.1016/j.rse.2007.05.002
185
Shakoor N. Lee S. Mockler T. C. (2017). High throughput phenotyping to accelerate crop breeding and monitoring of diseases in the field. Curr. Opin. Plant Biol. 38, 184–192. 10.1016/j.pbi.2017.05.006
186
Siddiqui Z. S. Umar M. Kwon T.-R. Park S. C. (2019). Phenotyping Through Infrared Thermography in Stress Environment. Cham: Springer International Publishing. 10.1007/978-3-030-04417-6_15
187
Song Z. Yan S. Zang Z. Fu Y. Wei D. Cui H. L. et al . (2018). Temporal and spatial variability of water status in plant leaves by terahertz imaging. IEEE Trans. Terahertz Sci. Technol. 8, 520–527. 10.1109/TTHZ.2018.2851922
188
Sorin C. Mariette F. Musse M. Leport L. Cruz F. Yvin J. C. (2018). Leaf development monitoring and early detection of water deficiency by low field nuclear magnetic resonance relaxation in Nicotiana tabacum plants. Appl. Sci. 8:943. 10.3390/app8060943
189
Stagnari F. Galieni A. Pisante M. (2016). Drought stress effects on crop quality, in Water Stress and Crop Plants: A Sustainable Approach, ed ParvaizA. (Chichester: John Wiley & Sons, Ltd.), 375–392. 10.1002/9781119054450.ch23
190
Stagnari F. Galieni A. Speca S. Cafiero G. Pisante M. (2014). Effect of light and water supply on morphological and physiological leaf traits of red beet. Agron. J. 106, 459–468. 10.2134/agronj2013.0293
191
Stellacci A. M. Castrignana A. Troccoli A. Basso B. Buttafuoco G. (2016). Selecting optimal hyperspectral bands to discriminate nitrogen status in durum wheat: a comparison of statistical approaches. Environ. Monit. Assess. 188, 1–15. 10.1007/s10661-016-5171-0
192
Still C. Powell R. Aubrecht D. Kim Y. Helliker B. Roberts D. (2019). Thermal imaging in plant and ecosystem ecology: applications and challenges. Ecosphere10:e02768. 10.1002/ecs2.2768
193
Sun D. Zhu Y. Xu H. He Y. Cen H. (2019). Time-series chlorophyll fluorescence imaging reveals dynamic photosynthetic fingerprints of SOS mutants to drought stress. Sensors19:2649. 10.3390/s19122649
194
Sun X. Zhang J. Zhang H. Ni Y. Zhang Q. Chen J. (2010). The responses of Arabidopsis thaliana to cadmium exposure explored via metabolite profiling. Chemosphere78, 840–845. 10.1016/j.chemosphere.2009.11.045
195
Susič N. Žibrat U. Širca S. Strajnar P. Razinger J. Knapič M. et al . (2018). Discrimination between abiotic and biotic drought stress in tomatoes using hyperspectral imaging. Sens. Actua. B Chem.273, 842–852. 10.1016/j.snb.2018.06.121
196
Suzuki N. Mittler R. (2006). Reactive oxygen species and temperature stresses: a delicate balance between signaling and destruction. Physiol. Plant. 126, 45–51. 10.1111/j.0031-9317.2005.00582.x
197
Sylvain T. Cecile L.-G. (2018). Chapter 8: Disease identification: a review of vibrational spectroscopy applications, in Vibrational Spectroscopy for Plant Varieties and Cultivars Characterization Comprehensive Analytical Chemistry, eds LopesJ.SousaC. (Amsterdam: Elsevier), 195–225. 10.1016/bs.coac.2018.03.005
198
Tang X. Zhang N. Si H. Calderon-Urrea A. (2017). Selection and validation of reference genes for rt-qpcr analysis in potato under abiotic stress. Plant Methods13, 1–8. 10.1186/s13007-017-0238-7
199
Thomas S. Behmann J. Steier A. Kraska T. Muller O. Rascher U. (2018). Quantitative assessment of disease severity and rating of barley cultivars based on hyperspectral imaging in a non-invasive, automated phenotyping platform. Plant Methods14, 1–12. 10.1186/s13007-018-0313-8
200
Thomas S. Wahabzada M. Rascher M. T. K. U. Mahlein A. K. (2017). Observation of plant-pathogen interaction by simultaneous hyperspectral imaging reflection and transmission measurements. Funct. Plant Biol. 44, 23–34. 10.1071/FP16127
201
Thomason K. Babar M. A. Erickson J. E. Mulvaney M. Beecher C. MacDonald G. (2018). Comparative physiological and metabolomics analysis of wheat (triticum aestivum L.) following post-anthesis heat stress. PLoS ONE13:e0197919. 10.1371/journal.pone.0197919
202
Van De Vijver R. Mertens K. Heungens K. Somers B. Nuyttens D. Borra-Serrano I. et al . (2020). In-field detection of Alternaria solani in potato crops using hyperspectral imaging. Comput. Electron. Agric.168:105106. 10.1016/j.compag.2019.105106
203
Vialet-Chabrand S. Lawson T. (2019). Dynamic leaf energy balance: deriving stomatal conductance from thermal imaging in a dynamic environment. J. Exp. Bot. 70, 2839–2855. 10.1093/jxb/erz068
204
Vidal D. Pitarma R. (2019). Infrared thermography applied to tree health assessment: a review. Agriculture9:156. 10.3390/agriculture9070156
205
Visioli G. Galieni A. Stagnari F. Bonas U. Speca S. Faccini A. (2016). Proteomics of durum wheat grain during transition to conservation agriculture. PLoS ONE11:e0156007. 10.1371/journal.pone.0156007
206
Vives-Peris V. M. F. Lopez-Climent M. F. Perez-Clemente R. M. Gomez-Cadenas A. (2020). Root involvement in plant responses to adverse environmental conditions. Agronomy10:7. 10.3390/agronomy10070942
207
Wang C. Qin J. Y. Xu W. D. Chen M. Xie L. J. Ying Y. B. (2018a). Terahertz imaging applications in agriculture and food engineering: a review. Trans. ASABE61, 411–424. 10.13031/trans.12201
208
Wang D. Vinson R. Holmes M. Seibel G. Bechar A. Nof S. et al . (2019d). Early detection of tomato spotted wilt virus by hyperspectral imaging and outlier removal auxiliary classifier generative adversarial nets (OR-AC-GAN). Sci. Rep.9, 1–14. 10.1038/s41598-019-40066-y
209
Wang H. Qian X. Zhang L. Xu S. Li H. Xia X. (2018b). A method of high throughput monitoring crop physiology using chlorophyll fluorescence and multispectral imaging. Front. Plant Sci. 9:407. 10.3389/fpls.2018.00407
210
Wang J. Lv J. Liu Z. Liu Y. Ma J. S. Y. (2019a). Integration of transcriptomics and metabolomics for pepper (Capsicum annuum L.) in response to heat stress. Int. J. Mol. Sci. 20:5042. 10.3390/ijms20205042
211
Wang Q. Mathews A. J. Li K. Wen J. Komarov S. O'Sullivan J. A. et al . (2014). A dedicated high-resolution pet imager for plant sciences. Phys. Med. Biol. 59, 5613–5629. 10.1088/0031-9155/59/19/5613
212
Wang X. Guo R. Li M. Liu Y. Zhao M. Fu H. (2019b). Metabolomics reveals the drought-tolerance mechanism in wild soybean (Glycine soja). Acta Physiol. Plant. 41, 1–11. 10.1007/s11738-019-2939-1
213
Wang X. Hou L. Lu Y. Wu B. Gong X. Liu M. et al . (2018c). Metabolic adaptation of wheat grain contributes to a stable filling rate under heat stress. J. Exp. Bot. 69, 5531–5545. 10.1093/jxb/ery303
214
Wang Y.-J. Li T.-H. Jin G. Wei Y.-M. Li L.-Q. Kalkhajeh Y. K. et al . (2020). Qualitative and quantitative diagnosis of nitrogen nutrition of tea plants under field condition using hyperspectral imaging coupled with chemometrics. J. Sci. Food Agric.100, 161–167. 10.1002/jsfa.10009
215
Wang Z. Z. J. Cui H. L. Yan S. (2019c). Terahertz spectral imaging based quantitative determination of spatial distribution of plant leaf constituents. Plant Methods15, 1–11. 10.1186/s13007-019-0492-y
216
Weber J. F. Kunz C. Peteinatos G. G. Santel H. J. Gerhards R. (2017). Utilization of chlorophyll fluorescence imaging technology to detect plant injury by herbicides in sugar beet and soybean. Weed Technol. 31, 523–535. 10.1017/wet.2017.22
217
Wu C. Liu M. Liu X. Wang T. Wang L. (2019). Developing a new spectral index for detecting cadmium-induced stress in rice on a regional scale. Int. J. Environ. Res. Public Health16:4811. 10.3390/ijerph16234811
218
Xue J. Su B. (2017). Significant remote sensing vegetation indices: a review of developments and applications. J. Sens. 2017, 1–17. 10.1155/2017/1353691
219
Yang J. Du L. Shi S. Gong W. Sun J. Chen B. (2019). Potential of fluorescence index derived from the slope characteristics of laser-induced chlorophyll fluorescence spectrum for rice leaf nitrogen concentration estimation. Appl. Sci. 9:916. 10.3390/app9050916
220
Yao J. Sun D. Cen H. Xu H. Weng H. Yuan F. (2018). Phenotyping of Arabidopsis drought stress response using kinetic chlorophyll fluorescence and multicolor fluorescence imaging. Front. Plant Sci. 9:603. 10.3389/fpls.2018.00603
221
Yao Z. Lei Y. He D. (2019). Early visual detection of wheat stripe rust using visible/near-infrared hyperspectral imaging. Sensors19:952. 10.3390/s19040952
222
Ye X. Abe S. Zhang S. (2020). Estimation and mapping of nitrogen content in apple trees at leaf and canopy levels using hyperspectral imaging. Precis. Agric.21, 198–225. 10.1007/s11119-019-09661-x
223
Yoshino K. Numajiri Y. Teramoto S. Kawachi N. Tanabata T. Tanaka T. et al . (2019). owards a deeper integrated multi-omics approach in the root system to develop climate-resilient rice. Mol. Breed. 39:165. 10.1007/s11032-019-1058-4
224
Yu K. Anderegg J. Mikaberidze A. Karisto P. Mascher F. McDonald B. A. et al . (2018). Hyperspectral canopy sensing of wheat septoria tritici blotch disease. Front. Plant Sci.9:1195. 10.3389/fpls.2018.01195
225
Zahid A. T. Abbas H. Imran M. A. Qaraqe K. A. Alomainy A. Cumming D. R. S. (2019). Characterization and water content estimation method of living plant leaves using terahertz waves. Appl. Sci. 9:2781. 10.3390/app9142781
226
Zarco-Tejada P. J. Berjón A. López-Lozano R. Miller J. R. Martín P. Cachorro V. et al . (2005). Assessing vineyard condition with hyperspectral indices: Leaf and canopy reflectance simulation in a row-structured discontinuous canopy. Remote Sens. Environ.99, 271–287. 10.1016/j.rse.2005.09.002
227
Zarco-Tejada P. J. Miller J. R. Noland T. L. Mohammed G. H. Sampson P. H. (2001). Scaling-up and model inversion methods with narrowband optical indices for chlorophyll content estimation in closed forest canopies with hyperspectral data. IEEE Trans. Geosci. Remote Sens.39, 1491–1507. 10.1109/36.934080
228
Zarco-Tejada P. J. Pushnik J. C. Dobrowski S. Ustin S. L. (2003). Steady-state chlorophyll a fluorescence detection from canopy derivative reflectance and double-peak red-edge effects. Remote Sens. Environ.84, 283–294. 10.1016/S0034-4257(02)00113-X
229
Zhang C. Ren H. Dai X. Qin Q. Li J. Zhang T. et al . (2019). Spectral characteristics of copper-stressed vegetation leaves and further understanding of the copper stress vegetation index. Int. J. Remote Sens.40, 4473–4488. 10.1080/01431161.2018.1563842
230
Zhang C. Ren H. Qin Q. Ersoy O. K. (2017). A new narrow band vegetation index for characterizing the degree of vegetation stress due to copper: the copper stress vegetation index (CSVI). Remote Sens. Lett.8, 576–585. 10.1080/2150704X.2017.1306135
231
Zhang J. Huang Y. Pu R. Gonzalez-Moreno P. Yuan L. Wu K. (2019a). Monitoring plant diseases and pests through remote sensing technology: a review. Comput. Electron. Agric. 165:104943. 10.1016/j.compag.2019.104943
232
Zhang J. Huang Y. Reddy K. N. Wang B. (2019b). Assessing crop damage from dicamba on non-dicamba-tolerant soybean by hyperspectral imaging through machine learning. Pest Manag. Sci.75, 3260–3272. 10.1002/ps.5448
233
Zhang K. Cui H. Cao S. Yan L. Li M. Sun Y. (2019). Overexpression of CrCOMT from Carex rigescens increases salt stress and modulates melatonin synthesis in Arabidopsis thaliana. Plant Cell Rep. 38, 1501–1514. 10.1007/s00299-019-02461-7
234
Zhang Z. Liu M. Liu X. Zhou G. (2018). A new vegetation index based on multitemporal Sentinel-2 images for discriminating heavy metal stress levels in rice. Sensors18:2172. 10.3390/s18072172
235
Zhao D. Reddy K. R. Kakani V. G. Read J. J. Koti S. (2005). Selection of optimum reflectance ratios for estimating leaf nitrogen and chlorophyll concentrations of field-grown cotton. Agron. J.97, 89–98. 10.2134/agronj2005.0089
236
Zhao Y. Zhou M. Xu K. Li J. Li S. Zhang S. (2019). Integrated transcriptomics and metabolomics analyses provide insights into cold stress response in wheat. Crop J. 7, 857–866. 10.1016/j.cj.2019.09.002
237
Zheng H. Cheng T. Li D. Yao X. Tian Y. Cao W. (2018). Combining unmanned aerial vehicle (UAV)-based multispectral imagery and ground-based hyperspectral data for plant nitrogen concentration estimation in rice. Front. Plant Sci. 9:936. 10.3389/fpls.2018.00936
238
Zhou R.-Q. Jin J.-J. Li Q.-M. Su Z.-Z. Yu X.-J. Tang Y. et al . (2019). Early detection of magnaporthe oryzae-infected barley leaves and lesion visualization based on hyperspectral imaging. Front. Plant Sci.9:1962. 10.3389/fpls.2018.01962
239
Zhou X. Sun J. Tian Y. Lu B. Hang Y. Chen Q. (2020). Development of deep learning method for lead content prediction of lettuce leaf using hyperspectral images. Int. J. Remote Sens.41, 2263–2276. 10.1080/01431161.2019.1685721
240
Zovko M. Žibrat U. Knapič M. Kovačić M. B. Romić D. (2019). Hyperspectral remote sensing of grapevine drought stress. Precis. Agric.20, 335–347. 10.1007/s11119-019-09640-2
Summary
Keywords
plant stress, plant imaging, plant positron emission tomography, metabolomics, spectroscopy, thermal imaging, fluorescence imaging, remote sensing
Citation
Galieni A, D'Ascenzo N, Stagnari F, Pagnani G, Xie Q and Pisante M (2021) Past and Future of Plant Stress Detection: An Overview From Remote Sensing to Positron Emission Tomography. Front. Plant Sci. 11:609155. doi: 10.3389/fpls.2020.609155
Received
22 September 2020
Accepted
18 November 2020
Published
27 January 2021
Volume
11 - 2020
Edited by
Shawn Carlisle Kefauver, University of Barcelona, Spain
Reviewed by
Shabir Hussain Wani, Sher-e-Kashmir University of Agricultural Sciences and Technology, India; Christos Kissoudis, Wageningen University and Research, Netherlands
Updates
Copyright
© 2021 Galieni, D'Ascenzo, Stagnari, Pagnani, Xie and Pisante.
This is an open-access article distributed under the terms of the Creative Commons Attribution License (CC BY). The use, distribution or reproduction in other forums is permitted, provided the original author(s) and the copyright owner(s) are credited and that the original publication in this journal is cited, in accordance with accepted academic practice. No use, distribution or reproduction is permitted which does not comply with these terms.
*Correspondence: Nicola D'Ascenzo ndasc@hust.edu.cnFabio Stagnari fstagnari@unite.itQingguo Xie qgxie@hust.edu.cn
This article was submitted to Technical Advances in Plant Science, a section of the journal Frontiers in Plant Science
Disclaimer
All claims expressed in this article are solely those of the authors and do not necessarily represent those of their affiliated organizations, or those of the publisher, the editors and the reviewers. Any product that may be evaluated in this article or claim that may be made by its manufacturer is not guaranteed or endorsed by the publisher.